 Alno Carstens
 Lee D. Bryant
 Marelize Botes
 Gideon M. Wolfaardt
- 1Department of Microbiology, Stellenbosch University, Stellenbosch, South Africa
- 2Department of Architecture and Civil Engineering, University of Bath, Bath, United Kingdom
- 3Department of Chemistry and Biology, Ryerson University, Toronto, ON, Canada
Water from the Blyderiver dam in the Mpumalanga province, South Africa is used for gravity-fed irrigation. Biofilm development in the pipelines causes an increase in pipeline surface roughness, reduced hydraulic capacity, and water delivery below design capacity. The role of manganese (Mn) concentration on biofilm development is of interest, since the water is currently extracted at depth near the bottom of the reservoir (45–50 m when full) where high Mn levels were measured during four sampling events over 2 years. In the water body, dissolved oxygen (DO) and Mn concentrations showed a strong, inverse correlation, with rapid decrease in DO at increased depth, mirrored by an increase in total and soluble Mn. The depth of this inflection point correlated with the reservoir's water level. DO concentrations typically remained constant between 8 and 9 mg l−1 in the upper regions of the water column, followed by a rapid decline to lower than 2 mg l−1 at deeper zones. Similarly, Mn concentrations remained constant with increasing depth, ranging between 10 and 100 μg l−1, followed by a rapid increase once the depth is reached where DO levels started to decline, to 8,631 μg l−1 near the bottom. In the main, 1.5 m diameter pipeline, Mn concentrations decreased with distance; from 8,631 μg l−1 at the extraction point to 134 μg l−1 at 23 km downstream in the bulk aqueous phase, while in the biofilm biomass, Mn concentrations decreased from 30105.4 mg kg−1 at 4.5 km to 23501.9 mg kg−1 at 12.5 km, and 13727.7 mg kg−1 at 28.4 km downstream. This decrease in Mn concentration with distance suggests that biofilm accumulation has not yet reached a steady state. The aesthetic and operational problems caused by manganese in drinking water systems is well-documented, with biological removal gaining increasing interest as alternative to physical and chemical removal strategies. This study showed that the microbial processes that are being harnessed in drinking water treatment, i.e., Mn accumulation through biofilm formation supported by Mn cycling in sand filters, may have undesirable consequences in bulk water distribution systems by causing notable reduction in flow.
Introduction
The Blyderiver dam, located in Mpumalanga, South Africa, is a major source of water used for irrigation of a variety of agricultural produce. The dam with a capacity of ~54 million cubic meters is fed primarily by two rivers, the Orighstad river and the Blyderiver, with some minor contribution from the Treur river. Water from this dam is supplied under gravity to farms in the Mpumalanga and Limpopo provinces via the Lower Blyde Irrigation System (LBIS). The pipe network varies in diameter from 1,500 to 250 mm and extracts water from the bottom of the reservoir at ~45–50 m when the dam is at 100% capacity. Constructed between 1998 and 2003, the LBIS was originally developed to optimize the limited water resources, including eliminating leakages and evaporation from the original canal system, reducing energy consumption for pumping by providing water under pressure, and improved management of water allocations.
A gradual loss in hydraulic capacity over 10 years initiated a field investigation to assess the hydraulic characteristics of the system (van Vuuren and van Dijk, 2012). Pressure recordings and flow measurements between chainage 242 and 6,300 m calculated to an increase in surface roughness from 0.5 to 1.76 mm (12%). The main contributor to these changes was identified as biofilm accumulation in the pipe network (White, 1999; van Vuuren and van Dijk, 2012). This has serious implications for the local economy and agricultural output, as a notable share of the country's mangoes, citrus, papaya and avocadoes are produced on the ~7,000 hectares of land being irrigated.
A previous study has identified oxisols with Mn content of up to 17% in the Graskop region of the dam's catchment, and attributed substantial Mn release into the rivers during natural wet-dry cycles of topsoil (Dowding, 2004). This Mn renders the use of biocides such as H2O2 and O3 impractical as Mn acts as a catalyst for the decomposition of H2O2 to water and oxygen (Petrucci et al., 2007), while O3 would contribute to Mn oxidation inside the pipeline, potentially worsening the problem (White, 1999; Tachikawa et al., 2009). Indeed, biofilms could not be effectively removed using these biocides at dosages that would be cost effective during independent on-site pilot studies. For example, a field experiment that involved a 50 mg l−1 H2O2 treatment (flow rate in the main 1.5 m diameter pipeline had to be lowered from ~2000 l s−1 to below 500 l s−1 to achieve this) did not result in noticeable biofilm detachment, and only had a marginal reduction in friction loss in a 6,000 m-long test section (Internal reports, unpublished results).
Since it is known that high levels of Mn in water support the growth of Mn oxidizing and reducing microorganisms (Tebo et al., 2005), this became the focus as a potential cause of increased biofilm formation in the pipeline. The occurrence of Mn as a nuisance contaminant in water distribution systems is not uncommon and globally this problem has been reported (Gantzer et al., 2009; Cerrato et al., 2010; Bryant et al., 2011). Mn can occur in different forms in nature but due to its complex redox kinetics, it is difficult to chemically oxidize in environments with pH levels of 6–8 typically observed in natural waters. In conventional water treatment plants, Mn is removed through oxidation by the addition of oxidants such as chlorine dioxide or potassium permanganate (Gantzer et al., 2009; Bryant et al., 2011). However, Mn can also be oxidized by Mn oxidizing microorganisms, typically converting manganous (Mn2+) to a Mn3+ intermediate before final conversion to Mn4+ as it occurs in Mn dioxide (MnO2) through the process of biological oxidation (Webb et al., 2005), which is applied in biofiltration systems for Mn removal (Du Toit et al., 2015). This process typically occurs in environments with high DO concentrations, while biological reduction from MnO2 to Mn2+ typically occurs in environments with low DO concentrations.
Gantzer et al. (2009) indicated that high total Mn concentrations persist in the hypoxic hypolimnion of a reservoir in Carvins Cove, West Virginia, USA, especially during summer stratification when DO concentrations often decrease to hypoxic levels in the deeper zones. Considering the high Mn content in the Blyde river catchment soils, and measured high Mn content in thick black biofilms collected from pipes connected to the LBIS pipeline (Figure 1), we hypothesized that an improved knowledge of the dam's geochemistry may provide cues to be considered when devising strategies to mitigate the biofilm build-up in the irrigation pipeline. Understanding the geochemistry of the dam may thus indicate whether a possible strategy to be considered is to move the extraction point of LBIS from its current extraction depth to a point higher up in the water column where lower Mn and higher DO concentrations may be present. The objectives were therefore to (i) investigate the relationship between DO and Mn concentration with depth in the water column, with specific focus on the depth of extraction, and (ii) determine Mn concentrations in both aqueous phase and biofilms with distance in the pipeline.
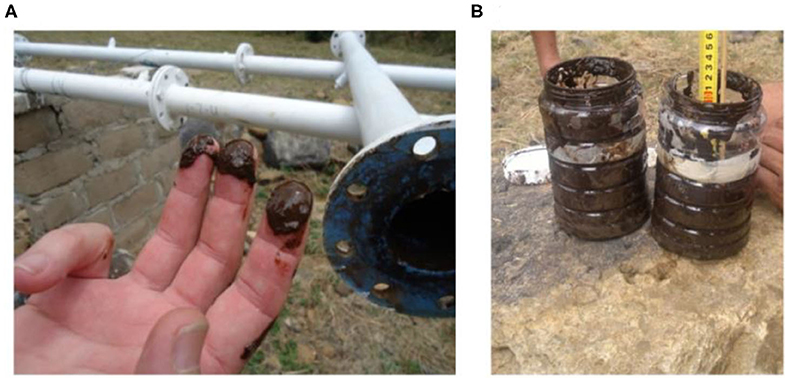
Figure 1. Examples of biofilm removed from an experimental bypass, 4.5 km downstream from the dam wall showing (A), the dark brown color indicative of Mn and Fe, and (B) the amount of biofilm removed from a 2,000 mm long, 81.9 mm inner diameter pipe section.
Materials and Methods
Sampling Sites
The Blyderiver dam is in the Mpumalanga province in South Africa, (24°32′59″S 30°48′22″E) with a depth of ~50 m when 100% full. Water samples were collected at different sites as indicated in Figure 2. Additionally, samples were collected from the LBIS pipeline at various points downstream from the dam wall extraction point along the three pipeline routes stretching into the Limpopo province up to a distance of 31.7 km (Supplement A).
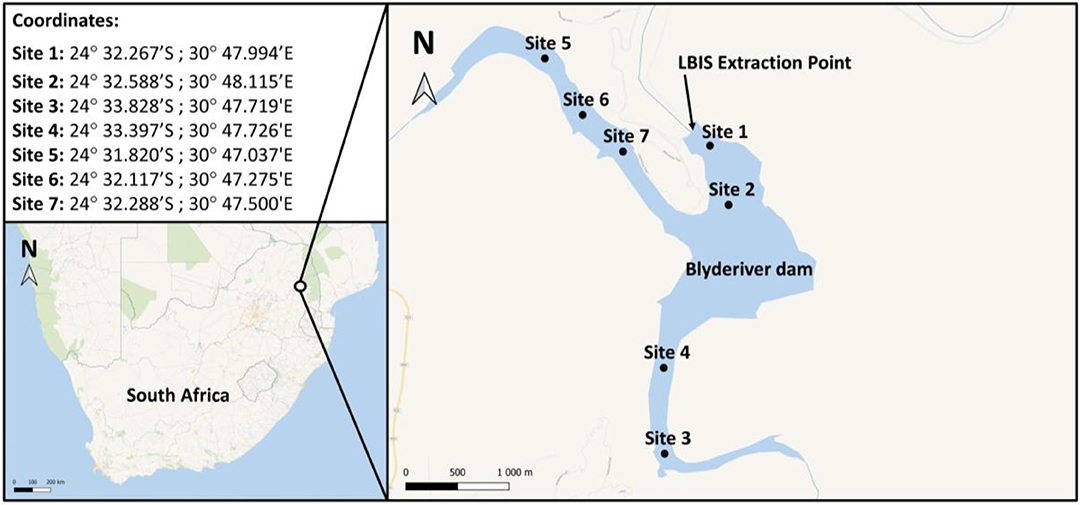
Figure 2. Map and GPS coordinates indicating sampling sites on the Blyderiver dam. Water samples were collected at 1–2 m depth intervals. Site 1 is nearest to the wall and extraction point; sites 3 and 5 are the sampling points closest to the influences of the Blyde and Orighstad rivers, respectively.
Sampling Procedure
Four sampling events were undertaken over 2 years from October 2015 to February 2017 during different seasons (Summary Table in Supplement B) (Carstens, 2018). Water samples were collected using a custom-made water sampler, comparable to a Niskin sampler, at two-meter increments over the full depth profile of all sampling sites indicated in Figure 2, except sites 3 and 6. The dam's levels varied between 40 and 80% in 2015 and 2016 and 100% full in 2017. The samples were separated into filtered and unfiltered aliquots and acidified with 65% nitric acid (AnalaR NORMAPUR® analytical reagent—VWR Chemicals). Water samples were filtered through 0.22 μm syringe filters to determine soluble Mn concentrations. Both filtered and unfiltered samples were transported on ice and submitted for ICP-MS analysis at the Central Analytical Facility (CAF) at Stellenbosch University to measure soluble and total Mn concentrations, respectively. Although the presence of iron (Fe) was not the focus of this study, its concentration was measured during all sampling events and included in all data sets as it is suspected that Fe may contribute to the formation of Mn oxidizing—and reducing biofilms.
Continuous vertical profiles of DO and temperature concentrations through the full depth of the water column were done on-site using a YSI Professional Series DO meter. Sediment samples were collected at each sampling site and analyzed for total Mn via acid digestion and ICP-MS at CAF. In addition to sampling of the reservoir's water columns, water and biofilm samples were collected at different locations along the LBIS pipeline network, along with DO measurements, and submitted for ICP-MS analysis. LBIS sampling sites were selected based on the location of maintenance stations in the pipeline to allow access for sampling. During biofilm sampling, ~50 mL of biofilm material was scraped from the surface on the inside of the pipe into sterile Falcon tubes in order to collect sufficient material to comprise a composite sample, which would be more representative of the biofilm growing in the pipe. These samples were collected at a depth up to ~60 cm from the point of entry inside the pipe and transported on ice back to the laboratory where it was airdried at 26°C before visualization with scanning electron microscopy with energy dispersive X-ray spectroscopy (SEM/EDS) for elemental analysis. Biofilm samples were not chemically dehydrated to prevent loss of metals inside the biofilm matrix during the fixation process.
First Sampling Event—October 2015
Samples were only collected from sampling site 1 in two-meter increments down to the water-sediment interface at ~44 m depth and 240 m from the dam wall. Additionally, biofilm samples were collected from LBIS 1, 4.5 km downstream from the extraction point (Supplement A), where after they were airdried at 26°C for 72 h before visualization with SEM/EDS.
Second Sampling Event—May 2016
Water samples were collected from sites 1, 2, 4, 5, and 7 (Figure 2) up to the maximum depth of each site. Sites 1 and 2 were the deepest, with maximum depths of ~44 and 35 m, respectively. Sediment samples were also collected from all seven sampling sites and sent for ICP-MS analysis. Additional water samples were collected in the LBIS pipeline network at the LBIS 1 and LBIS 3 (~4.5 and 23 km downstream from the dam wall, respectively) sampling sites. Biofilm samples were also collected from the LBIS 1 sampling site, where after it was airdried and subjected to SEM/EDS analysis. SEM/EDS analysis on biofilms collected only during the first and second sampling events were performed using Phenom ProX SEM.
Third Sampling Event—October 2016
Water samples were only collected from sampling site 1 (Figure 2) because, due to very little rainfall in 2016 and subsequently a low water level, sampling at the other sites was not possible.
Fourth Sampling Event—February 2017
The fourth sampling event involved water samples collected at sampling sites 1, 2, 4, and 7 (Figure 2), as well as water samples along with DO measurements from the LBIS pipeline network at the following sampling sites downstream from the dam wall: LBIS 1 (4.5 km), LBIS 2 (6 km), LBIS 3 (23 km), LBIS 4 (26.3 km), LBIS 5 (25 km), LBIS 6 (28.4 km), LBIS 7 (17.6 km), LBIS 8 (27.3 km), and LBIS 9 (31.7 km). The pipeline branches into various routes, with the main line branching into routes 1 and 2 at LBIS 2 and route 2 subsequently branching into routes 2 and 3 ~4.5 km further.
Additional to the water samples, biofilm samples were collected from the pipeline at sites that could be opened, namely at LBIS 1, LBIS 6, and LBIS 10 (12.5 km) (Supplement A). Although these sampling sites are located on two different routes, the LBIS 6 sampling site occasionally receives water from route 1, depending on water flow inside the pipeline. Biofilm samples were airdried at 26°C for 72 h prior to acid digestion and ICP-MS analysis, as well as analysis by SEM/EDS using the Zeiss Merlin SEM equipped with an energy dispersive X-ray spectrometer at CAF. All samples were coated with gold prior to SEM/EDS analysis. Total Mn mass per dry biomass was calculated.
Statistical Analysis
For each of the four sampling events, the coefficient of correlation (r) was calculated to determine the correlation between DO and Mn. Additionally, correlations between DO and depth, as well as depth and Mn were calculated to determine which correlation was the strongest. The same procedure was followed for Fe.
Results
Water Profiles: DO and Mn Concentration
First Sampling Event—October 2015
The water level of the dam was at ~80% and it was expected that DO levels near the bottom of the dam would be similar to that of the epilimnion, due to sufficient mixing between the two layers typically observed during turnover between seasons (Gantzer et al., 2009; Willey et al., 2011). However, as indicated in Figure 3A, there was a marked DO stratification, with DO levels higher than 8 mg l−1 in the upper 10 m, followed by a rapid decrease to 2.62 mg l−1 at 48 m depth. ICP-MS data for water samples collected during October 2015 show an inverse relationship between total Mn concentrations and DO concentration (Figure 3A). At a depth of 2 m below surface, where the DO concentration was 8.47 mg l−1, the total Mn concentration was only 1.47 μg l−1. The inverse relationship continues as Mn concentrations increased with a decrease in DO concentration, finally reaching its maximum concentration of 730 μg l−1 at a depth of 44 m with DO concentration as low as 2.06 mg l−1. Temperature measurements indicated that water temperature declined gradually from 23.8°C at 2 m below surface to 17.8°C at 48 m depth. Statistical analysis of ICP-MS data for water samples collected during October 2015 show r = –0.66, pointing to a moderate inverse correlation between total Mn concentration and DO concentration. However, this inverse correlation was not found to be significant, with P > 0.05 and therefore does not point to a clear association between total Mn and DO concentration.
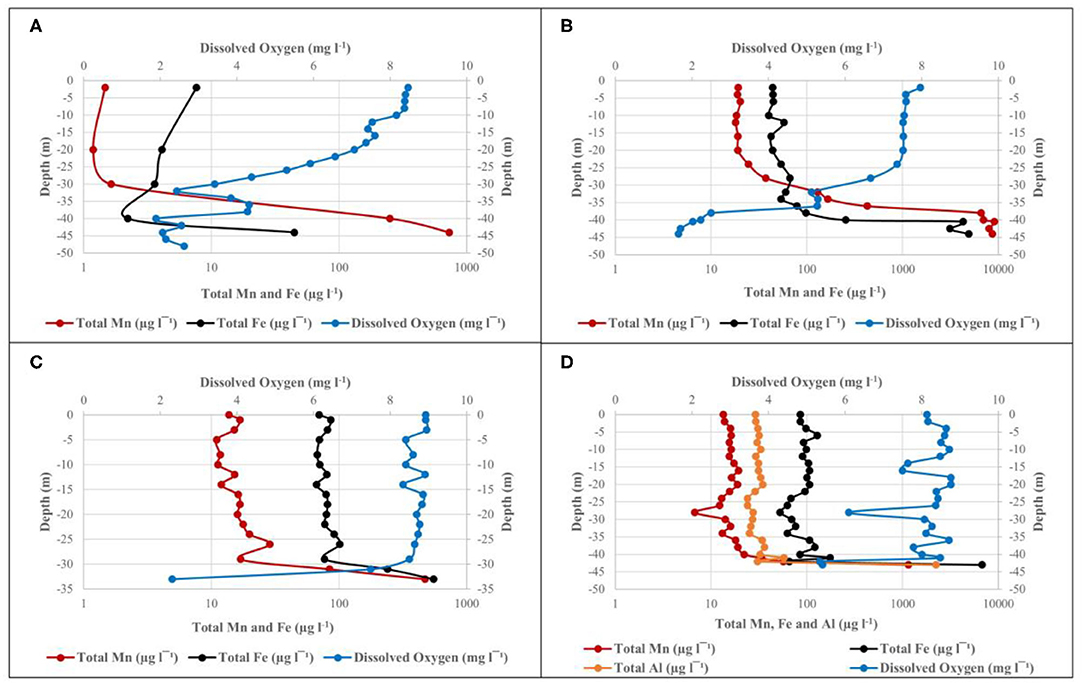
Figure 3. Depth profile of DO, total Mn, and Fe at site 1 in the Blyderiver dam on (A) October 2015; (B) May 2016; (C) October 2016; and (D) February 2017. Aluminum analyses are also included in (D).
Second Sampling Event—May 2016
During the second sampling event with the dam's water level at ~70%, DO levels remained high (between 7 and 8 mg l−1) for the upper ~25 m of the water column at site 1, followed by a decrease from 7.36 mg l−1 at 24 m depth to below 2 mg l−1 at 44 m depth (Figure 3B). Inversely, Mn and Fe levels increased rapidly after 24 m depth, reaching maximum concentrations of 8,631 and 4,921 μg l−1, respectively, at 44 m depth and confirming the inverse relationship observed in data from October 2015. Statistical analysis showed a correlation coefficient of r = –0.94 (P < 0.05) between DO and Mn, indicating that a strong, negative correlation exists between these levels with increasing depth. The same was true for Fe with r = −0.71 (P < 0.05). For both Mn and Fe, the P < 0.05 points to a clear association between DO and Mn or Fe, respectively. ICP-MS results showed ~95% of the total Mn exists in the oxidized form in the upper zone and up to 20 m below the surface. The percentage of total Mn oxidized decreased to ~56 and 6% at depths of 36 m and 42 m, respectively, showing the link between Mn oxidation and DO concentration. Similar patterns were observed for Fe, with ~92% of total Fe content oxidized at 4 m depth, increasing to 94% at 36 m, where after it decreased to 49% at 42 m. Despite the low DO concentrations observed at deeper zones during May 2016, no significant decrease in temperature could be observed, with temperatures measuring ~20°C up to a depth of 36 m, where after it only declined to 18.9°C at a maximum depth of 44 m. Thus, there was no indication of thermal stratification.
Water samples collected from the maximum depths of sites 2, 4, 5, and 7 (Table 1) contained significantly lower concentrations of both Mn and Fe compared to what was measured at site 1 (8,631 and 4,921 μg l−1, respectively). Both Mn and Fe concentrations were lower at sites further away from the dam wall (sites 4 and 5; it was not possible to collect samples at site 3 as the current prevented the sampler from reaching the bottom), with an increase in both Mn and Fe concentrations at sites closer to the dam wall, reaching concentrations of 1948.69 and 1181.74 μg l−1, respectively, at site 2. Mn and Fe concentrations in the sediment samples were highest at sites furthest away from the dam wall (Figure 4).
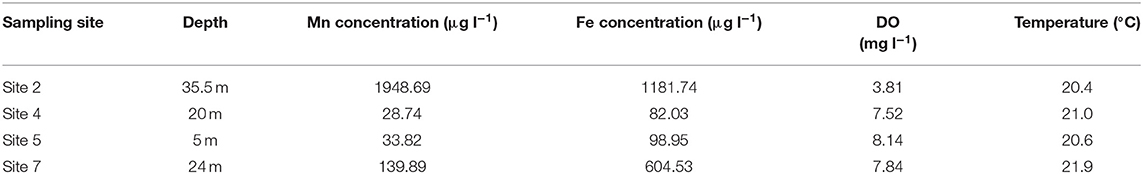
Table 1. Total Mn and Fe concentrations in water samples collected near the sediment/water interface at sites in the Blyderiver dam located further away from the dam wall (May 2016).
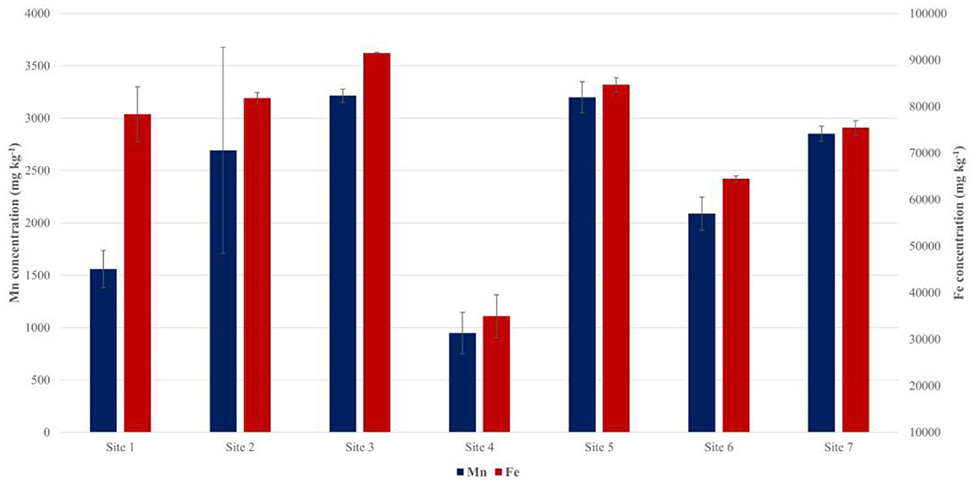
Figure 4. Manganese and iron concentrations in sediment sampled on May 2016.
Third Sampling Event—October 2016
Sampling collection in October 2016 occurred during a period of drought, with the dam's water level at ~40%, and a maximum depth of ~35 m. ICP-MS results and DO measurements in Figure 3C indicate profiles similar to those observed during earlier sampling events, with DO concentrations of 8.93 mg l−1 at 1 m depth below surface and remaining above 8 mg l−1 up to a depth of 29 m, where after it decreased rapidly to 2.31 mg l−1 at 33 m depth. In contrast, Mn, and Fe concentrations increased following a decrease in DO concentrations, remaining relatively constant up to 29 m depth, where after they rapidly increased to 471.17 and 551.44 μg l−1, respectively. Statistical analysis of the dataset indicated r = −0.99 (P < 0.05) between DO and Mn, pointing to a strong inverse correlation. The same could be seen for the correlation between DO and Fe with r = −0.98 (P < 0.05). Although comparison between data from October 2015 (Figure 3A) and October 2016 (Figure 3C) showed this inverse correlation in both cases, DO measurements from October 2016 only indicate a rapid decrease in DO concentration over the deepest 4–5 m.
Similar to data from May 2016, the percentage of oxidized Mn decreased with depth, with 94% of total Mn oxidized at 1 m below surface, decreasing to 27% at 33 m depth. However, the percentage of oxidized Fe showed a much smaller decrease, with 99% oxidized at 1 m depth and only decreasing to 91% at 33 m depth. Temperature did not fluctuate significantly throughout the water column, peaking at 23.9°C at the surface and only declining to 19.2°C at 33 m depth.
Fourth Sampling Event—February 2017
Heavy rainfall increased the dam's water level from 33% in December 2016 to 100% in February 2017. Sufficient mixing of oxygen within the water column lead to DO concentrations remaining mostly between 8 and 9 mg l−1 throughout the water column, only decreasing to a concentration of 5.41 mg l−1 at 43 m depth (Figure 3D). The inverse was true for total Mn and Fe concentrations remaining mostly constant to ~40 m depth, followed by a rapid increase to 1,147 and 6,781 μg l−1, respectively, at 43 m depth. A moderate inverse correlation could, however, still be observed between DO and the respective elements, with r = −0.57 (P < 0.05) between DO and Mn and r = −0.55 (P < 0.05) between DO and Fe. It should be noted that sampling took place as close as possible to the previous years' sampling points, however, only 43 m in depth was reached.
Aluminum (Al) measurements were included as farmers reported losses in crop production and it was suspected that this could be due to high Al concentrations in irrigation water. ICP-MS data from Figure 3D indicated that total Al concentrations during February 2017 reached maximum values as high as 2,225 μg l−1 at a depth of 43 m. Similar to Mn and Fe, statistical analysis indicated that a moderate inverse correlation could also be found between DO and Al, with r = −0.55 (P < 0.05).
The percentage of total Mn, Fe and Al that were oxidized showed minor decreases with increase in depth. Unlike data from previous sampling events, the percentage of total Mn oxidized only showed a decrease from 95% at 2 m depth below surface to 84% at 43 m depth, compared to decreases of more than 60% observed during sampling in May and October 2016. The percentage of total Fe and Al concentrations oxidized both showed increases with increase in depth, with Fe increasing from 78% at 2 m depth to 97% at 43 m depth and Al increasing from 49 to 99% at the same depths. Temperature measurements indicated a gradual decrease from 29.3°C at the surface to 23.7°C at 43 m depth indicating that the Blyderiver dam was not thermally stratified during this period. Total Mn, Fe and Al concentrations in water samples collected from sites 2, 4 and 7 (Table 2) did not follow the same pattern observed during sampling in May 2016 (Table 1), with total Mn, Fe, and Al concentrations being higher at sites further away from the dam wall.
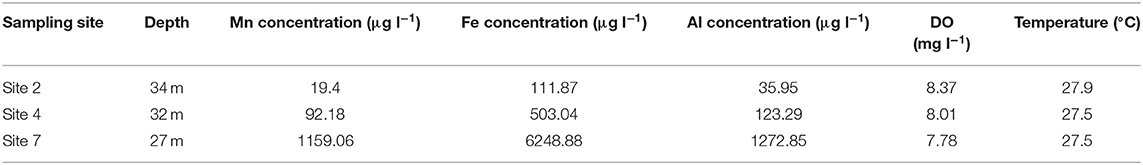
Table 2. Total Mn, Fe, and Al concentrations in water samples collected at maximum depth, at sites in the Blyderiver dam located further away from the dam wall in February 2017.
Total Mn and Fe in Sediment
Sediment samples were collected from the sites indicated in Figure 2 during sampling in May 2016. As shown in Figure 4, Mn and Fe concentrations varied considerably amongst the sampling sites, being highest in the sediment collected at the sites furthest from the dam wall, with Mn and Fe concentrations reaching concentrations of 3198.29 and 84660.84 mg kg−1, respectively, in the area fed by the Orighstad river (site 5), and 3214.23 and 91487.42 mg kg−1, respectively, in the area fed by the Blyderiver (site 3).
Total Mn Concentration in Water Samples Collected Downstream Along the Main LBIS Pipelines
Water was collected on two of the sampling dates from the LBIS pipeline network to determine Mn concentrations over distance from the point of extraction. As indicated in Figures 5, 6, total Mn concentration in the pipeline was notably lower than at the point of extraction, with the most significant decrease occurring over the first 4.5 km to the LBIS 1 site. During the May 2016 sampling event (Figure 5), total Mn concentrations decreased from 8,631 μg l−1 in water entering the pipeline to 2756.24 μg l−1 at the LBIS 1 sampling point. Total Mn concentrations then further decreased to 134.83 μg l−1 in water collected from the sampling point 18.5 km further downstream at LBIS 3. Fe followed the same pattern, albeit at lower concentrations.
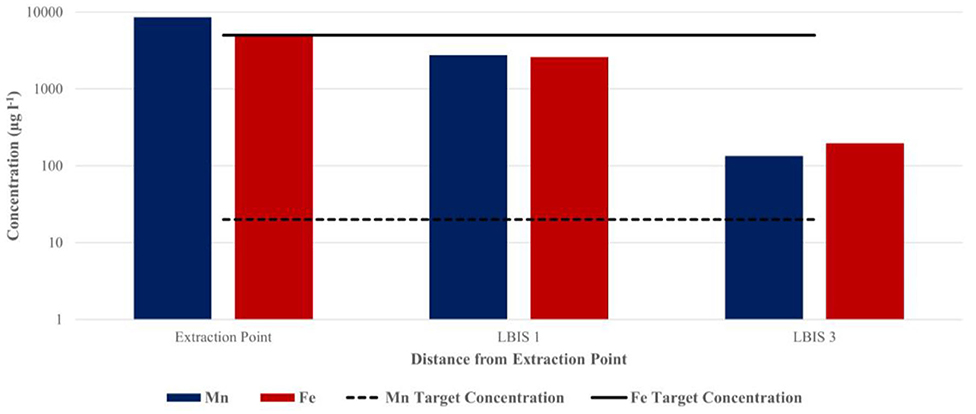
Figure 5. Total Mn and Fe concentrations in water sampled at the LBIS 1 and LBIS 3 extraction points at 4.5 and 23 km downstream from the dam wall, respectively (May 2016). The dotted and solid lines indicate target water quality guidelines in irrigation water for Mn and Fe, respectively.
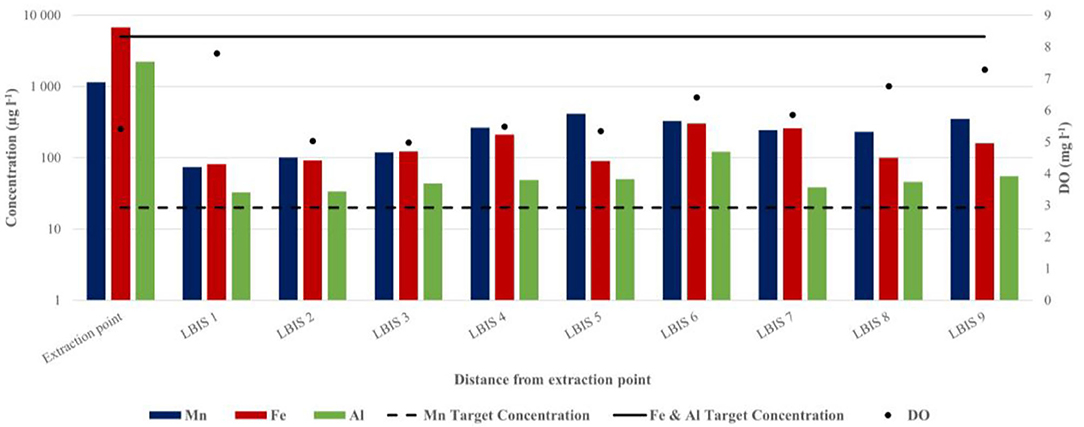
Figure 6. Total Mn, Fe, Al, and DO concentrations in water sampled at the extraction point and downstream on routes 1, 2, and 3 (February 2017). The respective downstream distances are: LBIS 1–4.5 km, LBIS 2–6 km, LBIS 3–23 km, LBIS 4–26.3 km, LBIS 5–25 km, LBIS 6–28.4 km, LBIS 7–17.6 km, LBIS 8–27.3 km, LBIS 9–31.7 km. The dotted and solid lines indicate SA target water quality range in irrigation water for Mn, Fe, and Al, respectively.
A similar difference between concentrations at the point of extraction and the pipe network was observed in water samples collected during more extensive sampling in February 2017 (Figure 6). Total Mn, Fe, and Al concentrations decreased within the first 4.5 km, from 1147.3 to 74.05 μg l−1, 6781.31 to 81.43 μg l−1, and 2224.99 to 32.61 μg l−1 for Mn, Fe, and Al, respectively. However, after the initial decrease, there was a measurable increase for all three elements with distance in all three lines from the LBIS 1 sampling point. Total Mn increased from 74.05 μg l−1 at LBIS 1 to 264.32 μg l−1 at LBIS 4 downstream on route 1, to 327.02 μg l−1 at LBIS 6 on route 2, and 351.65 μg l−1 at LBIS 9 on route 3. Fe and Al concentrations followed similar patterns.
Biofilm Mn Content in the LBIS Network With an Increase in Distance From the Extraction Point
Biofilm samples were collected at three locations at sampling points LBIS 1, LBIS 6 and LBIS 10; the only sampling points that allowed sufficient access to representative biofilms. Total biofilm Mn concentration decreased with distance from the extraction point, with biofilm samples collected at LBIS 1 showing the highest concentration of Mn at 30105.4 mg kg−1, decreasing to 23501.9 mg kg−1 at LBIS 10, and 13727.7 mg kg−1 at LBIS 6, the furthest point of the three at 28.4 km. Biofilm samples collected from the LBIS pipeline were dried and subjected to SEM/EDS to determine elemental composition. Elemental analysis indicated that Mn and Fe were not uniformly distributed through the biofilm matrix, Elemental analysis of biofilm samples collected from October 2015 to February 2017 all indicated the presence of Mn, Fe and Al as some of the most abundant metals, with Mn reaching concentrations as high as 33% biofilm dry weight concentration in randomized scanned areas, for samples collected in October 2015.
Discussion
Water Profiles: DO and Mn Concentration
First Sampling Event—October 2015
Using typical seasonal turnover patterns as reference, it was expected that DO concentrations at the bottom of the dam would be similar to that in the upper layers due to sufficient mixing between layers during turnover between seasons (Gantzer et al., 2009; Willey et al., 2011). This was however not the case as Figure 3A points to a rapid decrease in DO with increasing depth. This clear DO stratification profile observed may be attributed to the region's temperate climate, with an average temperature of 14°C during the coldest month of June, causing seasonal turnover to be less significant than observed in cooler regions. Dams and large water bodies in this region may thus not follow typical stratification and seasonal turnover patterns, leading to persisting low DO conditions in deeper zones. This finding is further supported by the gradual decline in temperature observed at increasing depth, indicating that this dam does not have a typical stratified temperature profile, which is in contrast with what is typically seen in thermally stratified waterbodies.
Comparison between the DO and Mn profiles in Figure 3A also points to an inverse relationship, indicating that decreasing DO concentrations at greater depths would be mirrored by increasing Mn concentrations. This is supported by statistical analysis pointing to a moderate inverse correlation between DO and Mn. The higher concentrations of Mn measured at deeper depths compared to that in the upper layers led to the conclusion that the extraction of water for the LBIS network at the depth with Mn-rich water may select for microorganisms that derive energy from the Mn cycle, as Mn reducing microorganisms are capable of using oxidized Mn as an electron acceptor to obtain energy for anaerobic growth (Nealson and Myers, 1992). This may enable these microorganisms to potentially dominate in biofilms in the pipeline and serve as a catalyst for the build-up of a matrix composed of Mn and the microbially-produced extracellular polymeric matrix. It was therefore decided to conduct follow-up sampling during different seasons, and with varying dam levels.
Second Sampling Event—May 2016
Similar to results from October 2015, no remarkable decrease in temperature was seen at deeper depth. Despite the low DO concentrations at deeper depths, this dam appears to only show clear DO stratification profiles but is not thermally stratified. DO and Mn measurements during this campaign (Figure 3B) once again pointed to an inverse relationship between DO and Mn with an increase in depth, similar to what was seen in October 2015. During May 2016, however, statistical analysis showed a correlation coefficient of r = −0.94 (P < 0.05), pointing to a strong inverse correlation between DO and Mn with increasing depth compared to the only a moderate inverse correlation or r = −0.66 (P > 0.05) in October 2015. Furthermore, the P < 0.05 observed for the correlation coefficient calculated in May 2016 also show that this correlation is significantly different from zero and that there is clear evidence of association between DO and Mn, which stands in contrast to what was observed in October 2015.
Analysis of data obtained from both the October 2015 and May 2016 campaigns (Figures 3A,B) are similar to findings by Bryant et al. (2011) indicating that higher concentrations of DO in reservoirs' upper zones could result in the oxidation of Mn, converting it from soluble Mn2+ to the insoluble MnO2 form, and allowing it to settle out to the sediment. Upon reaching deeper levels where DO concentrations are low, Mn can be converted back from MnO2 to Mn2+. To test the extent of this process in the Blyderiver dam, all water samples were separated into filtered and unfiltered aliquots to measure what percentage of the total Mn in the water sample was oxidized. Results from the sampling campaign showed that Mn did indeed behave as found by Bryant et al. (2011), with 95% of total Mn existing in the oxidized form in the upper zones of the dam and decreasing to as low as 6% at 42 m depth. Similar patterns were observed for Fe leading to the respective Mn and Fe concentrations of 8,631 and 4,921 μg l−1 at 44 m depth. Although this falls within the target water quality range of 5 mg l−1 for Fe in irrigation water, it drastically exceeds the target water quality range of 0.02 mg l−1 for Mn in irrigation water. Both concentrations also exceed 1.5 mg l−1, considered the concentration where severe clogging of drip irrigation systems occur [Department of Water Affairs Forestry (DWAF), 1996].
As it is known that Mn oxidation is strongly affected by microbial activity and influenced by DO concentration (Mouchet, 1992; Webb et al., 2005), the lower percentage of Mn oxidized at deeper depths can thus be explained by a combination of lower DO concentration and lower microbially induced oxidation. As a result of the low DO concentrations in the deeper regions of the water column, the sediment is effectively isolated from the oxygen-rich overlying water, which may result in the oxic/anoxic boundary expanding upwards from the sediment, releasing Mn2+ into the overlaying anoxic region as discussed by Katsev et al. (2007). Analysis of the sediment collected during the second sampling event (Figure 4) indicated that Mn and Fe concentrations were highest in samples collected furthest away from the dam wall, which can possibly be explained by higher DO concentrations, measured at sites 4 and 5, driving the oxic/anoxic boundary toward the sediment, allowing only the release of MnO2 into the overlying water, where higher DO results in precipitation. However, at the deeper zones of sites 1 and 2, DO concentrations decrease, expanding the oxic/anoxic boundary upwards from the sediment and releasing soluble Mn2+ into the overlying water.
Third Sampling Event—October 2016
Although similar profiles for DO and Mn concentrations were seen compared to earlier sampling events, the DO profile for October 2016 only showed a rapid decrease in DO concentration over the deepest 4–5 m, whereas this decrease could be seen higher up in the water column for previous sampling events. This can be explained by the low rainfall and constant demand for water for irrigation resulting in faster extraction of water compared to inflow into the dam, allowing the dam's water level to decrease. A large portion of the hypoxic deeper region was extracted and DO rich water from shallower depths was subsequently drawn down, expanding the higher DO fraction throughout most of the water column.
Similar to water profiles from October 2015 and May 2016, total Mn and Fe concentrations increased following a decrease in DO concentrations, remaining relatively constant up to 29 m depth, where after they rapidly increased to 471.17 and 551.44 μg l−1, respectively. Interestingly, the Mn concentration, recorded in water with a DO concentration of 2.31 mg l−1, was much lower compared to Mn concentration of 6,989.3 μg l−1 but higher compared to an Fe concentration of 255.31 μg at similar DO concentration in May 2016. This might be due to the decrease of incoming Mn rich water from the Blyde and Orighstad rivers, as well as a decrease in the transfer of Mn from sediment upstream in these rivers due to low rainfall during 2016. Although the percentage of oxidized Mn showed a decrease from 94 to 27% with increasing depth, the decrease seen for Fe was much lower, decreasing only from 99 to 91%. This might have been the result of the overall high DO concentration present throughout a relatively larger portion of the water column compared to the previous two sampling events, and its ability to be oxidized more readily than Mn.
Fourth Sampling Event—February 2017
Heavy rainfall lead to the rapid increase in the dam's level from 33 to 100% from December 2016 to February 2017, causing mixing of oxygen within the water column and leading to a mostly high DO concentration which only decreased to 5.41 mg l−1 at 43 m depth (Figure 3D). Mixing throughout the water column also affected the inverse relationship between DO and Mn. Despite the general trend showing similarity to other sampling events, a notable decrease and increase could be seen for DO and Mn, respectively, only at 43 m depth, whereas this inverse relationship is typically seen higher up in the water column. Furthermore, the correlation coefficient pointed to a moderate inverse correlation between DO and Mn, compared to the strong inverse correlations seen during May 2016 and October 2016. The same was true for DO and Fe, as well as DO and Al, which was also included in this sampling campaign. The limited decreases seen in the percentage Mn, Fe and Al oxidized with increasing depth is also suspected to have been influenced by the high DO concentration throughout the water column. However, Mn and Fe concentrations at this m depth both exceeded their target water quality range of 0.02 and 5 mg l−1, respectively. Al concentration, in contrast, lies within its water quality target range of 5 mg l−1 for irrigation water. It should be noted though, that Al concentrations as low as 0.1–0.5 mg l−1 in soil solution can have toxic effects on several crops [Department of Water Affairs Forestry (DWAF), 1996]. Similar to data from October 2016, the high DO concentration throughout most of the water column, combined with the rapid inflow of DO-rich water caused by high rainfall may have led to significant mixing in the deeper zones, driving the oxic/anoxic boundary toward the sediment and decreasing the release of soluble elements such as Mn, Fe and Al as described by Katsev et al. (2007).
The focus of this study was on Mn concentrations in water and biofilms, although we recognize that metals such as Fe and Al may present similar operational problems. Here Mn was thus used as a proxy to illustrate the incorporation of metals into the biofilm from the pipeline water. Considering the decreases seen in both Fe and Al in the LBIS pipeline, it would be interesting to do further studies on these elements as well as these decreases may point to biofilm incorporation. Comparison between the correlation coefficient values calculated for all four sampling events point to stronger inverse correlations between DO and Mn during the May and October 2016 sampling events [r = −0.94 (P < 0.05) and −0.99 (P < 0.05), respectively] compared to the October 2015 and February 2017 sampling events [r = −0.66 (P > 0.05) and −0.57 (P < 0.05)]. However, these differences may be explained by the low rainfall observed during 2016, resulting in the distinct profiles with high DO in the upper zones and low DO in the deeper zones due to less mixing, while the lower r value of −0.57 observed in February 2017 can be explained by the heavy rainfall. Interestingly, for all sampling events, except October 2015, the r value for DO and Mn were higher than those for DO and depth, as well as depth and Mn. Moreover, it was observed that the P-value was <0.05 for the correlation coefficient calculated for Mn and DO in all cases except October 2015, indicating that a clear association exists between DO and Mn. The correlation coefficient thus indicates that increasing depth will result in lower DO concentration and that the Mn concentration will increase at these depths, not as a result of the depth, but as a result of the lower DO concentrations present.
Hydrological data from previous years indicate that the average retention time of the 54.4 million cubic meter dam varies from 151 days during October (at the end of the dry season) to as low as 26 days during January at the peak of the rainy season. The high degree of mixing observed during the February 2017 sampling campaign is therefore not uncommon. The clear differences in the profiles for the October 2015 and October 2016 sampling campaigns (Figures 3A,C) show the impact that drought, and thus the dam's water levels have on the geochemistry profile. Furthermore, in the absence of three typical thermal layers (epilimnion, metalimnion, and hypolimnion), this water column shows a relatively stable temperature profile throughout the water column and in different seasons. In contrast, DO profiles still correspond mostly to a water column that is thermally stratified, remaining high at the shallower depths and rapidly decreasing at deeper depths. This profile was seen during all four sampling events, indicating that the geochemistry of this dam is probably stronger influenced by events of drought, than by season.
Total Mn and Fe in Sediment
Despite the substantial variation between Mn and Fe concentration at the respective sampling sites, there was no clear trend with distance closer to the wall, and since we could not obtain sediment samples and related DO profiles for all the sampling sites on all sampling dates, it is not possible to explain the variation, such as the comparatively low values measured at site 4. Thamdrup et al. (1994) indicated that Mn is not only cycled between MnO2 in aerobic sediment and Mn2+ in anaerobic sediment, but also between sediments and the overlaying water (Figure 4). Additional sampling, that also include flow in the overlaying water column, would be necessary to help explain the variation in the shallow sediments. The high concentrations of Mn measured in the sediment at the respective sampling locations (Figure 4) does, however, indicate that the sediment is an important part of the Mn cycle (Figure 7) which can greatly affect the Mn concentration in the water as the oxic/anoxic boundary moves toward/away from it. This cycle is however not only relevant in Mn cycling between water and sediment, but may also occur between water and biofilms.
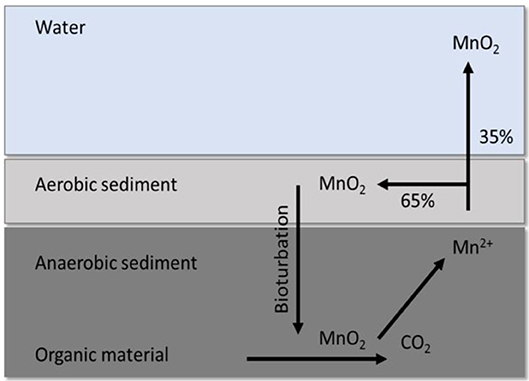
Figure 7. Cycling between MnO2 in aerobic sediment and Mn2+ in anaerobic sediment, as well as release of a notable fraction back to the aqueous phase through dissimilatory Mn reduction by anaerobic bacteria. Adapted from Thamdrup et al. (1994).
Total Mn Concentration in Water Samples Collected Downstream Along the Main LBIS Pipelines
The decreases found in Mn and Fe concentrations over the first few kilometers downstream from the extraction point is indicative of notable Mn sequestering from the water; ~70% during the May 2016 sampling (Figure 5) when intake water contained 8,631 μg l−1 Mn (DO ~2 mg l−1), and almost 93% during the February 2017 sampling (Figure 6) when the intake water contained a lower Mn concentration of 1147.3 μg l−1 (DO 5.41 mg l−1). It is important to point out that, even when the intake water contained high Mn (8,631 μg l−1), it was reduced to the same concentration range over the next few km to levels similar to those when the intake water contained 8 times less Mn (1147.3 μg l−1)—suggesting that biofilms play an important role as sink for Mn in the pipe network. Mn oxidizing and reducing microorganisms in the biofilms could potentially be responsible for this decrease by incorporating Mn into the biofilm's extracellular polymeric substances (EPSs). This is achieved through the production of negatively charged EPSs to which the positively charged Mn2+ can bind, after which soluble Mn is oxidized enzymatically (Ghiorse, 1984). Despite these decreases, Mn concentrations did not comply with its target water quality guideline of 0.02 mg l−1 for irrigation water [Department of Water Affairs Forestry (DWAF), 1996] in either May 2016 or February 2017. The large quantities of biofilm material with characteristic dark brown color that was collected at the LBIS 1 sampling site (Figure 1) suggests that high concentrations of Mn contribute to the growth and maintenance of these biofilms capable of oxidizing, reducing and incorporating it into the biofilm matrix. The high Mn content of biofilms shown in Table 3 supports this contention. The fact that Mn concentration in water decrease with distance as shown in Figure 5, suggests that the biofilms may not have reached a steady-state over the full distance of the network, with the possibility that Mn sequestering and overall biofilm-biomass accumulation may continue over time, leading to further reduction in the network's hydraulic capacity.
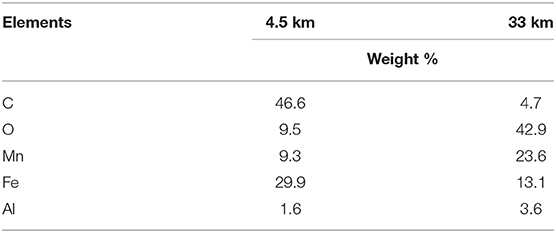
Table 3. Elements present in biofilm samples obtained 4.5 and 33 km downstream from the LBIS 1 extraction point in February 2017, as identified through SEM/EDS.
The demonstrated variability in Mn concentration in the intake water as shown in Figures 3A–D, considered in view of the further reduction beyond 4.5 km when the intake Mn was high, and which was comparable to when the intake Mn was low, thus warrants further investigation to better understand Mn cycling between biofilms and the aqueous phase in the pipes. Extraction of water higher up in the column with high DO and low Mn concentrations may not sustain biofilms such as those that have developed under the low DO and high Mn concentrations as is currently the case. Of particular interest would therefore be to determine (i) whether intake of water from the overlaying zone with high DO and low Mn concentration will ultimately lead to washout of Mn from the system, and (ii) at what threshold Mn concentration this will happen. It is speculated that Mn cycling between these biofilms and the overlying water occurs in a similar manner as that described in Figure 7, where Mn is cycled between sediment and overlying water. Soluble Mn entering the pipeline can be oxidized by Mn oxidizing bacteria in the aerobic upper layers of the biofilms in the presence of adequate DO in the bulk aqueous phase, which depend on the DO concentrations in the intake water or introduced through turbulence. Mn reducers in the deeper, hypoxic layers of the biofilm will reduce oxidized Mn back to the soluble state, where after it can be oxidized again by the Mn oxidizing bacteria in the cycle, releasing a portion of the oxidized Mn back into the overlying water. It is possible that Mn reducing bacteria dominate during periods when DO concentrations in the intake water are lower, such as the 1.65 mg l−1 experienced at 44 m depth during May 2016, reducing MnO2 in the overlaying water inside the pipeline and releasing soluble Mn back into the overlaying water. While the constant presence of high concentrations of Mn may select for the presence of Mn oxidizing and reducing microorganisms, extracting water from shallower depths where Mn concentrations are lower may potentially lead to washout of these biofilms.
While the LBIS pipeline has a design capacity of 4.24 m3 s−1 when the dam is full, flow velocity can be expected to vary considerably due to changes in dam level/hydraulic head as well as water demand/abstraction. Supply lines branching from the 3 major lines will further show variation in flow, and thus shear values. Due to limited access, biofilms could not be sampled in all sections of the network, nevertheless biofilm biomass, and consistency were comparable between the samples collected, and anecdotally to those observed during repair and maintenance, which is not surprising given the wide range of flow regimes in which biofilms occur in natural and engineered systems. This is supported by studies that have pointed to the role that shear plays in biofilm formation, finding that higher hydrodynamic shear force result in stronger biofilms which are smoother and more compact but also tend to be more stable when grown in turbulent flow conditions. In contrast, thick and fluffy biofilms have also been seen to grow in decreased shear conditions under laminar flow, indicating that biofilms can grow under a wide range of flow conditions (Liu and Tay, 2002; Pereira et al., 2002; van Loosdrecht et al., 2002; Ramasamy and Zhang, 2005).
Biofilm Mn Content in the LBIS Pipeline
Comparing the decreases seen in biofilm Mn content between biofilm collected at LBIS 1 and LBIS 6 with data from Figure 6, it appears that upstream from LBIS 1, more Mn are oxidized and precipitated from the aqueous phase and incorporated into biofilm than the fraction that is released back into the aqueous phase by reductive dissolution. Figure 6 shows there is not a decrease in DO with distance, thus there may not be a higher rate of reductive dissolution downstream, in which case the biofilm will keep on incorporating Mn and grow (thus the point where more Mn are oxidized and precipitate from the aqueous phase and get incorporated into biofilm than the fraction being released back into the aqueous phase by reductive dissolution will gradually migrate downstream).
Closer inspection of biofilm elemental composition using SEM/EDS confirmed the presence of Mn, Fe and Al as seen in ICP-MS but, additionally, indicate that Mn and Fe were not uniformly distributed throughout the biofilm matrix. This is not surprizing in view of the frequent mention of biofilm heterogeneity in literature (e.g., Jahn et al., 1999; Donlan, 2002). Interestingly, an abundance of diatoms of various shapes could be observed in these samples. These organisms were visually identified by their unique shapes as seen if Figure 8, as well as high silica content when they were subjected to SEM/EDS. The occurrence of diatoms in biofilms associated with the oxidation and reduction of Mn has previously been reported by Kielemoes et al. (2002). In their research, it was found that diatoms might adhere to biofilms in stagnant water. However, SEM (Figure 8) indicated the presence of diatoms in biofilm samples subjected to continuous high-flow (>3000 l s−1) conditions, indicating that diatoms are also incorporated into biofilms under fast flowing conditions.
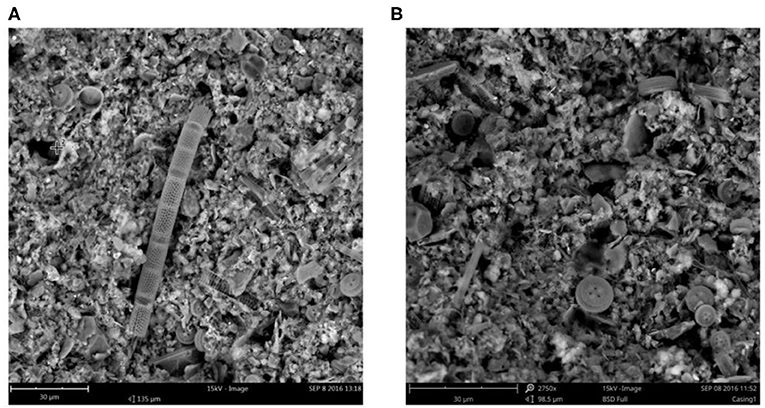
Figure 8. SEM images (A,B) of biofilm samples collected at LBIS 1 showing diatoms imbedded in the biofilm matrix.
Conclusions
Biofilms with a Mn content of up to 30,000 mg kg−1 biofilm dry weight formed in the LBIS, which offers a possible explanation for a recorded increase in surface roughness and associated reduction in hydraulic capacity experienced in the system. The reservoir's water column showed a characteristic profile, with DO concentration above 7 mg l−1 in the upper regions, followed by a rapid decline to as low as 2 mg l−1 in the deeper zones, with total Mn concentrations having a strong inverse relationship with the measured DO profile, ranging from <5 μg l−1 near the surface to >8,000 μg l−1 near the water-sediment interface. Mn concentration in both the aqueous phase and biofilms in the pipeline decreased from point of extraction, suggesting continued Mn attenuation and increase in biofilm biomass that may lead to further loss in hydraulic capacity over time.
Since water for the main 1,500 mm diameter pipeline of the irrigation system is extracted from this low DO—high Mn zone, it is recommended that experimental pipe rigs be installed and supplied with water extracted at various depths to monitor biofilm development under higher DO concentrations and lower total Mn concentrations experienced at these respective depths, and also to assess whether switching to water with higher DO, extracted from the upper zones, would ultimately lead to washing-out of Mn released by reductive dissolution from the existing biofilms. These measures may ultimately offer a solution to the current situation where concentrations of Mn, Fe, and Al in the irrigation water do not comply with national irrigation guidelines.
Data Availability Statement
The raw data supporting the conclusions of this article will be made available by the authors, without undue reservation.
Author Contributions
AC conducted the research study as part of his MSc thesis and wrote the draft of the article. LB as co-supervisor, she took part in one of the samplings, shared her knowledge for the background of the study, and discussion of results. MB took part in all of the samplings, co-supervised the study, and assisted in writing and interpretation of results. GW was the main supervisor of the study, conceptualized the study, took part in all of the samplings, and assisted in editing and interpretation of results. All authors contributed to the article and approved the submitted version.
Funding
This work was supported by National research Foundation (South Africa) funded a student bursary. Ekurhuleni Water Care Company (ERWAT): The ERWAT chair provides research funding for water research at Stellenbosch University Water Institute. Funding for this project was further provided by East Rand Water Care Company (ERWAT).
Conflict of Interest
The authors declare that the research was conducted in the absence of any commercial or financial relationships that could be construed as a potential conflict of interest.
Acknowledgments
The members of this study wish to thank Mr. Jaco Swart for his advice, Mr. Jurie van Vuuren from LBIS, MBB Consulting Engineers and Prof. Fanie van Vuuren from University of Pretoria, for logistical support and access to sampling locations. The financial assistance of the National Research Foundation (NRF) toward this research is hereby acknowledged. Opinions expressed and conclusions arrived at, are those of the authors and are not necessarily to be attributed to the NRF. This work was part of a master's thesis by AC.
Supplementary Material
The Supplementary Material for this article can be found online at: https://www.frontiersin.org/articles/10.3389/frwa.2020.00027/full#supplementary-material
References
Bryant, L. D., Hsu-Kim, H., Gantzer, P. A., and Little, J. C. (2011). Solving the problem at the source: controlling Mn release at the sediment-water interface via hypolimnetic oxygenation. Water Res. 45, 6381–6392. doi: 10.1016/j.watres.2011.09.030
Carstens, A. (2018). The effect of dissolved oxygen on the development of manganese oxidizing - and reducing biofilms in the Lower Blyde Irrigation System. (dissertation/master's thesis). Stellenbosch University, Stellenbosch, South Africa.
Cerrato, J. M., Falkinham, J. O., Dietrich, A. M., Knocke, W. R., McKinney, C. W., and Pruden, A. (2010). Manganese-oxidizing and - reducing microorganisms isolated from biofilms in chlorinated drinking water systems. Water Res. 44, 3935–3945. doi: 10.1016/j.watres.2010.04.037
Department of Water Affairs and Forestry (DWAF) (1996). South African Water Quality Guidelines 2nd Edn, Vol. 4. Agricultural Use: Irrigation. Pretoria: CSIR Environmental Services.
Donlan, R. M. (2002). Biofilms: microbial life on surfaces. Emerg. Infect. Dis. 8, 881–890. doi: 10.3201/eid0809.020063
Dowding, C. E. (2004). Morphology, mineralogy and surface chemistry of manganiferous oxisols near Graskop, Mpumalanga Province, South Africa. (Master's Thesis). University of Stellenbosch, Stellenbosch, South Africa.
Du Toit, G., Blignaut, H., Theunissen, B., and Briggs, J. (2015). Biological Filtration for Sustainable Treatment of Groundwater With High Iron and Manganese Content – A Case Study From Overstrand Municipality. Availableonline at: https://www.imesa.org.za/wp-content/uploads/2015/11/Paper-14-Biological-filtration-for-sustainable-treatment-of-groundwater-with-high-iron-content-Geoff-du-Toit.pdf (accessed January 21, 2017).
Gantzer, P. A., Bryant, L. D., and Little, J. C. (2009). Controlling soluble iron and manganese in a water-supply reservoir using hypolimnetic oxygenation. Water Res. 43, 1285–1294. doi: 10.1016/j.watres.2008.12.019
Ghiorse, W. C. (1984). Biology of iron-and manganese-depositing bacteria. Annu. Rev. Microbiol. 38, 515–550. doi: 10.1146/annurev.mi.38.100184.002503
Jahn, A., Griebe, T., and Nielsen, P. H. (1999). Composition of Pseudomonas putida biofilms: accumulation of protein in the biofilm matrix. Biofouling 14, 49–57. doi: 10.1080/08927019909378396
Katsev, S., Chaillou, G., Sundby, B., and Mucci, A. (2007). Effects of progressive oxygen depletion on sediment diagenesis and fluxes: a model for the lower St. Lawrence River Estuary. Limnol. Oceanogr. 52, 2555–2568. doi: 10.4319/lo.2007.52.6.2555
Kielemoes, J., Bultinck, I., Storms, H., Boon, N., and Verstraete, W. (2002). Occurrence of manganese-oxidizing microorganisms and manganese deposition during biofilm formation on stainless steel in a brackish surface water. FEMS Microbiol. Ecol. 39, 41–55. doi: 10.1111/j.1574-6941.2002.tb00905.x
Liu, Y., and Tay, J. H. (2002). The essential role of hydrodynamic shear force in the formation of biofilm and granular sludge. Water Res. 36, 1653–1665. doi: 10.1016/S0043-1354(01)00379-7
Mouchet, P. (1992). From conventional to biological removal of iron and manganese in France. J Am Water Works Ass. 84, 158–167. doi: 10.1002/j.1551-8833.1992.tb07342.x
Nealson, K. H., and Myers, C. R. (1992). Minireview: microbial reduction of manganese and iron: new approaches to carbon cycling. Appl. Environ. Microbiol. 58, 439–443. doi: 10.1128/AEM.58.2.439-443.1992
Pereira, M. O., Kuehn, M., Wuertz, S., Neu, T., and Melo, L. F. (2002). Effects of flow regime on the architecture of a Pseudomonas fluorescens biofilm. Biotechnol. Bioeng. 78, 164–171. doi: 10.1002/bit.10189
Petrucci, R. H., Harwood, W. S., Herring, G. E., and Madura, J. (2007). General Chemistry: Principles and Modern Applications. Harlow: Prentice Hall.
Ramasamy, P., and Zhang, X. (2005). Effects of shear stress on the secretion of extracellular polymeric substances in biofilms. Water Sci. Technol. 52, 217–223. doi: 10.2166/wst.2005.0204
Tachikawa, M., Yamanaka, K., and Nakamuro, K. (2009). Studies on the disinfection and removal of biofilms by ozone water using an artificial microbial biofilm system. Ozone. Sci. Eng. 31, 3–9. doi: 10.1080/01919510802586566
Tebo, B. M., Johnson, H. A., McCarthy, J. K., and Templeton, A. S. (2005). Geomicrobiology of manganese (II) oxidation. Trends Microbiol. 13, 421–428. doi: 10.1016/j.tim.2005.07.009
Thamdrup, B., Glud, R. N., and Hansen, J. W. (1994). Manganese oxidation and in situ manganese fluxes from a coastal sediment. Geochim. Cosmochim. Acta. 58, 2563–2570. doi: 10.1016/0016-7037(94)90032-9
van Loosdrecht, M. C. M., Heijnen, J. J., Eberl, H., Kreft, J., and Picioreanu, C. (2002). Mathematical modelling of biofilm structures. Antonie Van Leeuwenhoek 81, 245–256. doi: 10.1023/A:1020527020464
van Vuuren, S. J., and van Dijk, M. (2012). Project K5/1820: Determination of the Change in Hydraulic Capacity in Pipelines. Pretoria: Report to Water Research Commission South Africa.
Webb, S. M., Dick, G. J., Bargar, J. R., and Tebo, B. M. (2005). Evidence for the presence of Mn(III) intermediates in the bacterial oxidation of Mn(II). Proc. Natl. Acad. Sci. U.S.A. 102, 5558–5563. doi: 10.1073/pnas.0409119102
Keywords: manganese, dissolved oxygen, biofilms, oxidation, pipeline, water
Citation: Carstens A, Bryant LD, Botes M and Wolfaardt GM (2020) Potential Role of Dissolved Oxygen and Manganese Concentration on the Development of Biofilms Causing Reduction in Hydraulic Capacity of a Gravity-Fed Irrigation System. Front. Water 2:27. doi: 10.3389/frwa.2020.00027
Received: 07 April 2020; Accepted: 24 July 2020;
Published: 10 September 2020.
Edited by:
Karsten Rinke, Helmholtz Centre for Environmental Research (UFZ), GermanyReviewed by:
Xiangzhen Kong, Helmholtz Centre for Environmental Research (UFZ), GermanyIsabel Douterelo, The University of Sheffield, United Kingdom
Copyright © 2020 Carstens, Bryant, Botes and Wolfaardt. This is an open-access article distributed under the terms of the Creative Commons Attribution License (CC BY). The use, distribution or reproduction in other forums is permitted, provided the original author(s) and the copyright owner(s) are credited and that the original publication in this journal is cited, in accordance with accepted academic practice. No use, distribution or reproduction is permitted which does not comply with these terms.
*Correspondence: Marelize Botes, bWJyQHN1bi5hYy56YQ==