 Hongxiang Yan
 Ning Sun
 Xiaodong Chen
 Mark S. Wigmosta1,3*
- 1Pacific Northwest National Laboratory, Earth Systems Science Division, Richland, WA, United States
- 2Pacific Northwest National Laboratory, Atmospheric Sciences and Global Change Division, Richland, WA, United States
- 3Department of Civil and Environmental Engineering, University of Washington, Seattle, WA, United States
National and international security communities (e.g., U.S. Department of Defense) have shown increasing attention for innovating critical infrastructure and installations due to recurring high-profile flooding events in recent years. The standard infrastructure design approach relies on local precipitation-based intensity-duration-frequency (PREC-IDF) curves that do not account for snow process and assume stationary climate, leading to high failure risk and increased maintenance costs. This paper reviews the recently developed next-generation IDF (NG-IDF) curves that explicitly account for the mechanisms of extreme water available for runoff including rainfall, snowmelt, and rain-on-snow under nonstationary climate. The NG-IDF curve is an enhancement to the PREC-IDF curve and provides a consistent design approach across rain- to snow-dominated regions, which can benefit engineers and planners responsible for designing climate-resilient facilities, federal emergency agencies responsible for the flood insurance program, and local jurisdictions responsible for developing design manuals and approving subsequent infrastructure designs. Further, we discuss the recent advances in climate and hydrologic science communities that have not been translated into actional information in the engineering community. To bridge the gap, we advocate that building climate-resilient infrastructure goes beyond the traditional local design scale where engineers rely on recipe-based methods only; the future hydrologic design is a multi-scale problem and requires closer collaboration between climate scientists, hydrologists, and civil engineers.
Introduction
Recurring high-profile flooding events (e.g., 2017 California) has led to major public safety concerns and motivated national security communities to explore new methods to innovate critical infrastructure (ESTCP, 2018). Currently, infrastructure design to withstand extreme flooding relies largely on precipitation-based intensity-duration-frequency (PREC-IDF) curves developed at the local scale, which is then coupled with single-event rainfall-runoff models such as the Technical Release 55 (TR-55) for estimating flood peaks, the so-called “standard IDF design workflow” (Cronshey et al., 1986; Chow et al., 1988). This PREC-IDF approach assumes that precipitation is in the form of rainfall that immediately starts the rainfall-runoff process. This assumption, however, can lead to significant underdesign risk in areas where snowmelt/rain-on-snow (ROS) are the dominant flood-generating mechanisms (e.g., the 2017 Oroville Dam crisis). Further, federal atlas's of PREC-IDF curves, such as the National Oceanic and Atmospheric Administration (NOAA) Atlas 14 (Bonnin et al., 2011), assume stationary climate, that is, the occurrence probability of extreme hydrometeorological events is not expected to change significantly within the service life of infrastructure. Given the strong evidence that climate-related hazards, including common engineering design criteria such as the 25-year storm magnitude and frequency, are no longer stationary over time (Wuebbles et al., 2014), the current hydrologic design standards are insufficient in the 21st century (Ragno et al., 2018; Wright et al., 2019).
In design practices, many surface water design manuals in the U.S. are based on the NOAA PREC-IDF curves, even in snow-dominated regions (SMMEW, 2004; SCDM, 2016). The earliest NOAA Atlas 14 product appeared for Ohio in 2004 and the latest product was for Texas in 2018 (Lopez-Cantu and Samaras, 2018). At present, the NOAA Atlas 14 is not available for the Pacific Northwest (PNW); Technical Paper 40 (Hershfield, 1961) is used instead and was developed from observations ending in the 1950s. Given the observed rapid increase in extreme precipitation (Kunkel et al., 2020), these products are becoming obsolete. For critical infrastructure with a design life often exceeding 30 years, even the latest 2018 atlas has become problematic because of the projected significant changes in extreme precipitation by 2050 (Prein et al., 2017). Currently, systematic, coordinated, and consistent surface water design manuals explicitly addressing snowmelt and nonstationary climate are not available. The recent federal guideline for flood frequency analysis, Bulletin 17C, acknowledges the significant implications of snowmelt and nonstationarity; however, it provides no explicit guidance (England et al., 2018). On the other hand, deficiencies of the standard PREC-IDF approach are well-known issues in climate and hydrologic science communities and coupled physically-based hydrologic and climate models have been applied to investigate multi-scale extreme hydrometeorological events and runoff generation mechanisms (Tohver et al., 2014). Despite significant advances made in science communities in the past decades, the current state of science has not translated into actionable information for engineers, and a gap still exists between science and engineering communities (ASCE, 2015).
This paper addresses the emerging need for a next-generation design tool by providing a review of the recently developed, science-driven “next-generation IDF” (NG-IDF) approach. In the following, Section “NG-IDF Curves vs. PREC-IDF Curves” describes the NG-IDF curves and Section “Physics-Based Hydrologic Modeling: Extending and Validating NG-IDF Curves” describes the physically-based hydrologic modeling approach to extend and validate NG-IDF curves” (i.e., advances in hydrologic science). Section “Nonstationary NG-IDF Curves Under Climate Change” describes the general circulation model (GCM) modeling approach to develop nonstationary NG-IDF curves (i.e., advances in climate science). Finally, Section “Discussion” discusses future opportunities and technology transfer.
NG-IDF Curves vs. PREC-IDF Curves
The authors (Yan et al., 2018) proposed the NG-IDF curves that characterize the actual amount of water reaching the land surface or “water available for runoff (W).” The W is estimated through land surface water balance as W = P−ΔSWE, where P indicates precipitation, and ΔSWE indicates changes in snow water equivalent (SWE). The W can be associated with multiple mechanisms, including rainfall on the snow-free ground, snowmelt without precipitation, ROS, and mixed rainfall and snowfall. By comparing the NG-IDF value with the PREC-IDF value for events with a specified duration and average recurrence interval (ARI), they evaluated the current design risk as (1) underdesign when the NG-IDF value is greater than the PREC-IDF value, (2) overdesign when the PREC-IDF value is greater than the NG-IDF value, and (3) proper design when the differences between the two values are trivial. Underdesign occurs when ROS/snowmelt intensity exceeds precipitation intensity (W > P), overdesign occurs when snowfall intensity exceeds snowmelt intensity (W < P), and proper design occurs when the snow has minor effects (W ≈ P).
The authors (Yan et al., 2018) first compared PREC-IDF and NG-IDF curves using Snowpack Telemetry (SNOTEL) measurements as a proof-of-concept, as even the most sophisticated hydrologic models cannot replace the observation record. SNOTEL is an automated system of snowpack and climate sensors installed in open mountainous areas of the western U.S. (WUS) and operated by the Natural Resources Conservation Service. They developed long-term bias-corrected quality-controlled (BCQC) P and SWE measurements from nearly 400 SNOTEL stations across the WUS to develop and compare PREC-IDF and NG-IDF curves. They found that the use of PREC-IDF curves can lead to underdesign at 45% of the sites. Most of the sites found to be underdesigned were in the PNW and continental regime that feature deeper snowpack and longer snow accumulation seasons. At these sites, the authors (Yan et al., 2019a) further compared the peak design flood estimates using NG-IDF and PREC-IDF curves coupled with the TR-55 rainfall-runoff model. They found that after the nonlinear runoff generation process, 70% of the sites were subject to underdesign and the PREC-IDF method underestimated peak design flood by as much as 324%.
By differentiating the precipitation phase using the change in SWE, the authors (Yan et al., 2018) also identified the dominant mechanism of extreme W at these sites, and found significant regional differences in flood-generating mechanisms across the WUS, e.g., the maritime regime is ROS dominated, and the continental regime is snowmelt dominated. The authors (Yan et al., 2019b) confirmed that this regional variability is associated with climate variability across the WUS, which includes air temperature, solar radiation, and atmospheric humidity. In the maritime regime that features high humidity, latent energy can warm the falling precipitation through condensation, leading to more frequent ROS events (Harpold and Brooks, 2018). In the continental regime that features high elevations, the late onset of above-freezing temperatures results in snowmelt in late spring, leading to high solar radiation (high solar angles) and large snowmelt events (Musselman et al., 2017).
Physics-Based Hydrologic Modeling: Extending and Validating NG-IDF Curves
The inclusion of snow processes in hydrologic design vastly increases the complexity of the problem over the PREC-IDF approach. Canopy interception and release of snowfall is significantly more complicated than for rainfall. The SNOTEL observations are limited in space and time and only available for the open condition. In this regard, Hamlet (2018) and the authors (Yan et al., 2020) advocated a need for well-validated physics-based model simulations to extend snow data in space, time, and for different land covers to provide comprehensive NG-IDF products that can be adapted to the standard IDF design workflow. A well-validated model is also critical for validating the NG-IDF approach in design flood estimates because streamflow in snow-dominated regions is poorly observed due to inherent difficulties of access (Lundquist et al., 2016).
To extend NG-IDF curves for different land covers beyond the bare ground of SNOTELs, the authors (Sun et al., 2018) enhanced the capability for modeling complex snow-canopy interactions within the framework of the Distributed Hydrology Soil Vegetation Model (DHSVM) (Wigmosta et al., 1994, 2002). In an extensive review of 30 hydrologic models, Beckers et al. (2009) showed that DHSVM is the best for hydrologic modeling in forest environments because of the detailed process representation of topographic and canopy control of the energy and mass exchange in a spatially distributed manner. The authors (Sun et al., 2018) enhanced DHSVM capability in featuring a subgrid representation of snow-canopy dynamics in canopy gaps by explicitly accounting for the impact of the surrounding canopy on the gap energy balance and generating spatially varied irradiance. The enhanced model was validated at the University of Idaho Experimental Forest and showed good agreement with subhourly SWE observations at open, dense canopy, and canopy gap sites, e.g., correlation of determinations (R2) were >0.9. This validated model lays the foundation for developing NG-IDF curves in complex land cover conditions (e.g., consistent with TR-55 land cover classification).
To extend NG-IDF curves in time and space beyond the limited coverage of the SNOTEL data, the authors (Sun et al., 2019) developed and validated regionally coherent DHSVM snow parameters. By using the BCQC SNOTEL data at 246 sites over the WUS, the authors (Sun et al., 2019) performed a generalized sensitivity test for the DHSVM snow model and identified sensitive snow parameters that control daily SWE evolution under diverse climate regimes. Regional parameters were then developed for these sensitive snow parameters for eight ecoregions (CEC, 2009) characterized by a distinct hydroclimatic regime across the WUS. The regional snow parameters were evaluated at individual SNOTEL sites and the validation results ensured that regional snow parameters were able to capture daily variations in SWE obversions, e.g., the simulation of daily SWE had Nash-Sutcliffe efficiency (NSE) >0.8 at 83% of the sites. These regional snow parameters lay the foundation for developing NG-IDF curves at ungauged sites at regional to continental scale.
To validate the NG-IDF approach in design flood estimates, the authors (Yan et al., 2020) developed an experimental hillslope appropriate for mountainous topography to allow direct comparison between the DHSVM continuous simulation and NG-IDF approach. They applied the same experimental hillslope at these 246 SNOTEL sites to examine and compare the performances of the NG-IDF approach across the WUS under various hydroclimate conditions. They used the aforementioned well-validated DHSVM continuous streamflow simulations as a performance benchmark with explicit uncertainty quantification. By comparing the design flood estimates from NG-IDF curves coupled with the TR-55 model and DHSVM streamflow frequency statistics, they suggested that the NG-IDF approach provided a satisfactory performance in design flood estimates in different hydroclimate regimes of the WUS, e.g., the averaged error over the WUS in design flood estimates was <15%. This validation study facilitates NG-IDF technology transfer and implementation practice.
Nonstationary NG-IDF Curves Under Climate Change
Instead of focusing on changes in extreme precipitation only, nonstationary NG-IDF curves further require an understanding of changes in extreme snowmelt and ROS events. Global warming will lead to a shift in rain-snow ratio and increase soil freeze-thaw cycles, resulting in more frequent ROS events and higher flood risk at higher elevations in the future (Beniston and Stoffel, 2016; Musselman et al., 2018; Li et al., 2019). Using the BCQC SNOTEL data, the authors (Yan et al., 2019b) examined the changes in snow process and frequency of ROS events over 1979–2017. They found statistically significant trends toward declining and earlier snowmelt over the WUS. Specifically, annual maximum snowmelt decreased by 21% averaged across the snowy regions of the WUS, and the frequency of ROS events increased by 32% averaged in the northwestern U.S. The changes in snowpack and extreme W events under future climate can be better understood with the use of climate model projections.
Despite GCMs providing useful information at global and climatic scales, they cannot present some fine-scale weather systems that are critical in the formation of precipitation given their relatively coarse resolution. To make these projections useful in hydrological design, they need to be downscaled to a finer resolution, through either a statistical or dynamical process. Statistical downscaling is computationally efficient but depends upon choices of predictors and suffers from the possible change of predictor-predictand relationship under future climate (Fowler et al., 2007). On the contrary, dynamical downscaling uses regional climate simulation to resolve the atmospheric processes but is computationally intense (Chen et al., 2018). Currently, there are two approaches to develop nonstationary NG-IDF curves: (1) top-down method using GCMs and hydrologic models (Clark et al., 2016; Hou et al., 2019) and (2) statistical modeling with time-varying parameters (Cheng and AghaKouchak, 2014; Ren et al., 2019). The first approach physically simulates both climate and hydrological processes; however, the outcome is subject to a cascade of uncertainties that arise from assumptions in each step of the modeling chain. The second approach is straightforward, yet the extrapolation of parameter trends into the future should be cautious because it is not known when or where the change point may occur.
Figure 1A presents the top-down end-to-end modeling chain that connects emission scenarios to next-generation design tools and Figures 1B,C present the associated steps to develop both stationary and nonstationary PREC-IDF and NG-IDF curves. The top-down modeling chain includes eight uncertainty sources: (1) climate change scenario, (2) global model structure, (3) internal climate variability, (4) downscaling method, (5) hydrologic model structure, (6) hydrologic model parameter, (7) statistical model structure, and (8) statistical model parameter. Characterizing and reducing uncertainties remains challenging and requires improving process understanding and increasing computational resources.
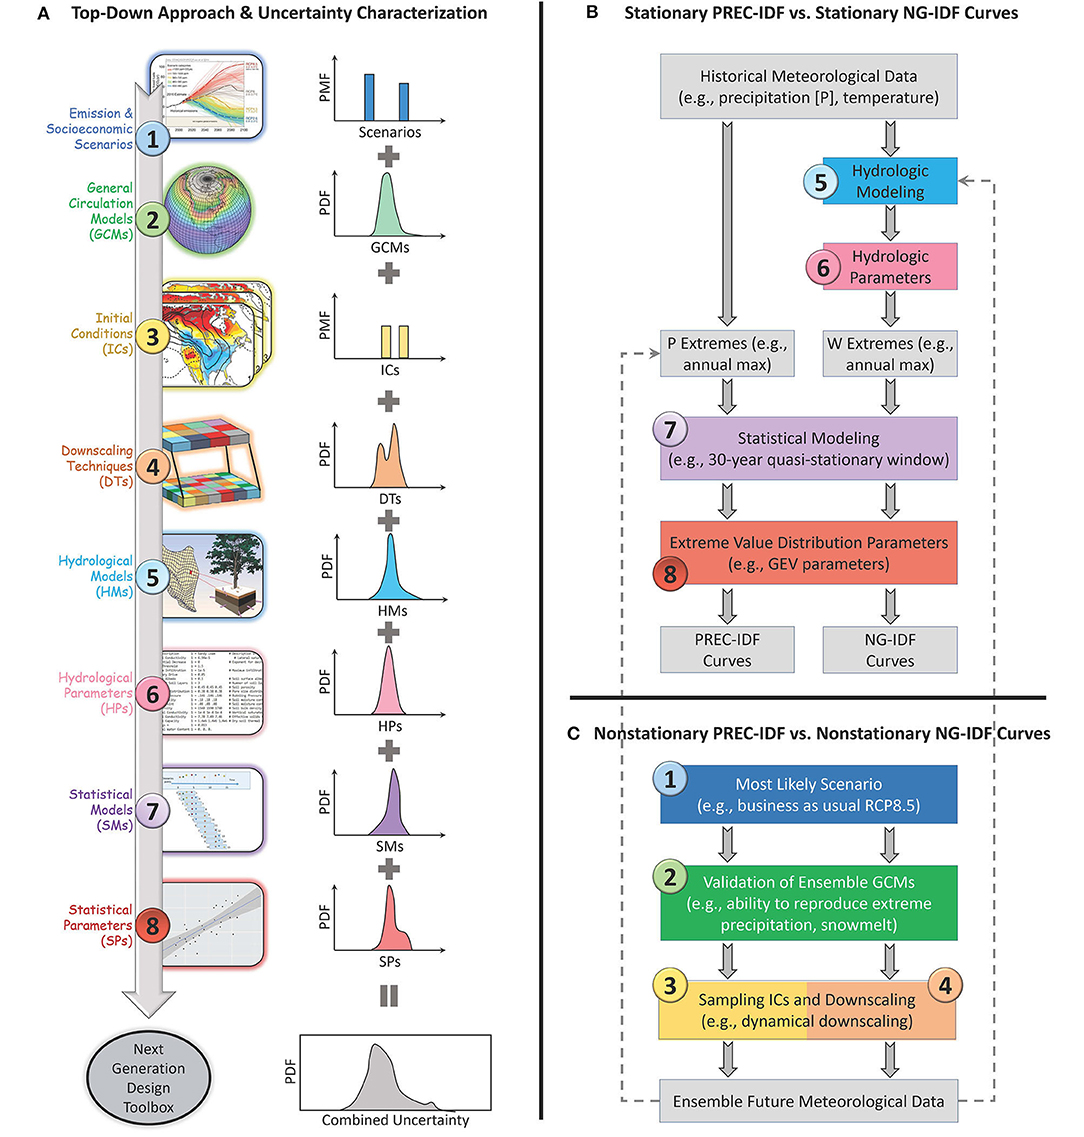
Figure 1. (A) Top-down approach to develop nonstationary next-generation hydrologic design toolbox. To make the projection actionable to engineers, deliberate approaches are necessary to characterize and reduce uncertainties in each step. The final nonstationary design toolbox should be probabilistic (i.e., projections of the most likely, the least, and worst cases) and adapted to the standard risk management design framework. (B) Developing stationary PREC-IDF and NG-IDF curves following the top-down approach. (C) Developing nonstationary PREC-IDF and NG-IDF curves following the top-down approach.
Based on the top-down method, the authors (Hou et al., 2019) developed nonstationary NG-IDF curves for two Department of Defense (DoD) mountainous sites: Fort Carson in Colorado and Marine Corps Mountain Warfare Training Center in California. Using the Weather Research and Forecasting (WRF) model (Skamarock et al., 2008) to dynamically downscale phase 5 of the Coupled Model Intercomparison Project (CMIP5) Community Earth System Model (CESM), the authors (Hou et al., 2019) developed nonstationary NG-IDF curves at the two DoD sites through the end of 21 century under the representative concentration pathway RCP4.5 and RCP8.5 scenarios. If NG-IDF curves are used while ignoring climate nonstationarity, the resulting projections showed that the two DoD installations are at risk for underdesign by up to 80% through the end of the century. This result, however, has large uncertainty because it was based on one GCM using one initial condition. Dynamically downscaled ensemble simulation is desired and undergoing in our next study.
Discussion
Currently, a systematic and consistent local surface water design manual is not available for snow-dominated regions of the U.S. The documented “recipe-based” methods vary from the “blind method” of simply using the PREC-IDF curves to the “tuning factor method” of adding a snowmelt factor to the PREC-IDF curves. For example, Snohomish County in Washington State extends from the Puget Sound lowland to the crest of the Cascade Range. Despite Snohomish County's large portion of snow-dominated regions, the Snohomish County Drainage Manual still recommends the use of NOAA PREC-IDF curves for hydrologic design such as wetpool treatment facilities (SCDM, 2016). Chelan County in Washington State, located in the snow-dominated regions of the Eastern Cascade Ranges, follows the turning factor method in the Stormwater Management Manual for Eastern Washington (SMMEW, 2004). Data to support this method, however, are only available for nine sites and are based on several implicit assumptions (e.g., snow will melt during a 72-h ROS). Alternatively, the federal Unified Facilities Criteria (UFC) recommends using PREC-IDF curves for small infrastructure design such as detention pond and using a hydrologic model such as the Storm Water Management Model for large, high-risk design projects (UFC, 2013).
Despite significant efforts that have been made in physics-based climate and hydrologic modeling over the past decades, advances in hydrologic and climate science communities have not been broadly translated into actionable information in engineering communities. One possible reason is that the use of a physics-based, coupled hydrologic and climate model can be cost-prohibitive in the design of local smaller infrastructure, such as highway culverts or residential drainage systems. Another more important reason is the required adherence to local surface water design manuals. Updating design manuals is a complex process that may take years to accomplish. Therefore, technology transfer is critical to bridge the gap and a new science-driven engineering tool that can be adapted to the current standard codes is most likely to be implemented and considered in the following updated design manual.
To provide a consistent IDF design method for both rain-dominated and snow-dominated regions, we proposed the NG-IDF curves that captured multiple flood-generating mechanisms including rainfall, snowmelt, and ROS. The NG-IDF curve is a science-driven engineering product from the collaboration between climate scientists, hydrologists, and civil engineers. Climate scientists used the WRF model to dynamically downscale GCM simulations and understand the atmospheric mechanism of extreme precipitation; hydrologists used DHSVM to simulate snow process and understand dominant mechanisms of extreme water available for runoff and also worked with civil engineers on technology transfer such as adaption to the standard IDF design flow by including snow process into IDF curves (i.e., NG-IDF) and validation sites selection (i.e., the aforementioned two DoD sites).
Looking forward, there is an increasing awareness that hydrologic design under nonstationary climate is a multi-scale problem and requires the linkage across scales, such as linking global-scale atmospheric circulation to regional-sale water flux, linking watershed-scale hydrological processes to design-scale flood response (Figure 2A). This process-oriented hydrologic design will require a shift in thinking from a purely statistical inference problem to a broader understanding of physical flood-generating mechanisms at both watershed and synoptic scales (Milly et al., 2008; Mailhot and Duchesne, 2010; Arnbjerg-Nielsen et al., 2013; Chester et al., 2020; Cook et al., 2020).
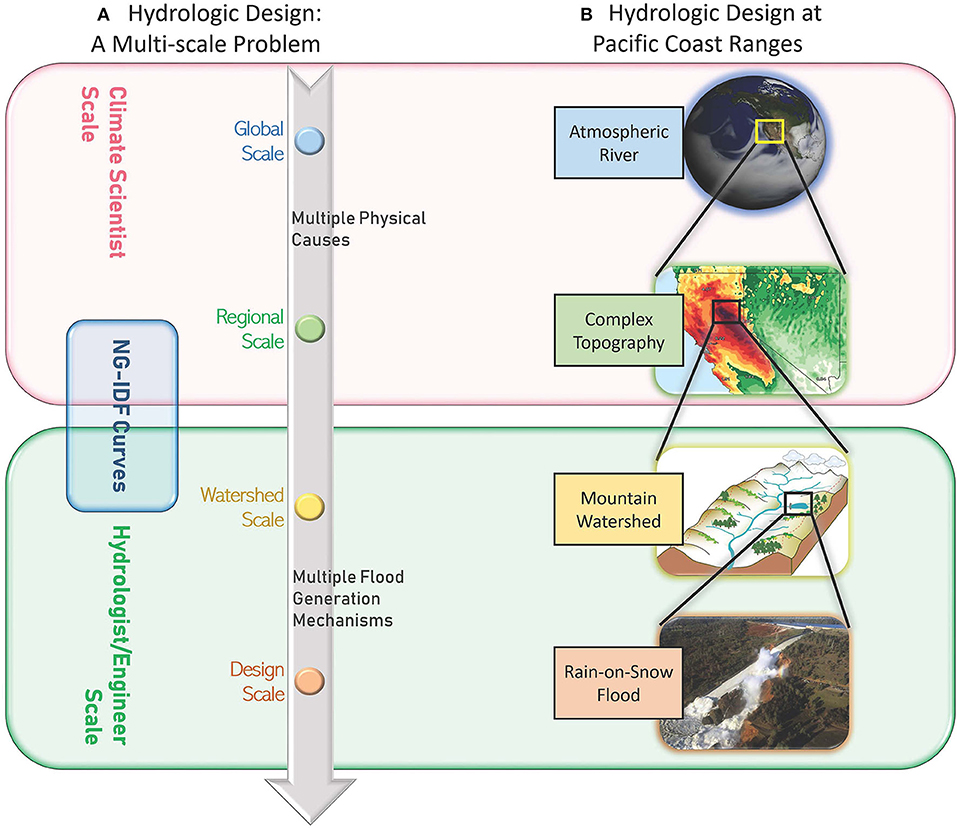
Figure 2. (A) Illustration of hydrologic design under nonstationary climate: a multi-scale problem that links climate scientists, hydrologists, and engineers. (B) An example of a flooding event at the Sierra Nevada caused by rain-on-snow at watershed-scale and atmospheric river at global-scale.
In Figure 2B, the authors (Chen et al., 2018) suggested that atmospheric rivers (ARs), a long and narrow band of intense moisture transport, is a key predictor of extreme precipitation occurrence and magnitude in the WUS watersheds. The authors (Chen et al., 2019a) also found out that ARs are the main driver of ROS events and responsible for 11–20% of intense snowmelt events in Pacific Coast Ranges. Further, the authors (Chen et al., 2019b) provided a comprehensive evaluation of land surface energy and hydrologic responses to ARs over the WUS. They identified that strong radiation and warm air temperature during ARs enhanced snow ablation and increased the likelihood and strength of ROS. Therefore, projecting future design floods for Pacific Coast Ranges not only requires a better understanding of extreme precipitation change but also the interacted change of AR storms on snowpack.
Data Availability Statement
The datasets generated for this study can be found in online repositories. The names of the repository/repositories and accession number(s) can be found below: https://dhsvm.pnnl.gov/.
Author Contributions
HY, NS, and XC drafted the manuscript. MW was the Principle Investigator. All authors contributed to the article and approved the submitted version.
Funding
This material is based upon work supported by the Strategic Environmental Research and Development Program under Contract No. RC-2546.
Conflict of Interest
The authors declare that the research was conducted in the absence of any commercial or financial relationships that could be construed as a potential conflict of interest.
Acknowledgments
Battelle Memorial Institute operates the Pacific Northwest National Laboratory for the U.S. Department of Energy under contract DE-AC06-76RLO-1830.
References
Arnbjerg-Nielsen, K., Willems, P., Olsson, J., Beecham, S., Pathirana, A., Bülow Gregersen, I., et al. (2013). Impacts of climate change on rainfall extremes and urban drainage systems: a review. Water Sci. Technol. 68, 16–28. doi: 10.2166/wst.2013.251
ASCE (2015). “Adapting infrastructure and civil engineering practice to a changing climate,” in: Technical Report, ed. J. R. Olsen (Reston, VA: American Society of Civil Engineers; Committee on Adaptation to a Changing Climate). Available online at: https://ascelibrary.org/doi/book/10.1061/9780784479193 (accessed October 10, 2018).
Beckers, J., Smerdon, B., and Wilson, M. (2009). Review of Hydrologic Models for Forest Management and Climate Change Applications in British Columbia and Alberta. Kamloops, British Columbia: Forum for Research and Extension in Natural Resources Society.
Beniston, M., and Stoffel, M. (2016). Rain-on-snow events, floods and climate change in the Alps: events may increase with warming up to 4°C and decrease thereafter. Sci. Total Environ. 571, 228–236. doi: 10.1016/j.scitotenv.2016.07.146
Bonnin, G. M., Martin, D., Lin, B., Parzybok, T., Yekta, M., and Riley, D. (2011). Precipitation-Frequency Atlas of the United States, NOAA Atlas 14. vol. 1, version 5.0. Silver Spring, MD: U.S. Department of Commerce, National Oceanic and Atmospheric Administration.
CEC (2009). Ecological Regions of North America, Level III. Corvallis, OR: Commission for Environmental Cooperation.
Chen, X., Duan, Z., Leung, L. R., and Wigmosta, M. (2019a). A framework to delineate precipitation-runoff regimes: precipitation versus snowpack in the Western United States. Geophys. Res. Lett. 46, 13044–13053. doi: 10.1029/2019GL085184
Chen, X., Leung, L. R., Gao, Y., Liu, Y., Wigmosta, M., and Richmond, M. (2018). Predictability of extreme precipitation in Western U.S. watersheds based on atmospheric river occurrence, intensity, and duration. Geophys. Res. Lett. 45, 11693–11701. doi: 10.1029/2018GL079831
Chen, X., Leung, L. R., Wigmosta, M., and Richmond, M. (2019b). Impact of atmospheric rivers on surface hydrological processes in Western U.S. watersheds. J. Geophys. Res. Atmos. 124, 8896–8916. doi: 10.1029/2019JD030468
Cheng, L., and AghaKouchak, A. (2014). Nonstationary precipitation intensity-duration-frequency curves for infrastructure design in a changing climate. Sci. Rep. 4:7093. doi: 10.1038/srep07093
Chester, M. V., Underwood, B. S., and Samaras, C. (2020). Keeping infrastructure reliable under climate uncertainty. Nat. Clim. Chang. 10, 488–490. doi: 10.1038/s41558-020-0741-0
Clark, M. P., Wilby, R. L., Gutmann, E. D., Vano, J. A., Gangopadhyay, S., Wood, A. W., et al. (2016). Characterizing uncertainty of the hydrologic impacts of climate change. Curr. Clim. Chang. Rep. 2, 55–64. doi: 10.1007/s40641-016-0034-x
Cook, L. M., McGinnis, S., and Samaras, C. (2020). The effect of modeling choices on updating intensity-duration-frequency curves and stormwater infrastructure designs for climate change. Clim. Change 159, 289–308. doi: 10.1007/s10584-019-02649-6
Cronshey, R., McCuen, R. H., Miller, N., Rawls, W., Robbins, S., and Woodward, D. (1986). Urban Hydrology for Small Watersheds—TR-55. Washington, DC: U.S. Department of Agriculture.
England, J. F. Jr., Cohn, T. A., Faber, B. A., Stedinger, J. R., Thomas, W. O. Jr., et al. (2018). Guidelines for Determining Flood Flow frequency—Bulletin 17C. U.S. Geological Survey Techniques and Methods, Reston, VA: U.S. Geological Survey.
ESTCP (2018). Nonstationary Weather Patterns and Extreme Events: Informing Design and Planning for Long-Lived Infrastructure. Project RC-201591. ESTCP. Available online at: https://www.serdp-estcp.org/News-and-Events/Blog/Nonstationary-Weather-Patterns-and-Extreme-Events-Workshop-Report (accessed April 23, 2018).
Fowler, H. J., Blenkinsop, S., and Tebaldi, C. (2007). Linking climate change modelling to impacts studies: recent advances in downscaling techniques for hydrological modelling. Int. J. Climatol. 27, 1547–1578. doi: 10.1002/joc.1556
Hamlet, A. F. (2018). New observed data sets for the validation of hydrology and land surface models in cold climates. Water Resour. Res. 54, 5190–5197. doi: 10.1029/2018WR023123
Harpold, A. A., and Brooks, P. D. (2018). Humidity determines snowpack ablation under a warming climate. Proc. Natl. Acad. Sci. 115, 1215–1220. doi: 10.1073/pnas.1716789115
Hershfield, D. M. (1961). Rainfall Frequency Atlas of the United States for Durations From 30 Minutes to 24 Hours and Return Periods From 1-100 Years. Washington, DC: Weather Bureau, Department of Commerce.
Hou, Z., Ren, H., Sun, N., Wigmosta, M. S., Liu, Y., Leung, L. R., et al. (2019). Incorporating climate nonstationarity and snowmelt processes in intensity–duration–frequency analyses with case studies in mountainous areas. J. Hydrometeorol. 20, 2331–2346. doi: 10.1175/JHM-D-19-0055.1
Kunkel, K. E., Karl, T. R., Squires, M. F., Yin, X., Stegall, S. T., and Easterling, D. R. (2020). Precipitation extremes: trends and relationships with average precipitation and precipitable water in the contiguous United States. J. Appl. Meteorol. Climatol. 59, 125–142. doi: 10.1175/JAMC-D-19-0185.1
Li, D., Lettenmaier, D. P., Margulis, S. A., and Andreadis, K. (2019). The role of rain-on-snow in flooding over the conterminous United States. Water Resour. Res. 55, 8492–8513. doi: 10.1029/2019WR024950
Lopez-Cantu, T., and Samaras, C. (2018). Temporal and spatial evaluation of stormwater engineering standards reveals risks and priorities across the United States. Environ. Res. Lett. 13:074006. doi: 10.1088/1748-9326/aac696
Lundquist, J. D., Roche, J. W., Forrester, H., Moore, C., Keenan, E., Perry, G., et al. (2016). Yosemite hydroclimate network: distributed stream and atmospheric data for the Tuolumne River watershed and surroundings. Water Resour. Res. 52, 7478–7489. doi: 10.1002/2016WR019261
Mailhot, A., and Duchesne, S. (2010). Design criteria of urban drainage infrastructures under climate change. J. Water Resour. Plan. Manag. 136, 201–208. doi: 10.1061/(ASCE)WR.1943-5452.0000023
Milly, P. C. D., Betancourt, J., Falkenmark, M., Hirsch, R. M., Kundzewicz, Z. W., Lettenmaier, D. P., et al. (2008). Stationarity is dead: whither water management? Science 319, 573–574. doi: 10.1126/science.1151915
Musselman, K. N., Clark, M. P., Liu, C., Ikeda, K., and Rasmussen, R. (2017). Slower snowmelt in a warmer world. Nat. Clim. Chang. 7, 214–219. doi: 10.1038/nclimate3225
Musselman, K. N., Lehner, F., Ikeda, K., Clark, M. P., Prein, A. F., Liu, C., et al. (2018). Projected increases and shifts in rain-on-snow flood risk over western North America. Nat. Clim. Chang. 8, 808–812. doi: 10.1038/s41558-018-0236-4
Prein, A. F., Rasmussen, R. M., Ikeda, K., Liu, C., Clark, M. P., and Holland, G. J. (2017). The future intensification of hourly precipitation extremes. Nat. Clim. Chang. 7, 48–52. doi: 10.1038/nclimate3168
Ragno, E., AghaKouchak, A., Love, C. A., Cheng, L., Vahedifard, F., and Lima, C. H. R. (2018). Quantifying changes in future intensity-duration-frequency curves using multimodel ensemble simulations. Water Resour. Res. 54, 1751–1764. doi: 10.1002/2017WR021975
Ren, H., Hou, Z. J., Wigmosta, M., Liu, Y., and Leung, L. R. (2019). Impacts of spatial heterogeneity and temporal non-stationarity on intensity-duration-frequency estimates—A case study in a mountainous California-Nevada watershed. Water 11:1296. doi: 10.3390/w11061296
SCDM (2016). Snohomish County Drainage Manual Volume III Hydrologic Analysis and Flow Control BMPs. Available online at: https://snohomishcountywa.gov/1130/Drainage-Manual (accessed March 5, 2018).
Skamarock, W. C., Klemp, J. B., Dudhia, J., Gill, D. O., Barker, D. M., Duda, M. G., et al. (2008). A Description of the Advanced Research WRF Version 3 Tech. Rep. NCAR/TN-475+STR. Boulder, CO: National Center for Atmospheric Research.
SMMEW (2004). Stormwater Management Manual for Eastern Washington. Washington State Department of Ecology. Available online at: https://fortress.wa.gov/ecy/publications/documents/0410076.pdf (accessed March 5, 2018).
Sun, N., Wigmosta, M., Zhou, T., Lundquist, J., Dickerson-Lange, S., and Cristea, N. (2018). Evaluating the functionality and streamflow impacts of explicitly modelling forest-snow interactions and canopy gaps in a distributed hydrologic model. Hydrol. Process. 32, 2128–2140. doi: 10.1002/hyp.13150
Sun, N., Yan, H., Wigmosta, M. S., Leung, L. R., Skaggs, R., and Hou, Z. (2019). Regional snow parameters estimation for large-domain hydrological applications in the Western United States. J. Geophys. Res. Atmos. 124, 5296–5313. doi: 10.1029/2018JD030140
Tohver, I. M., Hamlet, A. F., and Lee, S.-Y. (2014). Impacts of 21st-century climate change on hydrologic extremes in the Pacific Northwest region of North America. J. Am. Water Resour. Assoc. 50, 1461–1476. doi: 10.1111/jawr.12199
UFC (2013). Surface Drainage Design (150/5320-5D). Washington, DC: U.S. Department of Transportation, Federal Aviation Administration. Available online at: https://www.faa.gov/documentLibrary/media/Advisory_Circular/150_5320_5d.pdf (accessed August 11, 2017).
Wigmosta, M. S., Nijssen, B., and Storck, P. (2002). “The distributed hydrology soil vegetation model,” in Mathematical Models of Small Watershed Hydrology and Applications, ed. V. P. Singh (Highlands Ranch, Colorado: Water Resources Publication), 7–42.
Wigmosta, M. S., Vail, L. W., and Lettenmaier, D. P. (1994). A distributed hydrology-vegetation model for complex terrain. Water Resour. Res. 30, 1665–1679. doi: 10.1029/94WR00436
Wright, D. B., Bosma, C. D., and Lopez-Cantu, T. (2019). U.S. hydrologic design standards insufficient due to large increases in frequency of rainfall extremes. Geophys. Res. Lett. 46, 8144–8153. doi: 10.1029/2019GL083235
Wuebbles, D., Meehl, G., Hayhoe, K., Karl, T. R., Kunkel, K., Santer, B., et al. (2014). CMIP5 climate model analyses: climate extremes in the United States. Bull. Am. Meteorol. Soc. 95, 571–583. doi: 10.1175/BAMS-D-12-00172.1
Yan, H., Sun, N., Wigmosta, M., Leung, L. R., Hou, Z., Coleman, A., et al. (2020). Evaluating next-generation intensity–duration–frequency curves for design flood estimates in the snow-dominated western United States. Hydrol. Process. 34, 1255–1268. doi: 10.1002/hyp.13673
Yan, H., Sun, N., Wigmosta, M., Skaggs, R., Hou, Z., and Leung, L. R. (2019a). Next-generation intensity–duration–frequency curves to reduce errors in peak flood design. J. Hydrol. Eng. 24:04019020. doi: 10.1061/(ASCE)HE.1943-5584.0001799
Yan, H., Sun, N., Wigmosta, M., Skaggs, R., Hou, Z., and Leung, R. (2018). Next-generation intensity-duration-frequency curves for hydrologic design in snow-dominated environments. Water Resour. Res. 54, 1093–1108. doi: 10.1002/2017WR021290
Keywords: NG-IDF curves, snowmelt, rain-on-snow, floods, nonstationarity, extreme events, atmospheric river, DHSVM
Citation: Yan H, Sun N, Chen X and Wigmosta MS (2020) Next-Generation Intensity-Duration-Frequency Curves for Climate-Resilient Infrastructure Design: Advances and Opportunities. Front. Water 2:545051. doi: 10.3389/frwa.2020.545051
Received: 23 March 2020; Accepted: 09 November 2020;
Published: 03 December 2020.
Edited by:
Abhishek Gaur, National Research Council Canada (NRC-CNRC), CanadaReviewed by:
Andre Schardong, Western University, CanadaLauren Cook, Swiss Federal Institute of Aquatic Science and Technology, Switzerland
Copyright © 2020 Yan, Sun, Chen and Wigmosta. This is an open-access article distributed under the terms of the Creative Commons Attribution License (CC BY). The use, distribution or reproduction in other forums is permitted, provided the original author(s) and the copyright owner(s) are credited and that the original publication in this journal is cited, in accordance with accepted academic practice. No use, distribution or reproduction is permitted which does not comply with these terms.
*Correspondence: Hongxiang Yan, aG9uZ3hpYW5nLnlhbkBwbm5sLmdvdg==; Mark S. Wigmosta, bWFyay53aWdtb3N0YUBwbm5sLmdvdg==