 Hannah N. Checketts1
 Gregory T. Carling1*Diego P. Fernandez2Stephen T. Nelson1Kevin A. Rey1David G. Tingey1Colin A. Hale1Brian N. Packer1Cameron P. Cordner1Dylan B. Dastrup1
 Zachary T. Aanderud3
- 1Department of Geological Sciences, Brigham Young University, Provo, UT, United States
- 2Department of Geology & Geophysics, University of Utah, Salt Lake City, UT, United States
- 3Department of Plant & Wildlife Sciences, Brigham Young University, Provo, UT, United States
The Critical Zone is an important source of trace elements to headwater streams during the snowmelt runoff period, yet the mechanisms of trace element release are poorly characterized. To evaluate changes in water chemistry in response to snowmelt, we measured trace element and major ion concentrations at three sites in the upper Provo River in northern Utah, USA, over a 5-year period spanning years with below-and above-average discharge. We also sampled snowpack, ephemeral streams, and soil water to investigate trace element sources. The river drains siliciclastic bedrock above the upper site, carbonate rocks between the upper and middle sites, and volcanic rocks between the middle and lower sites, with minimal anthropogenic impacts in the watershed. Concentrations of specific trace metals (Be, Al, Cu, and Pb) and rare earth elements (represented by La and Y) increased during snowmelt runoff each year at all three sites, with decreasing concentrations from upstream to downstream. In contrast, major ion concentrations, including Ca2+ and , were similar year–round at the upper site and were diluted during snowmelt at the lower sites, with increasing concentrations from upstream to downstream. The snowmelt runoff period (April–June) accounted for >84% of the annual trace element loading, with most trace element inputs occurring above the upper sampling site. Concentration–discharge (C–Q) relationships revealed variations in solute behavior from upstream to downstream. For example, at the upstream site the trace elements had a slight positive slope in log C–log Q space, while Ca2+ and had zero slope. At the downstream sites, the trace elements had a strong positive slope and Ca2+ and had a negative slope. Trace element concentrations were relatively low in snowpack but elevated in ephemeral streams and soil water, suggesting that flushing of shallow soils by snowmelt causes increased trace element concentrations with positive C–Q relationships in the upper part of the river. Trace element loads propagate downstream where concentrations are diluted by groundwater inputs from carbonate bedrock. Our results demonstrate that soil water flushing in the Critical Zone at the headwaters of mountain streams is an important control on downstream water chemistry.
Introduction
Snowmelt–fed river systems exhibit seasonal changes in water chemistry, with increased fluxes of trace elements during snowmelt runoff (Shafer et al., 1997; Rember and Tefrey, 2004; Ogendi et al., 2007; Carling et al., 2015). The seasonal changes in water chemistry of snow dominated watersheds may be detrimental to water supplies impacting up to one–sixth of the world's population (Barnett et al., 2008). The mechanisms for transferring solutes from the watershed to mountain streams are not well-understood, especially for soil–vs. rock–derived solutes and over seasonal timeframes (Brooks et al., 2015). Further, the transfer of solutes along longitudinal profiles from headwater streams to higher order rivers is under-studied as most research has focused on a single site within a river system (Godsey et al., 2009).
The Critical Zone, extending from shallow soils to deeper permeable bedrock, is the primary source of solutes to stream systems (Chorover et al., 2017). The Critical Zone releases solutes to groundwater by weathering of bedrock and soils through seasonally dynamic deep- and shallow-flow paths. The composition of soils in montane watersheds is typically a mixture of weathered bedrock and aeolian dust, which provides allochthonous trace elements that alter snowpack and soil composition (Carling et al., 2012; Munroe, 2014; Reynolds et al., 2014). Shallow groundwater following quick flow paths more likely contains a soil-like water chemistry signature rich in dissolved organic matter (DOM), mineral colloids, and trace elements not found in the local bedrock, while deeper groundwater following long flow paths more likely resembles the chemistry of weathered bedrock (Chorover et al., 2017). The relative fraction of water inputs from shallow vs. deep flow paths changes during hydrologic events, such as snowmelt runoff, thereby altering stream water chemistry (Brooks et al., 2015).
The water chemistry response to changing discharge is often investigated using concentration–discharge (C–Q) plots. C–Q relationships provide information on solute availability and sources within a watershed (Williams, 1989; Evans and Davies, 1998; Godsey et al., 2009; Lloyd et al., 2016). The C–Q slope may reveal chemostatic behavior (no change in concentration with discharge), flushing (increasing concentrations with increased discharge), or dilution (decreasing concentrations with increased discharge) (Creed et al., 2015). While numerous studies have investigated C–Q relationships for major ions, suspended sediments, and nutrients, relatively few have examined C–Q relationships for trace elements (Trostle et al., 2016; Mcintosh et al., 2017). Trace element C–Q relationships, which often demonstrate flushing behavior, are useful for describing flow pathways, colloid transport, and hydrologic connectivity during snowmelt runoff (Aguirre et al., 2017).
The purpose of our study is to investigate the mechanisms for transferring trace elements from the Critical Zone to an alpine stream. Specific objectives are to: (1) characterize changes in water chemistry in response to increasing discharge during snowmelt runoff; (2) evaluate C–Q relationships for chemostatic or chemodynamic behavior; (3) characterize changes in C–Q patterns from upstream to downstream across a longitudinal transect in a nested catchment; and (4) identify sources of trace elements and major ions in the watershed. The upper Provo River watershed in the Uinta Mountains of northern Utah was selected for this study because it is a relatively pristine snowmelt-dominated montane watershed with a network of real-time water quality, snowpack, and discharge measurements. The Provo River supplies drinking water to over half of Utah's population. Our study builds on previous work investigating natural and anthropogenic sources of trace elements to the river system (Carling et al., 2015) and mercury/DOM dynamics in the upper Provo River (Packer et al., 2020).
Materials and Methods
Upper Provo River Watershed Study Area
The upper Provo River watershed is primarily fed by high elevation snowmelt from the Uinta Mountains. Three established monitoring locations in the watershed are located (from upstream to downstream) at Soapstone, Woodland, and Hailstone (Figure 1). The watershed covers 675 km2 and receives supplemental water diverted from the Duchesne River watershed (104 km2) above the Soapstone site and Weber River watershed (589 km2) above the Hailstone site (Figure 1). The upper Provo River extends ~50 km with a vertical drop of 1,000 m, from 2,900 m asl at Trial Lake to 1,900 m asl at Jordanelle Reservoir. The geology of the upper part of the watershed above Soapstone consists of interbedded siliciclastic rocks (mainly quartz arenite with minor interbedded shales) (Condie et al., 2001; Dehler et al., 2006) overlain by surficial glacial and alluvial deposits (Figure 1). Shallow, weakly developed soils with a thin loess cap cover much of the alpine area of the watershed (Munroe et al., 2015). The lower part of the watershed contains Paleozoic carbonate rocks between Soapstone and Woodland and Tertiary volcanic rocks between Woodland and Hailstone. The watershed is mostly undeveloped except for small roads and campgrounds at the top of the watershed and a minor amount of agricultural land use at the bottom of the watershed.
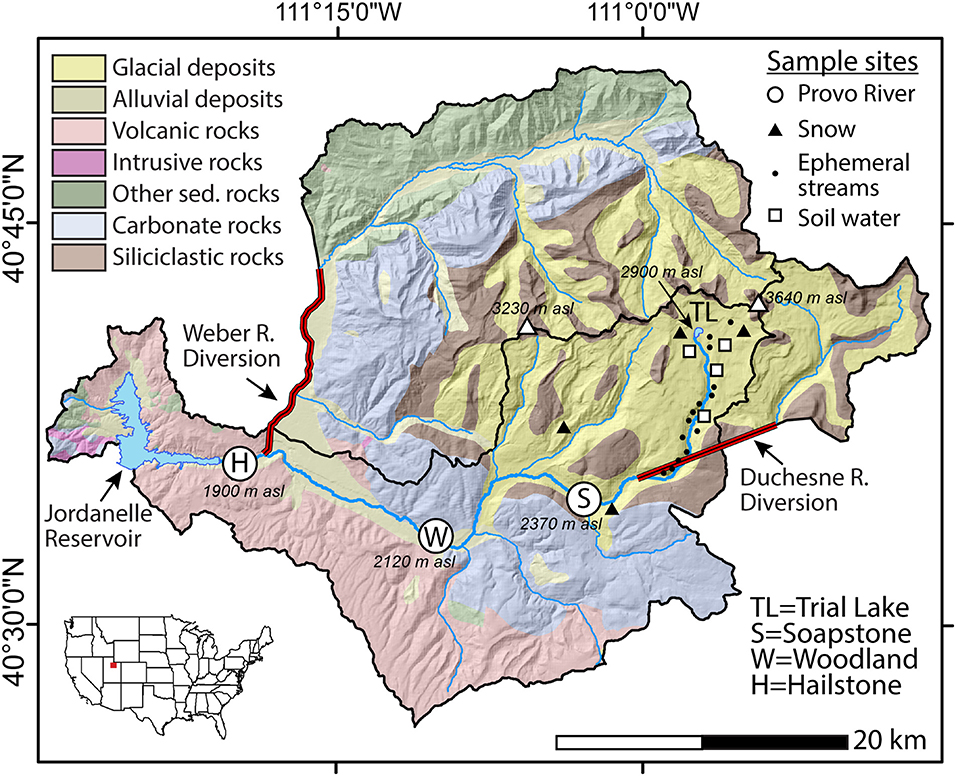
Figure 1. Simplified geologic map of the upper Provo River watershed (northern Utah, USA) showing sample locations, the Duchesne and Weber River diversions, and Jordanelle Reservoir. The upper Provo River watershed receives water from the Duchesne River above the Soapstone site and Weber River above the Hailstone site. Modified after Packer et al. (2020).
Stream discharge in the upper Provo River is dominated by snowmelt with most runoff occurring during the months of April through June (Figure 2). The higher elevations above Soapstone receive the most snowfall while the lower elevation portions of the watershed are drier. Discharge increases between the Soapstone and Woodland sites due to inputs from groundwater and other tributaries. Likewise, discharge increases between the Woodland and Hailstone sites due to groundwater inputs and transbasin diversions from the Weber River watershed (Figure 1). At peak discharge, the river is fed by ~80% snowmelt and 20% groundwater based on mixing calculations using conductivity measurements (Carling et al., 2015).
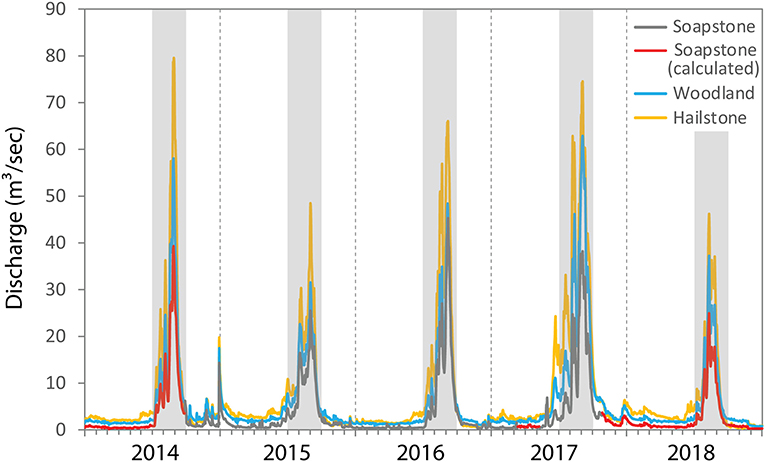
Figure 2. Daily discharge at Soapstone, Woodland and Hailstone sites on the upper Provo River for water years 2014–2018. Vertical dashed lines indicate the beginning of the water year on 1 October and the gray boxes indicate the 3-month snowmelt runoff period (April–June) each year. For Soapstone, missing values (in red) were calculated by regression with Woodland data.
River, Ephemeral Stream, Soil Water, and Snowpack Sample Collection
To characterize seasonal trends in water chemistry, we sampled the Provo River at Soapstone, Woodland, and Hailstone (Figure 1) during water years 2014–2018 with increased sampling frequency during the snowmelt runoff period (April through June). Each site was sampled ~20 times per year during 2016, 2017, and 2018. Additionally, Soapstone was sampled eight times per year in 2014 and 2015 and Hailstone was sampled six times in 2015. Near peak runoff in 2016 (June 1–2), we conducted an intensive diel sampling event at Soapstone with hourly samples collected over a 24-h period to measure changes in water chemistry in response to hourly changes in discharge.
To evaluate water chemistry of potential inputs to the Provo River, we sampled ephemeral snowmelt streams during May 2016 (n = 8), May/June 2017 (n = 14), and May 2018 (n = 5). Ephemeral streams, which appeared as small rivulets during the snowmelt season, were sampled opportunistically in the upper part of watershed above Soapstone (Figure 1). The samples primarily represent snowmelt water that has interacted with soil water and shallow groundwater. Field blanks (n = 3) were collected along with ephemeral stream samples.
For river and ephemeral stream samples, multiple bottles were used for different chemical analyses. For trace elements and major cations, water was collected in a 125 mL LDPE bottle and filtered in the laboratory within ~6 h of collection using a polypropylene syringe and 0.45 μm PES syringe filter. The filtered sample was amended to 2.4% v/v trace metal grade HNO3. To avoid sample contamination, filtering was done in a laminar flow hood and all materials that contacted the sample were acid washed with 10% HCl and rinsed with Milli–Q water. Field blanks (n = 66) were processed each sampling day by pouring Milli–Q water into a clean LDPE bottle and treating the blank water in the same manner as a sample. Samples for major anions (F−,Cl−, , and ) and were collected in 1 L HDPE bottles and stable isotopes of water (δ18O and δ2H) were collected in 30 mL amber glass vials with polyseal caps. The major anion samples were filtered in the laboratory using a 0.45 μm acetate filter in a plastic vacuum filtration unit, while , δ18O, and δ2H were measured on unfiltered aliquots.
To compare with ephemeral stream sample chemistry, we collected a total of eight shallow soil water samples during the snowmelt period over 2 years using different methods due to the difficulty of obtaining sufficient volume from the clay–rich soils. In 2017, we collected two soil water samples using UMS tension lysimeters. In 2018, we collected one sample using an Eijkelkamp MacroRhizon sampler and five samples by centrifuging wet soils. All samples were filtered using a 0.45 μm PES syringe filter into a LDPE bottle for analysis of trace elements and major cations. There was insufficient volume for other analyses.
To compare snow chemistry with river chemistry, we sampled snowpack at maximum accumulation (prior to snowmelt) each spring from 2014 through 2018 in the upper watershed (Figure 1). Snow was sampled at five sites in 2014, one site in 2015, six sites in 2016, and two sites in 2017 and 2018. The sites were carefully selected in flat, wind-protected areas within clearings in the coniferous forest beyond the canopy drip edge, with consistent locations year-to-year. At each site, three snow pits were excavated to collect separate full–depth snow samples (n = 48). A complete snow column (except the bottom ~10 cm near the ground) was collected behind the snow pit face using a clean acrylic tube following established methods (Carling et al., 2012). Snow was transferred from the tube to a clean 2 L fluorinated high-density polyethylene (FLPE) bottle. Field blanks (n = 7) were collected each sampling day by pouring Milli–Q water through the sampling tubes into a sample bottle and treating the water in the same manner as a snow sample. After melting samples in the lab, the water was subsampled for trace elements and major cations, major anions, and stable isotopes as described above for the other water samples.
Laboratory Analysis of Water Samples
Water samples (river, ephemeral streams, soil water, and snow) were analyzed for metals and major cations, major anions, alkalinity, and stable isotopes of water (δ18O and δ2H). Trace element and major cation concentrations were measured using an Agilent 7500ce quadrupole inductively coupled plasma mass spectrometer (ICP–MS). Concentrations were measured for the following elements: Ag, Al, As, B, Ba, Be, Ca, Cd, Ce, Co, Cr, Cs, Cu, Dy, Er, Eu, Fe, Gd, Ho, K, La, Li, Lu, Mg, Mn, Mo, Na, Nd, Ni, Pb, Pr, Rb, Sb, Se, Sm, Sr, Tb, Th, Ti, Tl, U, V, Y, Yb, and Zn. The detection limit (DL) was determined as the standard deviation of all blanks analyzed throughout each run. A USGS standard reference sample (T−205) and NIST standard reference material (SRM 1643e) were analyzed multiple times in each run together with the samples as a continuing calibration verification. The long-term reproducibility for T−205 and SRM 1643e shows that our results are accurate within 10% for most elements. Major anions (F−, Cl−, , and ) were analyzed on filtered samples using a Dionex ICS−90 ion chromatograph (IC). Alkalinity, assumed to be , was measured on unfiltered samples by acid titration. Stable isotopes of water (δ18O and δ2H) were measured on unfiltered samples using a Los Gatos Research Liquid Water Isotope Analyzer (LWIA−24d). All measurements were made relative to Vienna Standard Mean Ocean Water (VSMOW), with a precision of 0.4%0 and 1.0%0 for δ18O and δ2H, respectively.
Data Quality Control
For data quality control, we checked for elements with high background in field blanks and elements with detection limit issues. For most elements, concentrations were near or <DL in all field blank samples (including blanks for river, ephemeral stream, and snow samples). Two exceptions were B and Zn, which showed measurable values in nearly all field blank samples and thus were excluded from the working dataset. Ag, Cd, Cs, Sc, and Tl were excluded from this study because of insufficient concentrations (<DL) across sample types. For those elements with measurable concentrations in most sample types, occurrences of <DL were set to DL to allow for subsequent calculations.
Charge balances calculated using cation (K+, Na+, Ca2+, and Mg2+) concentrations from the ICP–MS, anion (F−, Cl−, , and ) concentrations from the IC, and concentrations from titration were within an acceptable range of ±5% for 221 out of 239 river and ephemeral stream samples. The remaining 18 samples were charge balanced by slightly adjusting concentrations. Raw data for all river, ephemeral stream, soil water, and snow samples, including field blanks and charge balance calculations, are provided in the Supplementary Tables 1–5.
Stream Discharge Data and Solute Loads
Stream discharge measurements were used to develop C–Q relationships and calculate solute loads. Stream discharge data were obtained from the US Geological Survey (USGS) gauging stations at Woodland (USGS 10154200) and Hailstone (USGS 10155000). For the Soapstone site, discharge data were obtained from the iUTAH (innovative Urban Transitions and Arid region Hydro-sustainability) project using 15-min water level measurements (iUTAH GAMUT Working Group, 2019) converted to discharge with a stream rating curve (iUTAH Cyberinfrastructure Team, 2017). Discharge values at Soapstone were missing for most of water year 2014 and all of water year 2018, with interspersed missing days between 2015 and 2017. Given the strong relationship between discharge at the Soapstone and Woodland sites (R2 value of 0.94 over 3 years of overlapping daily data), periods of missing data at Soapstone were interpolated by linear regression on Woodland discharge data using the equation (with units of m3/s): Soapstone discharge = 0.6868 (Woodland discharge) – 0.5777. The regression equation was similar considering all data or considering only data collected during baseflow and the rising or falling limbs of the hydrograph (Supplementary Figure 1). Negative values were replaced with a nominal value of 0.3 m3/s. The measured and calculated daily discharge values are shown in Figure 2 and provided in the Supplementary Tables 1–5. The calculated discharge values were used in subsequent C–Q analysis and load calculations. The best-fit slope of the log C–log Q relationship was determined by regression for each solute at Soapstone, Woodland, and Hailstone, where a slope of zero represents chemostatic behavior, a positive slope represents flushing, and a negative slope represents dilution (Godsey et al., 2009; Creed et al., 2015).
Daily, seasonal, and annual trace element and major ion loads were calculated using the USGS LOADEST (LOAD ESTimator) program (Runkel et al., 2004). LOADEST uses nine regression models to calculate the adjusted maximum likelihood estimation (AMLE) of load, assuming a normal distribution in the model residuals, and automatically selects the model with the lowest Aikake information criterion (AIC). The inputs included concentrations of trace elements and major ions and discharge at Soapstone, Woodland, and Hailstone.
Results
Snowmelt Dominated Stream Hydrograph
Stream discharge in the upper Provo River was variable throughout our 5-year study period (Figure 2). Water years 2014 and 2016 had near-average annual discharge (103 and 96% of the long-term mean), while 2017 was above average (155% of the long-term mean) and 2015 and 2018 were below average (85 and 72% of the long-term mean) based on nearly 70 years of data at the Hailstone site. Peak discharge was higher in 2014 relative to 2017, but the snowmelt runoff period was much longer during 2017 extending from March through July compared with April through June for other years. Discharge typically increased between Soapstone and Woodland and between Woodland and Hailstone, during low flow periods and during snowmelt runoff.
Contrasting Response of Trace Elements and Major Ions to Snowmelt Runoff
Specific trace elements and major ions showed contrasting behavior over time in the upper Provo River (Figure 3). We focused on specific trace elements (Be, Al, Cu, Pb, La, and Y) and major ions (Ca2+ and ) that showed contrasting trends relative to discharge. We used the trace metals Be, Al, Cu, and Pb because they represent potential water quality impairments and are elevated in atmospheric deposition to the Uinta Mountains (Reynolds et al., 2010; Munroe, 2014; Dastrup et al., 2018; Goodman et al., 2019). In particular, Al concentrations commonly exceed state water quality standards in the upper Provo River (Boyd, 2017). La and Y are representative of the rare earth elements in our dataset and Ca2+ and are representative of the major ions. Raw data for all trace elements and major ions at Soapstone, Woodland, and Hailstone are provided in the Supplementary Tables 1–5.
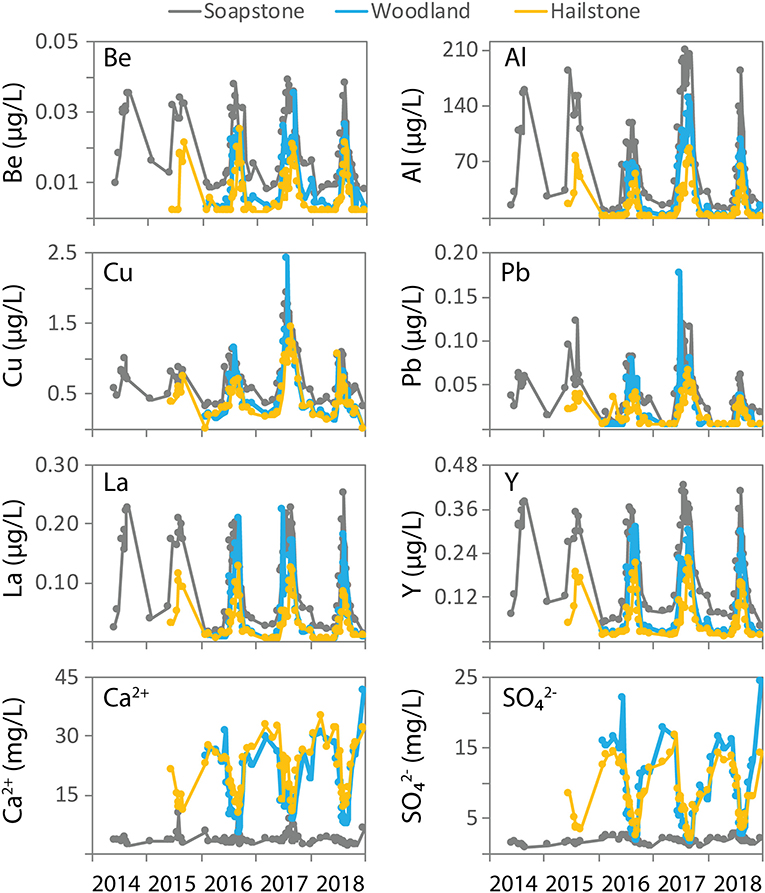
Figure 3. Time-series concentrations of selected trace elements (Be, Al, Cu, Pb, La, and Y) and major ions (Ca2+ and ) at Soapstone, Woodland, and Hailstone for the period 2014–2018.
Trace element concentrations increased with discharge, with year-to-year variability for some elements depending on total discharge (Figure 3). Concentrations were typically highest at Soapstone, intermediate at Woodland, and lowest at Hailstone. For Be, La, and Y, peak concentrations were similar each year in response to snowmelt runoff. In contrast, maximum Al, Cu, and Pb concentrations were variable in response to the amount of discharge, with the highest concentrations occurring in 2017 coincident with the highest discharge. The lowest peak concentrations of Al were measured in 2016 with average discharge, while the lowest peak concentrations of Cu were measured in 2015 and 2018 with the lowest discharge. Peak concentrations of Pb were moderate in 2015 and low in 2018.
Major ion concentrations showed dramatically different trends relative to the trace elements, with increasing concentrations from upstream to downstream (Figure 3). At Soapstone, Ca2+ and concentrations were similar throughout the entire 5-year sampling period, with minimal change in response to discharge. At Woodland and Hailstone, major ion concentrations varied in response to discharge. Specifically, Ca2+ and concentrations were relatively high during low-flow periods and decreased during snowmelt runoff each year, nearly matching the low concentrations observed at Soapstone. For major ions and trace elements, the seasonal and year-to-year variability were much larger than measurement errors (in the range of ±10%).
Concentration–Discharge Relationships for Trace Elements and Major Ions
Concentration–discharge (C–Q) plots showed positive slopes for trace elements and either no slope or negative slopes for the major ions (Figure 4). For the trace elements, the slopes of the log C–log Q relationships were less steep at Soapstone relative to Woodland and Hailstone. For example, the log C–log Q slope for be increased from 0.31 at Soapstone to 0.62 and Woodland and 0.61 at Hailstone. The steepest slopes were found for Al, which increased from 0.59 at Soapstone to >1 at Woodland and Hailstone. For the major ions, in contrast, the slopes were near zero at Soapstone and negative at Woodland and Hailstone. For example, the slope was −0.09 at Soapstone and decreased to −0.63 at Woodland and −0.35 at Hailstone. For each of these solutes, C–Q data were included for all years of the study period for each site. The C–Q relationships were more robust at Woodland and Hailstone (higher R2 values) relative to Soapstone (lower R2 values) for all solutes. At Woodland and Hailstone, R2 values ranged from 0.63 to 0.98. At Soapstone, R2 values ranged from 0.35 to 0.69 for trace elements and were <0.2 for the major ions.
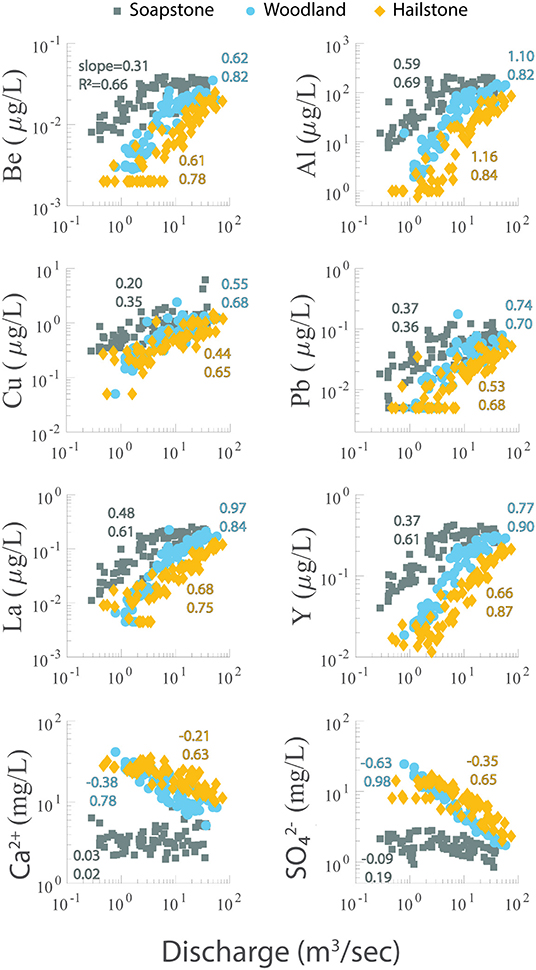
Figure 4. Concentration-discharge (C–Q) plots on a log-log scale for selected trace elements (Be, Al, Cu, Pb, La, and Y) and major ions (Ca2+ and ) from Soapstone, Woodland, and Hailstone with data from multiple years. The slope of the best fit line and R2 value are shown for each data series.
Stable isotopes of water (δ18O and δ2H) showed small changes relative to discharge (Figure 5). Both isotopes were slightly depleted from low flow to high flow. Notably, the values were similar at Soapstone, Woodland, and Hailstone.
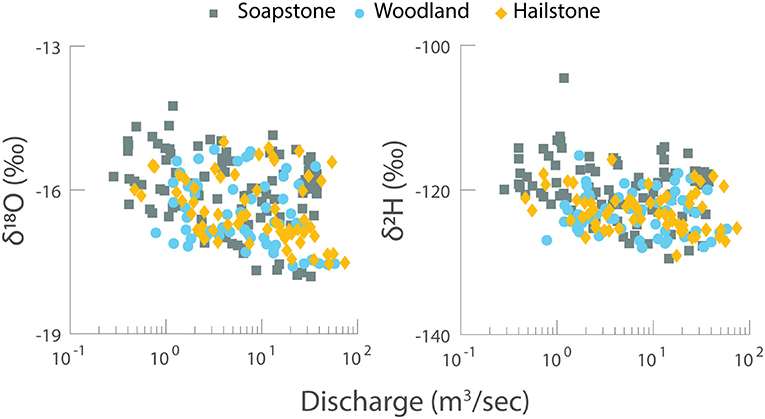
Figure 5. Stable isotopes of water (δ18O and δ2H) vs. discharge for Soapstone, Woodland, and Hailstone with data from multiple years. Note the linear scale for the y-axis and log scale for the x-axis.
Annual Solute Loads Dominated by Snowmelt Runoff
Solute loading was dominated by the snowmelt runoff period (April–June) each year, with the upper watershed (above Soapstone) contributing a majority of trace elements and the lower watershed (below Soapstone) contributing a majority of major ions (Tables 1, 2). Trace element loads at Soapstone were nearly as high (Be, Cu, Pb) or similar (Al, La, Y) as the loads further downstream at Hailstone, whereas the major ion loads at Soapstone were only a small fraction (<15%) of the loads at Hailstone (Table 1). The 3-month snowmelt runoff period accounted for 84–99% of the annual trace element loads compared with only 67–86% of the annual discharge at Soapstone, Woodland, and Hailstone. For the major ions, the snowmelt runoff period accounted for 75–89% of the annual load at Soapstone and 37–71% of the annual load at Woodland and Hailstone (Table 2).
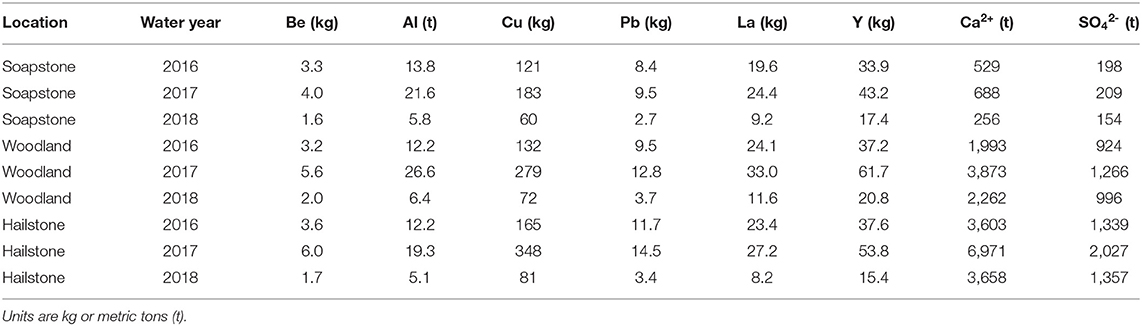
Table 1. Annual solute loads at Soapstone, Woodland, and Hailstone.
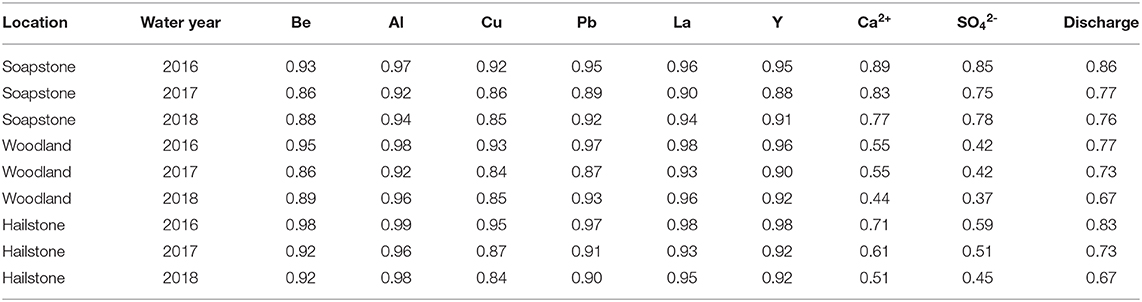
Table 2. Fraction of annual solute load and discharge during snowmelt runoff (April–June).
Solute Concentrations in Snow, Soil Water, and Ephemeral Streams
Solute concentrations were variable across snow, soil water, ephemeral stream, and river samples (Figure 6). For the trace elements, concentrations were highest in soil water and ephemeral stream samples. Concentrations of Be, Cu, La, and Y were similar in soil water and ephemeral streams, while concentrations of Al and Pb were much higher in soil water. Trace element concentrations were lower in baseflow samples (defined as the period July–March) relative to snowmelt runoff samples (April–June) at Soapstone, Woodland, and Hailstone. For the major ions, in contrast, concentrations were low in soil water and ephemeral streams and high in the river samples during baseflow and were higher during baseflow relative to snowmelt runoff. For all solutes, concentrations in snowpack were low relative to the other sample types. There is some uncertainty in the concentration ranges within each sample type (Figure 6) because of spatial variability across the landscape for snowpack or ephemeral streams and the difficulty of collecting representative soil water samples. However, even with the uncertainty, the differences were so large between snow and soil water or ephemeral streams that the interpretations likely would not change even with additional sampling.
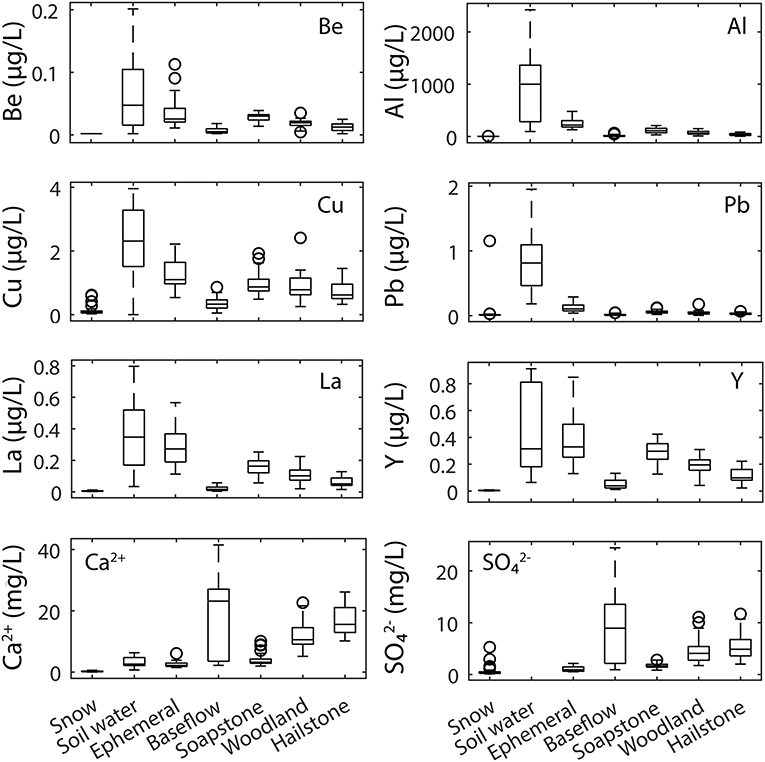
Figure 6. Box plots of trace element (Be, Al, Cu, Pb, La, and Y) and major ion (Ca2+ and ) concentrations in snowpack (n = 48), soil water (n = 8), ephemeral streams (n = 27), river samples under baseflow conditions (defined as July–March) combined for Soapstone, Woodland, and Hailstone (n = 77), and river samples collected during snowmelt runoff (defined as April–June) for Soapstone (n = 51), Woodland (n = 36), and Hailstone (n = 40). Circles represent outliers.
Discussion
Trace Element Flushing From the Critical Zone During Snowmelt Runoff
Trace element concentrations in the upper Provo River increased during snowmelt runoff each year, suggesting that these elements are sourced from shallow flow paths that are activated by snowmelt in the watershed. The increased concentrations likely result from soil water flushing based on C–Q relationships, elevated concentrations in soil water, and increased DOM concentrations during the snowmelt period (Supplementary Figure 2). The C–Q relationships depend on material availability, with positive slopes demonstrating that high discharge events provide new sources of trace elements through flushing, as observed in other studies (Trostle et al., 2016). Positive C–Q slopes for Be, Al, Cu, Pb, La, and Y reflect flushing of these elements from soils (Figure 4). Soil water contained the highest trace element concentrations relative to snowpack and ephemeral streams, indicating that soil water is the likely source of trace elements (Figure 6). Flushed soil water mixes with groundwater and surficial snowmelt to create ephemeral streams, which carry trace elements to the river. Solutes in snowpack likely contribute minimally to observed water chemistry in the upper Provo River. Rather, snowmelt interacts with the soil profile and flushes trace elements from soil water. The major ion C–Q relationships showed chemostatic behavior at Soapstone, with constant concentrations with increasing discharge, and dilution at Woodland and Hailstone. During baseflow, when the river is dominated by groundwater inputs, major ion concentrations increased substantially between Soapstone and Woodland with inputs of solute-rich groundwater from carbonate bedrock. While we did not measure groundwater chemistry as part of our study, previous work in the Provo River watershed (Carling et al., 2015) and the Logan River in northern Utah (Neilson et al., 2018) describes contributions of solute-rich groundwater from carbonate bedrock to rivers during dry-season baseflow. During snowmelt runoff, the major ion concentrations remained low at Soapstone and were diluted at Woodland and Hailstone with the influx of snowmelt-flushed shallow soil water from the upper watershed.
Changing flow paths during the snowmelt season is supported by stable isotopes of water. As shallow flow paths were activated during high discharge, the δ18O and δ2H values were more depleted (Figure 5). This suggests that isotopically depleted snowmelt entered the river, either as direct inputs or along quick flow paths. The slightly depleted isotopic values transferred downstream from Soapstone to Woodland and Hailstone, highlighted the importance of high elevation recharge to streamflow at lower elevations. Yet the small isotopic changes from low- to high-discharge also demonstrate that high elevation snowmelt dominates shallow soil water and groundwater fluxes to the river, with similar isotopic values at all locations throughout each year. Thus, snowmelt is the primary source of water to the river but the chemistry of snowmelt changes depending on the flow path.
Flushing of shallow soils as a source of trace elements is further supported by elevated DOM concentrations in the upper Provo River during snowmelt (Supplementary Figure 2). Trace metal and DOM concentrations are typically correlated in streams, especially during runoff events (Rember and Tefrey, 2004; Hölemann et al., 2005; Kerr et al., 2008; Reynolds et al., 2014; Herndon et al., 2015). Soil water is the main source of DOM in mountain watersheds (Hornberger et al., 1994; Rember and Tefrey, 2004). The most likely source of stream DOM is from the upper soil horizon by degradation of plant material, where DOC is transported from soil water to the river system (Brooks et al., 1999). Probe-measured fluorescent DOM (fDOM) concentrations spiked during the snowmelt runoff period over multiple years at Soapstone and Woodland (Supplementary Figure 2). Samples collected for DOM characteristics at Soapstone, Woodland, and Hailstone during 2017 identified the dominance of soil humic and fulvic acid fractions of DOM during snowmelt runoff (Packer et al., 2020). Further analysis of DOM is needed to identify relationships between the complexation of metals with fulvic and humic acids.
Trace element transport from soil water to the stream during snowmelt may be facilitated by both DOM and mineral colloids (Trostle et al., 2016). For example, concentrations of both fDOM and turbidity increased dramatically during snowmelt runoff at Soapstone in 2016 (Supplementary Figure 3). The elevated metal concentrations at peak discharge could be related to colloid transport, as observed in other headwater streams (Aguirre et al., 2017). High discharge is typically a driver of total suspended solid concentrations (Rose et al., 2018), of which a fraction may be composed of colloids that pass through a <0.45 μm filter. Colloids effectively sorb metals and facilitate metal transport, especially Pb (Citeau et al., 2003). Sorbed metals can move more quickly through soils due to size exclusion (Grolimund et al., 1998), which explains why a flux of metals often precedes peak discharge and why metals in particular are flushed, while other solute concentrations remain chemostatic. The presence of colloid-bound metals is supported by our previous research comparing water chemistry above and below Jordanelle Reservoir, with decreasing concentrations of “dissolved” metals likely due to settling in the reservoir (Carling et al., 2015). The relative amount transported by DOM or colloids during snowmelt deserves further attention but was beyond the scope of this study.
Trace element fluxes from soil water at the top of the watershed dominate the trace element loads at the bottom of the watershed. The annual trace element loads were controlled by annual discharge, with the largest loads occurring in 2017 (above average discharge) and the smallest loads occurring in 2018 (below average discharge). Most trace element loading occurred during the short window of snowmelt runoff, with >84% of the loads of Be, Al, Cu, Pb, La, and Y occurring during April–June each year (Table 2). The fraction of trace element loading during snowmelt runoff was greater than the fraction of discharge occurring over the same period, highlighting the importance of shallow flow paths for contributing trace elements to the river. The trace element loads at Soapstone were nearly equal to the loads at Hailstone (Table 1), demonstrating that trace element inputs at the top of the watershed dominate the total trace element load for the river and that the trace elements are effectively transported downstream. Although trace element concentrations decreased from upstream to downstream (Figure 3), the loads remained similar, suggesting that trace elements are diluted but not removed during transport. It is also possible that trace elements are lost from the river due to settling or other processes, such that trace elements in the additional water at downstream sites makes up for the trace elements lost during transport.
Major ion loading is controlled by groundwater inputs in the lower part of the watershed, with loads of Ca2+ and increasing substantially from upstream to downstream (Table 1). At Soapstone, most major ion loading occurred during snowmelt runoff, but the loads were small compared to Woodland and Hailstone, where only about half of the loading occurred during snowmelt runoff (Table 2). At the downstream sites, groundwater contributions during baseflow dominated the major ion loads. Although baseflow contributed only ~30% of the annual discharge at Woodland and Hailstone, the major ion concentrations in groundwater were high enough to account for ~50% of the annual loading. The loads of Ca2+ and doubled between Woodland and Hailstone due to contributions from the Weber River diversion.
Changes in Solute Concentration–Discharge Relationships From Upstream to Downstream
Trace element concentrations decreased from Soapstone to Woodland and Hailstone (Figure 3) but the slope of the C–Q relationship was steeper at the downstream sites (Figure 4). This suggests that water from the upper reaches of the watershed exerts a greater influence on downstream water chemistry during periods of high discharge relative to baseflow even as trace elements are diluted or removed from upstream to downstream. In other words, trace elements in soils at the top of the watershed are flushed with snowmelt tens of kilometers downstream to cause a steeper slope in the C–Q relationships. The slug of water from Soapstone increases trace element concentrations but also dilutes the major ion chemistry of the river downstream and Woodland and Hailstone, causing the negative slope for Ca2+ and in C–Q space (Figure 4).
For many solutes, chemostasis is expected to develop with increasing stream order as flows accumulate downstream (Creed et al., 2015). However, across our transect of three sites, the C–Q relationships trended toward more chemodynamic behavior with flushing of trace elements or dilution of major ions (Figure 4). Further downstream, below Jordanelle Reservoir, water chemistry is generally chemostatic owing to long holding times in the reservoir (Carling et al., 2015). The emergent C–Q patterns in the upper watershed highlight the importance of comparing C–Q relationships at multiple sites along a river. Investigating the water chemistry only at Soapstone would result in interpretation of chemostatic or slight flushing behavior during snowmelt runoff, yet the C–Q relationships at Woodland and Hailstone reveal a more dynamic system. The C–Q relationships at Woodland and Hailstone are affected by water and solutes inherited from upstream at Soapstone, such that the groundwater–dominated river during baseflow is overwhelmed by snowmelt water from the upper watershed during the runoff period. Solute concentrations converge at the three sites at high discharge. The snowmelt water from shallow flow paths (soil water) causes dilution of the solute–rich groundwater at Woodland and Hailstone while simultaneously causing a much steeper slope in the trace element C–Q relationships. Under baseflow conditions, trace element concentrations decrease more rapidly from upstream to downstream, likely due to longer residence in the stream allowing for increased biogeochemical processing between the sites.
Solute Sources Within the Critical Zone During Snowmelt Runoff
The increase in dissolved metal and rare earth element concentrations and loads during snowmelt deserves further discussion given the limited source of these elements in local bedrock at the upper part of the watershed. The bedrock geology in the Uinta Mountains above the Soapstone site is dominated by siliciclastic rocks with relatively low concentrations of trace elements such as Be, Al, Cu, Pb, La, and Y (Munroe, 2014; Munroe et al., 2020). Alpine soils in the periglacial zone of the Uintas contain ~50–80% dust, with elevated trace element concentrations in soils relative to bedrock (Munroe et al., 2020). The concentrations of dust–derived metals, including Cu and Pb, increased dramatically in Uinta Mountain lake sediments after the year 1870, implying that dust–derived material increased as a result of anthropogenic activities (Reynolds et al., 2010). Similarly, others studies have shown that dust contributes elevated trace element concentrations to northern Utah snowpack (Carling et al., 2012; Reynolds et al., 2014; Dastrup et al., 2018; Goodman et al., 2019). Dust deposited to snowpack during winter or directly to the landscape during summer accumulates over time in soils and adds trace metals and rare earth elements to the soil profile, as observed in the Uintas and other locations (Vázquez-Ortega et al., 2015; Mcintosh et al., 2017; Munroe et al., 2020). The minerals in dust slowly weather from soils, contributing to elevated trace element concentrations in soil water (Figure 6) that is released during the snowmelt pulse. It is also possible that weathered material from the interbedded shales within siliciclastic rocks in the upper watershed are a source of metals due to their composition of micas and plagioclase minerals with relatively high metal concentrations (Condie et al., 2001; Myer, 2008). However, the shale would likely contribute metals during the baseflow period with deeper groundwater flow paths rather than during the snowmelt season.
The major ions (Ca2+ and ) are dominated by inputs from carbonate bedrock weathering in the lower portions of the watershed and soils and dust in the upper part of the watershed (Figure 1). Particularly, between the Soapstone and Woodland sites, groundwater in carbonate rocks contributes large amounts of major ions to groundwater and cause higher total solute concentrations at Woodland and Hailstone relative to Soapstone (Carling et al., 2015). In the upper watershed above Soapstone, weathering of siliciclastic sedimentary rocks (Condie et al., 2001) contribute low concentrations of major ions that is matched by concentrations from soil water during the snowmelt runoff period to maintain chemostasis.
Additional work is needed to quantify solute contributions from dust vs. bedrock in the upper Provo River watershed. This could be accomplished by developing watershed-scale solute mass balances over multiple years, better characterizing groundwater chemistry and fluxes, and investigating biogeochemical processing of solutes during transport. Our data could be used to constrain watershed models of solute transport, such as the Soil & Water Assessment Tool (SWAT), to determine the fate of dust-derived solutes in the watershed by coupling with modules to consider metals (Meng et al., 2018). Currently, we are using 87Sr/86Sr ratios to quantify Sr can Ca2+ inputs from dust and bedrock and to track the fate of dust-derived solutes through the watershed, which is described in an upcoming paper. The additional sampling, modeling work, and isotopic measurements are part of an ongoing, long-term project.
Conclusions
The Critical Zone is the primary source of solutes to rivers, with inputs of trace elements and major ions changing with discharge. We demonstrate the importance of shallow flow paths activated during snowmelt runoff for flushing trace elements from soil water in the upper Provo River watershed of northern Utah. Trace metal (Be, Al, Cu, and Pb) and rare earth element (represented by La and Y) concentrations increased dramatically during the snowmelt runoff period, with loads from the upper watershed propagating downstream. Snowmelt flushing of soils in the upper watershed plays an important role in controlling trace element chemistry of the river, accounting for most of the annual trace element loading. Given the low concentrations of trace elements in the siliciclastic bedrock at the top of the watershed, trace elements in soils are likely sourced from aeolian dust. Thus, metals and rare earth elements in dust represent an important control on river chemistry. Trace element transport is likely facilitated by a combination of dissolved organic matter and mineral colloids.
Major ion fluxes, in contrast, are controlled by water-rock interactions along groundwater flow paths in the carbonate bedrock at the lower elevations in the watershed. Major ion concentrations and loads were low at the upper site and increased substantially downstream with groundwater inputs from carbonate rocks. Only about half of the Ca2+ and loads occurred during snowmelt runoff, with the other half coming from groundwater during baseflow. During the snowmelt runoff period, water from the upper watershed diluted major ion concentrations in the lower part of the watershed, resulting in similar concentrations longitudinally from upstream to downstream.
Concentration–discharge relationships revealed unique patterns for trace elements and major ions along the longitudinal transect of three sites. Concentration–discharge plots showed flushing behavior for trace elements and either chemostatic behavior or dilution for the major ions. For the trace elements, there was a weak flushing behavior at the upstream site and much stronger flushing behavior at the downstream sites. Major ion concentrations were chemostatic at the upstream site and diluted at the downstream sites. These relationships are contrary to expectations because chemostatic behavior should develop as flows accumulate downstream. This observation highlights the importance of characterizing concentration–discharge at multiple locations in a river for better understanding water quality in response to changing discharge.
Our findings highlight the importance of the Critical Zone for controlling water chemistry in montane watersheds, with snowmelt–driven soil water flushing dominating the annual trace element loads. Understanding flow paths during snowmelt and baseflow is necessary for determining impacts on water quality. The flux of trace elements during snowmelt may exert a larger control on river chemistry, and at larger scales, than previously thought. In particular, trace element inputs from aeolian dust to montane soils may be an important, yet overlooked, source of potentially harmful elements to river systems.
Data Availability Statement
The datasets generated for this study can be found in the Supplementary Material and in HydroShare with the following DOIs: soil water and ephemeral stream data (https://doi.org/10.4211/hs.b5f8b9a80fa44d9b869a4d1604f8df2b), river chemistry (https://doi.org/10.4211/hs.1825ac7f0cd94f4d950929600729f36d), and snow chemistry (https://doi.org/10.4211/hs.20891fd47c3d4be28d723950ff415671).
Author Contributions
HC performed field and laboratory work, data analysis, and wrote the first draft of the paper. GC directed the research, secured funding, and wrote the final draft. DF, SN, and ZA co-advised students and helped with writing. KR and DT directed field and laboratory work. CH, BP, and CC assisted with field and laboratory work and performed data analysis. All authors contributed to the article and approved the submitted version.
Funding
This work was supported by the U.S. National Science Foundation grants EAR−1521468, EAR-2012093, and OIA−1208732. Any opinions, findings, and conclusions or recommendations expressed are those of the authors and do not necessarily reflect the views of the National Science Foundation.
Conflict of Interest
The authors declare that the research was conducted in the absence of any commercial or financial relationships that could be construed as a potential conflict of interest.
Acknowledgments
We thank Natalie Barkdull, Greta Hamilton, Andrew Luymes, and Andrew Bentz for help in the field and laboratory.
Supplementary Material
The Supplementary Material for this article can be found online at: https://www.frontiersin.org/articles/10.3389/frwa.2020.578677/full#supplementary-material
References
Aguirre, A. A., Derry, L. A., Mills, T. J., and Anderson, S. P. (2017). Colloidal transport in the gordon gulch catchment of the boulder creek CZO and its effect on C-Q relationships for silicon. Water Resour. Res. 53, 2368–2383. doi: 10.1002/2016WR019730
Barnett, T. P., Pierce, D. W., Hidalgo, H. G., Bonfils, C., Santer, B. D., Das, T., et al. (2008). Human-induced changes in the hydrology of the western United States. Science 319, 1080–1083. doi: 10.1126/science.1152538
Boyd, A. E. (2017). 2018 Water Quality Implementation Report. Prepared for Wasatch County & Utah Division of Water Quality, Park City, UT, 68.
Brooks, P. D., Chorover, J., Fan, Y., Godsey, S. E., Maxwell, R. M., Mcnamara, J. P., et al. (2015). Hydrological partitioning in the critical zone: recent advances and opportunities for developing transferable understanding of water cycle dynamics. Water Resour. Res. 51, 6973–6987. doi: 10.1002/2015WR017039
Brooks, P. D., Mcknight, D. M., and Bencala, K. E. (1999). The relationship between soil heterotrophic activity, soil dissolved organic carbon (DOC) leachate, and catchment-scale DOC export in headwater catchments. Water Resour. Res. 35, 1895–1902. doi: 10.1029/1998WR900125
Carling, G. T., Fernandez, D. P., and Johnson, W. P. (2012). Dust-mediated loading of trace and major elements to Wasatch Mountain snowpack. Sci. Total Environ. 432, 65–77. doi: 10.1016/j.scitotenv.2012.05.077
Carling, G. T., Tingey, D. G., Fernandez, D. P., Nelson, S. T., Aanderud, Z. T., Goodsell, T. H., et al. (2015). Evaluating natural and anthropogenic trace element inputs along an alpine to urban gradient in the provo river, Utah, USA. Appl. Geochem. 63, 398–412. doi: 10.1016/j.apgeochem.2015.10.005
Chorover, J., Derry, L. A., and Mcdowell, W. H. (2017). Concentration-discharge relations in the critical zone: implications for resolving critical zone structure, function, and evolution. Water Resour. Res. 53, 8654–8659. doi: 10.1002/2017WR021111
Citeau, L., Lamy, I., Van Oort, F., and Elsass, F. (2003). Colloidal facilitated transfer of metals in soils under different land use. Colloids Surf. A. 217, 11–19. doi: 10.1016/S0927-7757(02)00554-X
Condie, K. C., Lee, D., and Farmer, G. L. (2001). Tectonic setting and provenance of the Neoproterozoic Uinta Mountain and Big Cottonwood groups, northern Utah: constraints from geochemistry, Nd isotopes, and detrital modes. Sediment. Geol. 141–142, 443–464. doi: 10.1016/S0037-0738(01)00086-0
Creed, I. F., Mcknight, D. M., Pellerin, B. A., Green, M. B., Bergamaschi, B. A., Aiken, G. R., et al. (2015). The river as a chemostat: fresh perspectives on dissolved organic matter flowing down the river continuum. Canad. J. Fish. Aquat. Sci. 72, 1272–1285. doi: 10.1139/cjfas-2014-0400
Dastrup, D. B., Carling, G. T., Collins, S. A., Nelson, S. T., Fernandez, D. P., Tingey, D. G., et al. (2018). Aeolian dust chemistry and bacterial communities in snow are unique to airshed locations across northern Utah, USA. Atmos. Environ. 193, 251–261. doi: 10.1016/j.atmosenv.2018.09.016
Dehler, C. M., Porter, S. M., De Grey, L. D., Sprinkel, D. A., and Brehm, A. (2006). The neoproterozoic uinta mountain group revisited: a synthesis of recent work on the red pine shale and related undivided clastic strata, northeastern Utah. Soc. Sediment. Geol. 86:151. doi: 10.2110/pec.07.86.0151
Evans, C., and Davies, T. D. (1998). Causes of concentration/discharge hysteresis and its potential as a tool for analysis of episode hydrochemistry. Water Resour. Res. 34, 129–137. doi: 10.1029/97WR01881
Godsey, S. E., Kirchner, J. W., and Clow, D. W. (2009). Concentration–discharge relationships reflect chemostatic characteristics of US catchments. Hydrol. Process 23, 1844–1864. doi: 10.1002/hyp.7315
Goodman, M. M., Carling, G. T., Fernandez, D. P., Rey, K. A., Hale, C. A., Bickmore, B. R., et al. (2019). Trace element chemistry of atmospheric deposition along the Wasatch Front (Utah, USA) reflects regional playa dust and local urban aerosols. Chem. Geol 530:119317. doi: 10.1016/j.chemgeo.2019.119317
Grolimund, D., Elimelech, M., Borkovec, M., Barmettler, K., Kretzschmar, R., and Sticher, H. (1998). Transport of in situ mobilized colloidal particles in packed soil columns. Environ. Sci. Technol. 32, 3562–3569. doi: 10.1021/es980356z
Herndon, E. M., Dere, A. L., Sullivan, P. L., Norris, D., Reynolds, B., and Brantley, S. L. (2015). Landscape heterogeneity drives contrasting concentration-discharge relationships in shale headwater catchments. Hydrol. Earth Syst. Sci. 19, 3333–3347. doi: 10.5194/hess-19-3333-2015
Hölemann, J. A., Schirmacher, M., and Prange, A. (2005). Seasonal variability of trace metals in the Lena river and the southeastern Laptev sea: impact of the spring freshet. Glob. Planet. Change 48, 112–125. doi: 10.1016/j.gloplacha.2004.12.008
Hornberger, G., Bencala, K., and Mcknight, D. (1994). Hydrological controls on dissolved organic carbon during snowmelt in the Snake river near Montezuma, Colorado. Biogeochemistry 25, 147–165. doi: 10.1007/BF00024390
iUTAH Cyberinfrastructure Team (2017). Discharge Rating Curve at Provo River Near Soapstone Basin Aquatic Site (PR_ST_BA). HydroShare. Available online at: http://www.hydroshare.org/resource/d14c319e607140bb607183fe607146b607143b93302994
iUTAH GAMUT Working Group (2019). iUTAH GAMUT Network Quality Control Level 1 Data at Provo River Near Soapstone Basic Aquatic (PR_ST_BA). HydroShare. Available online at: https://www.hydroshare.org/resource/e640b621cb649b604d620a952cf156459a156729/
Kerr, S. C., Shafer, M. M., Overdier, J., and Armstrong, D. E. (2008). Hydrologic and biogeochemical controls on trace element export from northern Wisconsin wetlands. Biogeochemistry 89, 273–294. doi: 10.1007/s10533-008-9219-2
Lloyd, C. E. M., Freer, J. E., Johnes, P. J., and Collins, A. L. (2016). Using hysteresis analysis of high-resolution water quality monitoring data, including uncertainty, to infer controls on nutrient and sediment transfer in catchments. Sci. Total Environ. 543, 388–404. doi: 10.1016/j.scitotenv.2015.11.028
Mcintosh, J. C., Schaumberg, C., Perdrial, J., Harpold, A., Vázquez-Ortega, A., Rasmussen, C., et al. (2017). Geochemical evolution of the critical zone across variable time scales informs concentration-discharge relationships: Jemez river basin critical zone observatory. Water Resour. Res. 53, 4169–4196. doi: 10.1002/2016WR019712
Meng, Y., Zhou, L., He, S., Lu, C., Wu, G., Ye, W., et al. (2018). A heavy metal module coupled with the SWAT model and its preliminary application in a mine-impacted watershed in China. Sci. Total Environ. 613–614, 1207–1219. doi: 10.1016/j.scitotenv.2017.09.179
Munroe, J. S. (2014). Properties of modern dust accumulating in the Uinta Mountains, Utah, USA, and implications for the regional dust system of the Rocky mountains. Earth Surf. Process. Landf. 39, 1979–1988. doi: 10.1002/esp.3608
Munroe, J. S., Attwood, E. C., O'keefe, S. S., and Quackenbush, P. J. M. (2015). Eolian deposition in the alpine zone of the Uinta Mountains, Utah, USA. CATENA 124, 119–129. doi: 10.1016/j.catena.2014.09.008
Munroe, J. S., Norris, E. D., Olson, P. M., Ryan, P. C., Tappa, M. J., and Beard, B. L. (2020). Quantifying the contribution of dust to alpine soils in the periglacial zone of the Uinta mountains, Utah, USA. Geoderma 378:114631. doi: 10.1016/j.geoderma.2020.114631
Myer, C. A. (2008). Sedimentology, stratigraphy, and organic geochemistry of the Red Pine Shale, Uinta Mountains, Utah: a prograding deltaic system in a mid-Neoproterozoic interior seaway (All Graduate Theses and Dissertations). Utah State University, Logan, UT, United States.
Neilson, B. T., Tennant, H., Stout, T. L., Miller, M. P., Gabor, R. S., Jameel, Y., et al. (2018). Stream centric methods for determining groundwater contributions in karst mountain watersheds. Water Resour. Res. 54, 6708–6724. doi: 10.1029/2018WR022664
Ogendi, G. M., Hannigan, R. E., and Farris, J. L. (2007). Association of dissolved organic carbon with stream discharge and dissolved metals concentrations in black shale-draining streams. Dev. Environ. Sci. 5, 247–272. doi: 10.1016/S1474-8177(07)05012-7
Packer, B. N., Carling, G. T., Veverica, T. J., Russell, K. A., Nelson, S. T., and Aanderud, Z. T. (2020). Mercury and dissolved organic matter dynamics during snowmelt runoff in a montane watershed, Provo River, Utah, USA. Sci. Total Environ. 704:135297. doi: 10.1016/j.scitotenv.2019.135297
Rember, R. D., and Tefrey, J. H. (2004). Increased concentrations of dissolved trace metals and organic carbon during snowmelt in rivers of the Alaskan arctic. Geochem. Cosmochim. Acta 68, 477–489. doi: 10.1016/S0016-7037(03)00458-7
Reynolds, R. L., Goldstein, H. L., Moskowitz, B. M., Bryant, A. C., Skiles, S. M., Kokaly, R. F., et al. (2014). Composition of dust deposited to snow cover in the Wasatch Range (Utah, USA): Controls on radiative properties of snow cover and comparison to some dust-source sediments. Aeol. Res. 15, 73–90. doi: 10.1016/j.aeolia.2013.08.001
Reynolds, R. L., Mordecai, J. S., Rosenbaum, J. G., Ketterer, M. E., Walsh, M. K., and Moser, K. A. (2010). Compositional changes in sediments of subalpine lakes, Uinta Mountains (Utah): evidence for the effects of human activity on atmospheric dust inputs. J. Paleolimnol. 44, 161–175. doi: 10.1007/s10933-009-9394-8
Rose, L. A., Karwan, D. L., and Godsey, S. E. (2018). Concentration–discharge relationships describe solute and sediment mobilization, reaction, and transport at event and longer timescales. Hydrol. Process 32, 2829–2844. doi: 10.1002/hyp.13235
Runkel, R. L., Crawford, C. G., and Cohn, T. A. (2004). “Load estimator (LOADEST): a fortran program for estimating constituent loads in streams and rivers,” in U.S. Geological Survey Techniques and Methods Book, Vol. 4, (Reston, VT: USGS) 69.
Shafer, M. M., Overdier, J. T., Hurley, J. P., Armstrong, D., and Webb, D. (1997). The influence of dissolved organic carbon, suspended particulates, and hydrology on the concentration, partitioning and variability of trace metals in two contrasting Wisconsin watersheds (U.S.A.). Chem. Geol. 136, 71–97. doi: 10.1016/S0009-2541(96)00139-8
Trostle, K. D., Ray Runyon, J., Pohlmann, M. A., Redfield, S. E., Pelletier, J., Mcintosh, J., et al. (2016). Colloids and organic matter complexation control trace metal concentration-discharge relationships in Marshall Gulch stream waters. Water Resour. Res. 52, 7931–7944. doi: 10.1002/2016WR019072
Vázquez-Ortega, A., Perdrial, J., Harpold, A., Zapata-Ríos, X., Rasmussen, C., Mcintosh, J., et al. (2015). Rare earth elements as reactive tracers of biogeochemical weathering in forested rhyolitic terrain. Chem. Geol. 391, 19–32. doi: 10.1016/j.chemgeo.2014.10.016
Keywords: trace elements, concentration-discharge (C-Q) relationships, snowmelt, soil water, ephemeral stream, alpine hydrology, the critical zone
Citation: Checketts HN, Carling GT, Fernandez DP, Nelson ST, Rey KA, Tingey DG, Hale CA, Packer BN, Cordner CP, Dastrup DB and Aanderud ZT (2020) Trace Element Export From the Critical Zone Triggered by Snowmelt Runoff in a Montane Watershed, Provo River, Utah, USA. Front. Water 2:578677. doi: 10.3389/frwa.2020.578677
Received: 30 June 2020; Accepted: 23 October 2020;
Published: 10 November 2020.
Edited by:
Carl I. Steefel, Lawrence Berkeley National Laboratory, United StatesReviewed by:
Alissa M. White, University of Arizona, United StatesKalyana Babu Nakshatrala, University of Houston, United States
Copyright © 2020 Checketts, Carling, Fernandez, Nelson, Rey, Tingey, Hale, Packer, Cordner, Dastrup and Aanderud. This is an open-access article distributed under the terms of the Creative Commons Attribution License (CC BY). The use, distribution or reproduction in other forums is permitted, provided the original author(s) and the copyright owner(s) are credited and that the original publication in this journal is cited, in accordance with accepted academic practice. No use, distribution or reproduction is permitted which does not comply with these terms.
*Correspondence: Gregory T. Carling, Z3JlZy5jYXJsaW5nQGJ5dS5lZHU=