 Marie C. Sadler
 Jérémy Senouillet
 Simon Kuenzi
 Luigino Grasso
 Douglas C. Watson
- bNovate Technologies, Ecublens, Switzerland
Automated flow cytometry (FCM) adapted to real-time quality surveillance provides high-temporal-resolution data about the microbial communities in a water system. The cell concentration calculated from FCM measurements indicates sudden increases in the number of bacteria, but can fluctuate significantly due to man-made and natural dynamics; it can thus obscure the presence of microbial anomalies. Cytometric fingerprinting tools enable a detailed analysis of the aquatic microbial communities, and could distinguish between normal and abnormal community changes. However, the vast majority of current cytometric fingerprinting tools use offline statistical computations which cannot detect anomalies immediately. Here, we present a computational model, entitled Microbial Community Change Detection (MCCD), which transforms microbial community characteristics into an online process control signal (herein called outlier score) that remains close to zero if the microbial community remains stable and increases with fluctuations in the community. The model is based on fingerprints and distance-based outlier calculations. We tested it in silico and in vitro by simulating acute contaminations to real-world water systems with large inherent microbial fluctuations. We showed that the outlier score was robust against these dynamic variations, while reliably detecting intentional contaminations. This model can be used with automated FCM to quickly detect potential microbiological contamination, and this especially when the time between treatment and distribution is very short.
1. Introduction
Microbial contaminations in the drinking water supply keep occurring even in developed countries (Hrudey and Hrudey, 2019). Waterborne outbreaks can cause inconvenient disruptions in water service, impact human health and cause public concern about drinking water quality. Reviews summarizing contaminations reported in literature have identified recurring themes at the root of these events (Hrudey and Hrudey, 2007; Moreira and Bondelind, 2016). The identified causes include wastewater contaminations, inadequate knowledge of source water hazards, extreme weather (e.g., heavy precipitation and runoff), and filtration failures as well as plant maintenance or treatment process changes. Rapid detection of causal pathogens remains challenging, and current online methods to monitor the microbiological water quality usually involves the measurement of surrogate indicators such as the turbidity, conductivity, pH, UV absorbance, dissolved oxygen, and residual chlorine (Banna et al., 2014). Heterotrophic plate counts (HPC) are routinely used to analyze the general microbial content of water supply, with time-to-results ranging between 2 and 7 days (Allen et al., 2004; Gensberger et al., 2015).
Considerable efforts are presently undertaken to develop and validate novel rapid microbiology methods. Online and automated monitoring is an upcoming approach used by the water industry for assessing microbiological quality during water treatment and distribution (Katko and Højris, 2019). In that context, flow cytometry (FCM) has emerged as a powerful and robust tool which allows for high-temporal-resolution monitoring (Egli and Stefan, 2015; Van Nevel et al., 2017b; Safford and Bischel, 2018). Several studies have been conducted on drinking water plants, as well as groundwater used for drinking water supply, to show the additional insights that are gained on the dynamics of the microbial communities compared to traditional cultivation methods (Cheswick et al., 2019; Kantor et al., 2019; Favere et al., 2020). The basic principle of flow cytometry measurements is the detection and counting of suspended particles present in a water samples by passing them one by one through a laser beam. To discriminate bacteria from other particles, the cells are, prior to the analysis, stained with fluorescent dyes such as nucleic acid stains (e.g., SYBR Green I). Optical detectors record the light scattering and emitted fluorescence. Signal processing reveals the total number of cells and the distribution of light scattering and fluorescence of the cell communities (Adan et al., 2017).
Online FCM monitoring studies have demonstrated how the bacteria concentration correlates with the process dynamics and also how intentional wastewater contaminations on filtered water could be readily detected in the concentration signal (Egli et al., 2017; Montandon et al., 2019). However, the microbial cell concentration in drinking water processes can undergo large fluctuations due to natural and man-made process dynamics (Besmer and Hammes, 2016; Besmer et al., 2016; Egli et al., 2017; Buysschaert et al., 2018b; Schleich et al., 2019), which makes it difficult to assign an increase in concentration to external or process-related microbial perturbations. Monitoring studies on operating water treatment plants have revealed periodic microbial dynamics linked to the water throughput in the treatment facilities (Besmer and Hammes, 2016; Besmer et al., 2016; Egli et al., 2017). Stagnation favoring regrowth followed by high throughput phases, as well as biofilm growth and detachment were hypothesized to cause these periodic fluctuations. In addition, operating conditions such as chemical cleaning and backwashes in membrane filtration processes cause the cell concentration to vary frequently by an order of magnitude (Buysschaert et al., 2018b). Seasonal changes such as increases in temperature during summer were also recently reported to cause a 1.51- to 5.24-fold increase in the cell concentration measured by FCM compared to the winter period (Schleich et al., 2019).
Flow cytometric measurements do not only allow to derive the cell concentration in water samples, but also reveal bacteria community patterns which can be described by so-called cytometric fingerprints (Koch et al., 2014). Fingerprints summarize the bacteria distribution in the whole flow cytometric signal space and can be powerful tools to detect changes in the bacterial communities which are unnoticed when only the cell concentration is taken into account (Koch et al., 2013; Van Nevel et al., 2017a; Props et al., 2018; Schleich et al., 2019). An in-depth analysis of the microbial communities in water processes could allow to distinguish between periods of high bacterial loads encountered during normal operating conditions and sudden bacterial increases caused by unwanted microbial perturbations.
Until recently, work discriminating water samples from different origins with cytometric fingerprints as well as the detection of changes in the microbial community was mainly done offline, meaning that the algorithms designed to identify intergroup characteristics were only applied after the whole data collection (De Roy et al., 2012; Koch et al., 2014; Van Nevel et al., 2017a; Buysschaert et al., 2018a; Props et al., 2018). De Roy et al. (2012) developed a statistical analysis pipeline that could distinguish between different brands of bottled water and even detect microbial community changes caused by changing environmental factors. Koch et al. (2014) identified microbial differences in electroactive biofilms grown under different substrate conditions using multiple fingerprint calculation approaches, and Props et al. (2018) applied a cluster analysis on fingerprinting features to differentiate between natural freshwater microbial communities. In contrast, a recent study has developed an online processing method that was shown to be effective in drinking water quality monitoring (Favere et al., 2020). Based on flow cytometric fingerprints, Favere et al. used the Bray-Curtis dissimilarity to detect drastic microbial water changes in the incoming and exiting water streams of a water tower.
Automatic and real-time surveillance of the microbial population in industrial processes requires data analysis methods that can integrate with an early warning system and can determine online whether an abnormal microbial change has occurred. Beyond showing the microbial community information through a fingerprint, one needs to further process this multivariate data into a scalar signal that robustly indicates unprecedented microbial deviations. This problem relates to unsupervised online outlier detection in multivariate time-series which is an active area of research in process control (Aggarwal, 2017). There exists a multitude of algorithms that can perform outlier streaming and whose applicability depends on the data pattern such as its temporal continuity (Aggarwal, 2017). As mentioned earlier, past online monitoring studies in drinking water processes have revealed large microbial fluctuations with repeated periodic oscillations, but also irregular fluctuations. Thus, to be of use in process monitoring with integrated alarm triggering systems, we need an algorithm that is robust against such variations while remaining sensitive to abnormal microbial changes. Figure 1 illustrates the design of such a surveillance system in an industrial setting: a water system subjected to large fluctuations could experience a microbial community change that remains hidden in the cell concentration signal, but that manifests itself by change in the flow cytometric pattern. By fitting a computational model on a reference period representative of normal operating conditions, an outlier score signal could be calculated that indicates in real-time abnormal bacterial changes, and that would, when exceeding a set threshold, automatically trigger an alarm.

Figure 1. FCM online monitoring in a water process subjected to daily fluctuations and illustration of the outlier score. Bacterial anomalies that manifest by an additional cell population might be easily seen in the dot plot by an operator, but not in the reported cell concentration. Our Microbial Community Change Detection outlier model (MCCD) overcomes this limitation by comparing the event distribution of the online measurements to a reference period and can thus contribute to fast anomaly detection.
Here, we developed such a model. Named MCCD (Microbial Community Change Detection), it computes an outlier score in a two-step analysis: first the flow cytometric measurements containing thousands of bacteria events are transformed into a simplified fingerprint representation making use of the Probability Binning (PB) algorithm (Roederer et al., 2001; Rogers and Holyst, 2009), and in a second step the fingerprints are fed into an online model that compares the measurement to a collection of reference measurements in a nearest neighbor distance calculation (Aggarwal, 2017). To assess its performance and robustness, we applied the model to long-term flow cytometric data which contained time-series measurements of water systems with dynamic microbial behaviors and which, additionally, were perturbed by external microbial events. First, historic time-series from an operating water purification plant were artificially modified to include pathogenic bacteria events and our algorithm was challenged to distinguish between high microbial loads caused by either the foreign bacteria or the process dynamics. Following this numerical experiment, a small-scale water system was set up in which tap water was continuously flowed through a vessel and intermittently spiked with treated sewage effluent water. Finally, the model was generalized to other fingerprint calculation methods to demonstrate the effect of the fingerprint features vs. the distance calculation in the online model.
2. Materials and Methods
2.1. Data Acquisition
We used a BactoSense instrument (bNovate) to perform automated and online flow cytometry measurements. This automated flow cytometer is equipped with a built-in laser at a wavelength of 488 nm, a side scatter (SSC) detector and two fluorescence detectors with bandpass filters for the green-light emission (FL1, 525/45 nm band pass) and the red-light emission (FL2, 715 nm long pass). At defined time intervals, 135 μL of water samples were taken and stained automatically with 15 μL SYBR Green I 10x (Sigma Aldrich) resuspended in TE Buffer at pH 8. After incubation for 10 min at 37 °C, 90 μL of sample was measured. To avoid cross-contamination and prevent biofilm formation, the microfluidic tubing was automatically cleaned between each measurement with NaClO 0.1% and rinsed with NaN3 0.05%.
2.2. Data Processing and Analysis
2.2.1. Analysis Software
FCS file processing and data analysis was done with the Python software (v3.6.8). The libraries we developed for this project are published on GitHub (github.com/bnovate/bactoml).
2.2.2. FCM Data Preprocessing
The raw FCS files were preprocessed using the FlowCytometryTools library (v0.5.0). First, the data in the three channels were logarithmically transformed and truncated (tlog function). A fixed gate was placed to separate bacteria from noise and other background sources, as in Prest et al. (2013). The total cell count (TCC, cells/μL) was extracted by counting the number of events falling into the gate and the concentration was derived by dividing this count by the analysis volume. The high nucleic acid percentage (HNA%) was defined according to Gasol et al. (1999) and Lebaron et al. (2001) and the cut-off value between high nucleic acid (HNA) and low nucleic acid (LNA) was set at a FL1 value of 4.8. Further data processing was done on the FL1 and SSC channels.
2.2.3. MCCD Model and Outlier Score Calculation
In order to calculate an outlier score, the MCCD model is initialized on a reference dataset, then applied to a test dataset. The model takes as input fingerprinting features and returns the outlier score as output. The first step thus involves calculating a fingerprint for each measurement in the reference and test datasets.
The fingerprints are calculated with the Probability Binning (PB) algorithm described in Roederer et al. (2001) and Rogers and Holyst (2009). Figure 2A illustrates the computation. The PB algorithm calculates a grid (initialization step) which is then applied to the FCM measurements to count the number of events that fall into each grid cell or bin (fingerprint generation step). The grid is calculated on a single aggregated reference data file that concatenates all the events from the reference measurements. The grid calculation proceeds recursively leading to the final number of bins nbin = 2k where k is the number of recursions. At each recursion, the events in the parent bin are distributed into two equally populated daughter bins, splitting at the median along the channel dimension with the highest variance. The first bin in the recursion is the entire event space. In this study, we only considered the FL1 and SSC channels, but the algorithm is applicable to higher dimensional spaces. At the end of the grid calculation process, the event distribution of the initialization file is discretized into bins with an equal event count but different sizes; the main result is the position of the bins. The advantage of having bins with different geometrical sizes but equal counts is that the algorithm intrinsically adapts to any distribution such that the signal ranges are well covered. The grid is then applied to every measurement in the reference and test dataset to generate the bin count distributions. The final fingerprint is a vector of bin counts normalized by the total number of events in the respective measurement. In this study we used k = 5 which resulted in a fingerprinting feature vector with 32 elements.
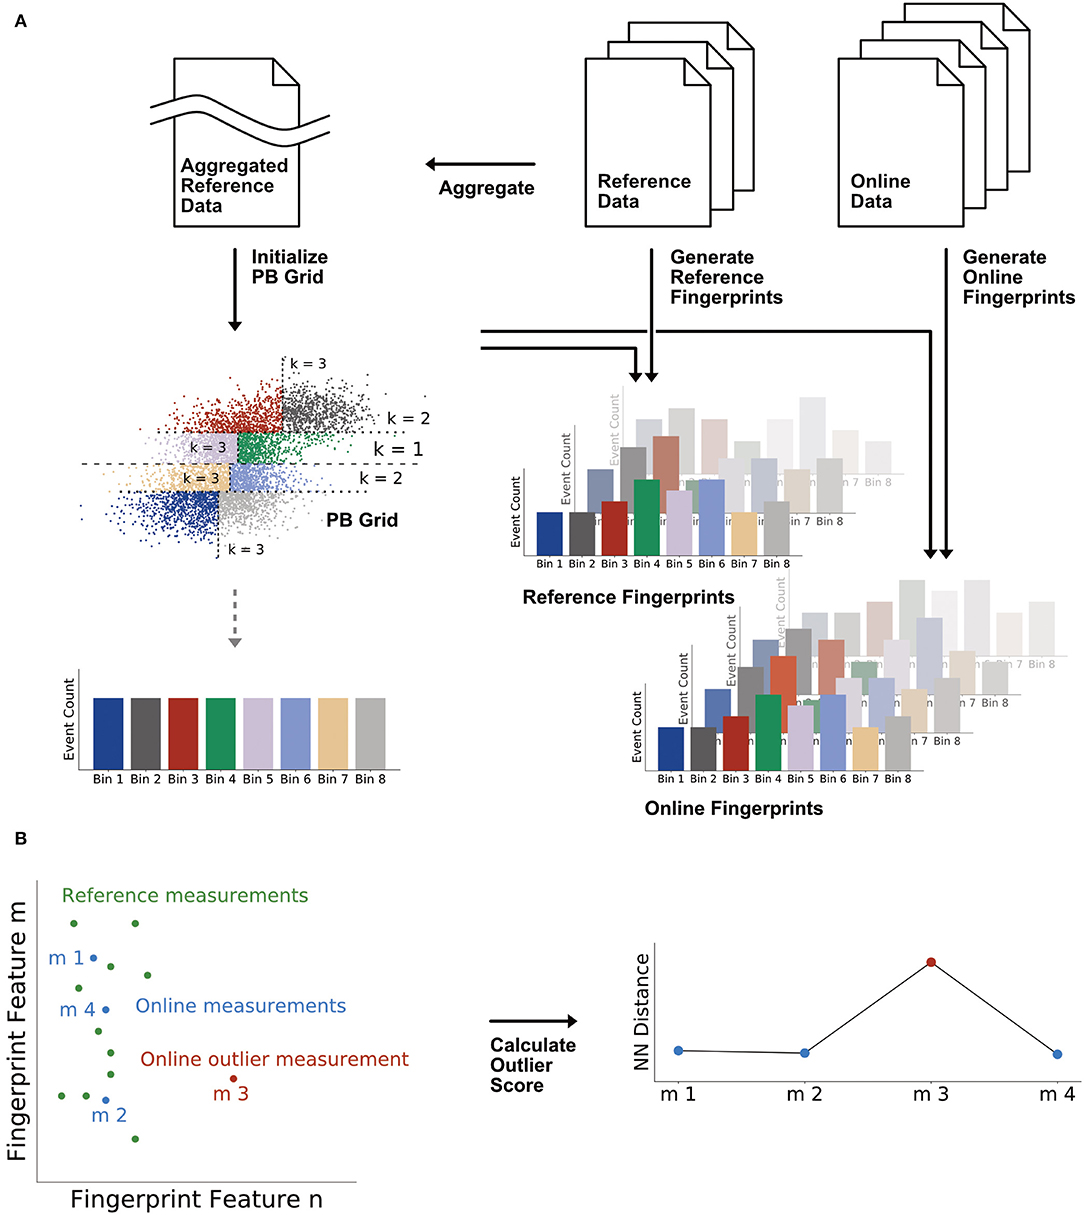
Figure 2. Workflow of the MCCD model which is composed of a fingerprinting algorithm and the k-nearest neighbor algorithm. (A) Fingerprint calculation by the Probability Binning (PB) algorithm. A grid with equal event count is computed on an aggregated data set regrouping all the events from the reference period and is applied to the reference data and to every subsequent online measurement. (B) Distance-based online model where the outlier score is the distance in the fingerprinting space to the nearest neighbor (NN) in the reference set.
In a next step, the outlier score is calculated in the fingerprinting feature space as illustrated in Figure 2B. This part of the MCCD model is called the online model and is based on a nearest neighbor distance method. Distance-based methods allow to perform unsupervised outlier detection in time-series that show a weak time dependence, meaning that close-by data points can have very different values (Aggarwal, 2017). Using this model, we define the outlier score to be the distance to the nearest neighbor (NN) in the reference set. Hence, if an online measurement has a similar fingerprint to a measurement in the reference set, the outlier score will fall close to zero. However, if its fingerprint is very different, the distance to the most similar reference measurement is large and a larger outlier score is returned. As a consequence, the outlier score of a reference measurement is zero, since the nearest neighbor is the measurement itself. The online model is implemented in Python with the NearestNeighbors model class from the scikit-learn library (v0.19.1) (Pedregosa et al., 2011) using the Euclidean distance metric.
2.3. Numerical Experiment–Digital “Mixing”
2.3.1. Data Generation
In the numerical experiment, the original data was obtained by measuring the treated water in the water treatment plant in Le Locle (CH) at the CTE8 measurement point (after the chlorination step) (Egli et al., 2017). Online monitoring was done between the 29th of May and the 29th of June 2017 besides a 2 days interruption that occurred between the 4th and the 6th of June. Measurements were made at 2 h intervals which resulted in a total of 333 measurement files.
We generated a time-series based on this data by digitally adding pathogenic bacteria events into the existing data files. This additional bacteria data were obtained by flow cytometry of pure axenic cultures of the following type: Enterococcus faecalis, Escherichia coli, Ralstonia pickettii, and Pseudomonas aeruginosa (dot plots are shown in Supplementary Figure 1). Before the digital mixing, the bacteria data were preprocessed as described in the previous paragraph. The FCM events of these four bacteria types were then concatenated into one dataset to generate a single bacteria mixture with each type being represented at the same proportion (Supplementary Figure 2).
The original time-series was then divided into five partitions and the last three partitions were spiked at a ratio of 10, 25, and 50%, respectively. For each measurement in these three partitions, the number of bacteria events to be added was calculated according to Spiking Ratio (%) = Added events/Original events · 100. The events were then chosen at random from the bacteria mixture dataset. Dotplots of an original measurement with the corresponding modified measurement (spiked at 25%) are shown in Supplementary Figure 3.
2.3.2. Analysis of the Bin Importance
From the 32 bins that were calculated by the PB algorithm, the 2 bins with the highest discriminative power to distinguish between the original and contaminated measurements were determined. For this purpose, a binary response variable was created with the original measurements (partitions 1 and 2) forming one category and the modified measurements (partitions 3–5) the other. Univariate F-tests were performed to calculate the ANOVA F-value for each feature (bin) with regards to the feature's discriminative power to classify between the original and contaminated measurements (f_classif function from the feature_selection module in scikit-learn; Pedregosa et al., 2011). The 2 bins with the highest F-value shown in Figure 3C are localized in the flow cytometric feature space in Supplementary Figure 5.
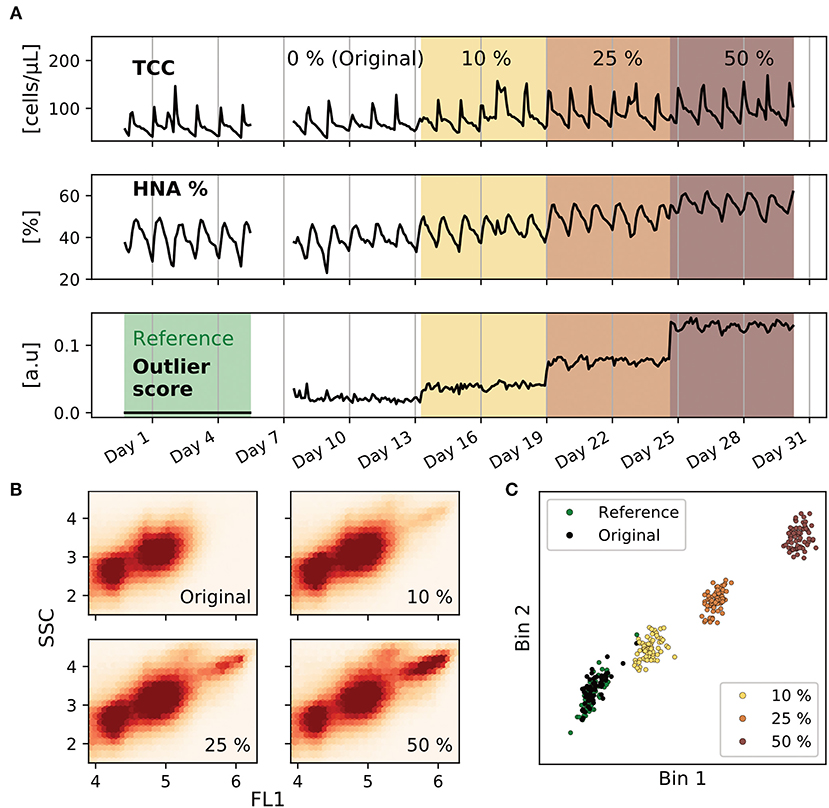
Figure 3. Model testing in a numerical experiment. Data from an original flow cytometric time series was gradually contaminated in-silico with data from pathogenic bacteria. (A) Cell concentration, high nucleic acid (HNA) percentage and outlier score are presented for the entire time series. The time series was divided into five partitions: reference data, original data (0%), spiking at 10, 25, and 50%. (B) Density maps of partitions 2–5 in the flow cytometric signal space, estimated on an aggregate of all measurements in the partition. A darker color corresponds to a higher density. (C) Two-dimensional projection of the fingerprints calculated by the PB algorithm. These two dimensions correspond to the bins that allow to discriminate the most between the original and contaminated measurements (highest ANOVA F-value). One dot corresponds to one FCM measurement, and all the measurements from the displayed time series are plotted. The original measurements (black) overlap with those from the reference set (green), but the spiked measurements (orange, red and dark red for 10, 25, and 50%, respectively) are increasingly far from the reference set cluster.
2.4. Simulated Water System and Wastewater Spikes
Chlorinated municipal drinking water (Lausanne, Switzerland) coming directly from the faucet was continuously flowed through a 1L magnetically stirred vessel. Pressure variations in the feed pipe throughout the day caused the flow rate (F) to vary between 150 and 200 mL/min. To simulate wastewater contamination, we spiked this water with effluent from the wastewater treatment station of Lausanne (STEP de Vidy). This treated wastewater had a cell concentration of 2.5e6 cells/mL and a HNA% of 75% (Supplementary Figure 6). The spiking flow (Finj) was controlled by a syringe pump and the reported wastewater % is defined by Finj/(F+Finj)·100.
During the laboratory experiment, the flow cytometer was connected to the inside of a 1 L stirred tank and measurements were taken at 30-min intervals. Monitoring was maintained during 7 days which resulted in a total of 343 measurement files. The data of this experiment, together with the meta data about the reference and spiking time periods, can be found on FlowRepository and are publicly available under the repository ID FR-FCM-Z2DC.
2.5. Generalization of the Online Model
The online model can be generalized to other input features, i.e., different fingerprinting techniques. We demonstrate this here with phenotypic diversity indexes. The original algorithm was implemented in the statistical software R (Phenoflow_package from https://github.com/CMET-UGent/Phenoflow_package; Props et al., 2016); we adapted it to Python. For each pairwise channel dimension, the bivariate kernel density was estimated with a Gaussian kernel and a bandwidth of 0.01 (default kernel and bandwidth value of the Phenoflow_package) using the KernelDensity model class from the scikit-learn library (Pedregosa et al., 2011). Prior to the density estimation, the number of events in each measurement was randomly downsampled (random seed set to 42). In the simulated wastewater contamination experiment, 10% of the events were retained to have at least 1,000 events in each measurement. Density values were sampled on a regular grid of size 128 × 128 (default values) and the sampled density values from all the pairwise density estimations were concatenated into one vector (this last step does not apply if only two channels were used). The vector elements were normalized by the maximum element value, rounded up to four decimals (default value) and only the non-zero vector elements were retained. If S is the resulting vector length and pi the vector element i, then the diversity indexes D0, D1, and D2 were calculated as follows:
A vector with the element values D0, D1, and D2 was used as the input fingerprint to the nearest neighbor distance model.
3. Results
3.1. Numerical Experiment—Model Testing on in silico Data
A water purification plant was monitored with FCM measuring at two-hour intervals. One month of this data was used as the basis in a computational experiment. The original data showed pronounced periodic fluctuations in the cell concentration with peaks at double the concentration of the valleys (120 vs. 50 cells/μL, Figure 3A) due to the process operation schedule. The plant operates at night, allowing bacteria to grow on the Layered Upflow Carbon Adsorption (LUCA) filter and bulk water during the stagnation phase, then flushing them out when the operation resumes (Egli et al., 2017).
The time-series was partitioned into five periods. The first served as reference set to initialize the MCCD model. The following were used as test set after digital spiking with pathogenic bacteria: none in period 2, 1:10 (added:original) in period 3, 1:4 in period 4, and 1:2 in period 5 (section 2.3). The fitted MCCD model computed an outlier score for each measurement in the test set.
While the pathogenic bacteria events increase the cell concentration, this increment is obscured by the strong daily fluctuations (Figure 3A). In contrast, the outlier score effectively distinguishes between original and perturbed measurements. Where there is no artificial microbial change, the score is close to zero, and where there is an artificially induced community change a linear increase dependent on the number of added pathogens is observed (linear regression: outlier score = 2.19 · 10−3 · spiking ratio + 1.98· 10−2, R2 = 0.98, Supplementary Figure 4). The change in the bacterial community pattern can be well noticed when displaying density maps of each of the partitions (Figure 3B). Two clusters are observed in the original bacterial community and a third cluster appears more and more densely at increased spiking ratios.
To illustrate the inner workings of the model, we represent a scatterplot of the two dimensions with the highest discriminative power to distinguish between the original and contaminated measurements (Figure 3C, Supplementary Figure 5, section 2.3.2). This projection revealed a clustered pattern that clearly separates the original from the modified measurements. The original measurements for which an outlier score close to zero was obtained overlap with the reference measurements, while those with a higher outlier score cluster further away.
3.2. Laboratory Experiment—Model Testing on in vitro Data
To validate the model on real data, a laboratory experiment was designed in which tap water was continuously flowed through a 1 L stirred tank. An automated flow cytometer was connected to the inside of the vessel and took measurements every 30 min. The natural drinking water community was contaminated by injections of wastewater that was collected from the effluent of a wastewater treatment plant (Figure 4). The set-up was operated during 1 week, and seven wastewater spikes as well as a control spike (tap water injection) were performed. The first two and a half days were defined as the reference period that represent the normal tap water bacteria community, and the outlier score was calculated for every subsequent measurement.
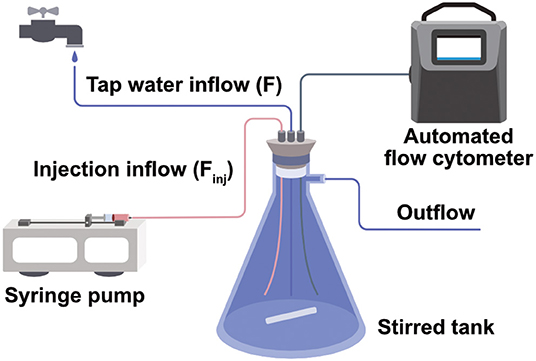
Figure 4. Set-up of a water tank simulating a continuously operating water system. Tap water flows through a 1L stirred flask connected to an automated flow cytometer. Intermittently wastewater is injected to induce microbial perturbations.
The monitoring signals, cell concentration and HNA%, showed pronounced irregular fluctuations with the concentration varying between 200 and 600 cells/μL. On the contrary, the outlier score was unaffected by the changing tap water microbiome and yet largely exceeded its baseline during spikes (Figure 5). The wastewater injections also caused increases in the microbial load and HNA% signals, but these were too slight to determine the spiking times with confidence. A spike with tap water originating from the same faucet was conducted at the end of the experiment to ascertain that the microbial changes were caused by the wastewater fluid and not by any parts related to the set-up. During this control spike no noticeable change was observed in the cell concentration and HNA% signals, nor in the outlier score.
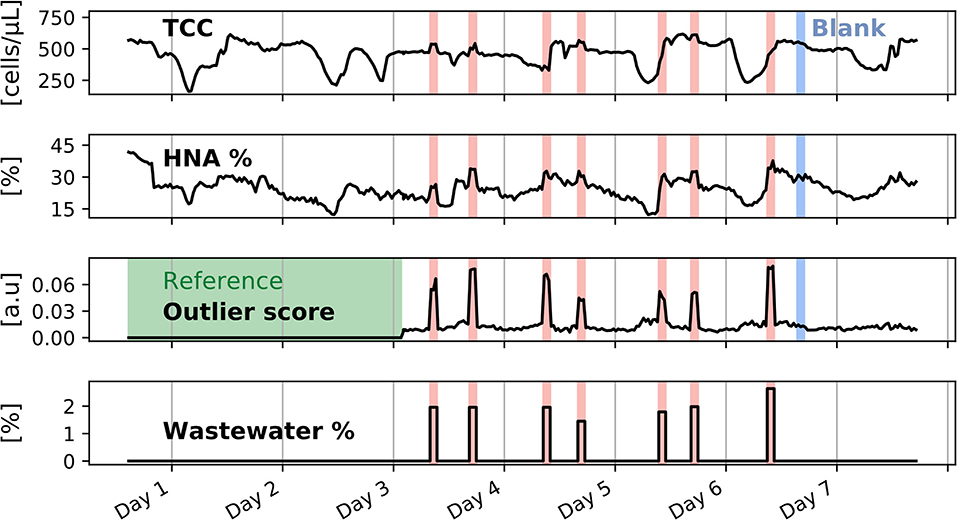
Figure 5. Flow cytometric quality parameters and outlier score after a monitoring time of 1 week. A reference period over 2 and half days was defined, shown as a green shaded area, on which the MCCD model was initialized. Four days of intermittent wastewater spiking were performed, shown here as red shaded areas. During the wastewater spikes, the outlier score signal peaks due to the change in the microbial community. One blank spike with tap water was performed at the end of the online monitoring period and is shown by the blue shaded areas. The blank spike did not affect the amplitude of the outlier score signal.
The wastewater injection flow was very low compared to the tap water flow (the percentage of wastewater to the total flow was kept below 3%). Since the wastewater had a much higher bacteria concentration than the tap water (concentration of 2.5e6 cells/mL for the wastewater), small volumes were sufficient to cause a change in the bacteria community (dot plots of the changing bacterial community at low and high TCC values are shown in Supplementary Figure 7). The wastewater percentage was slightly varied from one spike to the other (between 1.45 and 2.64%), and as in the previous experiment a linear relationship between the outlier score and the wastewater percentage was observed (outlier score = 2.52 · 10−2 · wastewater% + 1.15· 10−2, R2 = 0.92, Supplementary Figure 8). However, this linear relationship is less apparent than in the digital spiking experiment, where the difference in the degree of contamination was more pronounced and where the number of added events was a function of the present bacteria. While more data would be needed to establish robust relationships between the outlier score and a microbial perturbation quantity, it should be noted that if a perturbation is more similar to reference measurements, outlier score variations will be less pronounced.
3.3. Generalization of the Model to Other Input Features
The outlier score derivation relies on the calculation of a fingerprint which is then used as an input in the nearest neighbor distance model. However, instead of using the Probability Binning (PB) algorithm, other fingerprinting methods were considered. Multiple fingerprint calculation methods reported in literature are able to transform the complex event distribution from a flow cytometric measurement into a simpler representation (Koch et al., 2014; Props et al., 2016; Amalfitano et al., 2018). Here, we chose to follow the approach of Props et al. to calculate phenotypic diversity indexes with PhenoFlow (Props et al., 2016) in order to test the generalization of the online model to other input features. The PhenoFlow algorithm characterizes the cell density on a finely spaced grid (FCM fingerprint) from which one-dimensional Hill diversity indices are derived. These were used as input features in the nearest neighbor distance model.
We tested this different model on the data collected from the previous laboratory experiment. The outlier score calculated with the PhenoFlow features identified the spikes as reliably as the one using the PB features (Figure 6). As in the signal derived from the PB algorithm, a linear relationship between the outlier score and the wastewater percentage could be observed (outlier score = 220 · % wastewater + 20.4, R2 = 0.90, Supplementary Figure 9).
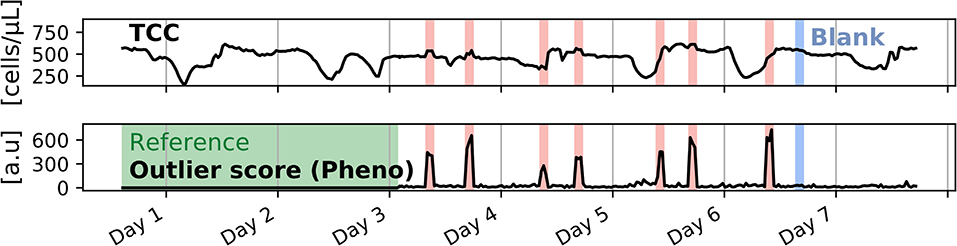
Figure 6. Generalization of the MCCD outlier score to Hill diversity indices derived from PhenoFlow fingerprints, applied to the simulated water system experiment with wastewater spikes. The outlier score signal calculated with PhenoFlow features is very similar to the outlier score signal calculated through the PB features shown in Figure 5.
4. Discussion
4.1. Bacterial Anomalies Better Detected by the Outlier Score Than by the Cell Concentration and HNA%
The numerical and laboratory experiment demonstrated that the outlier score was more performant in detecting the induced bacterial community changes than the classical FCM monitoring signals such as cell concentration and HNA% (Figures 3, 5). While cyclic as well as irregular variations in the standard metrics obscured the intentional microbial contaminations, the outlier score was robust against the variations. The nearest neighbor distance model does not assume any temporal continuity, and thus measurements with an abrupt increase or decrease in the microbial load compared to the previous data point yield the same outlier score as any other measurements with the same microbial populations. Outlier scores are only determined by the shape of the microbial distribution, i.e., by the fingerprint.
The spike microbes used in the digital and laboratory experiments had higher SSC and FL1 intensity than the base microbes, and thus appear obvious in the dotplots (Figure 3B). Despite this, the increase in fluorescence is not sufficient to identify the microbial perturbations using cell count or HNA% (Figure 3A). HNA%, which describes the proportion of high-fluorescence cells, correlates closely with cell concentration in these samples, and thus fluctuates too much to identify small perturbations. This observation again highlights the necessity to analyze flow cytometric measurements in more detail and the fact that fingerprints can extract useful information (Koch et al., 2014).
4.2. The MCCD Model Is Adapted to Irregular Changes in Microbial Communities
The numerical experiment used data collected from a water treatment plant which operates at night and experiences a peak in bacteria concentration at the start of each operation cycle. This cyclical behavior has been reported for other industrial water plants (Besmer and Hammes, 2016; Besmer et al., 2016) and presents a major obstacle when it comes to setting a fixed threshold on the cell concentration. A sudden concentration peak during the day would clearly break the periodic patterns, but would not necessarily be noticed if a threshold with a value higher than the recurring peaks was set. In the simulated water system experiment, wastewater spikes were performed during periods where the microbial load was at a plateau, but also during increases and decreases in cell concentration (Figure 5). Irrespective of the microbial load evolution, the outlier score remained close to zero and only returned higher values during contaminations, and this with a wastewater injection percentage of <3%. In the laboratory set-up, tap water coming directly from the distribution network, without intermediate storage, was analyzed. Typically a drop in bacteria concentration was seen during the night which then again increased in the morning. The exact origin of this daily fluctuations is not known. The additional challenge of differentiating between the normal and intentional concentration increases was new compared to similar experiments where tap water was monitored by FCM in an online fashion and contaminated with axenic cultures and natural microbial communities (Besmer et al., 2017; Props et al., 2018).
In a water treatment process, irregular changes that are considered safe could be taught to the model by adding the corresponding FCM measurements to the reference set. In this way, the outlier score would remain low if this anomaly is encountered again.
4.3. Microbial Community Pattern Integrated Into a Process Control Signal
Transforming multivariate fingerprinting features into a process control signal is a new area of research, with contributions from Props et al. (2018) and Favere et al. (2020). In this work, our FP algorithm of choice was PB since it is fast to compute, it intrinsically adapts to any FCM distribution, and it is applicable to dimensions higher than 2. However, as shown in section 3.3 other FP algorithms are equally valid, although we noticed slightly longer computation times for PhenoFlow. Deriving a process control signal to detect abnormal changes in an unsupervised manner usually comes with a trade-off between false positives and false negatives. Given that online flow cytometery is a recent technology, more research is needed to assess the degree of sensitivity and robustness of different process control signals for microbial community changes.
In addition, care must be taken when linking deviations in the outlier score to the underlying water microbiome. Fingerprints have frequently been used to characterize the richness of bacterial communities and to monitor changes within identified subcommunities (Koch et al., 2013; Props et al., 2016; Amalfitano et al., 2018). The difference between these analyses and the presented work is that here we do not track the biological evolution of the water microbiome. The goal of the process control signal is to quantify disturbances in microbial communities as part of a quality surveillance system. Following the detection of an abnormal change, further microbiological analyses such as heterotrophic plate count or pathogen detection would then be necessary to determine the impact on water quality. We could also imagine to trigger a programmed autosampler to collect water for further analysis (Stadler et al., 2008; Mayer et al., 2015; Owens et al., 2019).
4.4. Automatic Analysis Pipeline for Online FCM Data Processing
In this study, a water system was monitored during 1 week at 30-min intervals which resulted in a large dataset with almost 350 measurement files. In addition to the cell concentration and HNA% which were calculated from a fixed gate, the outlier score was fully automatically calculated. Hence, the method could be integrated into the software of a flow cytometer, to compute the outlier score online. The algorithm, since it is written in Python and compatible with the scikit-learn machine learning library, can readily be integrated in new or existing machine learning pipelines. These properties bring enormous advantages in microbiological monitoring through FCM in an industrial setting: (1) often the time between treatment and distribution is very short, and thus microbial changes that could hint at contamination should be identified as fast as possible, (2) monitoring over long periods of time generates a volume of data that is slow to process offline, and (3) the operator does not need to be familiar with FCM analysis to take actions on the outlier score metrics.
Even though the outlier score calculation is automated, the model itself and its parameters could be further tuned. The model was shown to perform well with different fingerprinting features (Figure 6). Other fingerprinting methods may perform equally well or even better. Instead of using PB or PhenoFlow features, one could imagine using fingerprints that are derived from the automatic calculation of subcommunity clusters by using for instance a deconvolution model (Amalfitano et al., 2018), parametric models such as a Gaussian mixture models (Hastie et al., 2009), or non-parametric models based on kernel density estimates (Mallapragada et al., 2010).
While there might be potential to further explore the data resulting from FCM measurements and extract information useful in process monitoring, the MCCD model could already be employable in its current state. Existing automated flow cytometers could integrate the analysis pipeline into their data processing software. An area requiring more research and further testing would be how long the reference period should be, and whether it should be a fixed time period, a sliding time window or a set of measurements collected throughout a whole year to include seasonal fluctuations (Angiulli and Fassetti, 2007; Schleich et al., 2019). In addition, further work would be required to set an alarm level on the outlier score with a good trade-off between sensitivity and false positives.
Data Availability Statement
The datasets presented in this study can be found in online repositories. The names of the repository/repositories and accession number(s) can be found at: flowrepository.org, repository FR-FCM-Z2DC, github.com/bnovate/bactoml.
Author Contributions
MS, LG, JS, and DW contributed conception and design of the study. MS, LG, and JS conducted the experiments. MS and DW performed the data processing and analysis. MS wrote the first draft of the manuscript. MS, LG, and DW wrote sections of the manuscript. All authors contributed to manuscript revision, read, and approved the submitted version.
Funding
This research was sponsored by bNovate Technologies and received funding from the Eurostars-2 joint programme with co-funding from the European Union Horizon 2020 research and innovation programme (MultiSense Aqua).
Conflict of Interest
All authors are employees of bNovate Technologies.
Acknowledgments
We thank Etienne Montandon and Marta Cassaro da Silva Hainard from VITEOS SA for providing the process measurement data from the water treatment plant of Le Locle, CH. We also thank François Murdter from the wastewater treatment plant of Lausanne, CH (STEP de Vidy) for providing water samples of the treatment process.
Supplementary Material
The Supplementary Material for this article can be found online at: https://www.frontiersin.org/articles/10.3389/frwa.2020.586969/full#supplementary-material
References
Adan, A., Alizada, G., Kiraz, Y., Baran, Y., and Nalbant, A. (2017). Flow cytometry: basic principles and applications. Crit. Rev. Biotechnol. 37, 163–176. doi: 10.3109/07388551.2015.1128876
Aggarwal, C. C. (2017). “Chapter 9: Time series and multidimensional streaming outlier detection,” in Outlier Analysis (Cham: Springer), 273–310. doi: 10.1007/978-3-319-47578-3_9
Allen, M. J., Edberg, S. C., and Reasoner, D. J. (2004). Heterotrophic plate count bacteria–what is their significance in drinking water? Int. J. Food Microbiol. 92, 265–274. doi: 10.1016/j.ijfoodmicro.2003.08.017
Amalfitano, S., Fazi, S., Ejarque, E., Freixa, A., Romaní, A. M., and Butturini, A. (2018). Deconvolution model to resolve cytometric microbial community patterns in flowing waters. Cytomet. Part A 93, 194–200. doi: 10.1002/cyto.a.23304
Angiulli, F., and Fassetti, F. (2007). “Detecting distance-based outliers in streams of data,” in Proceedings of the Sixteenth ACM Conference on Information and Knowledge Management (New York, NY: ACM), 811–820. doi: 10.1145/1321440.1321552
Banna, M. H., Imran, S., Francisque, A., Najjaran, H., Sadiq, R., Rodriguez, M., et al. (2014). Online drinking water quality monitoring: review on available and emerging technologies. Crit. Rev. Environ. Sci. Technol. 44, 1370–1421. doi: 10.1080/10643389.2013.781936
Besmer, M. D., Epting, J., Page, R. M., Sigrist, J. A., Huggenberger, P., and Hammes, F. (2016). Online flow cytometry reveals microbial dynamics influenced by concurrent natural and operational events in groundwater used for drinking water treatment. Sci. Rep. 6:38462. doi: 10.1038/srep38462
Besmer, M. D., and Hammes, F. (2016). Short-term microbial dynamics in a drinking water plant treating groundwater with occasional high microbial loads. Water Res. 107, 11–18. doi: 10.1016/j.watres.2016.10.041
Besmer, M. D., Sigrist, J. A., Props, R., Buysschaert, B., Mao, G., Boon, N., et al. (2017). Laboratory-scale simulation and real-time tracking of a microbial contamination event and subsequent shock-chlorination in drinking water. Front. Microbiol. 8:1900. doi: 10.3389/fmicb.2017.01900
Buysschaert, B., Kerckhof, F.-M., Vandamme, P., De Baets, B., and Boon, N. (2018a). Flow cytometric fingerprinting for microbial strain discrimination and physiological characterization. Cytomet. Part A 93, 201–212. doi: 10.1002/cyto.a.23302
Buysschaert, B., Vermijs, L., Naka, A., Boon, N., and De Gusseme, B. (2018b). Online flow cytometric monitoring of microbial water quality in a full-scale water treatment plant. NPJ Clean Water 1:16. doi: 10.1038/s41545-018-0017-7
Cheswick, R., Cartmell, E., Lee, S., Upton, A., Weir, P., Moore, G., et al. (2019). Comparing flow cytometry with culture-based methods for microbial monitoring and as a diagnostic tool for assessing drinking water treatment processes. Environ. Int. 130:104893. doi: 10.1016/j.envint.2019.06.003
De Roy, K., Clement, L., Thas, O., Wang, Y., and Boon, N. (2012). Flow cytometry for fast microbial community fingerprinting. Water Res. 46, 907–919. doi: 10.1016/j.watres.2011.11.076
Egli, T., and Stefan, K. (2015). “Flow cytometry in microbiology, flow cytometry for rapid microbiological analysis of drinking water: from science to practice–an unfinished story,” in Flow Cytometry in Microbiology: Technology and Applications, ed M. G. Wilkinson (Norfolk: Caister Academic Press), 175–215. doi: 10.21775/9781910190111.09
Egli, T., Zimmermann, S., Schärer, P., Senouillet, J., Kuenzi, S., Köster, O., et al. (2017). Automatische Online-Überwachung. bestimmung der bakterienzahl im roh- und trinkwasser: resultate aus der praxis [Automatic online monitoring. determination of the bacteria count in raw and drinking water: results from industry]. Aqua Gas 97, 52–59. Available online at: https://www.aquaetgas.ch/wasser/trinkwasser-grundwasser/20171001-automatische-onlineberwachung/
Favere, J., Buysschaert, B., Boon, N., and De Gusseme, B. (2020). Online microbial fingerprinting for quality management of drinking water: full-scale event detection. Water Res. 170:115353. doi: 10.1016/j.watres.2019.115353
Gasol, J. M., Zweifel, U. L., Peters, F., Fuhrman, J. A., and Hagström, Å. (1999). Significance of size and nucleic acid content heterogeneity as measured by flow cytometry in natural planktonic bacteria. Appl. Environ. Microbiol. 65, 4475–4483. doi: 10.1128/AEM.65.10.4475-4483.1999
Gensberger, E. T., Gössl, E.-M., Antonielli, L., Sessitsch, A., and Kostić, T. (2015). Effect of different heterotrophic plate count methods on the estimation of the composition of the culturable microbial community. PeerJ 3:e862. doi: 10.7717/peerj.862
Hastie, T., Tibshirani, R., and Friedman, J. (2009). The Elements of Statistical Learning: Data Mining, Inference, and Prediction. New York, NY: Springer Science & Business Media.
Hrudey, S., and Hrudey, E. (2019). Common themes contributing to recent drinking water disease outbreaks in affluent nations. Water Supply 19, 1767–1777. doi: 10.2166/ws.2019.051
Hrudey, S. E., and Hrudey, E. J. (2007). Published case studies of waterborne disease outbreaks–evidence of a recurrent threat. Water Environ. Res. 79, 233–245. doi: 10.2175/106143006X95483
Kantor, R. S., Miller, S. E., and Nelson, K. L. (2019). The water microbiome through a pilot scale advanced treatment facility for direct potable reuse. Front. Microbiol. 10:993. doi: 10.3389/fmicb.2019.00993
Katko, T., and Højris, B. (2019). Microbiological Sensors for the Drinking Water Industry. London: IWA Publishing.
Koch, C., Günther, S., Desta, A. F., Hübschmann, T., and Müller, S. (2013). Cytometric fingerprinting for analyzing microbial intracommunity structure variation and identifying subcommunity function. Nat. Protoc. 8:190. doi: 10.1038/nprot.2012.149
Koch, C., Harnisch, F., Schröder, U., and Müller, S. (2014). Cytometric fingerprints: evaluation of new tools for analyzing microbial community dynamics. Front. Microbiol. 5:273. doi: 10.3389/fmicb.2014.00273
Lebaron, P., Servais, P., Agogué, H., Courties, C., and Joux, F. (2001). Does the high nucleic acid content of individual bacterial cells allow us to discriminate between active cells and inactive cells in aquatic systems? Appl. Environ. Microbiol. 67, 1775–1782. doi: 10.1128/AEM.67.4.1775-1782.2001
Mallapragada, P. K., Jin, R., and Jain, A. (2010). “Non-parametric mixture models for clustering,” in Joint IAPR International Workshops on Statistical Techniques in Pattern Recognition (SPR) and Structural and Syntactic Pattern Recognition (SSPR), Vol. 6218 (Berlin; Heidelberg: Springer), 334–343. doi: 10.1007/978-3-642-14980-1_32
Mayer, R., Vierheilig, J., Egle, L., Reischer, G., Saracevic, E., Mach, R., et al. (2015). Automated sampling procedures supported by high persistence of bacterial fecal indicators and bacteroidetes genetic microbial source tracking markers in municipal wastewater during short-term storage at 5 c. Appl. Environ. Microbiol. 81, 5134–5143. doi: 10.1128/AEM.00998-15
Montandon, P.-E., Hainard, M. C., Guns, M., Marguet, J.-F., and Eichenberger, N. (2019). Réseaux de La Chaux-de-Fonds et du Locle: analyse de la qualité microbiologique de l'eau potable [Water networks of “La Chaux-de-Fonds” and “Locle”: analysis of the microbial drinking water quality]. Aqua Gas 99, 26–35. Available online at: https://www.aquaetgas.ch/fr/eau/eau-potable-eau-souterraine/20190528_analyse-de-la-qualité-microbiologique-de-leau-potable-dans-le-réseau/
Moreira, N., and Bondelind, M. (2016). Safe drinking water and waterborne outbreaks. J. Water Health 15, 83–96. doi: 10.2166/wh.2016.103
Owens, D. W., Hunt, R. J., Firnstahl, A. D., Muldoon, M. A., and Borchardt, M. A. (2019). Automated time series measurement of microbial concentrations in groundwater-derived water supplies. Groundwater 57, 329–336. doi: 10.1111/gwat.12822
Pedregosa, F., Varoquaux, G., Gramfort, A., Michel, V., Thirion, B., Grisel, O., et al. (2011). SCIKIT-learn: machine learning in Python. J. Mach. Learn. Res. 12, 2825–2830. Available online at: https://www.jmlr.org/papers/volume12/pedregosa11a/pedregosa11a.pdf
Prest, E., Hammes, F., Kötzsch, S., Van Loosdrecht, M., and Vrouwenvelder, J. S. (2013). Monitoring microbiological changes in drinking water systems using a fast and reproducible flow cytometric method. Water Res. 47, 7131–7142. doi: 10.1016/j.watres.2013.07.051
Props, R., Monsieurs, P., Mysara, M., Clement, L., and Boon, N. (2016). Measuring the biodiversity of microbial communities by flow cytometry. Methods Ecol. Evol. 7, 1376–1385. doi: 10.1111/2041-210X.12607
Props, R., Rubbens, P., Besmer, M., Buysschaert, B., Sigrist, J., Weilenmann, H., et al. (2018). Detection of microbial disturbances in a drinking water microbial community through continuous acquisition and advanced analysis of flow cytometry data. Water Res. 145, 73–82. doi: 10.1016/j.watres.2018.08.013
Roederer, M., Moore, W., Treister, A., Hardy, R. R., and Herzenberg, L. A. (2001). Probability binning comparison: a metric for quantitating multivariate distribution differences. Cytometry 45, 47–55. doi: 10.1002/1097-0320(20010901)45:1<47::AID-CYTO1143>3.0.CO;2-A
Rogers, W. T., and Holyst, H. A. (2009). Flowfp: a bioconductor package for fingerprinting flow cytometric data. Adv. Bioinform. 2009:193947. doi: 10.1155/2009/193947
Safford, H. R., and Bischel, H. N. (2018). Flow cytometry applications in water treatment, distribution, and reuse: a review. Water Res. 151, 110–133. doi: 10.1016/j.watres.2018.12.016
Schleich, C., Chan, S., Pullerits, K., Besmer, M. D., Paul, C. J., Rådström, P., et al. (2019). Mapping dynamics of bacterial communities in a full-scale drinking water distribution system using flow cytometry. Water 11:2137. doi: 10.3390/w11102137
Stadler, H., Skritek, P., Sommer, R., Mach, R. L., Zerobin, W., and Farnleitner, A. H. (2008). Microbiological monitoring and automated event sampling at karst springs using leo-satellites. Water Sci. Technol. 58, 899–909. doi: 10.2166/wst.2008.442
Van Nevel, S., Buysschaert, B., De Roy, K., De Gusseme, B., Clement, L., and Boon, N. (2017a). Flow cytometry for immediate follow-up of drinking water networks after maintenance. Water Res. 111, 66–73. doi: 10.1016/j.watres.2016.12.040
Van Nevel, S., Koetzsch, S., Proctor, C. R., Besmer, M. D., Prest, E. I., Vrouwenvelder, J. S., et al. (2017b). Flow cytometric bacterial cell counts challenge conventional heterotrophic plate counts for routine microbiological drinking water monitoring. Water Res. 113, 191–206. doi: 10.1016/j.watres.2017.01.065
Keywords: flow cytometry, microbial community, fingerprinting, unsupervised anomaly detection, distance-based outliers, data stream, drinking water quality
Citation: Sadler MC, Senouillet J, Kuenzi S, Grasso L and Watson DC (2020) Computational Surveillance of Microbial Water Quality With Online Flow Cytometry. Front. Water 2:586969. doi: 10.3389/frwa.2020.586969
Received: 24 July 2020; Accepted: 09 October 2020;
Published: 17 November 2020.
Edited by:
William Paul Johnson, The University of Utah, United StatesReviewed by:
Ruben Props, Ghent University, BelgiumPeter Rubbens, Flanders Marine Institute, Belgium
Stefano Amalfitano, National Research Council (CNR), Italy
Copyright © 2020 Sadler, Senouillet, Kuenzi, Grasso and Watson. This is an open-access article distributed under the terms of the Creative Commons Attribution License (CC BY). The use, distribution or reproduction in other forums is permitted, provided the original author(s) and the copyright owner(s) are credited and that the original publication in this journal is cited, in accordance with accepted academic practice. No use, distribution or reproduction is permitted which does not comply with these terms.
*Correspondence: Douglas C. Watson, ZG91Z2xhcy53YXRzb25AYm5vdmF0ZS5jb20=