 Thomas Adler1*
 Kristen L. Underwood2Donna M. Rizzo2Adrian Harpold3
 Gary Sterle3
 Li Li4Hang Wen4
 Lindsey Stinson1
 Caitlin Bristol1
 Bryn Stewart4
 Andrea Lini1
 Nicolas Perdrial1
 Julia N. Perdrial1*
- 1Department of Geology, University of Vermont, Burlington, VT, United States
- 2Department of Civil and Environmental Engineering, University of Vermont, Burlington, VT, United States
- 3Department of Natural Resources and Environmental Science, University of Nevada, Reno, NV, United States
- 4Department of Civil and Environmental Engineering, Penn State University, Centre County, PA, United States
Understanding and predicting catchment responses to a regional disturbance is difficult because catchments are spatially heterogeneous systems that exhibit unique moderating characteristics. Changes in precipitation composition in the Northeastern U.S. is one prominent example, where reduction in wet and dry deposition is hypothesized to have caused increased dissolved organic carbon (DOC) export from many northern hemisphere forested catchments; however, findings from different locations contradict each other. Using shifts in acid deposition as a test case, we illustrate an iterative “process and pattern” approach to investigate the role of catchment characteristics in modulating the steam DOC response. We use a novel dataset that integrates regional and catchment-scale atmospheric deposition data, catchment characteristics and co-located stream Q and stream chemistry data. We use these data to investigate opportunities and limitations of a pattern-to-process approach where we explore regional patterns of reduced acid deposition, catchment characteristics and stream DOC response and specific soil processes at select locations. For pattern investigation, we quantify long-term trends of flow-adjusted DOC concentrations in stream water, along with wet deposition trends in sulfate, for USGS headwater catchments using Seasonal Kendall tests and then compare trend results to catchment attributes. Our investigation of climatic, topographic, and hydrologic catchment attributes vs. directionality of DOC trends suggests soil depth and catchment connectivity as possible modulating factors for DOC concentrations. This informed our process-to-pattern investigation, in which we experimentally simulated increased and decreased acid deposition on soil cores from catchments of contrasting long-term DOC response [Sleepers River Research Watershed (SRRW) for long-term increases in DOC and the Susquehanna Shale Hills Critical Zone Observatory (SSHCZO) for long-term decreases in DOC]. SRRW soils generally released more DOC than SSHCZO soils and losses into recovery solutions were higher. Scanning electron microscope imaging indicates a significant DOC contribution from destabilizing soil aggregates mostly from hydrologically disconnected landscape positions. Results from this work illustrate the value of an iterative process and pattern approach to understand catchment-scale response to regional disturbance and suggest opportunities for further investigations.
Introduction
Disturbances such as land-cover transformation, amplification of biogeochemical flows, and climate disruption are triggering transitions in the Earth system that are unprecedented on human timescales (Steffen et al., 2018; Abbott et al., 2019). Potential and ongoing ecosystem state changes may impact billions of individuals (Abatzoglou and Williams, 2016; Van Loon et al., 2016; Dupas et al., 2019), highlighting the need to better understand the factors that determine how catchments respond to multiple disturbance types and in different contexts.
However, attributing catchment response to even a specific driver is challenging because the scale of disturbance often transcends the bounds of individual sites that, themselves, have heterogeneous spatial characteristics. While spatial and temporal patterns at larger scales can be extracted from relevant data (e.g., atmospheric deposition data), finding patterns that hold true across individual catchments remains a challenge that was already described decades ago as “uniqueness of place” for hydrological modeling (Beven, 2000). Research shows that a direct scaling of site-specific observations to a larger-scale trend (and vice versa) might not be possible and that scaling mismatches might be the norm rather than the exception (Levin, 1992; NSF, 2018). For example, Preston et al. (2011) used lab mesocosm, field monitoring and long-term stream data to investigate the impact of climate drivers on dissolved organic carbon (DOC) liberation, and found that variations in temperature and moisture impacted DOC concentrations differently for each scale of observation. While direct upscaling and downscaling might lead to loss of information and insight, an approach that does not seek direct links across scales but that investigates larger-scale pattern and site-specific process in an iterative fashion might provide some remedy (Sivapalan, 2005). In such an approach, regional patterns might point to a possible process (i.e., pattern-to-process), while process investigation might provide more insights with each iteration (i.e., process-to-pattern).
Acidification (and ensuing reduction in acid deposition) is a good candidate for iterative pattern and process investigation in the context of disturbances. Large variation in forested catchment signals including increases in stream DOC exports are attributed reductions in acid deposition, but the pattern is not consistent (Driscoll et al., 2003; Burns et al., 2006; De Wit et al., 2007; Monteith et al., 2007; Hruška et al., 2009; Sanclements et al., 2018). For example, some catchments have shown increases in DOC concentration despite continued acid deposition (Oni et al., 2013), while others showed reduced deposition without attendant increases in DOC (Löfgren and Zetterberg, 2011). Concurrent with the reduction in acid deposition, changes to the climate system have led to increasing precipitation, which is amplified by increasing frequency of extreme hydrological events such as heavy precipitation (Jentsch et al., 2007; Campbell et al., 2009; Arnone et al., 2011; Seneviratne et al., 2012). For example, in the case of catchments in the Northeastern US, increased heavy precipitation and reduced acid deposition could lead to increased exports of DOC, as shown in a long-term, paired catchment study (Sanclements et al., 2018) where one catchment received continuous acid treatment while the other was allowed to recover from acidification. The latter catchment exported significantly more DOC, indicating a strong effect of reduced acid deposition; however, the temporal variability in stream DOC concentrations for both catchments was high due to shifts in precipitation patterns. While these overlapping disturbances alone can lead to DOC patterns that are difficult to interpret, variations in catchment-specific characteristics likely drive differences in DOC export patterns in areas that receive similar acid loadings (Clark et al., 2010). The authors of the latter study note that seasonal, short-term inter-annual and longer-term temporal variation interact in complex ways, masking otherwise compatible patterns, and suggest careful process investigation. Lastly, variation in length of record and reporting methods (Eimers et al., 2008a) present a continuous challenge.
At the catchment scale, processes that lead to DOC liberation into streams are coupled and highly complex. Especially in forested headwater catchments, DOC is primarily controlled by soil organic matter (SOM) that supplies DOC when soils are flushed in response to precipitation and, in snow-dominated systems, during snowmelt (Boyer et al., 1996; Raymond and Saiers, 2010; Wilson et al., 2013; Moatar et al., 2017; Perdrial et al., 2018; Zarnetske et al., 2018; Zhi et al., 2020). Thus, DOC is often controlled by discharge (Q) and studies now increasingly use flow-adjusted DOC concentrations (DOCFA) or fluxes in their assessment to test for DOC drivers other than Q (Burns et al., 2006). This hydrological control is also embedded in the broader context of spatial and temporal variability of catchment processes. Recent observations and reactive transport modeling support the shallow and deep hypothesis that high concentration DOC in stream under wet, high discharge conditions comes from shallow soils enriched with SOM, whereas low stream DOC under dry, low discharge conditions originates from deeper groundwater that is often depleted in DOC (Zhi et al., 2019). The concept of ecosystem control points is very useful in exemplifying this complexity and heterogeneity because variable importance of DOC supply vs. transport is acknowledged (Bernhardt et al., 2017). For example, catchment locations such as planar hillslopes accumulate materials until they are hydrologically connected and episodically flushed (export control points) and lead to high temporal variability in DOC exports in streams during events. In contrast, locations such as riparian zones and swales exhibit high degrees of biogeochemical activity and near continuous connectivity to the stream (permanent control points) and the ensuing impact on stream DOC is more continuous. Because microbial processing is regulated by soil temperature and moisture (Wen et al., 2020), landscape positions with favorable soil moisture conditions promote microbial DOC processing and losses to the atmosphere as CO2, thus reducing DOC concentrations in soil solution (Moyano et al., 2013). In turn, very wet conditions suppress aerobic DOC respiration leading to DOC accumulation available for flushing (Huang and Hall, 2017). Because SOM is an important supplier for DOC, SOM stability also needs to be considered in this context. SOM can be stabilized chemically, through adsorption on clay and silt particles (Six et al., 2002; Perdrial et al., 2010) or physically, through the occlusion within soil micro-aggregates (<250 μm) that limit microbial processing (Lin et al., 2006; Mikutta et al., 2006; Kleber and Johnson, 2010; Schmidt et al., 2011; Li et al., 2017). Recent research has indeed begun to link reduced acid deposition and subsequent changes in soil chemistry (ionic strength and pH) to changes in SOM stabilization in aggregates driving DOC loss at the catchment scale (Armfield et al., 2019; Cincotta et al., 2019). Because these conditions vary in scale, both in space (region, catchment, landscape position within a catchment) and time (decadal vs. seasonal), this complexity is difficult to detangle and a good test case for iterative pattern and process investigations.
The overarching goal of this study is to illustrate opportunities and challenges with the process and pattern approach using increased and decreased acid deposition as test case. We apply one iteration as starting point with the intent to critically evaluate the opportunities and limitations of each approach, as well as the integration of observations across these scales. For pattern investigation at the regional scale, we investigate linkages between reduced acid deposition and stream DOC response and the potential role of catchment characteristics as covariates in that response (objective 1). For this we apply regional atmospheric deposition data from the National Atmospheric Deposition Program (NADP), catchment biogeophysical and hydrometeorological attributes (Addor et al., 2017), and a newly curated dataset that includes co-located stream Q and stream chemistry data (Sterle et al., 2019). We use flow-adjusted stream chemistry data to remove the typically dominant Q control from temporal trends and to better isolate potential signals in response to reduced acid deposition in stream DOC concentrations (Helsel et al., 2020). We compute trend analyses for long-term data sets and compare stream water DOC trend directionality against sulfate () deposition trends as one proxy for shifts in atmospheric deposition, and we compare these trends to catchment attributes (Addor et al., 2017) to determine if common catchment scale characteristics might be associated with these trends. For process investigations, we test the effect of leaching solution composition on soil aggregate stability and DOC release experimentally (objective 2). For this, we use soils cores from several landscape positions and locations in catchments with opposite long-term DOC trends [Susquehanna Shale Hills Critical Zone Observatory (SSHCZO) and the Sleepers River Research Watershed (SRRW)] and critically evaluate opportunities and limitations of integrating these observations with large-scale patterns (Figure 1).
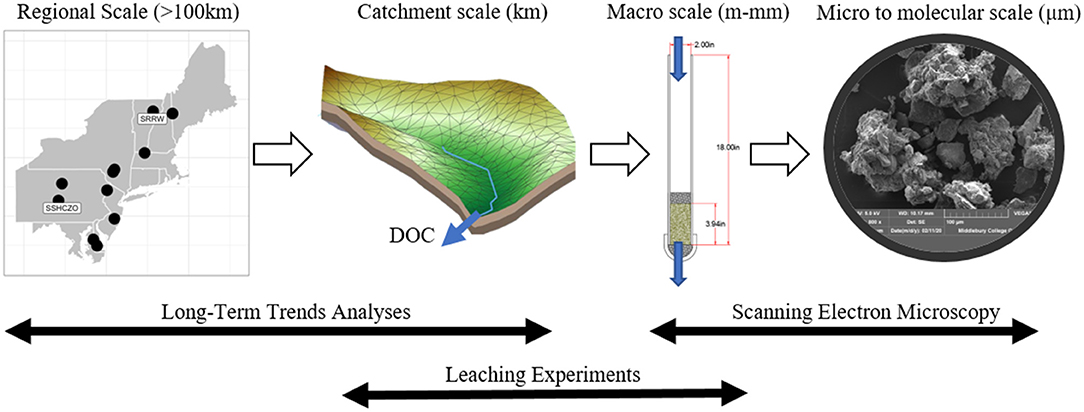
Figure 1. Conceptual depiction of investigated scales.
Methods and Materials
Long-Term Trend Analyses at the Regional Scale
Site Selection and Data Collection
To characterize trends in DOC and Q, we utilized the recently-developed CAMELS-Chem dataset (Sterle et al., 2019). This dataset complements the existing CAMELS dataset with additional atmospheric deposition and water chemistry data for 671 catchments, 499 of which are >50% forest cover. The temporal record of stream chemistry varies depending on the individual catchment, with all records ranging between 1980 and 2019. In this study, we constrained the dataset to forested catchments, that is catchments with >50% forest cover, in the Northeastern United States. This was done to minimize land cover drivers from our analyses (Figure 2). Within the Northeast, we further constrained catchments according to their length of available stream DOC and Q records (at least five sequential years) and the density of the records (i.e., no gaps >1/3rd of the total record length) (Meals et al., 2011). Once we identified suitable catchments, we compiled all available DOC concentration and Q records from said catchments for trend and statistical analyses.
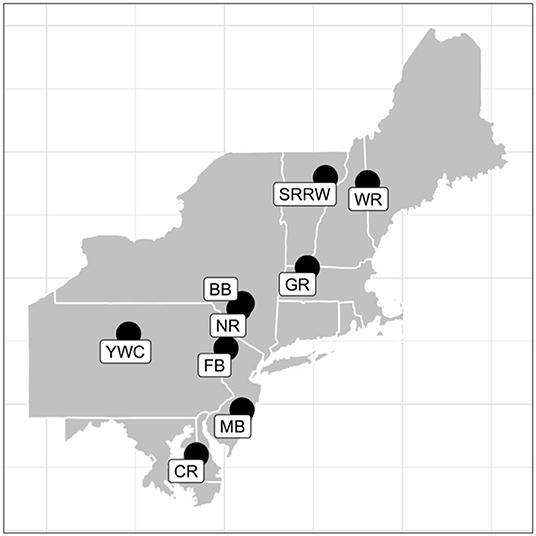
Figure 2. Northeastern headwater catchments in the CAMELS-Chem dataset selected for long-term trend analyses. For full gauge names and gauge numbers see Table 1.
To characterize trends in wet deposition of , we utilized the National Atmospheric Deposition Program (NADP) National Trends Data (NADP Program Office, 2021). The daily frequency records in from these sites were then clipped to match the record length of available DOC and Q data from the associated catchments.
Flow-Adjusted Stream Concentration Data
We flow-adjusted the time series of stream DOC concentration data for each selected catchment to remove the typically dominant Q control from temporal trends and to better isolate potential signals of deterministic trends in stream response (such as stream response to reduced acid deposition). This method has been used in a number of studies that sought to describe temporal trends in stream chemistry constituents that are often confounded by varying stream flow conditions (Hirsch and Slack, 1984; Helsel and Hirsch, 2002; Bekele and Mcfarland, 2004). We first regressed log-transformed DOC concentrations on log-Q data, applying a Locally Weighted Scatterplot Smoothing (LOWESS) algorithm and extracted the residuals. For each regression fit, we used a smoothing pattern coefficient of 0.67 (f = 0.67). One of the benefits of this technique is that a LOWESS model does not assume linearity or normality in the data, therefore not limiting the concentration (C)-Q relationship in each catchment to one specific model (see Supplementary Figure 1 for C-Q plots). We then reordered residuals from the LOWESS fit (i.e., DOCFA concentrations), based on the date/time stamp associated with each observation, and performed a monotonic trend analysis on these residuals using a seasonal Mann-Kendall test (section Seasonal Kendall, see Supplementary Figure 2 and accompanying description for details).
Change Point Detection
We applied a Pettitt test to DOCFA concentrations to identify any threshold effects in trend that would otherwise be missed by simply identifying monotonic trends. The Pettitt test is a non-parametric technique used to identify a single change point in continuous time series data (Pettitt, 1979). This test has been used in a number of studies to detect abrupt changes in hydrologic and climatic variables such as precipitation (Busuioc and Storch, 1996), flood peaks (Liu et al., 2012), and temperature (Wijngaard et al., 2003).
Seasonal Kendall
With both DOCFA and deposition data for each catchment, we utilized seasonal Kendall tests to determine the directionality of the aquatic and atmospheric trends. A seasonal Kendall test is widely used as a non-parametric, statistical technique for detecting monotonic trends in time series (Hirsch and Slack, 1984). In this setting, it indicates whether DOCFA, independent of seasonal variability, is increasing or decreasing over time. The product is the normalized test statistic, Kendall's tau, which ranges from −1 to 1. For this analysis, we define “positive trends” as those with a tau value >0.05 and significant beyond an associated alpha threshold of 0.05. “Negative trends” are defined as having a tau value <-0.05 with an alpha threshold of 0.05; and “no trends” are defined as any results that do not meet the requirements of positive or negative trends.
Experiments on Select Catchment Soils
Field Site Descriptions
To test the impact of soil solution and landscape position on DOC dynamics, we sampled soils from two forested headwater catchments with contrasting long-term DOC dynamics for experimentation (Figure 3). The SSHCZO is a 0.08-km2 forested catchment located in central Pennsylvania in close proximity to Young Woman's Creek (YWC, Figure 3). The catchment is underlain by thick shale and is a first order basin with steep south- and north-facing slopes (25–35%) and narrow ridges. The SSHCZO has a mean annual temperature of ~9.8°C and a humid continental climate. Mean annual precipitation averages 1,029-mm and is characterized as acidic (pH ~4) and stream water is mildly acidic with an average pH of 5.6 (Supplementary Figure 3) (Wen et al., 2020). The soils are derived from colluvium and/or residuum from the underlying shale formation and are Inceptisols and Ultisols with primarily silt loam shallow horizons and a 3 to 5-cm organic layer containing decaying leaf litter (Giardino and Houser, 2015). A number of studies that focused on the cycling of DOC have used the SSHCZO including Andrews et al. (2011), who identified hot spots and hot moments of DOC transport, and Bao et al. (2017), who developed a reactive transport model to predict DOC flux (Andrews et al., 2011; Bao et al., 2017; Wen et al., 2020).
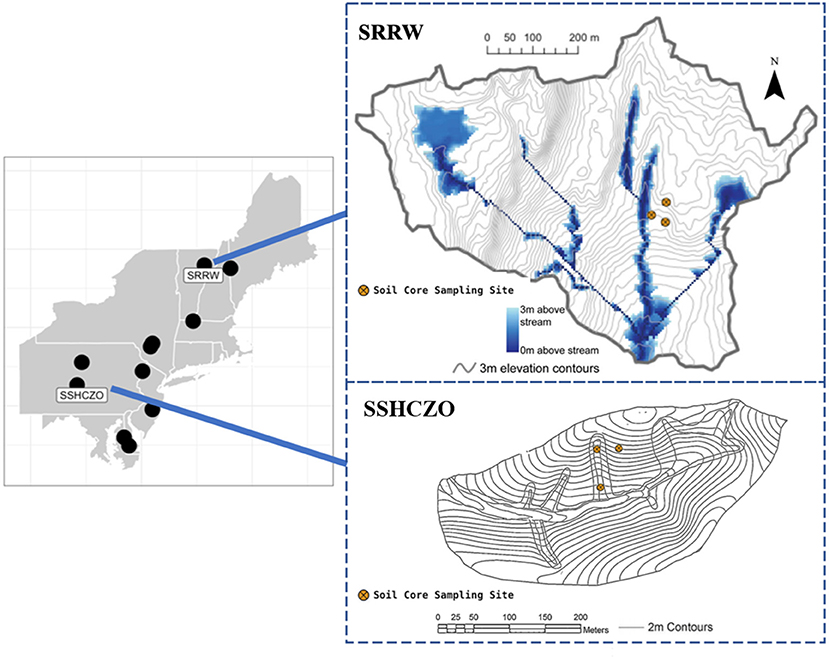
Figure 3. Location of field sites: the Sleeper River Research Watershed (SRRW) map is derived from Shanley et al. (2015) and the Susquehanna Shale Hills Critical Zone Observatory (SSHCZO) map is modified after Lin et al. (2006) with permission. This figure was modified from Hydrological Processes, 29, Shanley, James B., Stephen D. Sebestyen, Jeffrey J. McDonnell, Brian L. McGlynn, and Thomas Dunne. ‘Water’s Way at Sleepers River watershed – revisiting flow generation in a post-glacial landscape, Vermont USA', 3447–59, Copyright 2014, with permission from John Wiley and Sons and from Geoderma, 131, Soil moisture patterns in a forested catchment: A hydropedological perspective, 345–368, Copyright 2006, with permission from Elsevier.
The SRRW, as defined in this study, is a 0.41-km2 completely forested headwater subcatchment located in eastern Vermont (Figure 3). It is underlain by calcareous granulite and quartz mica phyllite with a forest cover of primarily northern hardwoods such as beech, maple, birch, and ash (Shanley et al., 2004). The catchment encompasses three tributary streams that begin at headwater swamps and move through steep terrain and mid-elevation benches before meeting in an intersection of slopes at the base of the catchment. The main soil types are Spodosols and Inceptisols in the uplands and Histosols in the lowlands (Kendall et al., 1999). Due to the presence of carbonates in the parent material, ground water and stream water at SRRW are well-buffered with a pH above 7 (Hornbeck et al., 1997; Armfield et al., 2019), also see Supplementary Figure 3.
Soil Core Sampling
In both the SSHCZO and SRRW catchments, soil cores, and samples were collected from the top 10-cm of the soil profile (O/A Horizons) in both swales and planar hillslopes to capture important ecosystem control points. We acquired soil cores for the stop-flow experiment by hammering 2-inch inner diameter PVC pipes with beveled bottoms 10-cm into the soil profile after removing any leaf litter. We then gently dug cores out of the soil profile and capped them to not lose any loose material before being put into a cooler with ice for transport. A total of 18 soil cores were collected for each catchment and sampling time (12 from swales and 6 from planar hillslope locations).
Fall soil samples collected for micro-aggregate separation were acquired from the top 10-cm of the soil horizon in plastic bags and also stored in the cooler for transport before being air-dried. For those experiments designated as occurring in the spring, soil cores were collected from SSHCZO on May 28th, 2019 and SRRW on June 10th, 2019. For the fall experiments, soil cores and samples were collected from SSHCZO on November 8th and SRRW on November 17th.
Experimental Approach to Examining Micro-Scale DOC Dynamics
We conducted stop-flow experiments on soil cores sampled during both the spring and fall seasons to account for seasonal variability within 24-h of sample collection (see Supplementary Figure 4 for a schematic of the core design). Each core was treated with 120-ml of experimental solution that was poured carefully from the top and allowed to saturate the core for 5 min. We used two experimental solutions: the “acidification” solution, simulating acid deposition conditions, had a pH of 3 and an IS of 0.01 M. The “recovery” solution, simulating absence of anthropogenic acids, had a pH of 5.3 and low IS (nanopure water). Note that we refer to this solution as “recovery” solution to indicate near neutral pH and low IS typical for rain in absence of acid deposition and not the ecosystem concept of recovery. After 5 min of interaction time between solution and soils, a valve at the bottom of core was opened, allowing any effluent to drain into a collection vessel. Once the cores drained gravitationally (~4 min) the valve was closed, and the process repeated three more times yielding 4 separate samples for repeat core treatments. Within 24-h of the experiment, the effluent in each collection vessel was filtered through 0.45-μm polyethersulfone filter before being transferred into combusted amber glass bottles for analysis.
We performed an additional batch experiment with isolated soil micro-aggregates to test specific hypotheses on aggregate break up. To isolate the micro-aggregates, air-dried soil samples were sieved and the fraction smaller than 250-μm and larger than 63-μm was collected. Once isolated, soil aggregates were saturated with one of the two laboratory solutions at a 1:5 aggregate to solution ratio by mass and slowly shaken for 9 min. The aggregates and solution were then gently separated by filtration using a 0.45-μm polyethersulfone filter and a low vacuum pressure.
Laboratory Analyses
To characterize the solid carbon content in SOM for sites without previous data, we analyzed soil subsets of 25 replicated samples collected from SRRW for total organic carbon content (TOC % w/w; note SSHCZO TOC data is available in Andrews et al., 2011). For this, the samples were air-dried, sieved through a 2-mm mesh, homogenized using a ball mill and analyzed using a combustion-based elemental analyzer (CE Instruments NC2500) in the Geology Stable Isotope Laboratory at the University of Vermont. Resulting percent carbon values were compared to standards (B2150 for high organic content sediment standard and B2152 for low organic content soil standard) provided by Elemental Microanalysis Limited.
We characterized aggregates from our batch experiments for changes in size, morphology and composition using a VEGA3 TESCAN Scanning Electron Microscope (SEM) and AZtec Elemental Mapping software. We mounted dried aggregates carefully with double-sided carbon tape on metal stubs and sputter-coated them with carbon before visualizing. Because backscattered electron (BSE) SEM mode captures electron density differences well, we used this mode to identify denser mineral grains vs. less dense organic material. BSE was acquired at 5-keV acceleration voltage; and energy-dispersive spectroscopy (EDS) maps were acquired for 5 min with a probe resolution of 15-mm. To compare aggregate size between samples and treatments, we took images at the same magnification (100x) and used image analysis software (ImageJ) to quantify particle size distribution reported in % covered area. This was achieved by converting 100x magnification images of aggregate clusters to binary, scaling, and using the “analyze particles” function with a minimum area set at 1,500 μm2 and excluding particles that touch the image edges.
We analyzed effluent samples from full soil core experiments for DOC using a Total Organic Carbon Analyzer (Shimadzu, Columbia, MD, USA) within 24- h after collection. To allow for assessment of total DOC release over the entire experiment, we calculated cumulative DOC release; and to allow for comparison between cores, we normalized to solution and soil amount as shown in Equation (1).
To determine significant differences in the cumulative amount of DOC released by categorical independent variables such as treatment and landscape position, Kruskal-Wallis tests were performed. For categorical variables that showed significant results as defined by an alpha threshold of 0.05, a post-hoc Dunn test was used to identify which groups differed from each other group. These statistical tests were also used to determine significant differences in aggregate sizes in the SEM images after the ImageJ particle size distribution analysis was utilized.
Results
Regional Long-Term Trend Analysis
In the Northeastern United States, we identified only nine catchments as having sufficient decadal records of DOC and instantaneous Q to complete our analyses (Table 1 and Figure 4). Of these catchments, six had records that spanned from the 1990s to late 2010s, while three had more limited records between 2003 and 2018 (Figure 5). In the time series DOCFA (i.e., residuals from the LOWESS fit of logDOC vs. logQ), we detected change points for six of the nine catchments ranging from the late 1990s and early 2000s [Biscuit Brooks (BB), McDonalds Branch (MB) and Neversink River (NR)] to very recent [2015 for Choptank River (CR), Table 1]. Existence of a change point and its position depended strongly on the length of record, and catchments with longer records exhibited more variability. We chose January 1st, 2004 as a defining date to examine before and after trends, in order to treat each of the catchments with a consistent point of reference. This date is close to the arithmetic mean (2006) of the change points detected for six catchments, and was chosen because 2004 was the first full calendar year of available data for three of the catchments.
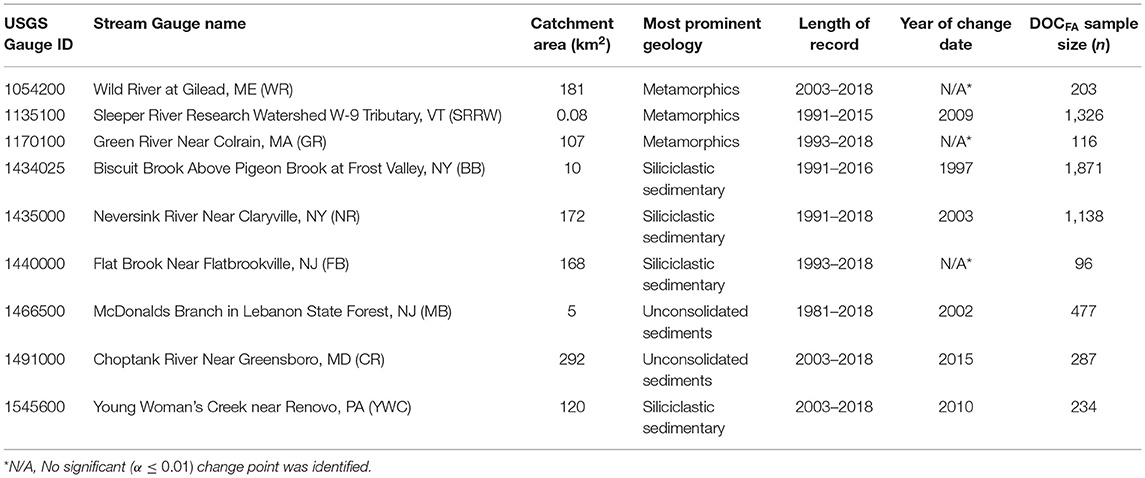
Table 1. Northeastern catchment attributes, length of DOCFA records and calculated change dates.
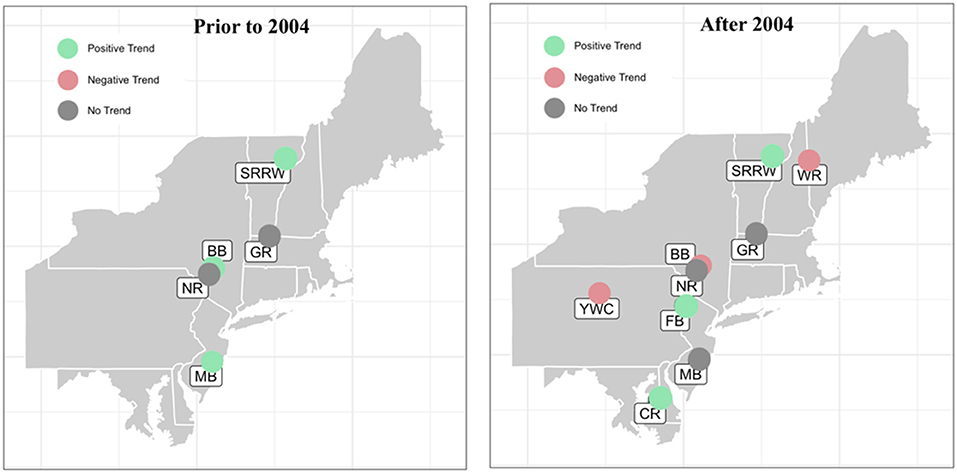
Figure 4. Directionality of catchment flow adjusted dissolved organic carbon concentration (DOCFA) trends prior to (n = 5) and after (n = 9) 2004. Statistically significant (α ≤ 0.05) positive trends are shaded in green, statistically significant negative trends are shaded in red, and no trend are shaded in gray.
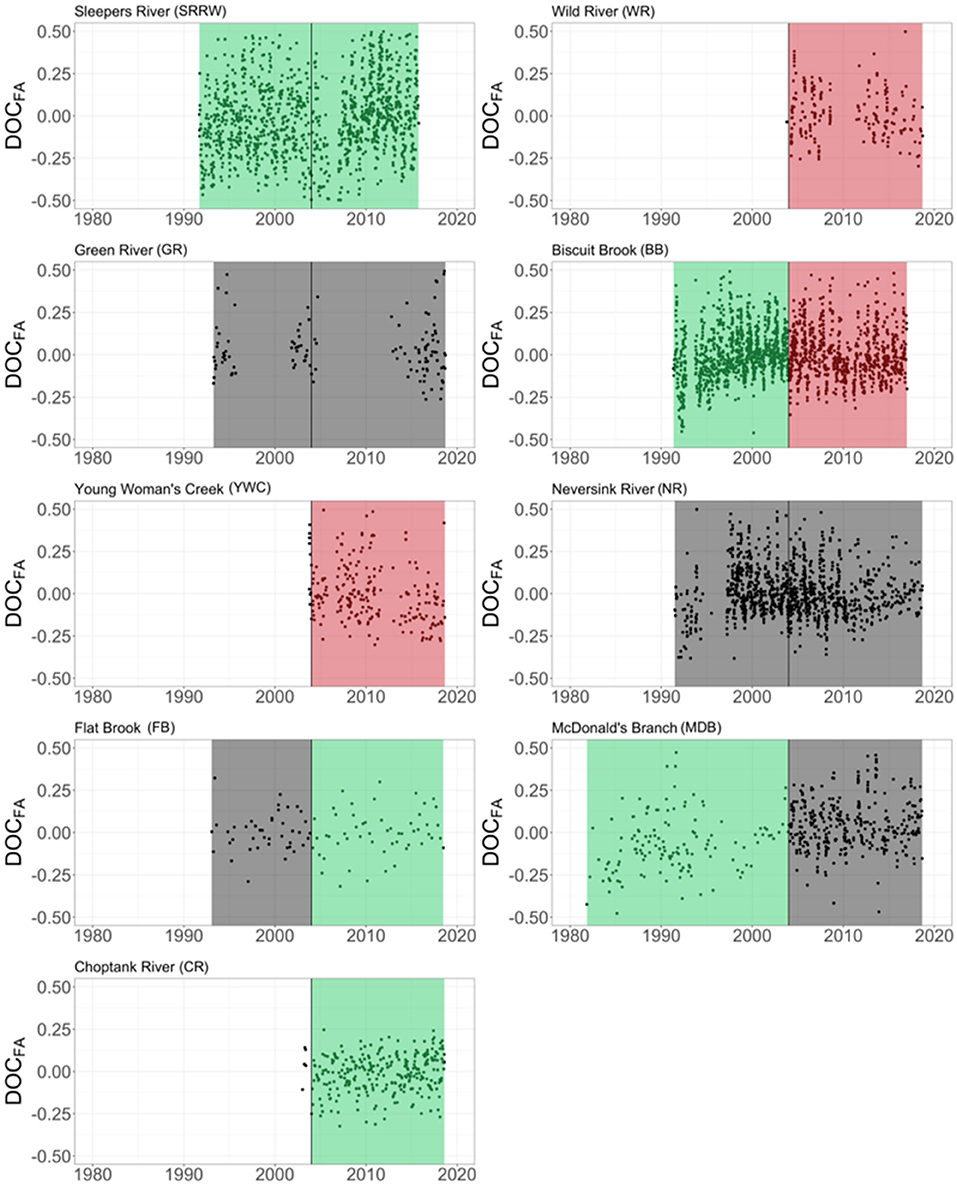
Figure 5. Long-term trends in flow-adjusted DOC concentrat ions (DOCFA). Trends are split between two periods of time: prior to 2004 and after 2004. Statistically significant (α ≤ 0.05) positive trends are shaded in green, statistically significant negative trends are shaded in red, and no trend are shaded in gray.
Of the six catchments with sufficient data prior to 2004, three exhibited increasing DOCFA trends (BB, MDB, and SRRW) while no trend could be confirmed in the other three [Flat Brook (FB), Green River (GR), and NR]. For the nine catchments with data after 2004, three exhibited increasing DOCFA trends (CR, FB, and SRRW), three exhibited no trend (MDB, NR, and GR), and the remaining three exhibited decreasing trends [BB, Wild River (WR), Young Woman's Creek (YWC)]. Spanning the reference point of 2004, the directionality in trend changed for three catchments: from positive to negative (BB); from no trend to positive (FB), and from positive to no trend (MD).
Just as with DOC, wet deposition trends were calculated separately for years prior to and after 2004. Prior to 2004, four catchments (BB, MB, NR, and SRRW) exhibited negative trends and two catchments exhibited no trend (GR and FB). Some catchments with increasing trends in DOCFA also showed decreases in wet deposition while for others a similar relationship was not apparent. For example, NR showed no DOCFA increase despite decreases in wet deposition, while GR showed increases in DOCFA without a change in wet deposition (Figure 6A). For the time after 2004, data for three additional catchments were available (YWC, CR and WR) and all exhibited negative trends (Figure 6B). Several catchments exhibited increases in DOCFA trends, including catchments experiencing different magnitudes of decrease in wet deposition (Figure 6B). To test for connections between catchment attributes and directionality of DOCFA trends, we plotted Kendall tau values after 2004 against climatic, topographic, and hydrologic attributes from the CAMELS data set (Figure 7). Catchments that have a low number of high precipitation days (i.e., events that are five times greater than the mean daily precipitation) and high % of snow cover, tended to show negative DOCFA trends (Figures 7A,B). In turn, positive DOCFA trends were associated with more days with high precipitation and lower % snow cover. Soil depth varied greatly between catchments and no direct link between DOCFA trends and soil depth was determined (Figure 7C). However, the link between mean slope and DOCFA trends was more systematic in that catchments with shallow slopes showed no or negative DOCFA trends and catchments with steep slopes showed generally decreasing DOCFA (Figure 7D). Catchments with a low number of days where Q is high (high Q frequency) generally showed positive DOCFA trends while catchments with larger high Q frequency showed negative DOCFA trends (Figure 7E).
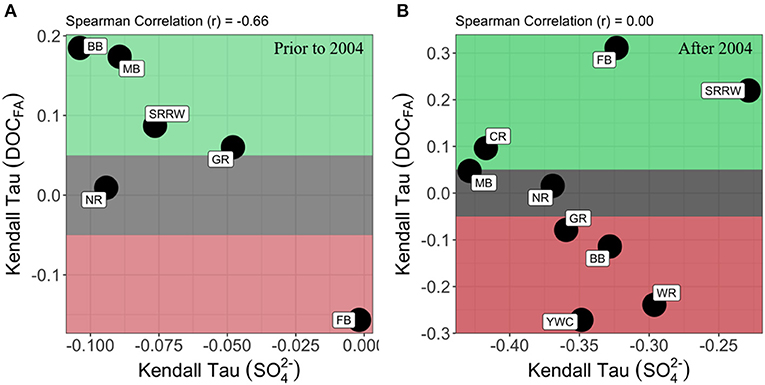
Figure 6. Relationship between trends in flow-adjusted dissolved organic carbon concentration (DOCFA) and trends in sulfate wet deposition () for Northeast U.S. forested headwater catchments: (A) prior to 2004 (n = 6) and (B) after 2004 (n = 9). Shading highlights those regions of the plot where DOCFA exhibits statistically-significant positive trends (tau > 0.05; green), negative trends (tau < −0.05; red), or no significant trend (0.05 > tau > −0.05; gray).
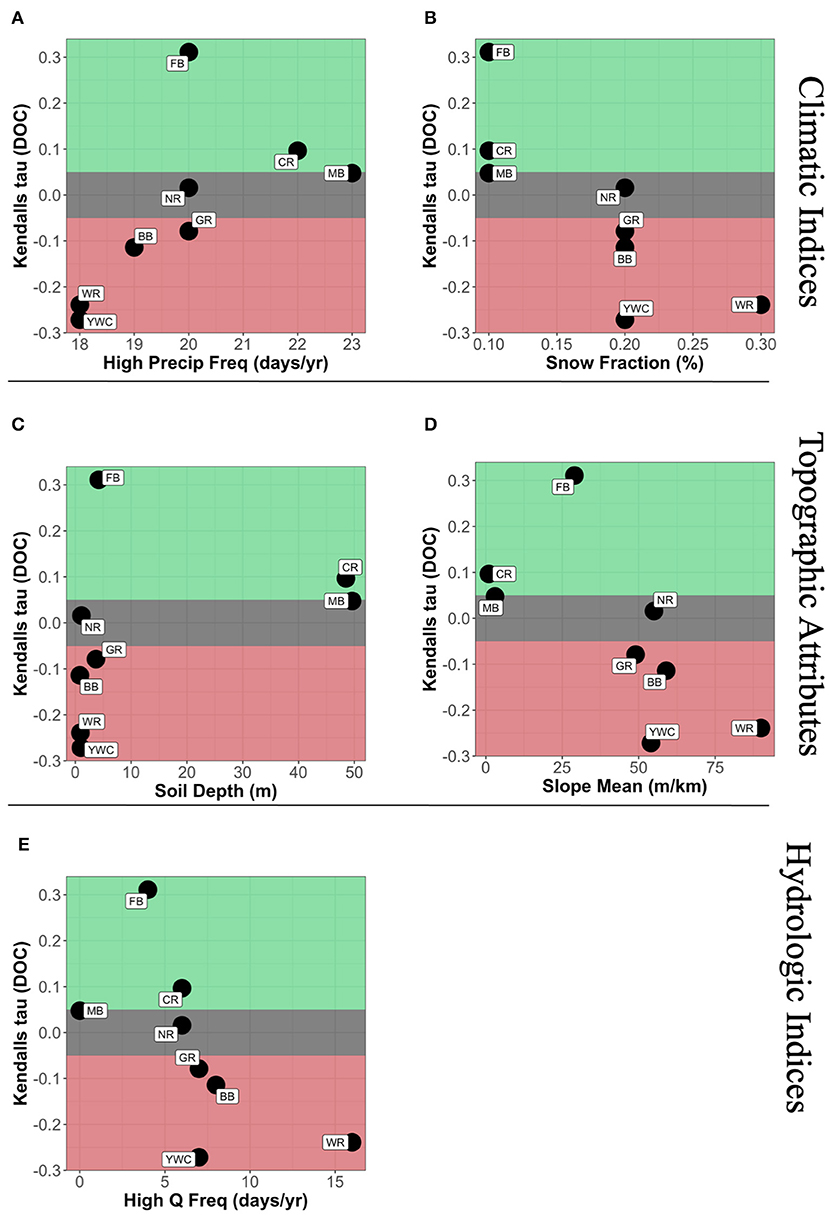
Figure 7. Relationship between trends in flow-adjusted dissolved organic carbon concentration (DOCFA) (2004–2018) and select catchment attributes grouped as climatic indices (A,B), topographic indices (C,D), and hydrologic indices (E). Shading highlights those regions of the plot where DOCFA exhibits statistically-significant positive trends (tau > 0.05; green), negative trends (tau < −0.05; red), or no significant trend (0.05 > tau > −0.05; gray).
Catchment-Scale Soil Core Experiments at SSHCZO and SRRW
Catchment-scale results of the TOC analysis indicate that carbon content in SRRW soils is variable across landscape positions (Supplementary Figure 5). In the top 10 cm of the swale, TOC was ~20% as opposed to the planar hillslope, which exhibited ~5% TOC. The DOC effluent per kg of soil released from soil cores cumulated over the four leaching events was variable across catchments, landscape positions, seasons and treatment. Spring soil cores infiltrated with the recovery-simulating solution released more DOC (14.07 ± 14.27 mg/kg) in comparison to those infiltrated with the acidification solutions (6.95 ± 7.53 mg/kg). Planar hillslopes consistently leached significantly more DOC (17.66 ± 8.57 mg/kg) than swales (4.94 ± 8.98 mg/kg, Figure 8) during this time. For the fall soils, cores that underwent the recovery treatment released more DOC (18.21 ± 15.45 mg/kg) than the acidification (14.46 ± 18.07 mg/kg) treatments and again planar hillslopes released more DOC (17.96 ± 15.10 mg/kg) than the swales (11.89 ± 14.19 mg/kg).
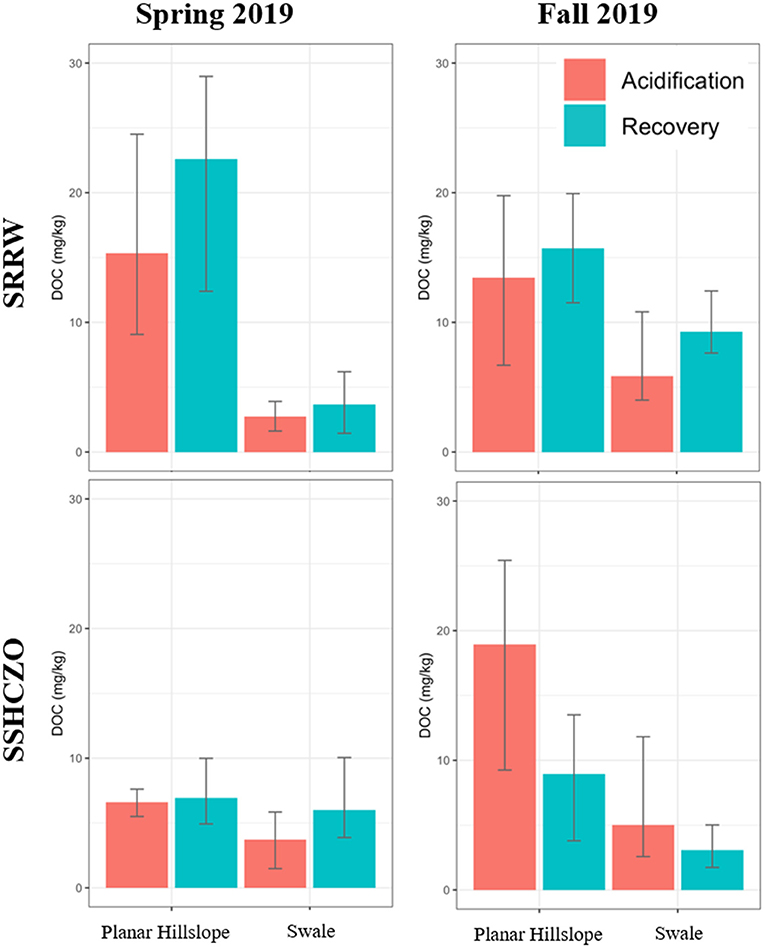
Figure 8. Cumulative DOC effluent released from soil core leaching experiments as a function of treatment, landscape position and catchment.
For SSHCZO, spring soil cores infiltrated with the recovery treatment also released more DOC (6.30 ± 2.43 mg/kg) compared to those infiltrated with the acidification solution (4.79 ± 2.15 mg/kg) and again, planar hillslopes consistently leached significantly more DOC (6.77 ± 1.84 mg/kg) compared to swales (4.95 ± 2.44 mg/kg, Figure 8). However, fall soil cores released less DOC during recovery treatment (5.04 ± 3.94 mg/kg) compared to the acidification treatment (9.65 ± 8.63 mg/kg). Consistently, planar hillslopes released more DOC (11.85 ± 7.40 mg/kg) than the swales (4.17 ± 2.72 mg/kg).
Batch Experiment on Separated Aggregates
The results of the SEM analysis showed differences in aggregate size distribution and morphology by location, landscape position and treatment. The SRRW aggregates in both landscape positions showed heterogeneous associations of larger angular fragments (likely primary minerals) and finer grained materials (Figure 9). Compared to aggregates after acidification treatment, aggregates after recovery treatment appear smaller (e.g., Figures 9B,E). Assessment of particle size distribution from image analyses confirms the qualitative assessment for both swale and hillslope locations. While some larger aggregate/particles are visible after each treatment, the bulk of swale aggregates treated with acidification solution are generally larger (maxima at around 325-μm) than those treated with recovery solution where maximum covered area is at around 175-μm (Figures 9C,F). Aggregate constituents from SSHCZO are homogeneously fine-grained and present rounded and tubular particle shapes in both landscape positions (Figure 10). Fine-grained materials (<10-μm) are visible for most samples and likely derive from surface coatings and/or disintegrating aggregates. SSHCZO aggregate morphology is similar for both landscape positions and the entire range of particle sizes is represented. Swale aggregates treated with acidification solution show a multimodal particle size distribution with maxima at 225- and 400-μm diameter. After recovery treatment, particles in smaller sizes (below 100-μm) are more abundant (Figure 10C). Hillslope particle size distribution is variable and spans the particle size range at similar coverage for both treatments (Figure 10F).
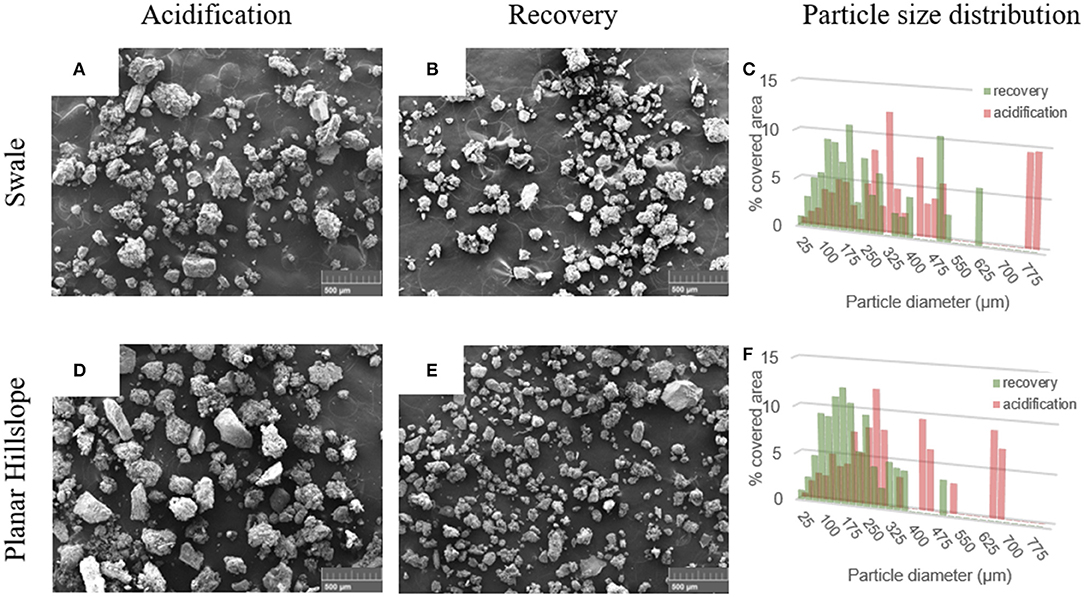
Figure 9. Secondary electron scanning electron microscopy (SE SEM) images of soil aggregates taken from a swale (A,B) and planar hillslope (D,E) in Sleepers River Research Watershed (SRRW) after treatment with laboratory acidification (A,D) and recovery (B,E) solutions. Particle size distribution from image analyses for swale (C) and planar hillslope (F) aggregates are expressed in % covered area (i.e., the area that is covered by particles that belong to a given size bin).
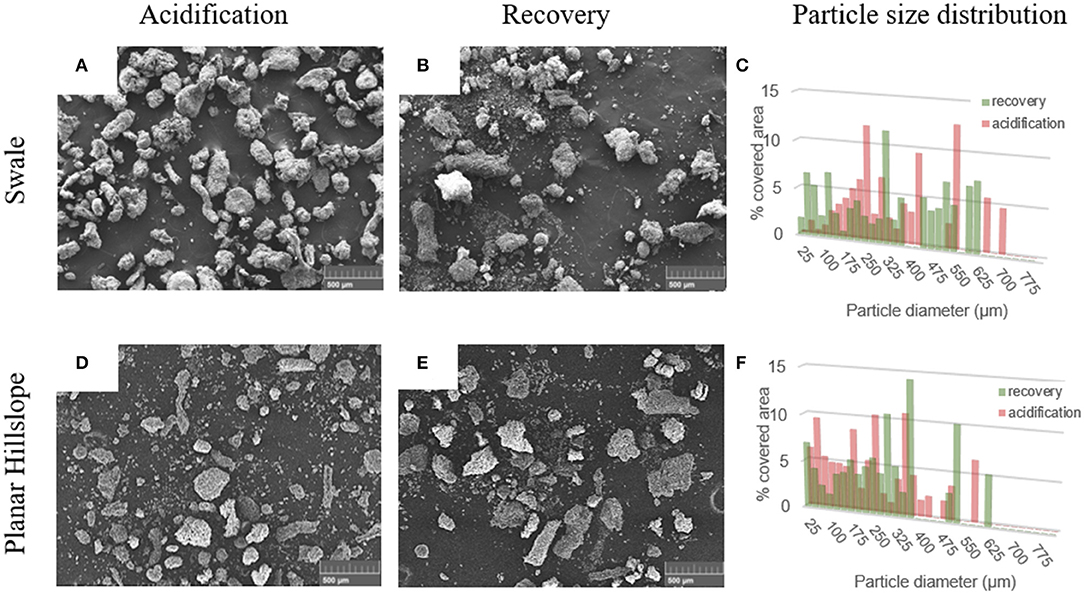
Figure 10. Secondary electron scanning electron microscopy (SE SEM) images of soil aggregates taken from a swale (A,B) and planar hillslope (D,E) in the Susquehanna Shale Hills Critical Zone Observatory (SSHCZO) after treatment with laboratory acidification (A,D) and recovery (B,E) solutions. Particle size distribution from image analyses for swale (C) and planar hillslope (F) aggregates are expressed in % covered area (i.e., the area that is covered by particles that belong to a given size bin).
Discussion
Understanding and predicting catchment responses to a regional disturbance is difficult because catchments are spatially heterogeneous systems and exhibit unique characteristics that may engender variable degrees of resistance or resilience to disturbance. This “uniqueness of place” has been acknowledged for many decades in hydrological modeling (Beven, 2000) and the conceptual and numerical integration of single site, single plot observations, stream water patterns and a larger scale driver remains a challenge (Levin, 1992; NSF, 2018). To overcome this uniqueness of place challenge, we suggest an investigative approach that does not seek direct links across scales but that instead evaluates larger-scale pattern and site-specific process in an iterative fashion, and we use reduced acid deposition as test case of regional disturbance for one such iteration. In this context, reduction in acidification in both wet and dry deposition has been hypothesized to have caused an increase in DOC concentrations from many Northern Hemisphere forested catchments (Driscoll et al., 2003; Burns et al., 2006; De Wit et al., 2007; Monteith et al., 2007; Hruška et al., 2009; Sanclements et al., 2018). However, trends in DOC partially contradict each other, which might be due to other and/or overlapping drivers, differences in record length, variable response of unique catchments and spatiotemporal variability. The overarching goal of this study was thus to investigate opportunities and challenges with the process and pattern approach using changes in acid deposition in the Northeastern U.S. as test case.
Pattern-to-Process Investigation: Exploring Catchment Attributes as Covariates in Stream DOC Response to Changes in Atmospheric Deposition
The integration of regional and catchment-scale atmospheric deposition data and catchment attributes (Addor et al., 2017), with co-located stream Q and stream chemistry time-series data provides novel opportunities to investigate catchment response to a regional driver(s). Thus, our first objective was to use our integrated dataset to explore patterns at the regional scale and investigate linkages between reduced acid deposition and stream DOC response and the potential role of catchment characteristics as covariates in that response (objective 1).
To test the connection between decreased atmospheric deposition as a potential driver for DOC stream patterns we compared the directionality of stream water DOC trends against that of deposition. The pattern prior to 2004 signals that catchments experiencing the strongest reduction in deposition also show the largest increases in DOCFA (Figure 4). However, our results also show that post 2004, the connection between decreases in deposition and increases in DOCFA is not evident for each location. For example, the four catchments that show increases in DOCFA post 2004 (SRRW, FB, CR, MB) show large variability in decadal deposition trends.
These results signal that effects of shifts in atmospheric deposition on DOC are transient or may be confounded by other deterministic trends, and trend analyses thus require explicit temporal contexts. An example are the Catskill catchments (NR and BB), where Burns et al. (2006) found a significant increase in DOC concentrations between 1991 and 2001. Our analysis confirmed this trend for DOCFA until 2004, however, thereafter these catchments exhibit no trends and negative trends (Figure 5). In addition to shifts in directionality of trends for many locations, the Pettitt change point analysis also revealed high variability in timing of the change points even for catchments in close proximity to each other. For example, the shift in DOCFA for BB occurred in 1997, whereas for NR, which drains BB and a larger area, the shift occurs in 2003. As noted in Table 1, these catchments are dramatically different in size, which may in part contribute to the temporal variability in these responses. Furthermore, all these catchments have unique characteristics that likely modulate their response to this disturbance to varying degrees.
To specifically investigate the possible connection between catchment attributes and variable DOC response we investigated the period where DOCFA trends show high inter catchment variability (2004–2018). Of all catchment attributes included in the CAMELS dataset (Addor et al., 2017), DOCFA trends show systematic variations with some topographic, climatic, and hydrologic indices. For example, catchments with positive DOCFA trends tend to be flat (i.e., average mean slope is low) while catchments with opposite DOCFA trends have opposite characteristics (Figure 7D). Catchments with the most negative Kendall tau values for DOCFA each have shallow soils; however, shallow soils also produce some of the highest DOCFA values (Figure 7C). Another finding is that catchments with positive DOCFA trends tend to have less frequent high Q days (Figure 7E) yet more frequent high precipitation days (Figure 7A). The association between increasing DOCFA trends and frequency in high precipitation events is in agreement with previous research that indicates DOC export on an annual basis is predominantly driven by large storm/snow melt events (Raymond and Saiers, 2010; Raymond et al., 2016; Wen et al., 2020).
Our flow adjustment removes the direct influence of Q on trends in DOC concentrations, thus the apparent link between DOCFA trends and frequency in high precipitation events emphasizes that precipitation drives transport of DOC to streams across catchments with very different characteristics, irrespective of which process led to DOC mobilization. Lastly, catchments that exhibit highest Q frequency also show most negative DOCFA trends (Figure 7E), which might seem counterintuitive given the fact that the majority of small headwater streams exhibit increasing DOC concentration with increasing Q due to soil flushing (Evans and Davies, 1998; Perdrial et al., 2014; Chorover et al., 2017; Moatar et al., 2017). However, because the flow-adjustment process removes the typically dominant Q control on trends, other controls such as reduced acid deposition are emphasized in the data. In this context, flashy catchments (high Q frequency) might more readily deplete carbon pools (Boyer et al., 1997) and lower water residence time, thus leading to decreased DOCFA. In contrast, catchments with less frequent high Q events might access export-controlled DOC pools, especially as the frequency of high precipitation events increased. Our data set is admittedly small, given the limited availability of sites with sufficiently long data records for DOC (Sterle et al., 2019). While our investigation begins to highlight some potential patterns, more research will be necessary to investigate the multi-variate drivers and catchment specific processes that produce such potential patterns.
Process-to-Pattern Investigation: Soil Processes During Simulated Increased and Decreased Acid Deposition Experiments
Our second objective was to investigate the effect of leaching solution composition on select soil processes, specifically aggregate destabilization, as a mechanism for DOC liberation. For this we selected two locations that are well-studied but exhibit contrasting long-term DOCFA trends: SRRW exhibits increasing DOCFA trends, while SSHCZO, a well-studied catchment in close proximity to YWC, shows decreasing DOCFA trends.
In our simulated soil core flushing experiments on top horizons (O-A), soils from SRRW released more DOC than those from SSHCZO for most locations and seasons (Figure 8). These results are in agreement with the higher soil TOC content in SRRW soils (Andrews et al., 2011) and fit the long-term and continued increase in stream DOC over time (Figures 4, 5). Furthermore, SRRW soils show consistently higher DOC releases into recovery solutions, which is again in agreement with the positive DOCFA trend and makes an important connection to reduced acid deposition. The significantly (up to 50%) smaller aggregates after recovery treatment vs. acidification treatment (Figure 9) further corroborate these findings and validate the hypothesized role of aggregates in DOC mobilization during reduced acid deposition in this case. Indeed, previous research on SRRW soils has emphasized DOC release due to the breakup of soil aggregates in lower charge density solutions typical for reduced acid deposition (Cincotta et al., 2019). In previous work the authors note that especially the presence of Ca in SRRW soils might aid aggregation through cation bridging, a process that can be reversed when dilute solutions interact with these aggregates (Armfield et al., 2019; Cincotta et al., 2019).
In contrast, for SSHCZO soil cores, solution chemistry had little or the opposite effect on DOC release (Figure 8), indicating that recovery conditions did not promote DOC mobilization from these soils. Our SEM analyses furthermore indicated little reduction in aggregate size irrespective of the treatment, indicating generally higher aggregate stability (Figure 10). Constituents in SSHCZO aggregates are homogeneously fine-grained, which might promote stability through cohesion. The abundant clay mineral content [45%, mostly illite with small amounts of chlorite, vermiculite, and kaolinite (Macdonald et al., 2010)] promotes aggregation (Six et al., 2002) and aids sorption of organic compounds (Kahle et al., 2003). This high carbon stabilization potential might, however, be counteracted through the high water holding capacity that produces favorable condition for microbial processing, leading to overall lower TOC content (Andrews et al., 2011).
For both SRRW and SSHCZO, DOC release varied by landscape position and seasons, irrespective of treatment, and emphasizes the typical spatiotemporal variability in the catchment. For example, planar hillslopes might act as export control points where labile material accumulates until they are hydrologically connected and episodically flushed (Andrews et al., 2011). Our experiments simulate such flushing or export events and mobilize most DOC from planar hillslopes in most cases (Figure 8), despite the fact that TOC content is higher in swales (Andrews et al., 2011). In contrast, swales might represent permanent and/or activated control points where biogeochemical activity is high (but potentially variable) and connectivity to the stream is sustained. Despite ample DOC production, such conditions also lead to losses via microbial processing and/or flushing, thus preventing accumulation (Bernhardt et al., 2017). As a result, cores from swale locations generally release less DOC (Figure 8).
The temporal variability of DOC supply due to seasonal shifts in carbon accumulation, processing and transport is superimposed on the spatial control. For example, both catchments experience spring snowmelt, which flushes soils from otherwise unconnected catchment locations (Boyer et al., 1997) and could lead to a temporal depletion of labile carbon. This effect is visible for SSHCZO, however, the fact that spring SRRW soils release some of the highest amounts of DOC is somewhat counterintuitive: SRRW accumulates a significant snowpack and has a high potential for hydrologic flushing of even distal catchment locations (Shanley et al., 2004; Sebestyen et al., 2008; Armfield et al., 2019). However, it is possible that snowmelt flushing was not extensive enough to deplete stores or that enough time had passed to allow for the replenishing of stocks. For SSHCZO in contrast, we observed the highest DOC release for fall soils, which could be due to the recent addition of leaf litter. Even though leaf litter accumulates readily in swales, these locations again also lose carbon readily (Wen et al., 2020) and the high DOC release from planar hillslopes in fall might therefore again reflect the complex balance between accumulation vs. removal in a catchment setting.
Opportunities and Limitations for the Process and Pattern Investigative Approach
Our experiments emphasize the complexity of catchment specific processes that vary across time (e.g., seasonal dynamics), space (e.g., spatial heterogeneity), or both (e.g., temporal variations in spatial catchment connectivity). Indeed, the differences in DOC release for the SRRW vs. SSHCZO experiments agree with the trend directionality from our regional pattern analyses: tested SRRW soils responded strongly to solutions simulating decreased acid deposition by releasing more DOC and, at a larger scale, SRRW is one of the catchments that shows significant increases in DOCFA. For SSHCZO and the larger trend at YWC, the opposite is the case. In this specific case, observations are consistent across scales, which differs from a similarly designed study on DOC release where lab experiments, field observations and historical data analyses yielded conflicting results (Preston et al., 2011). However, given the inherent complexity of catchment processes, it is unlikely that one experimentally investigated process (in our case aggregate destabilization) explains the variation in long-term trends for catchments in general. To the contrary, this process might be relevant only for catchments of specific combination of biogeophysical and hydrometeorological attributes and results from this work thus provides suggestions for the next iteration of pattern analyses.
For example, wetlands have been reported to play a significant role in DOC dynamics by impacting both water and carbon storage and thus the relative importance (and synchronization) of biogeochemical vs. hydrological processes (Eimers et al., 2008b; Bernhardt et al., 2017; Duan et al., 2017; Kang et al., 2018; Casson et al., 2019). However, while the CAMELS-Chem data set includes soil characteristics that often correlate with wetland cover (e.g., soil conductivity, water fraction, and organic fraction), wetland coverage is not included (Addor et al., 2017) but is a likely driver for our observed differences between sites. Indeed, at the SRRW sites, riparian areas act at least seasonally as wetlands, while at SSHCZO, swale locations are better drained (Andrews et al., 2011; Shanley et al., 2015). Therefore, this work offers opportunities for hypothesis generation and further process investigations for catchments with contrasting long-term patterns.
Integrated datasets, such as the CAMELS-Chem dataset used in this study, are fundamental to this type of research, and continued and concerted efforts to generate and compile these types of data in readily-accessible formats will help address current limitations for cross-scale investigations. For example, only ~7% of CAMELS catchments had DOC records sufficiently long and consistent enough to perform robust long-term trend analyses, with only ~2% located in the Northeastern US. The CAMELS data set includes a wide variety of catchment attributes; however, it is likely that important attributes are not captured. These spatial and temporal gaps currently limit statistical power and the development of a larger consensus on processes, suggesting a need for more long-term monitoring and data fusion/integration efforts as illustrated here. Overall, consistent, extensive, and multiple-perspective monitoring systems are urgently needed to record long-term alteration of water quantity and quality response to climate change and human perturbation efforts (Lovett et al., 2007; Magner and Brooks, 2008; Li et al., 2021; Zhi et al., 2021). In the meantime, we believe that such integrated datasets, novel data science tools, and process investigations will allow the catchment science community to make progress addressing the problem of scale.
Data Availability Statement
The datasets presented in this study can be found in online repositories. The names of the repository/repositories and accession number(s) can be found at: the dataset [CAMELS-Chem] for this study will be made available in Sterle et al. (2019) upon publication. The stream water dataset analyzed for DOC trends at SRRW can be found at: doi: 10.5066/P9380HQG and doi: 10.5066/P929KMVK.
Author Contributions
TA was responsible for sample collection, preparation, analyses, and production of both figures and tables. JP aided in interpretation, authorship, field work, lab work, lab training, and allowed lab use. KU, DR, AH, AL, and LL provided essential expertise to the interpretation of the results. GS compiled and collected data used in analyses. LS, CB, and HW aided in field work, laboratory work, and critical analyses. NP contributed through interpretations, authorship, and lab training. All authors contributed to the article and approved the submitted version.
Funding
This work was supported by the National Science Foundation under Grant Nos. NSF-EAR 1724171, 1724440, and 2012123. DR and JP were partially supported by NSF under Vermont EPSCoR Grant Nos. EPS-1101317 and NSF OIA 1556770.
Disclaimer
Any opinions, findings, and conclusions or recommendations expressed in this material are those of the authors and do not necessarily reflect the views of the National Science Foundation or Vermont EPSCoR.
Conflict of Interest
The authors declare that the research was conducted in the absence of any commercial or financial relationships that could be construed as a potential conflict of interest.
Acknowledgments
The authors thank James Shanley for assistance with sampling, analyses, and interpretation of results. We thank Sarah Powers, Jody Smith, and Gabriela Mora-Klepeis for assistance and technical support in the labs at the University of Vermont and Middlebury College. USGS participation was supported by the Land Change Science Program. Any use of trade, firm, or product names is for descriptive purposes only and does not imply endorsement by the US Government.
Supplementary Material
The Supplementary Material for this article can be found online at: https://www.frontiersin.org/articles/10.3389/frwa.2021.578608/full#supplementary-material
References
Abatzoglou, J. T., and Williams, A. P. (2016). Impact of anthropogenic climate change on wildfire across western US forests. Proc. Natl. Acad. Sci. U.S.A. 113, 11770–11775. doi: 10.1073/pnas.1607171113
Abbott, B. W., Bishop, K., Zarnetske, J. P., Minaudo, C., Chapin, F. S., Krause, S., et al. (2019). Human domination of the global water cycle absent from depictions and perceptions. Nat. Geosci.12, 533–540. doi: 10.1038/s41561-019-0374-y
Addor, N., Newman, A. J., Mizukami, N., and Clark, M. P. (2017). The CAMELS data set: catchment attributes and meteorology for large-sample studies. Hydrol. Earth Syst. Sci. 21, 5293–5313. doi: 10.5194/hess-21-5293-2017
Andrews, D. M., Lin, H., Zhu, Q., Jin, L., and Brantley, S. L. (2011). Hot spots and hot moments of dissolved organic carbon export and soil organic carbon storage in the shale hills catchment. Vadose Zone J. 10, 943–954. doi: 10.2136/vzj2010.0149
Armfield, J. R., Perdrial, J. N., Gagnon, A., Ehrenkranz, J., Perdrial, N., Cincotta, M., et al. (2019). Does stream water composition at sleepers river in vermont reflect dynamic changes in soils during recovery from acidification? Front. Earth Sci. 6:246. doi: 10.3389/feart.2018.00246
Arnone, J. A., Jasoni, R. L., Lucchesi, A. J., Larsen, J. D., Leger, E. A., Sherry, R. A., et al. (2011). A climatically extreme year has large impacts on C4 species in tallgrass prairie ecosystems but only minor effects on species richness and other plant functional groups. J. Ecol 99, 678–688. doi: 10.1111/j.1365-2745.2011.01813.x
Bao, C., Li, L., Shi, Y., and Duffy, C. (2017). Understanding watershed hydrogeochemistry: 1. Development of RT-Flux-PIHM. Water Resour. Res. 53, 2328–2345. doi: 10.1002/2016WR018934
Bekele, A., and Mcfarland, A. (2004). Regression-based flow adjustment procedures for trend analysis of water quality data. Trans. ASAE 47, 1093–1104. doi: 10.13031/2013.16582
Bernhardt, E. S., Blaszczak, J. R., Ficken, C. D., Fork, M. L., Kaiser, K. E., and Seybold, E. C. (2017). Control points in ecosystems: moving beyond the hot spot hot moment concept. Ecosystems 20, 665–682. doi: 10.1007/s10021-016-0103-y
Beven, K. J. (2000). Uniqueness of place and process representations in hydrological modelling. Hydrol. Earth Syst. Sci. Discussions 4, 203–213. doi: 10.5194/hess-4-203-2000
Boyer, E. W., Hornberger, G. M., Bencala, K. E., and Mcknight, D. (1996). Overview of a simple model describing variation of dissolved organic carbon in an upland catchment. Ecol. Model. 86, 183–188. doi: 10.1016/0304-3800(95)00049-6
Boyer, E. W., Hornberger, G. M., Bencala, K. E., and Mcknight, D. M. (1997). Response characteristics of DOC flushing in an alpine catchment. Hydrol. Processes 11, 1635–1647. doi: 10.1002/(SICI)1099-1085(19971015)11:12<1635::AID-HYP494>3.0.CO;2-H
Burns, D. A., Mchale, M. R., Driscoll, C. T., and Roy, K. M. (2006). Response of surface water chemistry to reduced levels of acid precipitation: comparison of trends in two regions of New York, USA. Hydrol. Processes Int. J. 20, 1611–1627. doi: 10.1002/hyp.5961
Busuioc, A., and Storch, H. V. (1996). Changes in the winter precipitation in Romania and its relation to the large-scale circulation. Tellus A 48, 538–552. doi: 10.1034/j.1600-0870.1996.t01-3-00004.x
Campbell, J. L., Rustad, L. E., Boyer, E. W., Christopher, S. F., Driscoll, C. T., Fernandez, I. J., et al. (2009). Consequences of climate change for biogeochemical cycling in forests of northeastern North America. Can. J. Forest Res. 39, 264–284. doi: 10.1139/X08-104
Casson, N. J., Eimers, M. C., Watmough, S. A., and Richardson, M. C. (2019). The role of wetland coverage within the near-stream zone in predicting of seasonal stream export chemistry from forested headwater catchments. Hydrol. Processes 33, 1465–1475. doi: 10.1002/hyp.13413
Chorover, J., Derry, L. A., and Mcdowell, W. H. (2017). Concentration-discharge relations in the critical zone: implications for resolving critical zone structure, function, and evolution. Water Resources Res. 53, 8654–8659. doi: 10.1002/2017WR021111
Cincotta, M. M., Perdrial, J. N., Shavitz, A., Libenson, A., Landsman-Gerjoi, M., Perdrial, N., et al. (2019). Soil aggregates as a source of dissolved organic carbon to streams: an experimental study on the effect of solution chemistry on water extractable carbon. Front. Environ. Sci. 7:172. doi: 10.3389/fenvs.2019.00172
Clark, J. M., Bottrell, S. H., Evans, C. D., Monteith, D. T., Bartlett, R., Rose, R., et al. (2010). The importance of the relationship between scale and process in understanding long-term DOC dynamics. Sci. Total Environ. 408, 2768–2775. doi: 10.1016/j.scitotenv.2010.02.046
De Wit, H. A., Mulder, J., Hindar, A., and Hole, L. (2007). Long-term increase in dissolved organic carbon in streamwaters in norway is response to reduced acid deposition. Environ. Sci. Technol. 41, 7706–7713. doi: 10.1021/es070557f
Driscoll, C. T., Driscoll, K. M., Roy, K. M., and Mitchell, M. J. (2003). Chemical response of lakes in the adirondack region of New York to declines in acidic deposition. Environ. Sci. Technol. 37, 2036–2042. doi: 10.1021/es020924h
Duan, S., He, Y., Kaushal, S. S., Bianchi, T. S., Ward, N. D., and Guo, L. (2017). Impact of wetland decline on decreasing dissolved organic carbon concentrations along the mississippi river continuum. Front. Marine Sci. 3:280. doi: 10.3389/fmars.2016.00280
Dupas, R., Minaudo, C., and Abbott, B. W. (2019). Stability of spatial patterns in water chemistry across temperate ecoregions. Environ. Res. Lett. 14:074015. doi: 10.1088/1748-9326/ab24f4
Eimers, M. C., Watmough, S. A., and Buttle, J. M. (2008a). Long-term trends in dissolved organic carbon concentration: a cautionary note. Biogeochemistry 87, 71–81. doi: 10.1007/s10533-007-9168-1
Eimers, M. C., Watmough, S. A., Buttle, J. M., and Dillon, P. J. (2008b). Examination of the potential relationship between droughts, sulphate and dissolved organic carbon at a wetland-draining stream. Global Change Biol. 14, 938–948. doi: 10.1111/j.1365-2486.2007.01530.x
Evans, C., and Davies, T. D. (1998). Causes of concentration/discharge hysteresis and its potential as a tool for analysis of episode hydrochemistry. Water Resources Res. 34, 129–137. doi: 10.1029/97WR01881
Giardino, J. R., and Houser, C. (2015). Principles and Dynamics of the Critical Zone. Amsterdam: Elsevier Science.
Helsel, D. R., and Hirsch, R. M. (2002). Statistical Methods in Water Resources. Reston, VA: US Geological Survey.
Helsel, D. R., Hirsch, R. M., Ryberg, K. R., Archfield, S. A., and Gilroy, E. J. (2020). “Statistical methods in water resources,” in U.S. Geological Survey Techniques and Methods (Reston, VA). Retrieved from: http://pubs.er.usgs.gov/publication/tm4A3
Hirsch, R. M., and Slack, J. R. (1984). A nonparametric trend test for seasonal data with serial dependence. Water Resources Res. 20, 727–732. doi: 10.1029/WR020i006p00727
Hornbeck, J. W., Bailey, S. W., Buso, D. C., and Shanley, J. B. (1997). Streamwater chemistry and nutrient budgets for forested watersheds in New England: variability and management implications. Forest Ecol. Manage. 93, 73–89. doi: 10.1016/S0378-1127(96)03937-0
Hruška, J., Krám, P., Mcdowell, W. H., and Oulehle, F. (2009). Increased dissolved organic carbon (DOC) in central european streams is driven by reductions in ionic strength rather than climate change or decreasing acidity. Environ. Sci. Technol. 43, 4320–4326. doi: 10.1021/es803645w
Huang, W., and Hall, S. J. (2017). Optimized high-throughput methods for quantifying iron biogeochemical dynamics in soil. Geoderma 306, 67–72. doi: 10.1016/j.geoderma.2017.07.013
Jentsch, A., Kreyling, J., and Beierkuhnlein, C. (2007). A new generation of climate-change experiments: events, not trends. Front. Ecol. Environ. 5, 365–374. doi: 10.1890/1540-9295(2007)5[365:ANGOCE]2.0.CO;2
Kahle, M., Kleber, M., and Jahn, R. (2003). Retention of dissolved organic matter by illitic soils and clay fractions: influence of mineral phase properties. J. Plant Nutr. Soil Sci. 166, 737–741. doi: 10.1002/jpln.200321125
Kang, H., Kwon, M. J., Kim, S., Lee, S., Jones, T. G., Johncock, A. C., et al. (2018). Biologically driven DOC release from peatlands during recovery from acidification. Nat. Commun. 9:3807. doi: 10.1038/s41467-018-06259-1
Kendall, K. A., Shanley, J., and Mcdonnell, J. (1999). A hydrometric and geochemical approach to test the transmissivity feedback hypothesis during snowmelt. J. Hydrol. 219, 188–205. doi: 10.1016/S0022-1694(99)00059-1
Kleber, M., and Johnson, M. G. (2010). “Chapter 3 - advances in understanding the molecular structure of soil organic matter: implications for interactions in the environment,” in Advances in Agronomy, ed L. S. Donald (Amsterdam: Academic Press), 77–142.
Levin, S. A. (1992). The problem of pattern and scale in ecology: the Robert H. MacArthur award lecture. Ecology 73, 1943–1967. doi: 10.2307/1941447
Li, L., Maher, K., Navarre-Sitchler, A., Druhan, J., Meile, C., Lawrence, C., et al. (2017). Expanding the role of reactive transport models in critical zone processes. Earth Sci. Rev. 165, 280–301. doi: 10.1016/j.earscirev.2016.09.001
Li, L., Sullivan, P. L., Benettin, P., Cirpka, O. A., Bishop, K., Brantley, S. L., et al. (2021). Toward catchment hydro-biogeochemical theories. WIREs Water 8:e1495. doi: 10.1002/wat2.1495
Lin, H. S., Kogelmann, W., Walker, C., and Bruns, M. A. (2006). Soil moisture patterns in a forested catchment: a hydropedological perspective. Geoderma 131, 345–368. doi: 10.1016/j.geoderma.2005.03.013
Liu, L., Xu, Z.-X., and Huang, J.-X. (2012). Spatio-temporal variation and abrupt changes for major climate variables in the Taihu Basin, China. Stochastic Environ. Res. Risk Assessment 26, 777–791. doi: 10.1007/s00477-011-0547-8
Löfgren, S., and Zetterberg, T. J. S. O. T. T. E. (2011). Decreased DOC concentrations in soil water in forested areas in southern Sweden during 1987–2008. Sci. Total Environ. 409, 1916–1926. doi: 10.1016/j.scitotenv.2011.02.017
Lovett, G. M., Burns, D. A., Driscoll, C. T., Jenkins, J. C., Mitchell, M. J., Rustad, L., et al. (2007). Who needs environmental monitoring? Front. Ecol. Environ. 5, 253–260. doi: 10.1890/1540-9295(2007)5[253:WNEM]2.0.CO;2
Macdonald, S., April, R., and Keller, D. (2010). “Clay mineral weathering in shales and soils in the critical zone,” in Geochimica et Cosmochimica Acta: Pergamon (Kidlington: Elsevier Science Ltd.), A652.
Magner, J. A., and Brooks, K. N. (2008). Integrating sentinel watershed-systems into the monitoring and assessment of Minnesota's (USA) waters quality. Environ. Monit. Assess 138, 149–158. doi: 10.1007/s10661-007-9752-9
Meals, D., Spooner, J., Dressing, S., and Harcum, J. (2011). Statistical Analysis for Monotonic Trends, Tech Notes 6, November 2011. Developed for US Environmental Protection Agency by Tetra Tech, Inc. Fairfax, VA.
Mikutta, R., Kleber, M., Torn, M. S., and Jahn, R. (2006). Stabilization of soil organic matter: association with minerals or chemical recalcitrance? Biogeochemistry 77, 25–56. doi: 10.1007/s10533-005-0712-6
Moatar, F., Abbott, B. W., Minaudo, C., Curie, F., and Pinay, G. (2017). Elemental properties, hydrology, and biology interact to shape concentration-discharge curves for carbon, nutrients, sediment, and major ions. Water Resources Res. 53, 1270–1287. doi: 10.1002/2016WR019635
Monteith, D. T., Stoddard, J. L., Evans, C. D., De Wit, H. A., Forsius, M., Høgåsen, T., et al. (2007). Dissolved organic carbon trends resulting from changes in atmospheric deposition chemistry. Nature 450, 537–540. doi: 10.1038/nature06316
Moyano, F. E., Manzoni, S., and Chenu, C. (2013). Responses of soil heterotrophic respiration to moisture availability: an exploration of processes and models. Soil Biol. Biochem. 59, 72–85. doi: 10.1016/j.soilbio.2013.01.002
NADP Program Office (2021). National Atmospheric Deposition Program (NRSP-3). Madison, WI: NADP Program Office, Wisconsin State Laboratory of Hygiene.
NSF (2018). Bridging the Atom-to-Global Scale Gap. Available online at: https://nsf2026imgallery.skild.com/entries/bridging-the-atom-to-global-scale-gap
Oni, S. K., Futter, M. N., Bishop, K., Kohler, S. J., Ottosson-Lofvenius, M., and Laudon, H. (2013). Long-term patterns in dissolved organic carbon, major elements and trace metals in boreal headwater catchments: trends, mechanisms and heterogeneity. Biogeosciences 10, 2315–2330. doi: 10.5194/bg-10-2315-2013
Perdrial, J., Brooks, P. D., Swetnam, T., Lohse, K. A., Rasmussen, C., Litvak, M., et al. (2018). A net ecosystem carbon budget for snow dominated forested headwater catchments: linking water and carbon fluxes to critical zone carbon storage. Biogeochemistry 138, 225–243. doi: 10.1007/s10533-018-0440-3
Perdrial, J. N., Mcintosh, J., Harpold, A., Brooks, P. D., Zapata-Rios, X., Ray, J., et al. (2014). Stream water carbon controls in seasonally snow-covered mountain catchments: impact of inter-annual variability of water fluxes, catchment aspect and seasonal processes. Biogeochemistry 118, 273–290. doi: 10.1007/s10533-013-9929-y
Perdrial, N., Perdrial, J. N., Delphin, J.-E., Elsass, F., and Liewig, N. (2010). Temporal and spatial monitoring of mobile nanoparticles in a vineyard soil: evidence of nanoaggregate formation. Euro. J. Soil Sci. 61, 456–468. doi: 10.1111/j.1365-2389.2010.01263.x
Pettitt, A. (1979). A non-parametric approach to the change-point problem. J. R. Stat. Soc. Ser. C 28, 126–135. doi: 10.2307/2346729
Preston, M., Eimers, C., and Watmough, S. (2011). Effect of moisture and temperature variation on DOC release from a peatland: conflicting results from laboratory, field and historical data analysis. Sci. Total Environ. 409, 1235–1242. doi: 10.1016/j.scitotenv.2010.12.027
Raymond, P. A., and Saiers, J. E. (2010). Event controlled DOC export from forested watersheds. Biogeochemistry 100, 197–209. doi: 10.1007/s10533-010-9416-7
Raymond, P. A., Saiers, J. E., and Sobczak, W. V. (2016). Hydrological and biogeochemical controls on watershed dissolved organic matter transport: pulse-shunt concept. Ecology 97, 5–16. doi: 10.1890/14-1684.1
Sanclements, M. D., Fernandez, I. J., Lee, R. H., Roberti, J. A., Adams, M. B., Rue, G. A., et al. (2018). Long-term experimental acidification drives watershed scale shift in dissolved organic matter composition and flux. Environ. Sci. Technol. 52, 2649–2657. doi: 10.1021/acs.est.7b04499
Schmidt, M. W., Torn, M. S., Abiven, S., Dittmar, T., Guggenberger, G., Janssens, I. A., et al. (2011). Persistence of soil organic matter as an ecosystem property. Nature 478, 49–56. doi: 10.1038/nature10386
Sebestyen, S. D., Boyer, E. W., Shanley, J. B., Kendall, C., Doctor, D. H., Aiken, G. R., et al. (2008). Sources, transformations, and hydrological processes that control stream nitrate and dissolved organic matter concentrations during snowmelt in an upland forest. Water Resour. Res. 44:W12410. doi: 10.1029/2008WR006983
Seneviratne, S. I., Nicholls, N., Easterling, D., Goodess, C. M., Kanae, S., Kossin, J., et al. (2012). “Changes in climate extremes and their impacts on the natural physical environment,” in Managing the Risks of Extreme Events and Disasters to Advance Climate Change Adaptation, eds C. B. Field, V. Barros, T. F. Stocker, D. Qin, D. J. Dokken, K. L. Ebi, M. D. Mastrandrea, K. J. Mach, G.-K. Plattner, S. K. Allen, M. Tignor, and P. M. Midgley (Cambridge: Cambridge University Press).
Shanley, J. B., Krám, P., Hruška, J., and Bullen, T. D. (2004). “A biogeochemical comparison of two well-buffered catchments with contrasting histories of acid deposition,” in Biogeochemical Investigations of Terrestrial, Freshwater, and Wetland Ecosystems across the Globe, eds R. K. Wieder, M. Novák, and M. A. Vile (Dordrecht: Springer), 325–342. doi: 10.1007/978-94-007-0952-2_23
Shanley, J. B., Sebestyen, S. D., Mcdonnell, J. J., Mcglynn, B. L., and Dunne, T. (2015). Water's way at sleepers river watershed – revisiting flow generation in a post-glacial landscape, Vermont USA. Hydrol. Processes 29, 3447–3459. doi: 10.1002/hyp.10377
Sivapalan, M. (2005). “Pattern, process and function: elements of a unified theory of hydrology at the catchment scale,” in Encyclopedia of Hydrological Sciences, eds M. G. Anderson and J. J. McDonnell. doi: 10.1002/0470848944.hsa012
Six, J., Conant, R. T., Paul, E. A., and Paustian, K. (2002). Stabilization mechanisms of soil organic matter: implications for C-saturation of soils. Plant Soil 241, 155–176. doi: 10.1023/A:1016125726789
Steffen, W., Rockström, J., Richardson, K., Lenton, T. M., Folke, C., Liverman, D., et al. (2018). Trajectories of the earth system in the anthropocene. Proc. Natl. Acad. Sci. U.S.A. 115, 8252–8259. doi: 10.1073/pnas.1810141115
Sterle, G., Harpold, A., Perdrial, J. N., Li, L., Wen, H., Adler, T., et al. (2019). “CAMELS-CHEM: Developing a hydrochemistry dataset for large sample cross-catchment analyses,” in Poster presented at: Gordon Research Conference, Catchment Science: Interactions of Hydrology, Biology, and Geochemistry, Transcending the Uniqueness of Place in the Age of Big Data (Andover, NH: Proctor Academy).
Van Loon, A. F., Gleeson, T., Clark, J., Van Dijk, A. I. J. M., Stahl, K., Hannaford, J., et al. (2016). Drought in the anthropocene. Nat. Geosci. 9, 89–91. doi: 10.1038/ngeo2646
Wen, H., Perdrial, J., Abbott, B. W., Bernal, S., Dupas, R., Godsey, S. E., et al. (2020). Temperature controls production but hydrology regulates export of dissolved organic carbon at the catchment scale. Hydrol. Earth Syst. Sci. 24, 945–966. doi: 10.5194/hess-24-945-2020
Wijngaard, J., Klein Tank, A., and Können, G. (2003). Homogeneity of 20th century European daily temperature and precipitation series. Int. J. Climatol. J. R. Meteorol. Soc. 23, 679–692. doi: 10.1002/joc.906
Wilson, H. F., Saiers, J. E., Raymond, P. A., and Sobczak, W. V. (2013). Hydrologic drivers and seasonality of dissolved organic carbon concentration, nitrogen content, bioavailability, and export in a forested New England stream. Ecosystems 16, 604–616. doi: 10.1007/s10021-013-9635-6
Zarnetske, J. P., Bouda, M., Abbott, B. W., Saiers, J., and Raymond, P. A. (2018). Generality of hydrologic transport limitation of watershed organic carbon flux across ecoregions of the United States. Geophys. Res. Lett. 45, 702–711. doi: 10.1029/2018GL080005
Zhi, W., Feng, D., Tsai, W. P., Sterle, G., Harpold, A., Shen, C., et al. (2021). From hydrometeorology to river water quality: can a deep learning model predict dissolved oxygen at the continental scale? Environ. Sci. Technol. 55, 2357–2368. doi: 10.1021/acs.est.0c06783
Zhi, W., Li, L., Dong, W., Brown, W., Kaye, J., Steefel, C., et al. (2019). Distinct source water chemistry shapes contrasting concentration-discharge patterns. Water Resources Res 55, 4233–4251. doi: 10.1029/2018WR024257
Keywords: spatial and temporal scales, soil aggregates, acid rain, process and pattern, long-term trends, dissolved organic carbon
Citation: Adler T, Underwood KL, Rizzo DM, Harpold A, Sterle G, Li L, Wen H, Stinson L, Bristol C, Stewart B, Lini A, Perdrial N and Perdrial JN (2021) Drivers of Dissolved Organic Carbon Mobilization From Forested Headwater Catchments: A Multi Scaled Approach. Front. Water 3:578608. doi: 10.3389/frwa.2021.578608
Received: 30 June 2020; Accepted: 31 May 2021;
Published: 06 July 2021.
Edited by:
Carl I. Steefel, Lawrence Berkeley National Laboratory, United StatesReviewed by:
Catherine Eimers, Trent University, CanadaDipankar Dwivedi, Lawrence Berkeley National Laboratory, United States
Copyright © 2021 Adler, Underwood, Rizzo, Harpold, Sterle, Li, Wen, Stinson, Bristol, Stewart, Lini, Perdrial and Perdrial. This is an open-access article distributed under the terms of the Creative Commons Attribution License (CC BY). The use, distribution or reproduction in other forums is permitted, provided the original author(s) and the copyright owner(s) are credited and that the original publication in this journal is cited, in accordance with accepted academic practice. No use, distribution or reproduction is permitted which does not comply with these terms.
*Correspondence: Thomas Adler, dG1hMTEyNkBjb21jYXN0Lm5ldA==; Julia N. Perdrial, anVsaWEucGVyZHJpYWxAdXZtLmVkdQ==