 D. Brian Rogers1,2*
 Michelle E. Newcomer1
 Jonathan H. Raberg3
 Dipankar Dwivedi1
 Carl Steefel1
 Nicholas Bouskill1
 Peter Nico1
 Boris Faybishenko1
 Patricia Fox1
 Mark Conrad1
 Markus Bill1
 Eoin Brodie1
 Bhavna Arora1
 Baptiste Dafflon1
 Kenneth H. Williams1,4
 Susan S. Hubbard1
- 1Earth and Environmental Sciences Area, Lawrence Berkeley National Laboratory, Berkeley, CA, United States
- 2Department of Earth System Science, Stanford University, Stanford, CA, United States
- 3Department of Geological Sciences, University of Colorado Boulder, Boulder, CO, United States
- 4Rocky Mountain Biological Laboratory, Gothic, CO, United States
Recent studies in snowmelt-dominated catchments have documented changes in nitrogen (N) retention over time, such as declines in watershed exports of N, though there is a limited understanding of the controlling processes driving these trends. Working in the mountainous headwater East River Colorado watershed, we explored the effects of riparian hollows as N-cycling hotspots and as important small-scale controls on observed watershed trends. Using a modeling-based approach informed by remote sensing and in situ observations, we simulated the N-retention capacity of riparian hollows with seasonal and yearly hydrobiogeochemical perturbations imposed as drivers. We then implemented a scaling approach to quantify the relative contribution of riparian hollows to the total river corridor N budget. We found that riparian hollows primarily serve as N sinks, with N-transformation rates significantly limited by periods of enhanced groundwater upwelling and promoted at the onset of rainfall events. Given these observed hydrologic controls, we expect that the nitrate () sink capacity of riparian hollows will increase in magnitude with future climatic perturbations, specifically the shift to more frequent rainfall events and fewer snowmelt events, as projected for many mountainous headwater catchments. Our current estimates suggest that while riparian hollows provision ~5–20% of to the river network, they functionally act as inhibitors to upland reaching the stream. Our work linking transient hydrological conditions to numerical biogeochemical simulations is an important step in assessing N-retaining features relative to the watershed N budget and better understanding the role of small-scale features within watersheds.
Introduction
Watershed nitrogen (N) fluxes driven by in-stream N exports can have formative impacts on downstream terrestrial and aquatic ecosystems (Appling et al., 2014; Lucas et al., 2016; Pinay et al., 2018) and water quality for agricultural and municipal usage (Bernard-Jannin et al., 2017; Castaldelli et al., 2020; Lutz et al., 2020). Several studies have documented changes in watershed N exports, such as decadal shifts in watersheds functioning as N sources versus N sinks (Yanai et al., 2013), increases in N exports across several decades or centuries (Van Meter et al., 2017), declines in in-stream N exports (Lucas et al., 2016; Newcomer et al., 2019), and interannual variability in peak N exports (Duncan et al., 2015). The controlling multi-scale processes driving these trends, however, are not well-defined, limiting our predictive understanding of the controls on N exports in freshwater watersheds. Quantifying the major controls on total watershed N exports will therefore be important in predicting future changes in N exports and associated implications under rapid climatic shifts.
Previous studies have shown that microtopographic features (e.g., hummocks and hollows) throughout riparian floodplains are important controls on shallow biogeochemical kinetics (Frei et al., 2012; Duncan et al., 2013). These features are potentially important sites for groundwater-surface water interactions (Frei et al., 2012), as groundwater in riparian floodplains can exhibit seasonal hydrologic connectivity to surface water (Zilli and Paggi, 2013; Reid et al., 2016; Carroll et al., 2018), thus creating biogeochemically active flow paths for infiltrating surface water to travel through before reaching streams. In snowmelt-dominated catchments, groundwater can contribute up to 50% of total stream discharge during baseflow conditions and up to nearly 30% under snowmelt conditions (Carroll et al., 2018). Such connectivity allows these riparian features to function as “ecosystem control points” with respect to in-stream N exports (Frei et al., 2012; Duncan et al., 2013), where ecosystem control points are defined as features essential in understanding aggregate ecosystem behavior (Bernhardt et al., 2017). In a study conducted by Duncan et al., riparian hollows were shown to account for >99% of total denitrification, though they represented less than 1% of the total catchment area (Duncan et al., 2013). In another study, Frei et al. described the importance of coupled hummock-hollow features, which facilitate the introduction of surface water into shallow aquifers, where less-reduced surface water initiates greater microbial growth than older, more-reduced groundwater (Frei et al., 2012). These studies have established riparian hollows as potentially significant drivers to changes in watershed N budgets. There is still uncertainty, however, in how N transformations within riparian hollows respond to transient hydrologic conditions, such as those associated with snowmelt timing, rainfall patterns, and groundwater fluctuations. Delineating and quantifying these transient responses could allow for more accurate temporal and spatial scaling of the impact of riparian hollows on catchment-scale N budgets.
It is well-established that snowmelt-dominated catchments are exhibiting earlier peak snowmelt runoff (McCabe and Clark, 2005; Knowles et al., 2006; Adam et al., 2009; Dudley et al., 2017), declines in net and peak snow water equivalent (SWE) (Clark and Pitlick, 2005; Stewart, 2009; Clow, 2010; Fassnacht et al., 2018), and increasingly more precipitation falling as rain than as snow (Knowles et al., 2006; Adam et al., 2009; Pederson et al., 2011; Dudley et al., 2017). Since spring snowmelt pulses have been found to contribute up to 75% of total annual runoff in some watersheds (Fritze et al., 2011), shifts in snowmelt timing and magnitude have important implications for streamflow dynamics and thus in-stream exports of nutrients (Suecker et al., 2000; Pellerin et al., 2012). In a seasonally snow-covered catchment in the northeastern U.S., 37% of the annual nitrate () yield and 56% of the annual dissolved organic carbon (DOC) yield were accounted for within a 56-day snowmelt (Pellerin et al., 2012). Declines in snowmelt-dominated streamflow driven by decreases in SWE (Barnhart et al., 2016) suggest that the frequency and magnitude of bankfull overflow (riparian zone inundation) events will decrease during this time of especially high in-stream nutrient loading. This trend potentially imposes limits on the duration of high denitrification potential within the shallow subsurface of the riparian zone. In addition to affecting streamflow dynamics, changes in snowmelt magnitude and timing also have sustained implications for soil moisture content (Blankinship et al., 2014; Maurer and Bowling, 2014; Harpold and Molotch, 2015; Yano et al., 2019). As part of a study conducted in a snowmelt-dominated conifer forest, Yano et al. observed that low peak SWE is associated with lower spring soil moisture, which can result in lower soil moisture throughout the dry season and early monsoon season than that observed during years with high peak SWE (Yano et al., 2019). Such impacts on soil moisture in turn affect N-transformation conditions throughout riparian floodplains (Yano et al., 2019).
Biogeochemical mechanisms relevant to N-cycling in riparian hollows include nitrification (NI), a two-step process during which organisms oxidize ammonium () to nitrite () and subsequently to , as well as denitrification (DN) and dissimilatory nitrate reduction to ammonium (DNRA), during which microbes reduce primarily to dinitrogen (N2) and , respectively (Kuypers et al., 2018). DNRA is not commonly included in reactive transport models, since little is known about its environmental importance; however, recent advancements in genome-resolved models have demonstrated that DNRA can be the favored nitrate-reduction pathway in certain systems (Kuypers et al., 2018). Other reduction-oxidation pathways, including those for carbon (C), sulfur (S), and iron (Fe), can interact with these N-cycling pathways by altering the availability of dissolved organic carbon, which often serves as the electron donor and thus provides energy for -reducing reactions (i.e., DN and DNRA) (Appelo and Postma, 2005).
In this study we expand upon the current understanding of riparian hollows as ecosystem control points by integrating the effects of transient hydrologic conditions observed within a snowmelt-dominated catchment and quantifying the potential for these zones to transition between a N source and sink depending on surface water sources and groundwater conditions. We conduct a synthetic modeling study representative of these topographic features in the East River watershed located in Colorado, using site-specific data to force the model and examine how the hydro biogeochemical dynamics of riparian hollows respond to hydrological and meteorological perturbations. We first describe site-specific data, followed by the methods used to determine the hydrological and geochemical boundary conditions for the reactive transport simulations. We detail the analysis used to determine periods and sources of surface flux. Finally, we discuss the importance of surface water origin on the transient N-transformation potential of riparian hollows.
Methodology
Site Background
The reference site is located in the East River watershed, a mountainous headwater near Crested Butte, CO in the Upper Colorado River Basin (Figure 1A). In this study, we synthesized data sets collected within the intra-meander region of a lower montane floodplain, located between 38.9226°N and 38.9242°N and between −106.9508°W and −106.9494°W (Figure 1). The surface of the floodplain is comprised of ~5 m of unconsolidated alluvium, underlain by the Cretaceous Mancos Shale (Hubbard et al., 2018). The alluvium consists of an upper layer of fine-grained overbank deposits ~1-m thick underlain by 4 m of coarse-grained cobbles (Figure 2). Mancos Shale is the primary bedrock in this portion of the watershed and is a key source of metals, metalloids, and pyrite (Hubbard et al., 2018).
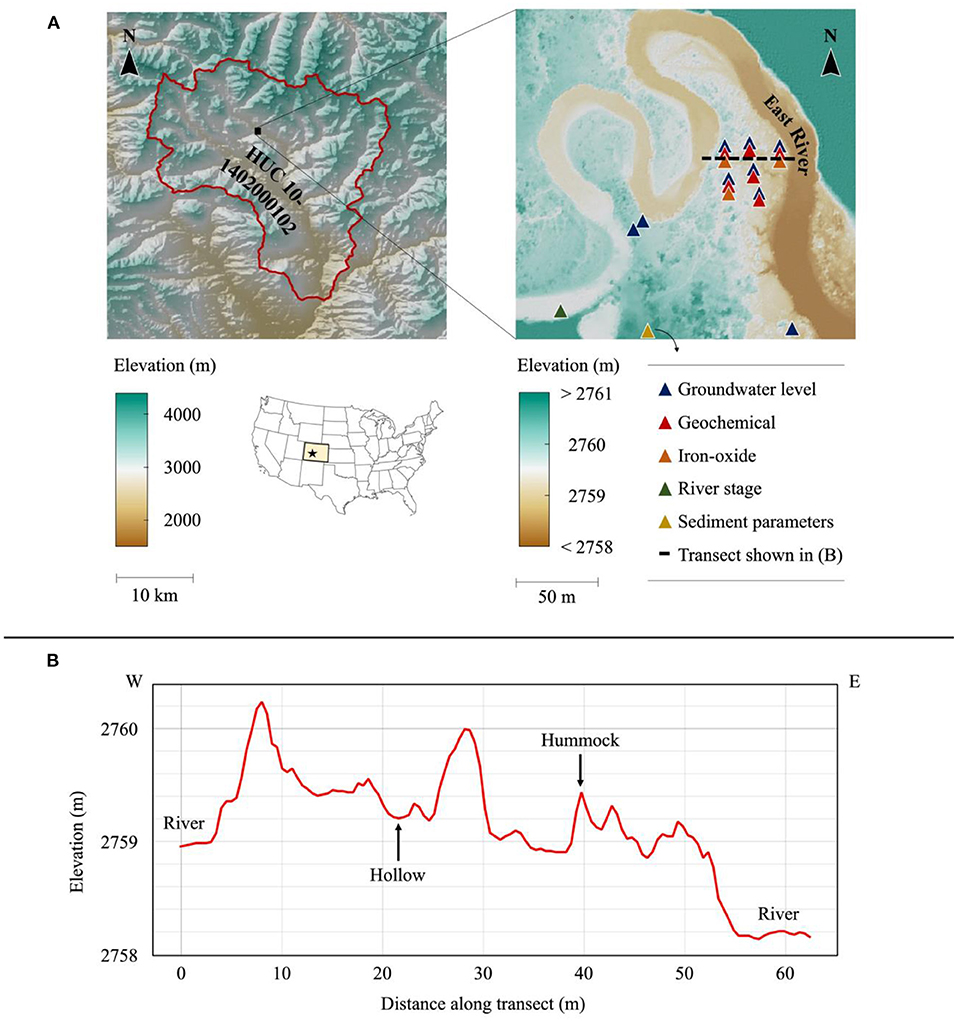
Figure 1. (A) (left) East River watershed (outlined in red) and study site location; (right) data collection locations and types of data measured; overlapping symbols indicate measurements were taken at the same location; sediment parameters were taken at the base of the hillslope at the southern end of the meander (not encompassed in figure); geochemical measurements were also taken at several points throughout the stream and streambed. (B) Floodplain elevation profile with example microtopographic features labeled.
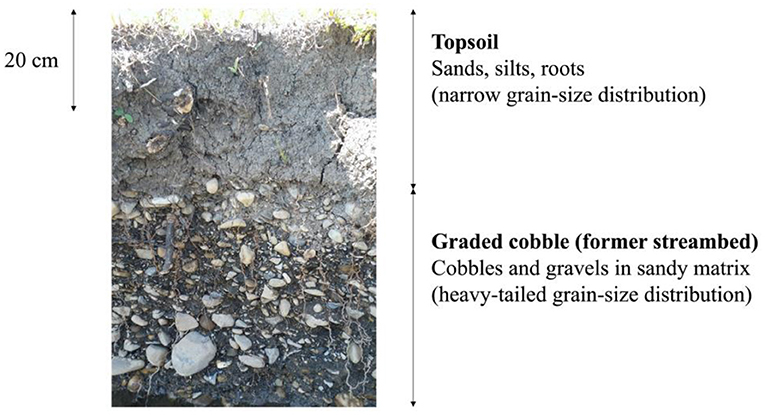
Figure 2. Exposed floodplain cross-section used to inform model parameters.
The study site and encompassing floodplain are located along a meandering stretch (sinuosity = 1.8) of the East River that extends ~11 km. The river discharge is driven primarily by snowmelt, which typically occurs between early March and late June. River discharge also increases during the monsoon season, mid-July through late September (Carroll et al., 2018), though these increases are often isolated and do not contribute to river discharge as significantly as snowmelt does (Hubbard et al., 2018). A majority of the annual precipitation (30-year-average = 670 ± 120 mm per/year) falls as snow and occurs between October and May (Carroll et al., 2018). This hydrologic regime is similar to and representative of many other headwater systems throughout the Upper Colorado River Basin (Hubbard et al., 2018).
In situ Geochemical Sampling
A sampling campaign took place from May 2017 through August 2017 to better understand the transient hydrogeochemical characteristics of the intra-meander area (Newcomer M. E. et al., 2020). The sampling efforts encompassed surface water samples in the stream and in ponded water throughout the floodplain, groundwater samples throughout the floodplain at 20-cm depth intervals up to 100 cm deep, and water samples throughout the hyporheic zone. Samples were gathered using a sediment coring device when appropriate and a peristaltic pump equipped with Norprene® tubing. Samples were analyzed in the field for pH, temperature, oxidation-reduction potential (ORP), and electrical conductivity (EC) using a multi-parameter probe. Additional samples were filtered using 0.45 μm polyvinylidene fluoride (PVDF) membranes and were analyzed in the field using a CHEMetrics V-2000 Multi-Analyte Photometer and CHEMetrics Vacu-vials® Instrumental Kits for the following analytes (information in parentheses indicates CHEMetrics Vacu-vials® Instrumental Kit ID #K-xxxx, range, and method): total and ferrous iron [#K-6203, 0–6.00 ppm, phenanthroline method), sulfide (#K-9503, 0–3.00 ppm, methylene blue method), and dissolved oxygen (#K-7513 (high range) and #K-7553 (low range), 0–15.0 ppm (high range), and 0-1.000 ppm (low range), indigo carmine method (high range) and Rhodazine D method (low range)]; all samples were analyzed using both low range and high range methods for dissolved oxygen.
For cation concentrations [calcium (Ca2+), iron (Fe2+ + Fe3+), potassium (K+), sodium (Na+)], filtered samples were collected in 20 mL plastic scintillation vials and preserved through acidification using 200 μL ULTREX® ultrapure nitric acid. Cation concentrations were measured using inductively coupled plasma mass spectrometry (ICP-MS) (ELAN DRC II, PerkinElmer SCIEX, USA). For anion concentrations [nitrate (), chloride (Cl−), phosphate (), sulfate ()], filtered samples were collected in 20 mL plastic scintillation vials and preserved through freezing. Anion concentrations were measured using ion chromatography (IC) (Dionex ICS-2100, Thermo Scientific, USA). For dissolved organic carbon (DOC) and dissolved inorganic carbon (DIC) concentrations, samples were collected in 40 mL amber glass vials and preserved through chilling. DOC and DIC were measured using a Shimadzu total organic carbon analyzer (TOC-VCPH, Shimadzu Corporation, Japan). Acidified samples were also analyzed for ammonia-N (NH3-N), which was measured using a Lachat QuikChem® 8500 Series 2 Flow Injection Analysis System (Lachat Instruments, QuikChem® 8500 Series 2, Automated Ion Analyzer, Loveland, Colorado).
Model Development
Model Domain and Spatial Discretization
Two-dimensional models were developed in MIN3P to simulate transient hydrological and geochemical inputs into a generalized riparian hollow located within the intra-meander region of the floodplain. MIN3P is a variably saturated flow and reactive transport code that has been benchmarked against several widely used flow and reactive transport codes for a range of hydrological and geochemical applications (Mayer, 1999; Mayer et al., 1999, 2002; Mayer and MacQuarrie, 2010; Molins et al., 2015; Xie et al., 2015). MIN3P is formulated to protect against negative (non-physical) aqueous concentrations and mineral volume fractions by representing these parameters as logarithmic values (Lipnikov et al., 2010; Nakshatrala et al., 2013). All simulations were run using a parallelized version of MIN3P equipped with unstructured grid support (Su et al., 2019). The model was run over periods for which sufficient field data were available in 2016 (March–May), 2017 (March–October), 2018 (April–June and September–October), and 2019 (May–October). The model domain is a 2 m (width) by 5 m (height) cross-section of the volume shown in Figure 3A. The domain includes a generalized hollow that is 0.4 m deep and 1.5 m wide, which is representative of field observations and visual inspection of a 0.5-m digital elevation model (DEM) of the meander region (Falco et al., 2019). The cell sizes (defined by the average edge-length of a cell) were chosen so that higher spatial resolution was obtained near the surface of the model domain, where the most biogeochemical heterogeneity and transiency were expected. This was achieved in Gmsh (http://gmsh.info) using a Delaunay triangulation algorithm, in which the smallest cell size (at the upper boundary) was 0.05 m and the largest cell size (at the lower boundary) was 0.30 m (Figure 3A) (Geuzaine and Remacle, 2009). Both hydrological and geochemical boundary conditions were updated at a maximum of 6-h time steps, while the initial time step was 10−9 days. The boundary condition types are shown in Figure 3B.
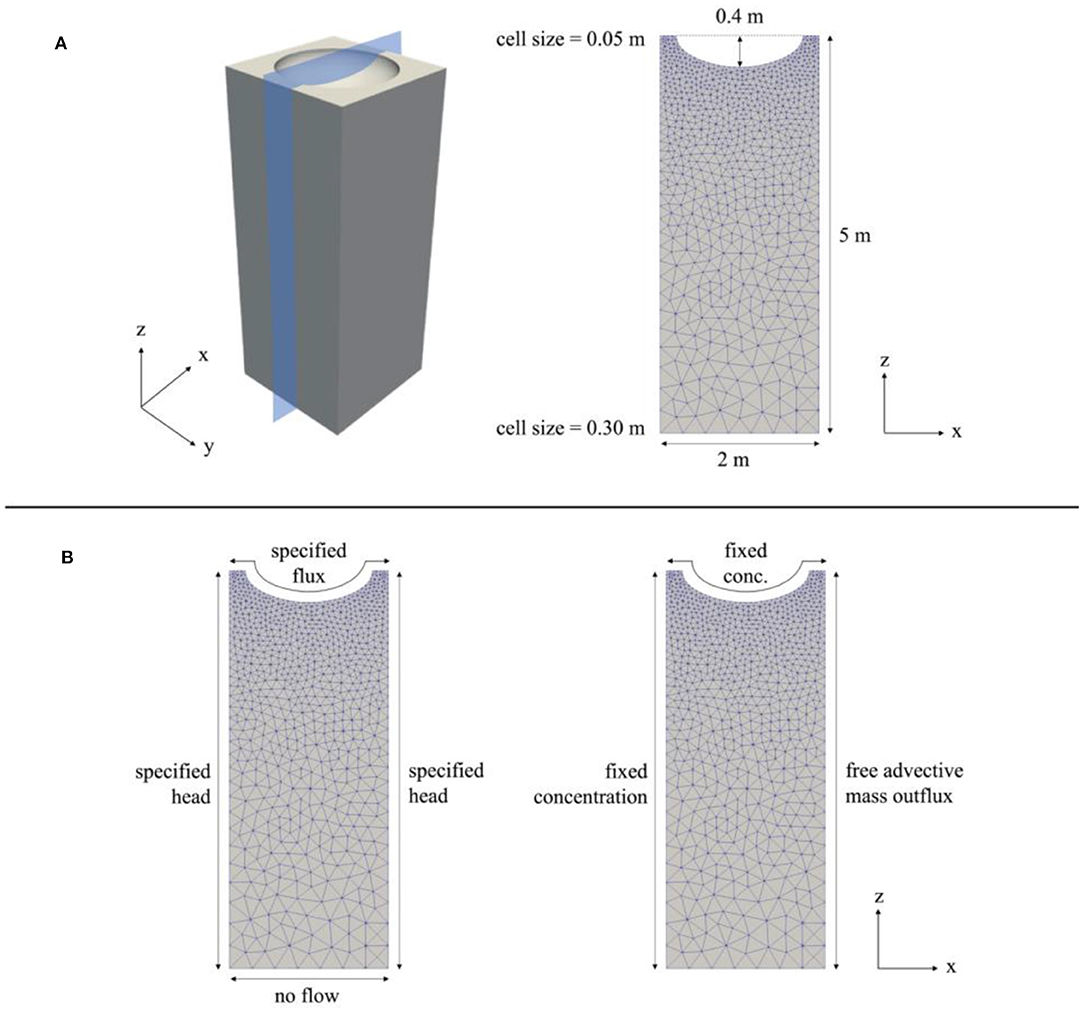
Figure 3. (A) 3D schematic of model domain and 2D cross-section used as model domain in simulations. (B) Hydrologic boundary conditions (left) and geochemical boundary conditions (right).
Sediment Parameterization
Sediment parameterization of the model domain was based on field measurements taken in the floodplain at the base of the hillslope directly adjacent to the study site. Sand, silt, and clay percentages and bulk density were measured for soil samples taken at 20-cm intervals throughout the top 100 cm of the soil column (Faybishenko, 2020). These measurements were then used to calculate hydraulic conductivity in the z-direction [Ksat(z)], porosity (np), residual water content (θr), saturated water content (θs), α (van Genuchten water retention parameter corresponding approximately to the inverse of the air-entry value), and n (van Genuchten empirical parameter related to the width of the pore-size distribution) (Peters et al., 2011; Faybishenko, 2020). An anisotropic ratio of 1/3 was assumed for determining hydraulic conductivity in the x-direction [Ksat(x)] (Fetter, 2001). Since the samples acquired were only representative of the upper 100 cm and its comparatively high fraction of fine-grained (<2 mm) materials, the physical parameters for the graded cobble were determined using representative values gathered from previous studies (Table 1).
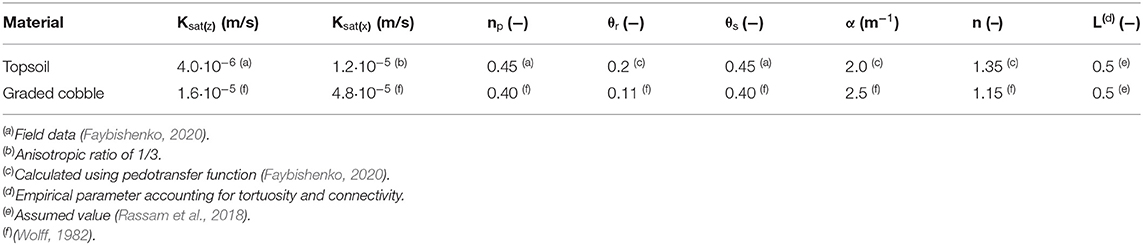
Table 1. Porous media physical parameters.
Hydrologic Boundary Conditions
In situ hydrologic conditions from 15-min-resolution groundwater elevation data collected across multiple shallow piezometers in the floodplain were used to force the hydraulic head of the left (inflow) boundary of the model (Figure 3B; Dafflon et al., 2020). The lateral groundwater flow was assumed to be left to right in the model, where the hydraulic head of the right (outflow) boundary was calculated by subtracting the change in head (horizontal gradient multiplied by a lateral distance of 2 m) from the hydraulic head at the left (inflow) boundary. The horizontal gradient was calculated using a triangulation method on the time-series groundwater level data, allowing the gradient to reflect seasonal hydrologic perturbations. The lower boundary was specified as a no-flow boundary, justified by the relatively low permeability of the Mancos Shale compared to the overlying cobble layer (Figure 3B; Hettinger and Kirschbaum, 2002; Ridgley et al., 2013).
A specified flux boundary was applied at the surface of the model to allow the forcing of transient surface infiltration rates. Positive surface flux (representing infiltration and hereon referred to as surface flux) was hypothesized to occur under four different conditions: snowmelt, rainfall, bankfull overflow, and groundwater upwelling (Figure 4). It was expected that snowmelt, bankfull overflow, and groundwater upwelling would occur during the snowmelt season (March through June), while surface flux due to rainfall would primarily occur during the dry and monsoon seasons (July through October). Given these approximate seasonal bounds, we temporally bounded our simulations to take place between March and October.
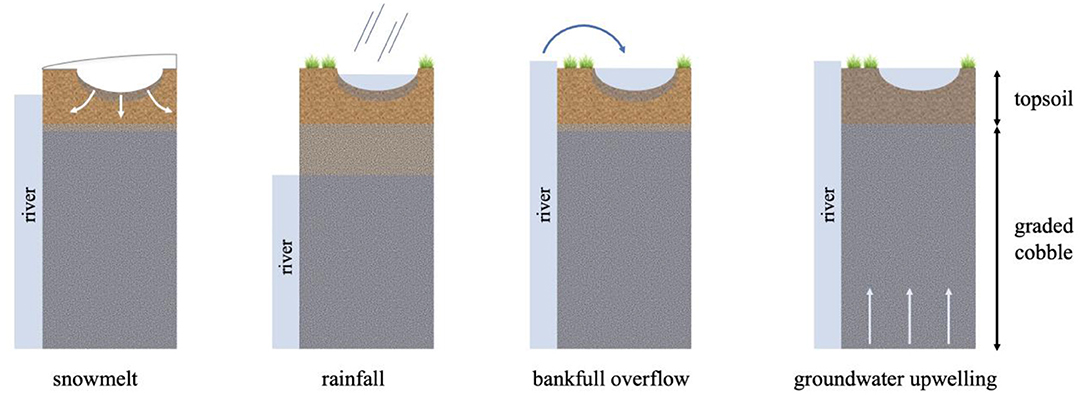
Figure 4. Modes of surface flux modeled in simulations.
Meteorological Data
All meteorological data used to calculate surface infiltration fluxes from snowmelt and rainfall were obtained at 15-min temporal resolution from a WeatherUnderground station located 1.2 km southwest of our study site (Weather Station ID: KCOMTCRE2; Station Name: Gold Link) (The Weather Company, 2020). All data went through a quality assurance and quality control process and were gap-filled to produce continuous time series (Newcomer and Rogers, 2020). These data were then used to calculate partitioned snowfall/rainfall rates and potential evapotranspiration rates, which were key parameters in determining snowmelt and rainfall surface flux rates, described in detail in the following subsections.
Delineating Periods of Snowmelt
The “EcoHydRology” package in R (v3.6.2) was used to partition total precipitation rates into separate snowfall and rainfall rates and to calculate daily snowmelt rates (R Core Team, 2020). The functions used for these calculations were provided with in situ precipitation, temperature, slope, aspect, albedo, wind speed, solar radiation, snow depth, and snow density data. The snowmelt rate was directly interpreted as the surface flux rate to impose in the MIN3P simulations, implying that all of the snowmelt directly above the hollow infiltrated into the soil. This assumption is reasonable for this model, since the domain is a closed depression.
Delineating Periods of Bankfull Overflow
Periods of bankfull overflow onto the floodplain were delineated by comparing river water absolute elevations to the absolute elevations of each groundwater well. At each well, we first identified the nearest location in the river for which we needed an estimate of river water absolute elevation. We calculated river water elevations at all points around the meander by subtracting the drop in head between each point and a reference point upstream, where 10-min-resolution river stage data was collected using a pressure transducer (Carroll and Williams, 2019). To calculate the drop in head between each point and the reference point, the distance between each point and the reference point was multiplied by a fixed gradient of −0.0024. This gradient was determined using surface water elevations captured by a 0.5-m DEM of the meander region (Falco et al., 2019). The head drop was subtracted from the river stage data collected at the reference point to obtain an approximate time series of the river stage at each point along the meander. Surface flux due to bankfull overflow was assumed to occur when the nearest river water absolute elevation was greater than the absolute elevation of the ground surface at each groundwater well.
Delineating Periods of Groundwater Upwelling
Periods of groundwater upwelling contributing to surface water ponding were delineated by comparing 15-min-resolution groundwater elevation data to the ground surface elevation of the well. Groundwater upwelling was assumed to occur when the groundwater elevation was greater than the ground surface elevation of the well.
Delineating Periods of Surface Flux Due to Rainfall
In order to obtain infiltration rates from the previously described ponding due to bankfull overflow and ponding due to rain events, we used HYDRUS-1D to calculate ponding heights and subsequent infiltration from both of these events. First, HYDRUS-1D was used to delineate periods of surface flux due to rainfall (Rassam et al., 2018). We used HYDRUS-1D because of the surface ponding capabilities and to calculate infiltration in response to variable atmospheric and ponding conditions. The model domain was designed to replicate the domain used in MIN3P, with a 5-m column comprised of 1 m of topsoil overlying 4 m of graded cobble, using the same physical sediment parameters described in section “Sediment Parameterization”. The only difference between the HYDRUS-1D domain and MIN3P domain was the removal of the lateral (x) dimension in the HYDRUS-1D domain. The upper boundary condition was an atmospheric boundary with a surface layer, which allowed accumulation of water at the surface. Rainfall and evapotranspiration were applied at the soil-atmosphere interface using the meteorological data described in section “Meteorological data”. The rainfall rates were multiplied by a factor of 2.0 to account for the fact that topographic depressions can function as hydrologic sinks that accumulate runoff from surrounding areas. A multiplication factor of 2.0 was chosen using trial-and-error and visual comparison to measured ponding depths following storms impacting the meander. A maximum time step of 15 min was used to capture shorter-duration rainfall events. The lower boundary condition was a variable head condition, which was forced using the previously described groundwater elevation data.
The data corresponding to ponding by either bankfull overflow or rainfall were then imposed in a HYDRUS-1D simulation as a variable head surface boundary. The model domain, sediment parameters, and lower boundary conditions in these simulations were directly transferred from the previous HYDRUS-1D simulations. The infiltration rates obtained in the outputs of these HYDRUS-1D models were then imposed as specified flux boundaries in the main MIN3P simulations. Infiltration rates during periods of surface flux with no ponding, which occurred during snowmelt and certain rainfall events where flux rates were low enough to dampen but not saturate the soil, were also imposed as specified flux boundaries in MIN3P. This analysis workflow (Figure 5) was performed for all available data from the snowmelt, dry, and monsoon seasons in 2016–2019.
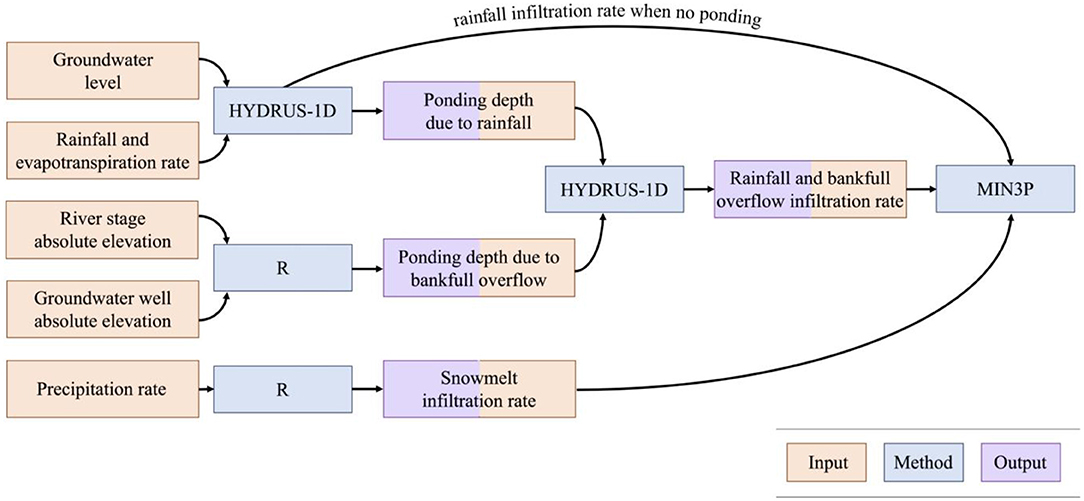
Figure 5. Analysis workflow to obtain specified flux surface boundary for input into MIN3P.
Geochemical Boundary Conditions
A fixed concentration Dirichlet-type boundary condition was applied at the left side (input) of the model domain, while the right side (output) of the domain was specified as a free advective mass outflux boundary (Figure 3B). The upper surface (soil-atmosphere interface) of the model was provided with fixed aqueous species concentrations that reflected the source of surface water for each time step. The three possible types of surface water sources were snowmelt, bankfull overflow, and rainfall. For time steps during which there was no surface ponding, the concentrations reflecting the most recent source of surface water were applied. The geochemical makeup of the bankfull overflow was determined using median concentration values of several river chemistry measurements taken along the meander. The geochemical makeup of the snowmelt and rainfall were determined using data provided by the National Atmospheric Deposition Program and documented values from similar field sites. The geochemical makeup of the groundwater was determined using field data and subsequent calibration, which was performed so that aqueous species concentrations were within the same magnitude of those measured in the field (Supplementary Table 1).
Reaction Network
The reaction network consisted of 12 primary aqueous species and 34 secondary aqueous species. Three gases, dinitrogen (N2), carbon dioxide (CO2), and dioxygen (O2), were also considered in the reaction network. Ten intra-aqueous kinetic reactions were implemented to model N-cycling and its indirect interactions (mediated via competition for dissolved organic carbon) with iron oxidation-reduction reactions and sulfur oxidation-reduction reactions (Figure 6) (Arora et al., 2016; Dwivedi et al., 2018a,b). The reaction kinetics of the biogeochemical network were formulated using Monod-type reaction kinetics. In this formulation, the activation of a reaction pathway is primarily controlled by concentrations of reacting aqueous species and the associated half-saturation constant (Ks) for each reactant; inhibition constants for aqueous components can also be specified to deactivate a reaction pathway when the concentration of a specified aqueous component is greater than the inhibition constant (Supplementary Table 2; Su et al., 2019).
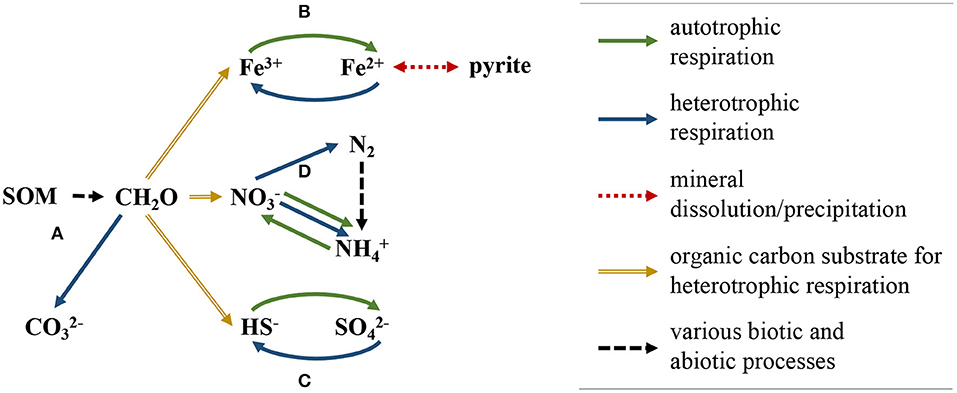
Figure 6. Schematic of biogeochemical reaction network implemented in model simulations. SOM degrades to CH2O, which then participates in the following reaction pathways; (A) organic matter oxidation, (B) Fe(III)/Fe(II) reduction-oxidation, which affects the rate of pyrite dissolution/precipitation, (C) sulfide/sulfate reduction-oxidation, and (D) nitrogen reduction-oxidation, which includes nitrogen fixation, nitrification, dissimilatory nitrate reduction to ammonium, and denitrification.
Dissimilatory nitrate reduction to ammonium (DNRA) was included in the reaction network due to the high organic carbon to nitrogen ratios (mean ponded surface water C:N = 15.0, mean groundwater C:N = 19.6) and relatively low nitrate concentrations measured at the site, both of which are key controls on the growth of DNRA-performing organisms. DNRA follows two primary pathways, fermentative (DNRAFR) and chemolithoautotrophic (DNRAAT), the former using organic carbon as the primary electron donor and the latter using sulfide as the primary electron donor (Giblin et al., 2013; Yin et al., 2017). Both DNRA pathways were included in the reaction network. Dissolved organic carbon (DOC) used in heterotrophic reactions was supplied as CH2O through decomposition of soil organic matter (SOM), which was implemented in the model as a mineral (Dwivedi et al., 2018b; Newcomer et al., 2018). The domain also included pyrite, the initial volume-fraction of which was calculated using sequential iron-oxide extraction techniques on shallow soil samples gathered throughout the floodplain (Fox et al., 2019).
Model Analysis
Model Validation
For hydrologic validation of our model simulations, we compared simulated soil moisture content (θ) at depths of 10 and 60 cm to in situ θ measured at the same depths within an intra-meander floodplain located ~200 m downstream of the primary study site (Wu, 2017). We focused this analysis on the 2017 simulation period, since this was the longest continuous simulation, allowing us to compare both short-term and long-term trends. For biogeochemical validation, we considered transient aqueous concentrations for three species integral to N-cycling, , , and O2(aq). For each species, we compared in situ concentrations measured at depths of 20 cm to 100 cm below the ground surface of the intra-meander floodplain from 05/20/2017 to 08/30/2017 (see section “In Situ Geochemical Sampling”) to simulated aqueous concentrations at a depth of 60 cm below the ground surface (midpoint of in situ geochemical measurements) for the same time period. Because all model domains are inherently a generic simplified representation of reality, we treat the model domain as a tool for enhancing understanding of processes and controls on nitrogen cycling, and not as a tool to simply recreate measured values. Indeed, even the worst models can perfectly predict measurements with the “right” parameter set, thus we take great care in this study to make sure measured parameters (soil K, etc.) and measured state conditions (soil chemistry, soil hydrology) generally agree with model simulations.
N Transformation Rates
We focus our analysis on the relevant N-cycling pathways, including denitrification (DN), both DNRA pathways (DNRAFR and DNRAAT), and nitrification (NI), since these reactions directly affect loading. To analyze the kinetics of each reaction, we began with the mass of N that is transformed by each reaction across the entire model domain for each time step; these values are directly provided as raw outputs from MIN3P with units of mol N d−1. We then added a spatial dimension to this rate by calculating the transformation rate per square meter of land surface area. For two-dimensional model domains, MIN3P provides transformation and flux rates as if the domain is projected one unit (e.g., m) into the third dimension. Therefore, the land surface of our model is 2 m (x-dimension) by 1 m (projected into y-dimension). Thus, the raw transformation rates were divided by 2 m2 to determine the riparian hollow N transformation rates per square meter of land (mol N m−2 d−1)
To compare these transformation rates to the timing of surface flux events, we also calculate when spikes occur in the rates. Here, a spike is defined where a transformation rate increases and crosses a specified threshold value, which was chosen as either ~50% or ~75% of the maximum rate. While the number of spikes will always increase or remain the same with lower threshold values, we found that changing the threshold value (when the threshold value is at least above the mean value) does not considerably change the percentage of spikes associated with a specific type of surface flux. Therefore, while there exist more mathematically sophisticated techniques of spike detection, this method is sufficient for the purposes of our analysis.
Mass Balance Definitions and Calculations
For the purposes of mass balance analysis, we provide the following terms and definitions:
sink: more flows into the model domain than flows out; this term is controlled by both transport and reactions.
source: more flows out of the model domain than flows in; this term is controlled by both transport and reactions.
Percent source/sink: the percentage of influx that is gained or lost by the hollow throughout the simulation; 0% source/sink represents a outflux equal to the influx; −50% source/sink represents a outflux equal to one-half of the influx, indicating the hollow is a net sink; +100% source/sink represents a outflux that is double the influx, indicating the hollow is a net source.
Net removing or net consuming: within the model domain, more is removed than is produced by aqueous reactions; i.e. the total amount of removed by DN and DNRA is greater than the total amount of yielded by NI; this term is controlled only by reaction rates.
Net yielding: within the model domain, more is yielded by aqueous reactions than is consumed; i.e., the total amount of yielded by NI is greater than the total amount of removed by DN and DNRA; this term is controlled only by reaction rates.
The mass influx, mass outflux, change in storage, and net mass removed or net mass yielded across the domain during each time step are directly provided as raw data outputs from the MIN3P simulations. The cumulative values for these parameters are also provided at each time step, so total mass influx, for example, across the entirety of each simulation could be found by evaluating the cumulative mass influx at the final time step of each simulation. As with the N transformation rates, we added a spatial dimension to determine flux rates per square meter of riparian hollow (mol m−2 d−1) and cumulative flux per square meter of riparian hollow (mol m−2). The percent source/sink term for each simulation was determined by calculating (total mass outflux–total mass influx)/(total mass influx).
Scaling
To better understand the magnitude of riparian hollow N fluxes relative to the catchment N budget, we estimated the contribution of riparian hollow -N outfluxes to in-stream -N fluxes near the outlet of the East River catchment. The first step to determine this contribution was to calculate the -N outflux from the total area of the catchment covered by riparian hollows. Using an approximation provided by Duncan et al. that riparian hollows cover up to 1% of the total catchment area (Duncan et al., 2013), we multiplied 1% of the catchment area by the cumulative -N outflux per square meter of riparian hollow to determine the -N outflux from the total area of the catchment covered by riparian hollows. We then divided these fluxes by the corresponding in-stream -N fluxes for each model period to approximate the contribution of riparian hollows to the in-stream -N budget. The in-stream -N fluxes were determined using concentration-discharge relationships gathered near the outlet of the East River catchment (Newcomer M. et al., 2020).
To provide another metric on how riparian hollow N fluxes impact catchment scale N fluxes, we also approximated the in-stream -N outflux of a hypothetical watershed lacking riparian hollows. To determine this, we first calculated the -N influx into the total area of the catchment covered by riparian hollows, using the same method described in the previous paragraph that was used to determine the total outflux. We then determined the net effect of the riparian hollows by subtracting the total influx from the total outflux; a negative value in this case would mean riparian hollows are removing -N before it reaches the stream, while a positive value would mean the presence of riparian hollows results in an increase in stream -N.
Results
Model Validation
At depths of 10 cm and 60 cm, the simulated θ generally followed in situ θ trends well (Figure 7). At 10 cm depth, major and minor peaks and troughs in measured θ can also be seen in simulated θ, albeit frequently at varying magnitudes. The most significant discrepancy occurs during June 2017, during which there is bankfull overflow in the simulated domain. This bankfull overflow likely did not occur in the downstream floodplain, since there are no significant changes in measured θ. Other minor discrepancies can likely be attributed to model sediment parameters being slightly different from downstream in situ sediment parameters, as changes in these parameters can affect water retention curves and associated hysteresis (Likos et al., 2014). At 60 cm depth, both simulated and measured θ show an initial trough, followed by a mostly static period, and end with a gradual decline. The simulated θ reaches its maximum soil moisture content (indicating saturation) during the static period due to high groundwater levels. Saturation is not seen in the measured θ, possibly due to (1) higher porosity in the downstream in situ domain than in the simulated domain, (2) location relative to the river, or (3) varying thicknesses of topsoil and graded cobble layers.
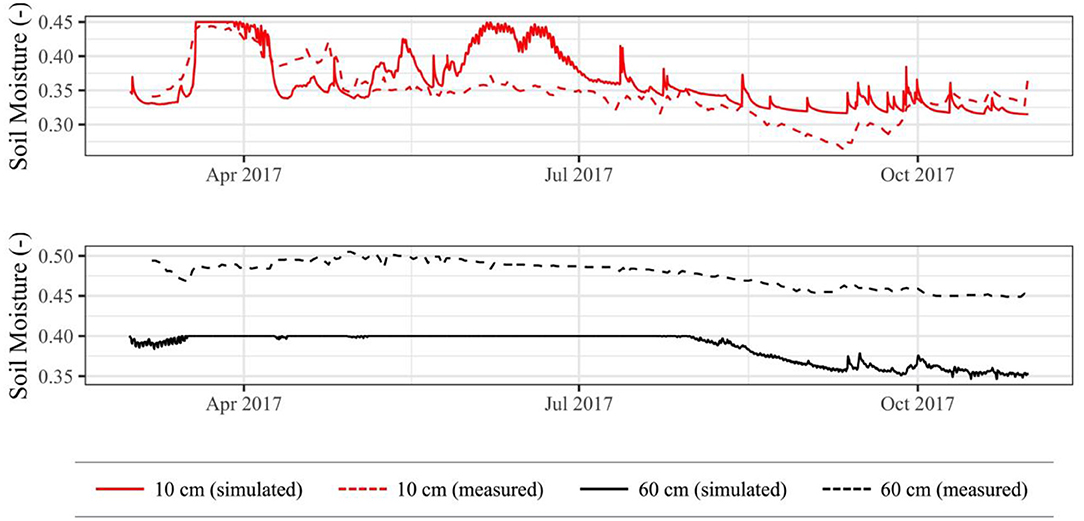
Figure 7. Simulated soil moisture contents compared to in situ soil moisture contents across 2017 simulation period.
In general, the simulated concentrations fall within the range of measured concentrations for each species of interest (Figure 8). Simulated concentrations are slightly larger than measured concentrations, though they are well within the same order magnitude and follow the same overall trend. Simulated and O2(aq) concentrations are near the lower and more densely populated end of the range of respective measured concentrations, and they also follow the same general trend as measured concentrations.
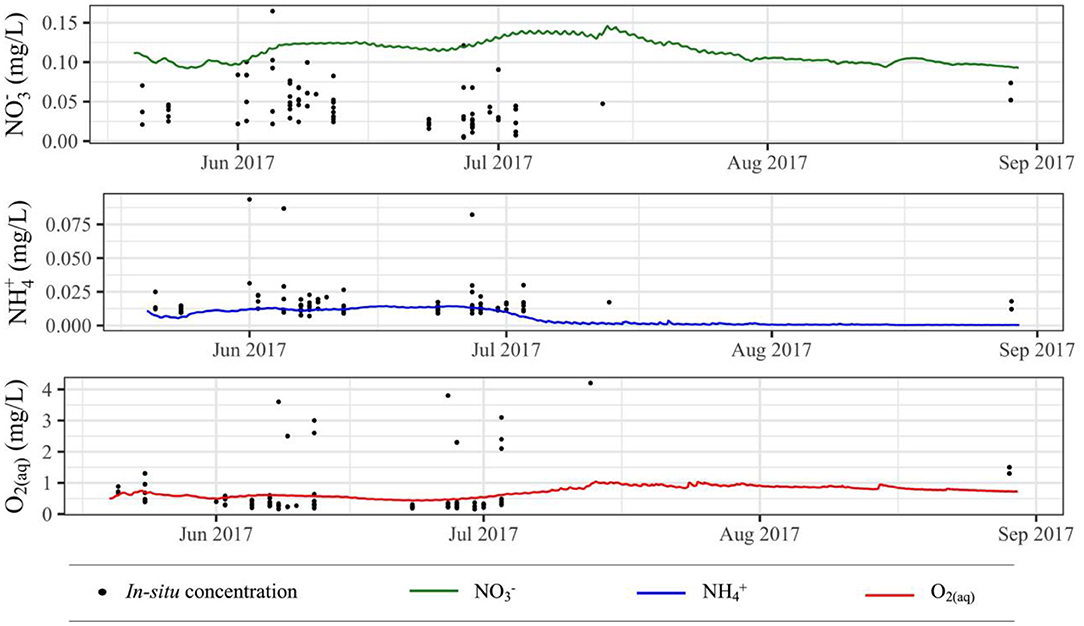
Figure 8. Simulated aqueous species concentrations compared to in situ aqueous species concentrations; multiple y-values for a single x-value represent in situ measurements at multiple locations and/or depths on a given day.
Riparian Hollow Surface Flux Periods and N-Cycling Kinetics
Distribution of Surface Flux Events and N Transformation Spikes
Surface flux occurs for 24% of the time simulated; 47% of the surface flux (as determined by duration rather than number of events or magnitude of events) is due to snowmelt, 39% rainfall, and 14% bankfull overflow (Figure 9). While each season consists of several surface flux events, there tend to be fewer surface flux events in later months, primarily mid-August through October.
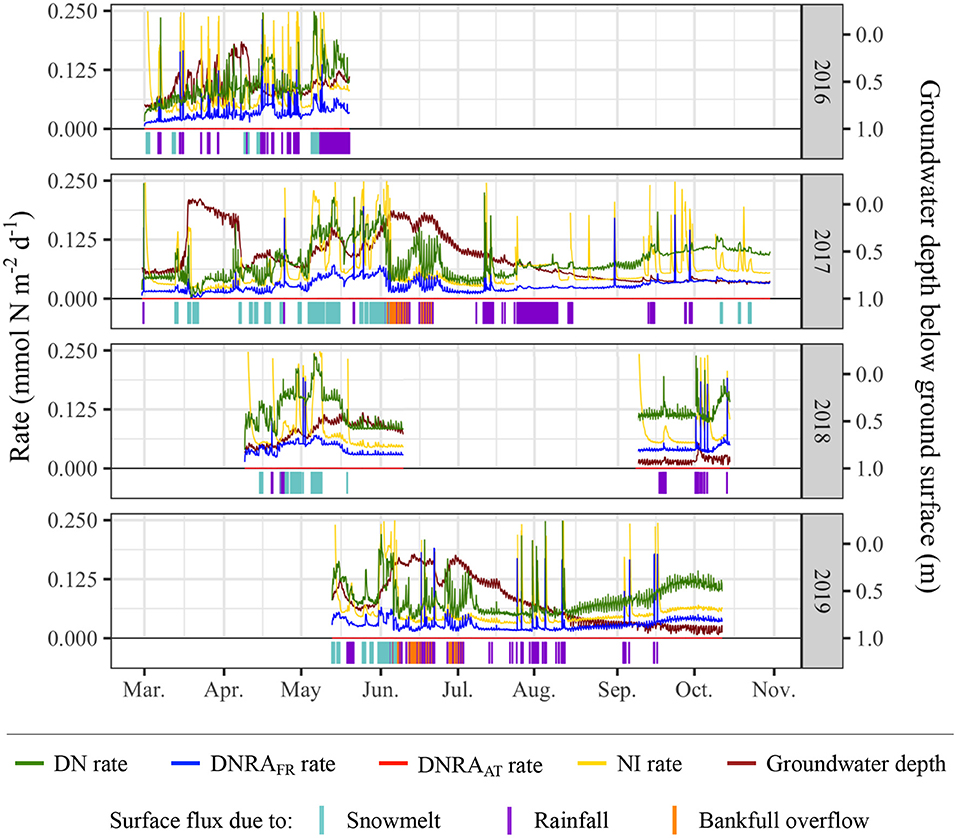
Figure 9. N-transformation rates, groundwater depth, and surface flux periods/sources. In the bottom portion of each plot, the presence of a vertical line indicates surface flux occurring at that time, and the color of the vertical line represents the source of the surface flux. Simulations were only run for periods when sufficient data were available.
In general, DN rates are higher than NI rates and both DNRA rates. There are several short periods during which the NI rate is greater than the DN rate, though the spikes in NI during these periods generally display a rapid onset and are not usually sustained over long periods of time. Both DNRA rates are consistently lower than DN and NI rates, with DNRAFR rates ~33% of DN rates and DNRAAT rates negligible (<1%) relative to DN rates.
Each DNRAFR spike coincides with a spike in NI, though the converse is not always true. Eighty one percentage of the spikes in DNRAFR occur at the onset of surface flux due to rainfall, 12% occur at the onset of surface flux due to snowmelt, and the remaining 6% are not directly associated with the onset of a surface flux event. Spikes in DNRAFR rates were determined using a threshold value of 0.125 mmol N m−2 d−1; similar percentages were obtained using various threshold values.
Effects of Groundwater on N Transformation Rates
When comparing groundwater table depth to N-transformation rates, a few key trends related to groundwater depth, bankfull overflow, and NI rates appear. The lowest NI rates, occurring during mid-March 2017, are associated with the shallowest groundwater levels across all simulations. A significant decrease in NI rates is also observed throughout June 2017, another period of shallow groundwater levels. This pattern can be identified at several points throughout the simulations, across different types and magnitudes of surface flux. Bankfull overflow events, observed during June-July of 2017 and 2019, can also be related to shallow groundwater events and low NI rates. Shallow groundwater levels, however, do not fully inhibit spikes in NI rates. For example, during early to late June 2019, NI rates are near their lowest and groundwater is at its shallowest for the analyzed portion 2019; however, there are also three spikes in NI during this period, occurring at the onset of rainfall events. These patterns suggest that upwelling of reduced groundwater is an important inhibitor of NI, but also that rainfall events (associated with about 70% of NI spikes, as determined using threshold values of 0.1875 and 0.125 mmol N m−2 d−1) and snowmelt events (associated with 24% of NI spikes) can provide brief periods of geochemical conditions favorable for NI metabolisms.
Mass Balance Dynamics
Time-series analysis of mass balance parameters, including mass influx, mass outflux, change in storage, and mass removing/yielding rates, indicates that riparian hollows frequently fluctuate between net removing and net yielding behavior, typically due to the onset of different types of surface flux (Figure 10). The percentage of time during which the domain is net removing ranges from 74 to 87% of each simulation, with spikes in NI rates resulting in net yielding behavior occurring, on average, for 20% of each simulation. Of this 20% during which net yielding conditions prevail, 43% occurs during periods of no surface flux, 29% during snowmelt events, 24% during rainfall events, and 4% during bankfull overflow events. Given surface flux only occurs for 24% of the total simulation period but for 57% of the total net yielding period, it appears that surface flux events preferentially result in net yielding behavior.
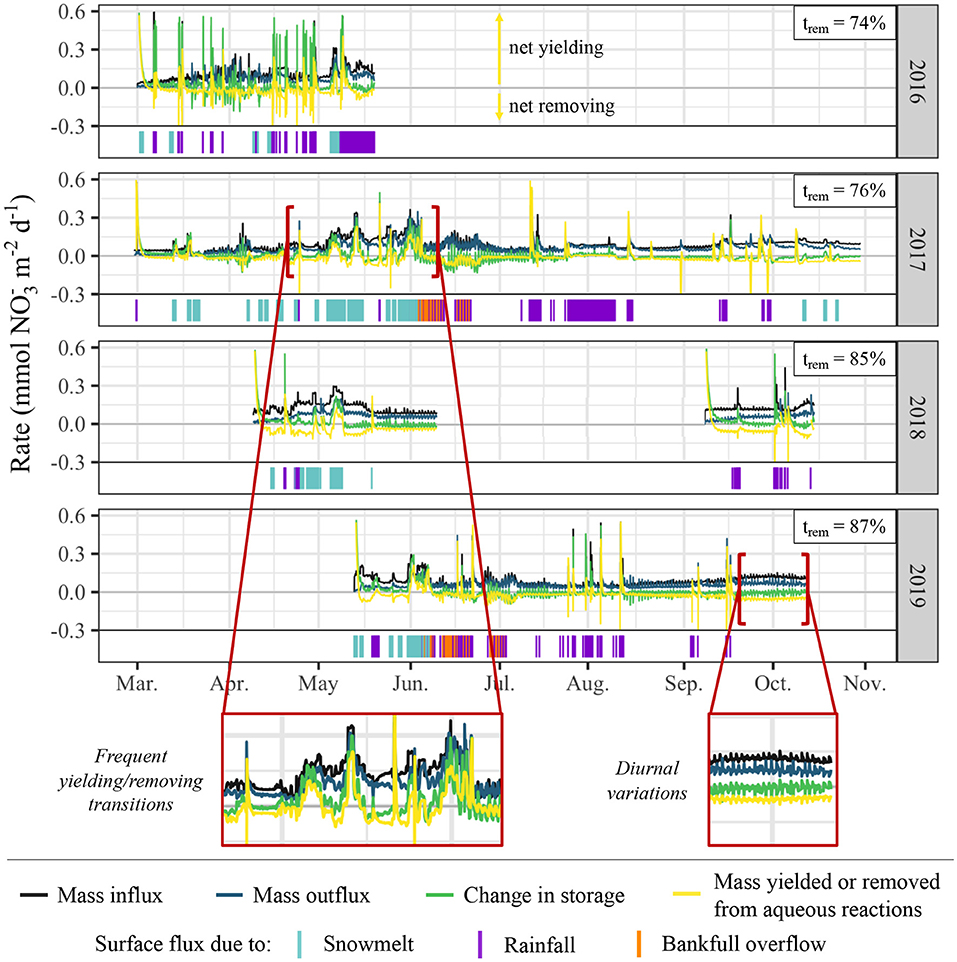
Figure 10. Time-series of mass balance dynamics and surface flux periods/sources. Mass balance parameters are presented in rates of mol d−1 and represent dynamics spatially summed across the entire model domain. Positive mass removing/yielding rates from aqueous reactions represent net yield (NI > DN + DNRAFR+AT), and negative values represent net removal (NI < DN + DNRAFR+AT). The percentage of time during which the domain is net removing (trem) is denoted at the upper right corner of each plot.
While the peak magnitude of removing behavior is far less than the peak magnitude of yielding behavior, cumulative mass balance calculations for each model period indicate that the significantly longer durations of removing behavior result in the simulated hollow functioning as a net remover for all model periods (Table 2). This behavior translates to each of the model periods operating as net sinks, though the degree of sink-behavior is impacted by variability from meteorological conditions. During the 2019 monsoon season, for example, there was a one-month period (mid-Sep. to mid-Oct.) with minimal surface flux due to rainfall. This resulted in very mild but constant removal behavior. During the same one-month period in 2018, however, there were several rainfall-driven surface flux events, resulting in far more dramatic removal behavior and thus sink functionality.
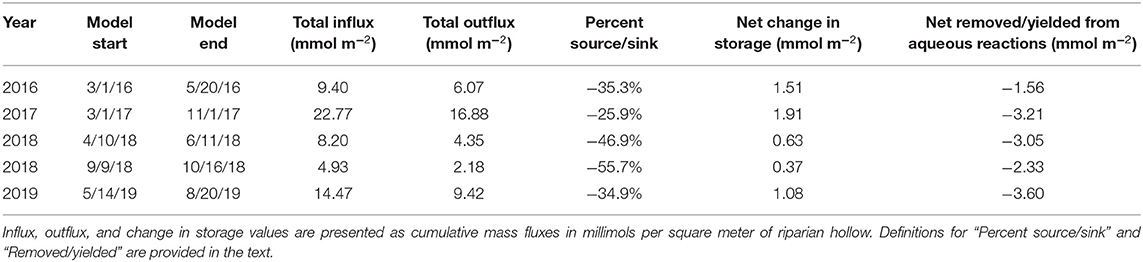
Table 2. Cumulative mass balance values separated by year and relevant sub-period for which the model was run.
Riparian Hollows and the Stream N Budget
Aggregating total outfluxes and comparing with stream N exports indicate riparian hollows can be major contributors to stream N budgets (Table 3). In-stream exports of -N range from 0.14 to 1.7 Mg across the different simulation periods; riparian hollow contributions to these in-stream -N exports range from 0.026 to 0.2 Mg, assuming that riparian hollows comprise 1% of the total catchment area above the meander where field data was collected (Figure 9; Duncan et al., 2013). The total contribution of riparian hollows as a percentage of the total in-stream -N outflux ranged from 6 to 23%, with a temporally weighted average of 15%. Out of the five time periods we simulated, the year 2017 had the highest percentage of riparian hollow contributions to stream N exports, accounting for nearly one-quarter of the in-stream -N outflux.
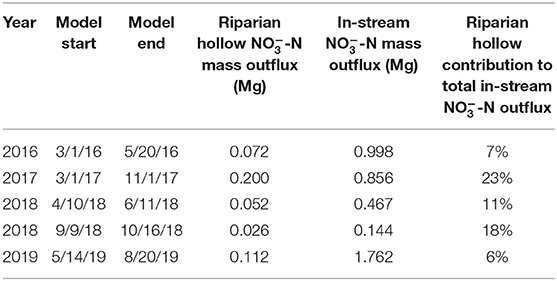
Table 3. Scaled contribution of the total outflux from riparian hollows across the catchment to the in-stream -N outflux for each of the simulation periods.
Using the mass influx of the model domain and removing any source/sink behavior introduced via riparian hollows, we calculated that in-stream -N outfluxes could increase by up to 20% in the complete absence of riparian hollows. Therefore, despite the seemingly large contribution of riparian hollows to in-stream -N budgets, our calculations in a hypothetical watershed lacking riparian hollows show that these features can be inhibitors of upland reaching the stream.
Discussion
Hydrologic Controls on N-Cycling
Our results show that groundwater upwelling significantly inhibits NI, which is expected due to the anoxic and reducing properties of the groundwater at this site. This trend aligns well with previous studies conducted at the site, where measured in situ NI rates were often minimal (Personal communication, E. Brodie). DN rates were not as limited by groundwater upwelling as NI rates were, though the simulations did still yield lower DN rates during periods of shallow groundwater. This can likely be attributed to the limited concentration of electron acceptors (i.e., ) in the highly reduced groundwater. During previous field campaigns conducted at this site, DN was not observed through analysis of genomic samples (Sorenson et al., 2019). However, this does not mean that DN was not occurring at the time of sampling; it likely means that sampling locations, depths, and/or timing were not suited to capture measurable DN rates. This study can help inform future field campaigns both spatially and temporally, as our simulations suggest that (1) DN occurs at higher rates near the surface, rather than in the deeper, highly reduced groundwater, and (2) DN rates more often spike at the onset of rainfall events, rather than during shallow groundwater conditions or snowmelt events.
Shifts in snowmelt timing and magnitude, as well as more precipitation falling as rain than snow, could have substantial impacts on -N exports given the controls we observed on N-transformation rates. With anticipated dryer and warmer winters in alpine regions, as predicted by past studies conducted at this site, our results suggest that spikes in DN, DNRAFR, NI rates will likely increase in frequency and magnitude due to (1) deeper groundwater levels related to shorter snowmelt periods, and (2) an increase in proportion of surface flux events due to rainfall coupled with a decrease in the proportion of surface flux events due to snowmelt (Hubbard et al., 2018). The net impact of such changes in the partitioning of rainfall and snowfall is the potential shift of riparian hollows to functioning as more significant sinks, further decreasing the net -N exports in an already -limited watershed. This suggested trend has previously been observed through analysis of a 50-year concentration-discharge time series of the East River during which there are declines in inorganic nitrogen over time and down the watershed network (Newcomer M. E. et al., 2020).
Riparian Hollow Source/Sink Behavior and Scaled Impact
Our simulated riparian hollow functions as a net sink, removing or retaining approximately one-quarter to one-half of the that is transported through the domain. We found the most significant reaction consuming and removing from the domain was DN; however, was quite sensitive to surface flux events. Only 15% of net removing behavior occurred during periods of surface flux, while a much more significant 57% of net yielding behavior occurred during periods of surface flux.
Our scaling results show that riparian hollows may contribute a significant portion of the in-stream -N outflux, emphasizing their role as one of the major ecosystem control points within the riparian corridors. We also calculated that in-stream -N outfluxes could increase by up to 20% in the complete absence of riparian hollows. This indicates that the presence of these riparian hollows may inhibit upland from reaching the stream, resulting in decreases in watershed N exports.
We acknowledge many different sources of uncertainty could shift these estimates. These calculations assumed that the groundwater baseflow always travels from the beneath riparian hollow into the stream, implying gaining conditions for the periods analyzed. While this may result in an overestimate of the total contribution of riparian hollows to the in-stream -N outflux, groundwater baseflow has been shown to be an important source of streamflow across all seasons at this site, justifying the assumption of gaining conditions.
Among the several types of ecosystem control points proposed by Bernhardt et al. our simulated riparian hollow would be classified as an activated control point that “supports high transformation rates only when the delivery rate of one or more limiting reactants increases and when abiotic conditions required for a particular biogeochemical process are optimized” (Bernhardt et al., 2017). None of the key N-transformation reactions are sustained for the entirety of each simulation due to limited substrate availability and/or unsuitable abiotic conditions, usually related to electron acceptor availability or oxygen levels; i.e., limited and oxic waters prevent consistently high DN and DNRA rates, while limited and limited dissolved oxygen prevent consistently high NI rates. In watersheds with excess nutrients, such as those containing agricultural catchments, riparian hollows could act as permanent control points, within which there is a “continuous delivery of reactants and nearly constant appropriate environmental conditions all for sustained high rates of biogeochemical activity relative to the surrounding landscape,” due to a sustained excess of constantly promoting DN and/or DNRA (Bernhardt et al., 2017). This study shows that transient hydrologic conditions in some watersheds, however, can prevent riparian hollows from functioning as permanent control points. This conclusion is important when considering the behavior of riparian hollows in an eastern U.S. catchment measured by Duncan et al., who found that >99% of all surface DN occurs within riparian hollows (Duncan et al., 2013). Under transient hydrologic conditions, DN within riparian hollows may not be sustained, and since these are essentially the only features promoting DN within the watershed studied by Duncan et al., the overall DN potential of the watershed could dramatically decrease under limited substrate conditions or unsuitable abiotic conditions, as shown in our simulations.
Importance of Dissimilatory Nitrate Reduction to Ammonium
Our results show that DNRA can be an important pathway for reduction. In our simulations, we found DNRA accounted for 25% of reduction during monsoon/snow periods and was most sensitive to long dry conditions. At our site, the primary DNRA pathway was fermentative, since sulfide concentrations were not high enough to induce the autotrophic pathway. The ratio of reduced by DNRA to that of DN for our study falls within previously documented ranges, which are presented for context in Table 4. The presence of this alternative pathway is significant because DNRA reduces to a reactive and biologically available form of N, (aq), as opposed to DN, which reduces to relatively inert and biologically unavailable N2(g). This conservation of biologically available N can have significant impacts on the overall N mass balance by promoting greater NI rates, enhancing the net primary productivity by providing a sustained source of N for primary producers (Marchant et al., 2014; Domangue and Mortazavi, 2018). DNRA is not commonly accounted for in reaction networks of model-based studies, including studies analyzing nitrogen mass balances of systems. Our study and previous studies show that DNRA should, at a minimum, be considered as part of the reaction network based on, but not limited to, C:N ratios, electron-acceptor abundance, and sulfide concentrations in the system (Giblin et al., 2013; Marchant et al., 2014). We suggest inclusion of DNRA could assist in developing model-based studies that are more accurate and more widely applicable.
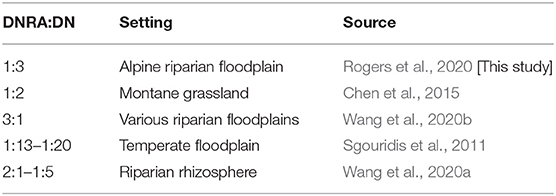
Table 4. Relative contribution of DNRA and DN to total reduction under different settings.
Recent advances in genome-resolved reactive transport modeling make it possible to better quantify the role of and controls on DNRA. Analyzing metagenomic samples can reveal the presence or absence of DNRA-related organisms and can indicate whether the pathways comprising DNRA are fully, partially, or not represented in a sample (Arkin et al., 2018; Carnevali et al., 2020; Shaffer et al., 2020). Further metabolomic modeling and flux balance analysis can help quantify DNRA kinetics relative to DN and NI kinetics under various conditions, such as different growth media, limited substrates, or the presence of inhibiting species (Kleerebezem and van Loosdrecht, 2010; Arkin et al., 2018; Rawls et al., 2019; Song et al., 2020). Integrating such metagenomic and metabolomic data into reactive transport models is an important next step in both conceptualizing and quantifying the key controls on reach- and watershed-scale N balances, and we suggest future studies will need to explore this frontier to accurately develop relevant reaction networks.
Conclusion
In this study, we used numerical modeling informed by an array of in situ datasets to quantify the N-cycling kinetics of riparian hollows under transient hydrologic conditions, which included transient surface flux from snowmelt, bankfull overflow, groundwater upwelling, and rainfall. From this study, we concluded that riparian hollows behave as one of the major ecosystem control points within riparian corridors through their primary function as sinks. We observed that periods of groundwater upwelling are a significant inhibitor of N-transformation within riparian hollows, while rainfall events are key activators of the N-retaining function of riparian hollows. Given these observed hydrologic controls, we expect that the -sink capacity of riparian hollows will increase in magnitude with future climatic perturbations, such as shorter snowmelt seasons and more frequent rainfall events, within mountainous headwater catchments, further limiting watershed inorganic N exports. We also highlighted the importance of DNRA in the N mass balance of this system, and we encourage future model-based studies to consider this reaction as potentially integral to the N cycle within their system. This study elucidates the significance of riparian hollows as small-scale controls on reach- and watershed-scale N mass balances, and it further emphasizes the importance of using a multi-scale approach when considering aggregated watershed functions.
Data Availability Statement
All data associated with the modeling results of this article are available for free and public use at: https://data.ess-dive.lbl.gov/view/, doi: 10.15485/1734795 (Rogers et al., 2020).
Author Contributions
DR, MN, DD, CS, NB, PN, MC, MB, EB, BA, and SH developed the conceptual framework for the study. MN, JR, BF, KW, BD, and PF performed all field work. DR, MN, NB, EB, DD, and PN developed the reaction network and geochemical boundary conditions. DR performed all numerical modeling, data analysis, and developed the manuscript for the study. All authors contributed to revising the manuscript.
Funding
This material is based upon work supported as part of the Watershed Function Scientific Focus Area funded by the U.S. Department of Energy, Office of Science, Office of Biological, and Environmental Research under Award Number DE-AC02-05CH11231.
Conflict of Interest
The authors declare that the research was conducted in the absence of any commercial or financial relationships that could be construed as a potential conflict of interest.
The handling editor declared a past co-authorship with one of the authors CS.
Acknowledgments
The authors thank Danyang Su for useful software suggestions and Sergi Molins for helpful discussions on the scope of our simulations. The authors would also like to thank the three reviewers for helping to improve the clarity and applicability of this manuscript.
Supplementary Material
The Supplementary Material for this article can be found online at: https://www.frontiersin.org/articles/10.3389/frwa.2021.590314/full#supplementary-material
References
Adam, J. C., Hamlet, A. F., and Lettenmaier, D. P. (2009). Implications of global climate change for snowmelt hydrology in the twenty-first century. Hydrol. Process 23, 962–972. doi: 10.1002/hyp.7201
Appelo, C. A. J., and Postma, D. (2005). “Nitrate reduction,” in Geochemistry, Groundwater, and Pollution, 2nd Edn (Leiden: A. A. Balkema Publishers), 458–488. doi: 10.1201/9781439833544
Appling, A. P., Bernhardt, E. S., and Stanford, J. A. (2014). Floodplain biogeochemical mosaics: a multidimensional view of alluvial soils. J. Geophys. Res. Biogeosci. 119, 1538–1553. doi: 10.1002/2013JG002543
Arkin, A. P., Cottingham, R. W., Henry, C. S., Harris, N. L., Stevens, R. L., Maslov, S., et al. (2018). KBase: the united states department of energy systems biology knowledgebase. Nat. Biotechnol. 36, 566–569. doi: 10.1038/nbt.4163
Arora, B., Spycher, N. F., Steefel, C. I., Molins, S., Bill, M., Conrad, M. E., et al. (2016). Influence of hydrological, biogeochemical and temperature transients on subsurface carbon fluxes in a flood plain environment. Biogeochemistry 127, 367–396. doi: 10.1007/s10533-016-0186-8
Barnhart, T. B., Molotch, N. P., Livneh, B., Harpold, A. A., Knowles, J. F., and Schneider, D. (2016). Snowmelt rate dictates streamflow: snowmelt rate dictates streamflow. Geophys. Res. Lett. 43, 8006–8016. doi: 10.1002/2016GL069690
Bernard-Jannin, L., Sun, X., Teissier, S., Sauvage, S., and Sánchez-Pérez, J.-M. (2017). Spatio-temporal analysis of factors controlling nitrate dynamics and potential denitrification hot spots and hot moments in groundwater of an alluvial floodplain. Ecol. Eng. 103, 372–384. doi: 10.1016/j.ecoleng.2015.12.031
Bernhardt, E. S., Blaszczak, J. R., Ficken, C. D., Fork, M. L., Kaiser, K. E., and Seybold, E. C. (2017). Control points in ecosystems: moving beyond the hot spot hot moment concept. Ecosystems 20, 665–682. doi: 10.1007/s10021-016-0103-y
Blankinship, J. C., Meadows, M. W., Lucas, R. G., and Hart, S. C. (2014). Snowmelt timing alters shallow but not deep soil moisture in the Sierra Nevada. Water Resour. Res. 50, 1448–1456. doi: 10.1002/2013WR014541
Carnevali, P. B. M., Lavy, A., Thomas, A. D., Crits-Christoph, A., Diamond, S., Meéheust, R., et al. (2020). Meanders as a scaling motif for understanding of floodplain soil microbiome and biogeochemical potential at the watershed scale. bioRxiv. doi: 10.1101/2020.05.14.086363
Carroll, R., Bearup, L. A., Brown, W., Dong, W., Bill, M., and Willlams, K. H. (2018). Factors controlling seasonal groundwater and solute flux from snow-dominated basins. Hydrol. Process 32, 2187–2202. doi: 10.1002/hyp.13151
Carroll, R., and Williams, K. H. (2019). Discharge data collected within the East River for the Lawrence Berkeley National Laboratory Watershed Function Science Focus Area (water years 2015-2018). Environ. Syst. Sci. Data Infrastr. Virt. Ecosyst. Watershed Funct. SFA. doi: 10.21952/WTR/1495380
Castaldelli, G., Vincenzi, F., Fano, E. A., and Soana, E. (2020). In search for the missing nitrogen: closing the budget to assess the role of denitrification in agricultural watersheds. Appl. Sci. 10:2136. doi: 10.3390/app10062136
Chen, Z., Wang, C., Gschwendtner, S., Willibald, G., Unteregelsbacher, S., Lu, H., et al. (2015). Relationships between denitrification gene expression, dissimilatory nitrate reduction to ammonium and nitrous oxide and dinitrogen production in montane grassland soils. Soil Biol. Biochem. 87, 67–77. doi: 10.1016/j.soilbio.2015.03.030
Clark, M., and Pitlick, J. (2005). Seasonal cycle shifts in hydroclimatology over the western united states. J. Clim. 18, 372–384. doi: 10.1175/JCLI-3272.1
Clow, D. W. (2010). Changes in the timing of snowmelt and streamflow in colorado: a response to recent warming. J. Clim. 23, 2293–2306. doi: 10.1175/2009JCLI2951.1
Dafflon, B., Malenda, H., and Dwivedi, D. (2020). Groundwater level elevation and temperature across Meander C at the Lower Montane in the East River Watershed, Colorado. Environ. Syst. Sci. Data Infrastr. Virt. Ecosyst. Watershed Funct. SFA. doi: 10.15485/1647041
Domangue, R. J., and Mortazavi, B. (2018). Nitrate reduction pathways in the presence of excess nitrogen in a shallow eutrophic estuary. Environ. Pollut. 238, 599–606. doi: 10.1016/j.envpol.2018.03.033
Dudley, R. W., Hodgkins, G. A., McHale, M. R., Kolian, M. J., and Renard, B. (2017). Trends in snowmelt-related streamflow timing in the conterminous United States. J. Hydrol. 547, 208–221. doi: 10.1016/j.jhydrol.2017.01.051
Duncan, J. M., Band, L. E., Groffman, P. M., and Bernhardt, E. S. (2015). Mechanisms driving the seasonality of catchment scale nitrate export: evidence for riparian ecohydrologic controls: seasonality of catchment nitrate export. Water Resour. Res. 51, 3982–3997. doi: 10.1002/2015WR016937
Duncan, J. M., Groffman, P. M., and Band, L. E. (2013). Towards closing the watershed nitrogen budget: spatial and temporal scaling of denitrification: scaling denitrification. J. Geophys. Res. Biogeosci. 118, 1105–1119. doi: 10.1002/jgrg.20090
Dwivedi, D., Arora, B., Steefel, C. I., Dafflon, B., and Versteeg, R. (2018a). Hot spots and hot moments of nitrogen in a riparian corridor. Water Resour. Res. 54, 205–222. doi: 10.1002/2017WR022346
Dwivedi, D., Steefel, C. I., Arora, B., Newcomer, M., Moulton, J. D., Dafflon, B., et al. (2018b). Geochemical exports to river from the intrameander hyporheic zone under transient hydrologic conditions: east river mountainous watershed, Colorado. Water Resour. Res. 54, 8456–8477. doi: 10.1029/2018WR023377
Falco, N., Wainwright, H., Dafflon, B., Leger, E., Peterson, J., Steltzer, H., et al. (2019). Remote sensing and geophysical characterization of a floodplain-hillslope system in the East River Watershed, Colorado. Environ. Syst. Sci. Data Infrastr. Virt. Ecosyst. Watershed Funct. SFA. doi: 10.21952/WTR/1490867
Fassnacht, S., Venable, N., McGrath, D., and Patterson, G. (2018). Sub-seasonal snowpack trends in the rocky mountain national park area, Colorado, USA. Water 10:562. doi: 10.3390/w10050562
Faybishenko, B. (2020). Unsaturated and saturated hydraulic parameters of soils at the east River Watershed, Colorado calculated using the pedotransfer function method. Environ. Syst. Sci. Data Infrastr. Virt. Ecosyst. Watershed Funct. SFA. doi: 10.15485/1734577
Fox, P., Bill, M., Heckman, K., Conrad, M. E., Anderson, C., Keiluweit, M., et al. (2019). Geochemical characterization of floodplain sediments from Meander C and O in the East River Watershed, CO, USA. Environ. Syst. Sci. Data Infrastr. Virt. Ecosyst. Watershed Funct. SFA. doi: 10.21952/WTR/1572186
Frei, S., Knorr, K. H., Peiffer, S., and Fleckenstein, J. H. (2012). Surface micro-topography causes hot spots of biogeochemical activity in wetland systems: a virtual modeling experiment. J. Geophys. Res. Biogeosci. 117:G00N12. doi: 10.1029/2012JG002012
Fritze, H., Stewart, I. T., and Pebesma, E. (2011). Shifts in Western North American snowmelt runoff regimes for the recent warm decades. J. Hydrometeorol. 12, 989–1006. doi: 10.1175/2011JHM1360.1
Geuzaine, C., and Remacle, J. F. (2009). Gmsh: a three-dimensional finite element mesh generator with built-in pre- and post-processing facilities. Int. J. Num Methods Eng. 79, 1309–1331. doi: 10.1002/nme.2579
Giblin, A., Tobias, C., Song, B., Weston, N., Banta, G., and Rivera-Monroy, V. (2013). The importance of dissimilatory nitrate reduction to ammonium (DNRA) in the nitrogen cycle of coastal ecosystems. Oceanography 26, 124–131. doi: 10.5670/oceanog.2013.54
Harpold, A. A., and Molotch, N. P. (2015). Sensitivity of soil water availability to changing snowmelt timing in the western U.S. Geophys. Res. Lett. 42, 8011–8020. doi: 10.1002/2015GL065855
Hettinger, R. D., and Kirschbaum, M. A. (2002). Stratigraphy of the Upper Cretaceous Mancos Shale (Upper Part) and Mesaverde Group in the Southern Part of the Uinta and Piceance Basins. Reston, VA: U.S. Department of the Interior, U.S. Geological Survey.
Hubbard, S. S., Williams, K. H., Agarwal, D., Banfield, J., Beller, H., Bouskill, N., et al. (2018). The east river, colorado, watershed: a mountainous community testbed for improving predictive understanding of multiscale hydrological-biogeochemical dynamics. Vadose Zone J. 17:180061. doi: 10.2136/vzj2018.03.0061
Kleerebezem, R., and van Loosdrecht, M. C. M. (2010). A generalized method for thermodynamic state analysis of environmental systems. Crit. Rev. Environ. Sci. Technol. 40, 1–54. doi: 10.1080/10643380802000974
Knowles, N., Dettinger, M. D., and Cayan, D. R. (2006). Trends in snowfall versus rainfall in the western united states. J. Clim. 19, 4545–4559. doi: 10.1175/JCLI3850.1
Kuypers, M. M. M., Marchant, H. K., and Kartal, B. (2018). The microbial nitrogen-cycling network. Nat. Rev. Microbiol. 16, 263–276. doi: 10.1038/nrmicro.2018.9
Likos, W. J., Lu, N., and Godt, J. W. (2014). Hysteresis and uncertainty in soil water-retention curve parameters. J. Geotech. Geoenviron. Eng. 140:04013050. doi: 10.1061/(ASCE)GT.1943-5606.0001071
Lipnikov, K., Svyatskiy, D., and Vassilevski, Y. (2010). A monotone finite volume method for advection–diffusion equations on unstructured polygonal meshes. J. Comput. Phys. 229, 4017–4032. doi: 10.1016/j.jcp.2010.01.035
Lucas, R. W., Sponseller, R. A., Gundale, M. J., Stendahl, J., Fridman, J., Högberg, P., et al. (2016). Long-term declines in stream and river inorganic nitrogen (N) export correspond to forest change. Ecol. Appl. 26, 545–556. doi: 10.1890/14-2413
Lutz, S. R., Trauth, N., Musolff, A., Van Breukelen, B. M., Knöller, K., and Fleckenstein, J. H. (2020). How important is denitrification in riparian zones? Combining end-member mixing and isotope modeling to quantify nitrate removal from riparian groundwater. Water Resourc. Res. 56:e2019WR025528. doi: 10.1029/2019WR025528
Marchant, H. K., Lavik, G., Holtappels, M., and Kuypers, M. M. M. (2014). The fate of nitrate in intertidal permeable sediments. PLoS ONE 9:e104517. doi: 10.1371/journal.pone.0104517
Maurer, G. E., and Bowling, D. R. (2014). Seasonal snowpack characteristics influence soil temperature and water content at multiple scales in interior western U.S. mountain ecosystems. Water Resourc. Res. 50, 5216–5234. doi: 10.1002/2013WR014452
Mayer, K. U. (1999). A Numerical Model for Multicomponent Reactive Transport in Variably Saturated Porous Media. (Dissertation), Waterloo, ON: University of Waterloo.
Mayer, K. U., Benner, S. G., and Blowes, D. W. (1999). The reactive transport model MIN3P: application to acid mine drainage generation and treatment - nickel rim mine site, Sudbury, Ontario. Min. Environ. 1, 145–154.
Mayer, K. U., Frind, E. O., and Blowes, D. W. (2002). Multicomponent reactive transport modeling in variably saturated porous media using a generalized formulation for kinetically controlled reactions. Water Resour. Res. 38, 13–1–13-21. doi: 10.1029/2001WR000862
Mayer, K. U., and MacQuarrie, K. T. B. (2010). Solution of the MoMaS reactive transport benchmark with MIN3P—model formulation and simulation results. Comput. Geosci. 14, 405–419. doi: 10.1007/s10596-009-9158-6
McCabe, G. J., and Clark, M. P. (2005). Trends and variability in snowmelt runoff in the western united states. J. Hydrometeorol. 6, 476–482. doi: 10.1175/JHM428.1
Molins, S., Greskowiak, J., Wanner, C., and Mayer, K. U. (2015). A benchmark for microbially mediated chromium reduction under denitrifying conditions in a biostimulation column experiment. Comput. Geosci. 19, 479–496. doi: 10.1007/s10596-014-9432-0
Nakshatrala, K. B., Mudunuru, M. K., and Valocchi, A. J. (2013). A numerical framework for diffusion-controlled bimolecular-reactive systems to enforce maximum principles and non-negative constraint. J. Comput. Phys. 253, 278–307. doi: 10.1016/j.jcp.2013.07.010
Newcomer, M. E., Bouskill, N., Maier, U., Dwivedi, D., Steefel, C. I., Williams, K. H., et al. (2019). Advancing Understanding, Modeling, and Scaling of Ecological Control Points in Mountainous River Corridors (Invited). Presented at the American Geophysical Union Fall Meeting 2019, B42A-07. Retrieved from https://agu-do03.confex.com/agu/fm19/meetingapp.cgi/Paper/499462
Newcomer, M. E., Bouskill, N. J., Wainwright, H., Maavara, T., Arora, B., Siirila-Woodburn, E. R., et al. (2020). Hysteresis patterns of watershed nitrogen retention and loss over the past 50 years in United States Hydrological Basins. (Preprint on ESSOAr). Global Biogeochem. Cycles. doi: 10.1002/essoar.10504643.1
Newcomer, M. E., Hubbard, S. S., Fleckenstein, J. H., Maier, U., Schmidt, C., Thullner, M., et al. (2018). Influence of hydrological perturbations and riverbed sediment characteristics on hyporheic zone respiration of CO2 and N2. J. Geophys. Res. Biogeosci. 123, 902–922. doi: 10.1002/2017JG004090
Newcomer, M. E., Raberg, J., Dwivedi, D., Fox, P., Nico, P., Dong, W., and Steefel, C. (2020). Hyporheic, floodplain, and surface water (on floodplain and river) geochemical datasets, and shapefiles on meander C at the East River, Colorado [Data set]. Environ. Syst. Sci. Data Infrastr. Virt. Ecosyst. Watershed Funct. SFA. doi: 10.15485/1647038
Newcomer, M. E., and Rogers, D. B. (2020). Gap-filled meteorological data (2011-2020) and modeled potential evapotranspiration data from the KCOMTCRE2 WeatherUnderground weather station, from the East River Watershed, Colorado [Data set]. Environ. Syst. Sci. Data Infrastr. Virt. Ecosyst. Watershed Funct. SFA. doi: 10.15485/1734790
Pederson, G. T., Gray, S. T., Ault, T., Marsh, W., Fagre, D. B., Bunn, A. G., et al. (2011). Climatic controls on the snowmelt hydrology of the northern rocky mountains. J. Clim. 24, 1666–1687. doi: 10.1175/2010JCLI3729.1
Pellerin, B. A., Saraceno, J. F., Shanley, J. B., Sebestyen, S. D., Aiken, G. R., Wollheim, W. M., et al. (2012). Taking the pulse of snowmelt: in situ sensors reveal seasonal, event and diurnal patterns of nitrate and dissolved organic matter variability in an upland forest stream. Biogeochemistry 108, 183–198. doi: 10.1007/s10533-011-9589-8
Peters, A., Durner, W., and Wessolek, G. (2011). Consistent parameter constraints for soil hydraulic functions. Adv. Water Resour. 34, 1352–1365. doi: 10.1016/j.advwatres.2011.07.006
Pinay, G., Bernal, S., Abbott, B. W., Lupon, A., Marti, E., Sabater, F., et al. (2018). Riparian corridors: a new conceptual framework for assessing nitrogen buffering across biomes. Front. Environ. Sci. 6:47. doi: 10.3389/fenvs.2018.00047
R Core Team. (2020). R: A Language and Environment for Statistical Computing (Version 3.6.2). Vienna: R Core Team.Retrieved from https://www.R-project.org
Rassam, D., Šimunek, J., Mallants, D., and van Genuchten, M. (2018). The HYDRUS-1D Software Package for Simulating the Movement of Water, Heat, and Multiple Solutes in Variably Saturated Media: Tutorial, Version 1.00. CSIRO Land and Water.
Rawls, K. D., Dougherty, B. V., Blais, E. M., Stancliffe, E., Kolling, G. L., Vinnakota, K., et al. (2019). A simplified metabolic network reconstruction to promote understanding and development of flux balance analysis tools. Comput. Biol. Med. 105, 64–71. doi: 10.1016/j.compbiomed.2018.12.010
Reid, M. A., Reid, M. C., and Thoms, M. C. (2016). Ecological significance of hydrological connectivity for wetland plant communities on a dryland floodplain river, MacIntyre river, Australia. Aquat. Sci. 78, 139–158. doi: 10.1007/s00027-015-0414-7
Ridgley, J. L., Condon, S. M., and Hatch, J. R. (2013). Geology and Oil and Gas Assessment of the Mancos-Menefee Composite Total Petroleum System. Reston, VA: U.S. Department of the Interior, U.S. Geological Survey. 107.
Rogers, D. B., Newcomer, M. E., Raberg, J., Dwivedi, D., Steefel, C. I., Bouskill, N., et al. (2020). “Modeling the impact of riparian hollows on river corridor nitrogen exports,” in AGU Fall Meeting 2020. doi: 10.15485/1734795
Sgouridis, F., Heppell, C. M., Wharton, G., Lansdown, K., and Trimmer, M. (2011). Denitrification and dissimilatory nitrate reduction to ammonium (DNRA) in a temperate re-connected floodplain. Water Res. 45, 4909–4922. doi: 10.1016/j.watres.2011.06.037
Shaffer, M., Borton, M. A., McGivern, B. B., Zayed, A. A., La Rosa, S. L., Solden, L. M., et al. (2020). DRAM for distilling microbial metabolism to automate the curation of microbiome function. Microbiology. 48, 8883–8900. doi: 10.1101/2020.06.29.177501
Song, H.-S., Stegen, J. C., Graham, E. B., Lee, J.-Y., Garayburu-Caruso, V. A., Nelson, W. C., et al. (2020). Representing organic matter thermodynamics in biogeochemical reactions via substrate-explicit modeling. Syst. Biol. 11:531756. doi: 10.1101/2020.02.27.968669
Sorenson, P., Brodie, E., Beller, H., Wang, S., Bill, M., and Bouskill, N. J. (2019). Soil nitrogen, water content, microbial biomass, and archaeal, bacterial and fungal communities from the East River Watershed, Colorado collected in 2016-2017. Environ. Syst. Sci. Data Infrastr. Virt. Ecosyst. Watershed Funct. SFA. doi: 10.15485/1577267
Stewart, I. T. (2009). Changes in snowpack and snowmelt runoff for key mountain regions. Hydrol. Process 23, 78–94. doi: 10.1002/hyp.7128
Su, D., Mayer, K. U., and MacQuarrie, K. T. (2019). MIN3P-HPC: a high performance unstructured grid code for subsurface flow and reactive transport simulation. Comput. Geosci. doi: 10.1007/s11004-020-09898-7
Suecker, J. K., Ryan, J. N., Kendall, C., and Jarrett, R. D. (2000). Determination of hydrologic pathways during snowmelt for alpine/subalpine basins, rocky mountain national park, Colorado. Water Resour. Res. 36, 63–75. doi: 10.1029/1999WR900296
The Weather Company. (2020). Gold Link - KCOMTCRE2. Retrieved from https://www.wunderground.com/dashboard/pws/KCOMTCRE2
Van Meter, K. J., Basu, N. B., and Van Cappellen, P. (2017). Two centuries of nitrogen dynamics: Legacy sources and sinks in the mississippi and susquehanna river basins: two centuries of nitrogen dynamics. Glob. Biogeochem. Cycles 31, 2–23. doi: 10.1002/2016GB005498
Wang, S., Pi, Y., Jiang, Y., Pan, H., Wang, X., Wang, X., et al. (2020a). Nitrate reduction in the reed rhizosphere of a riparian zone: from functional genes to activity and contribution. Environ. Res. 180:108867. doi: 10.1016/j.envres.2019.108867
Wang, S., Pi, Y., Song, Y., Jiang, Y., Zhou, L., Liu, W., et al. (2020b). Hotspot of dissimilatory nitrate reduction to ammonium (DNRA) process in freshwater sediments of riparian zones. Water Res. 173:115539. doi: 10.1016/j.watres.2020.115539
Wolff, R. G. (1982). Physical Properties of Rocks – Porosity, Permeability, Distribution Coefficients, and Dispersivity (Open-File Report). Reston, VA: U.S. Department of Interior Geological Survey, 123.
Wu, Y. (2017). Soil Moisture Data; YXW_FP_1, YXW_FP_2, YXW_FP_3. Watershed Function SFA. Retrieved from https://wfsfa-data.lbl.gov/#
Xie, M., Mayer, K. U., Claret, F., Alt-Epping, P., Jacques, D., Steefel, C., et al. (2015). Implementation and evaluation of permeability-porosity and tortuosity-porosity relationships linked to mineral dissolution-precipitation. Computat. Geosci. 19, 655–671. doi: 10.1007/s10596-014-9458-3
Yanai, R. D., Vadeboncoeur, M. A., Hamburg, S. P., Arthur, M. A., Fuss, C. B., Groffman, P. M., et al. (2013). From missing source to missing sink: long-term changes in the nitrogen budget of a northern hardwood forest. Environ. Sci. Technol. 47, 11440–11448. doi: 10.1021/es4025723
Yano, Y., Qubain, C., Holyman, Z., Jencso, K., and Hu, J. (2019). Snowpack influences spatial and temporal soil nitrogen dynamics in a western U.S. montane forested watershed. Ecosphere 10:e02794. doi: 10.1002/ecs2.2794
Yin, G., Hou, L., Liu, M., Li, X., Zheng, Y., Gao, J., et al. (2017). DNRA in intertidal sediments of the yangtze estuary: DNRA in sediments of yangtze estuary. J. Geophys. Res. Biogeosci. 122, 1988–1998. doi: 10.1002/2017JG003766
Keywords: riparian, nitrogen, DNRA, reactive transport, snowmelt, microtopography
Citation: Rogers DB, Newcomer ME, Raberg JH, Dwivedi D, Steefel C, Bouskill N, Nico P, Faybishenko B, Fox P, Conrad M, Bill M, Brodie E, Arora B, Dafflon B, Williams KH and Hubbard SS (2021) Modeling the Impact of Riparian Hollows on River Corridor Nitrogen Exports. Front. Water 3:590314. doi: 10.3389/frwa.2021.590314
Received: 01 August 2020; Accepted: 20 January 2021;
Published: 23 February 2021.
Edited by:
Jon Chorover, University of Arizona, United StatesReviewed by:
Kalyana Babu Nakshatrala, University of Houston, United StatesThomas Meixner, University of Arizona, United States
Amalia Handler, United States Environmental Protection Agency (EPA), United States
Copyright © 2021 Rogers, Newcomer, Raberg, Dwivedi, Steefel, Bouskill, Nico, Faybishenko, Fox, Conrad, Bill, Brodie, Arora, Dafflon, Williams and Hubbard. This is an open-access article distributed under the terms of the Creative Commons Attribution License (CC BY). The use, distribution or reproduction in other forums is permitted, provided the original author(s) and the copyright owner(s) are credited and that the original publication in this journal is cited, in accordance with accepted academic practice. No use, distribution or reproduction is permitted which does not comply with these terms.
*Correspondence: D. Brian Rogers, cm9nZXJzZGJAc3RhbmZvcmQuZWR1