 Matthew H. Kaufman1*
 John G. Warden2
 M. Bayani Cardenas3
 James C. Stegen1
 Emily B. Graham1,4Joseph Brown1
- 1Pacific Northwest National Laboratory, Earth and Biological Sciences Division, Richland, WA, United States
- 2U.S. Geological Survey, San Diego, CA, United States
- 3Geological Sciences, The University of Texas at Austin, Austin, TX, United States
- 4School of Biological Sciences, Washington State University, Richland, WA, United States
Riverbeds are hotspots for microbially-mediated reactions that exhibit pronounced variability in space and time. It is challenging to resolve biogeochemical mechanisms in natural riverbeds, as uncontrolled settings complicate data collection and interpretation. To overcome these challenges, laboratory flumes are often used as proxies for natural riverbed systems. Flumes capture spatiotemporal variability and thus allow for controlled investigations of riverbed biogeochemistry. These investigations implicitly rely on the assumption that the flume microbiome is similar to the microbiome of natural riverbeds. However, this assumption has not been tested and it is unknown how the microbiome of a flume compares to natural aquatic settings, including riverbeds. To evaluate the fundamental assumption that a flume hosts a microbiome similar to natural riverbed systems, we used 16s rRNA gene sequencing and publicly available data to compare the sediment microbiome of a single large laboratory flume to a wide variety of natural ecosystems including lake and marine sediments, river, lake, hyporheic, soil, and marine water, and bank and wetland soils. Richness and Shannon diversity metrics, analyses of variance, Bray-Curtis dissimilarity, and analysis of the common microbiomes between flume and river sediment all indicated that the flume microbiome more closely resembled natural riverbed sediments than other ecosystems, supporting the use of flume experiments for investigating natural microbially-mediated biogeochemical processes in riverbeds.
Introduction
River corridors are important to global nutrient cycles (Battin et al., 2008; Gomez-Velez and Harvey, 2014; Harvey and Gooseff, 2015; Stegen et al., 2016). In particular, riverbed sediments can be the driving biogeochemical reactor of river corridors (Gooseff, 2010; Gomez-Velez et al., 2015). The riverbed lies at the interface between groundwater and surface water and is thus subject to steep physical and chemical gradients. It is also well-suited to microbial growth, providing many of the ecosystem services traditionally associated with river corridors (Fischer et al., 2005). The riverbed is a challenging domain to study in the field, because biogeochemical gradients vary in space and time. To enable some level of control, riverbed processes are often studied using laboratory flumes. However, while biogeochemical studies in flumes often revolve around microbially-mediated processes, the assumption that a flume microbiome is representative of natural riverbed microbiomes remains untested.
Many of the hydrologic and biogeochemical processes within the riverbed are challenging to observe and quantify in the field. Field studies are frequently impacted by unexpected weather events and respond to the many uncontrolled variables of natural systems. As such, batch reactors (which contain no spatial information) and flow-through cells (which produce one-dimensional flow systems) have long been used to explore processes in riverbed sediments (Findlay et al., 1993; Harvey and Fuller, 1998; Boncagni et al., 2009; Liu Y. et al., 2017). Although these systems are useful, they do not reproduce the interactions between open channel and riverbed hydraulics that drive complex three-dimensional spatial gradients in natural systems. It is well-known that in the field, varying physical and chemical conditions in the riverbed lead to spatial variations in the communities of microbes present (Graham et al., 2016, 2017; Liu C. et al., 2017; Stegen et al., 2018). Laboratory flume studies have shown two-dimensional spatial gradients in chemistry that imply similar variation in microbiomes (Kessler et al., 2014; Azizian et al., 2015; Kaufman et al., 2017); however, a specific study of microbiome variation in space, driven at least in part by oxygen gradients in laboratory flumes has not been carried out to date. Typically, oxygen and nutrient consumption in flume studies is ascribed to microbiomes assumed to reflect natural systems (Kessler et al., 2012; Kaufman et al., 2017). It is evident that flumes fill a key gap between batch, flow-through reactor, and field, but to have confidence that the biogeochemistry observed in flumes is relevant to field conditions, the associated microbiomes should be relatively similar to those found in field systems. If there are major differences, the legitimacy of biogeochemical studies in laboratory flumes may be brought into question.
While the representativeness of flume microbiomes is commonly assumed, to our knowledge there has been no quantitative evidence to support this assumption. To explore the suitability of laboratory flumes for research into microbially-mediated riverbed biogeochemistry, we investigate the microbiomes residing within one laboratory flume through 16S rRNA gene sequencing of 16 flume sediment samples. We further compare this flume microbiome to publicly available 16S gene amplicon data from riverbed sediments and a variety of other natural settings. Natural systems display differentiation in microbiomes across redox gradients (Wetzel, 1993; Braker et al., 2001; DeAngelis et al., 2010). We hypothesize that the flume sediment microbiome will also show variation in space, driven by differences in dissolved oxygen. We further hypothesize that the flume sediment microbiome will be more similar to natural riverbed microbiomes than to microbiomes in other ecosystems.
Outcomes consistent with the hypotheses above will support the utility of flumes for biogeochemical studies. If our hypotheses are rejected, this will call into question the utility of flumes for studying riverbed biogeochemical function. Although our study is limited in scope and only considers a single flume, we contend that an evaluation of any flume microbiome is an essential (yet often overlooked) methodological component of flume-based hydrobiogeochemical studies.
Methods
Overview
The microbiome from a single large recirculating laboratory flume (Figure 1) was studied. The flume was equipped with a large planar optode for observing dissolved oxygen concentrations (Larsen et al., 2011). Sediment cores were removed from the sand bed, frozen, sectioned, and subjected to 16S rRNA gene sequencing. Downstream analysis evaluated how the communities varied based on the presence or absence of dissolved oxygen, and how the flume communities compared to natural microbiomes from rivers, lakes, wetlands, riparian soils, and marine environments.
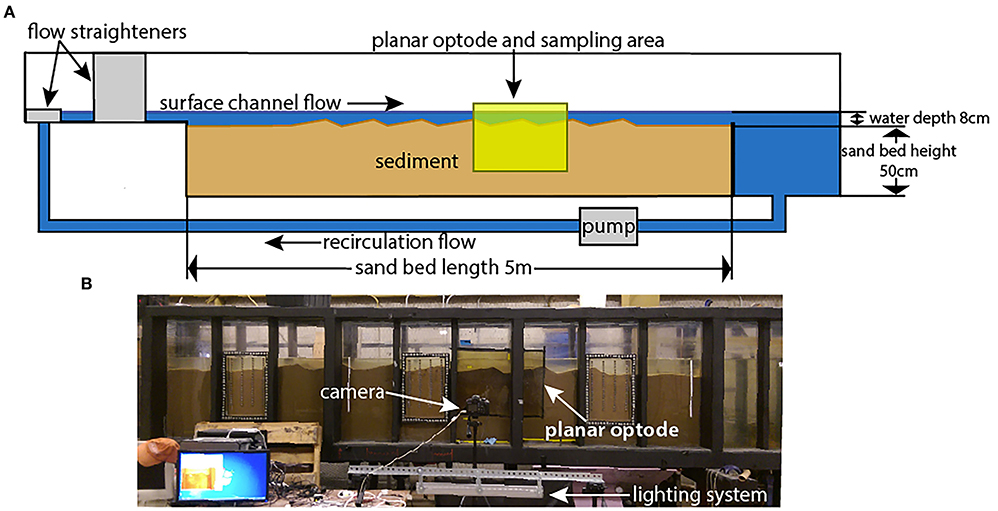
Figure 1. Experimental flume photos and diagram. (A) is a schematic diagram of the flume, showing the direction of flow, position of the planar optode, and position of the sand bed with dune bedforms. The samples were taken from the area covered by the planar optode. (B) is a photo of the operating section of the flume along with the planar optode and its attendant imagine and lighting systems. Figure is modified after Kaufman et al. (2017).
Flume Experiments
The recirculating laboratory flume used in these experiments is 8 m long, 0.3 m wide, and 1.3 m tall. The sediment area is 5 m long, 0.3 m wide, and 0.5 m deep (Figure 1). It is the same flume used by Sawyer et al. (2011), Cardenas et al. (2016), and Kaufman et al. (2017), among others, and is described in greater detail therein. Despite these previous studies, this study is the first to analyze the microbiome of the flume hyporheic zone.
The flume resides in a temperature-controlled building, with the water temperature remaining at ~17–19°C at all times. This constrained temperature range favors broadly mesophilic bacteria. The walls and bottom of the flume are covered by opaque, rigid insulating foam to prevent photosynthesis from occurring at depth, where it would not occur in a natural system, and to reduce temperature variation. The sediment used in the flume is fairly homogenous, washed and screened quartz sand with a median grainsize (D50) of 1.5 mm and only trace amounts of fines. Flumes are often filled with homogenous sediments in order to better estimate and/or control flowpaths. To provide a source of organic carbon, the sediment was seeded with finely crushed walnut shells at 0.05% by weight (Cao, 2014). This combination of a sand bed with or without a source of organic carbon in either particulate or dissolved form is common to flume studies (Sawyer et al., 2011; Cardenas et al., 2016; Kaufman et al., 2017). The sand bed was formed manually into 7 dune-shaped bed forms that are 40–45 cm long and 4 cm tall, with the lee face roughly 1/3 the length of the stoss face. The water contained in the flume was sourced from the Lower Colorado River near Hornsby Bend in Austin, Texas, USA, to mimic natural settings. The flume utilized an automatic top-off system to maintain the water level, using the same natural river water as a top-off source. Aside from these uses of natural river water, the flume was not inoculated with any particular microbial communities. The flume was last emptied, cleaned, and reset in February of 2016 (~11 months prior to sampling), and was left at a low channel velocity of 3.5 to 10.5 cm/s and otherwise largely undisturbed for that period of time.
Saturated sediment samples were collected for 16S rRNA gene sequencing. Samples were retrieved at multiple depths from two distinct cores in January of 2017. Concurrent planar optode imaging provided precise recording of the dissolved oxygen conditions along the length of each core (Figure 2). Planar optodes were constructed and operated according to Larsen et al. (2011) and Kaufman et al. (2017). The limit of detection was not characterized for this planar sensor; however, ratiometric optical dissolved oxygen sensors are capable of achieving detection limits of ~1% air saturation. To be conservative, any reading below 10% was reported as <10%.
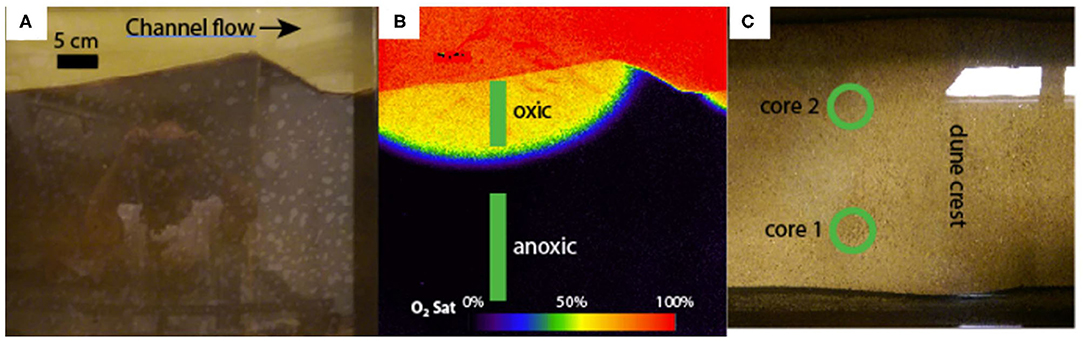
Figure 2. (A) is a true-color image of the fifth bedform from the left of the flume. (B) is a planar optode image of the same bedform, false-colored to show the dissolved oxygen saturation. The oxic and anoxic sampling zones are also shown in (B). (C) is a top-down view of the same bedform, with the two core locations indicated with green circles.
Sampling was conducted with a piston corer constructed from a clean 0.9 m (36 in) SinkFast bailer tube (Aqua Bailers, Knoxville, TN, USA) with the ends cut off, and a high density polyethylene piston with rubber o-rings (Supplementary Figure 2). The core tube was driven into the sediment to a depth of ~50 cm while the piston was concurrently withdrawn so that the piston remained at the sediment-water interface as the core tube descended into the sediment. The core tube was then rapidly retracted and capped, to limit disturbance of the captured sediment and water column. The entire corer was then placed in a cooler with dry ice and frozen. Following freezing, the core tube was cut into pieces and subsampled at different depths (Supplementary Table 1). Each sub-sample had the outside 2-3 mm shaved off to help reduce the impact of smearing (Supplementary Figure 2c). Each sub-sample was homogenized and transferred to several 15-ml sterile DNase/RNase-free centrifuge tubes and stored at −80°C for later analysis. All sample and sub-sample preparation was carried out using autoclave-sterilized and methanol washed tools on a table lined with autoclave-sterilized aluminum foil washed down with methanol.
As the goal of this study was to compare the flume microbiome to microbiomes from other locations, and not to attempt to determine what specific set of parameters leads to the observed differences, geochemical data was not collected during sampling. For context, geochemical data from the same flume, sediments, and water source but from an earlier sampling date, as well as publicly-available geochemical data from the source river around the time of sampling are provided in Supplementary Tables 2, 3, respectively.
Genomic Analysis
Genomic DNA was extracted from the soil samples using the PowerSoil® DNA Isolation Kit (http://www.mobio.com/) according to manufacturer's instructions. PCR amplification of the V4 region of the 16SrRNA gene was performed using the protocol developed by the Earth Microbiome Project (http://press.igsb.anl.gov/earthmicrobiome/emp-standard-protocols/16s/), and described by Caporaso et al. (2012), with the exception that the 12 base barcode sequence was included in the forward primer. Amplicons were sequenced on an Illumina MiSeq using the 500 cycle MiSeq Reagent Kit v2 (http://www.illumina.com/) according to manufacturer's instructions. All 16 samples produced viable data, providing a total of 793,113 reads. The number of reads per sample ranged from 34,726 to 70,003. Samples were rarefied to 10,025 per sample, which was the minimum across all of the analyzed studies.
Data Processing
In order to compare our flume samples to various other real-world samples, we collected seven publicly available datasets involving 16S sequence data from rivers, lakes, wetlands, riparian soils, and marine environments (Crump et al., 2012; Rösel et al., 2012; Xiong et al., 2012; Gibbons et al., 2014; Thompson et al., 2017). Each dataset included both sequence data and associated quality data in the form of.FASTQ files hosted by the European Nucleotide Archive (https://www.ebi.ac.uk) (EBI study IDs PRJEB14797, PRJEB20123, PRJEB14819, PRJEB14823, PRJEB15175, PRJEB15630, and PRJEB14902). In addition to those seven studies, two datasets from hyporheic zones and hydraulically connected microbiomes were also included (Graham et al., 2017; Hou et al., 2017). An overview of the sample collection methods and dissolved oxygen concentrations reported in these studies is presented in Supplementary Table 4
These 9 studies were analyzed together with the flume samples. A total of 4,409 samples were processed to derive operational taxonomic units (OTUs) indicating microbial phylogeny. Single- and paired-end reads were quality trimmed, trimmed of adapter content, and filtered of PhiX sequences using BBDuk of BBTools (https://jgi.doe.gov/data-and-tools/bbtools/). Paired-end sequences longer than 75 base pairs were merged using VSEARCH (Rognes et al., 2016), concatenated into a single FASTA file along with passing single-end sequences, and filtered based on an expected error rate of 1.0. Reads were dereplicated to remove singletons, clustered using the distance-based greedy method allowing 3% difference between clusters, and filtered of chimeric sequences using VSEARCH. Reference based chimera filtering was performed using SILVA v128 (Quast et al., 2013). BLAST (Camacho et al., 2009) was used to align OTU sequences to SILVA v128 provided by CREST (Lanzen et al., 2012). Only high-scoring pairs within 5% of the top scoring hit were used when calculating the lowest common ancestor (LCA) via the CREST LCA method. Counts were assigned to OTUs using the global alignment method of VSEARCH with a read identity of 97%. The Biom command-line tool (McDonald et al., 2012) was used to convert tabular count data into a biom table.
Data processing tasks were organized into a Snakemake (Koster and Rahmann, 2012) workflow with the help of the hundo package (Brown et al., 2018). Versioned executables were downloaded during runtime using Bioconda (Grüning et al., 2017).
Each constituent study contained samples from a number of biomes and environments, as classified by the various study authors. Biomes consisted of flume, river, hyporheic zone, lake, marine, wetland, bank, and soil. Environments consisted of sediment, water, microbial mat, and soil. Each unique combination of biome and environment was assigned a unique group ID across all studies, referred to as a biome/environment group. Because of the large total number of samples involved, and the highly variable number of samples from and within each study, a subset of the data was created for further analysis. First, any sample with fewer than 10,000 reads was discarded. Next, any single-study biome/environment group of fewer than 10 samples was discarded. Single-study biome/environment groups with >20 samples were randomly subset down to 20 samples. This yielded 406 samples from 9 studies across 8 biomes and 4 environments, providing 13 biome/environment groups containing from 1 to 5 studies in each. The final count of samples for analysis is provided in Table 1.
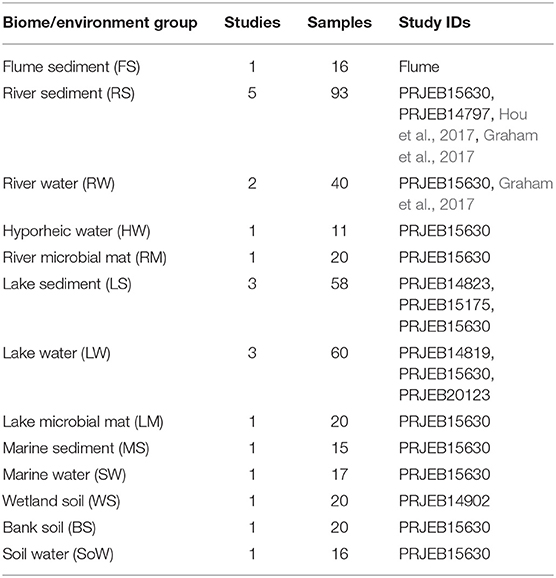
Table 1. Number of samples and studies representing the different environments selected in this study.
Sample collection methodology varied across studies and environments. The variation in sampling methods between environments is inevitable given the varying media being collected. Within the river sediment environment, there were also variations in sample collection methods. While the exact methods varied (piston corer, freeze core, grab sample, in-situ colonizable media), all sediment samples were collected from the shallow sediments (<1 m).
Data Analysis
Data analyses were carried out in R (R Core Team, 2017). Data output from the processing pipeline was in the form of BIOM files, which were read into R using the biomformat package (McMurdie, 2016). Much of the analysis, including ordination (NMDS) and permutational analysis of variance (PERMANOVA), as well as general data handling, was carried out using the R package Phyloseq (McMurdie and Holmes, 2013). Stress for all NMDS plots is between 0.09 and 0.17. For PERMANOVA analysis, groups of samples were randomly subset such that each analysis group contained the same number of samples. Shannon alpha diversity indices and richness were calculated using rarefied data (10025 counts per sample) with singletons removed.
For the common microbiome analysis, the R package Microbiome (Lahti and Sudarshan, 2017) was used. We chose a detection threshold of 0.01% of each sample, and a prevalence threshold of 75% of the sample set for an OTU to be included in the common microbiome for a given sample set.
Results and Discussion
Flume Microbiome
In the first phase of analysis, we examined only the flume 16S rRNA gene sequence data (no comparison across biomes/environments). The flume samples were dominated by the phylum Proteobacteria, which consisted of 33–59% of the total community in each sample. Other dominant phyla comprising up to 21% of the total community were Verrucomicrobia, Planctomycetes, Chloroflexi, Bacterioidetes, and Acidobacteria (Supplementary Figure 1). Within the flume samples, oxic and anoxic areas were dominated by the same taxa at the phylum, class, and order level; however, the relative abundance of these taxa generally varied between oxic and anoxic zone samples.
The 16S rRNA data analysis revealed differentiation of microbiome composition according to oxic and anoxic zones, consistent with our first hypothesis. PERMANOVA (Anderson, 2001) indicated that the presence of oxygen at >10% of saturation was a statistically significant predictor of the overall microbiome (p < 0.001 r2 = 0.53, Figure 3). The separation between oxic and anoxic zones was expected given that different microbial taxa perform best under different redox conditions in both soils and riverbed systems (Wetzel, 1993; Braker et al., 2001; DeAngelis et al., 2010). Comparing the OTUs common among the oxic samples with those common among the anoxic samples is challenging as each group has a large common microbiome (573 and 335 OTUs, respectively); however, if we focus on the 5 most abundant OTUs within the common microbiome for each group there are some commonalities and some differences. Common to both sets are Acidithiobacillales, an iron and sulfur oxidizing Gammaproteobacteria, and several different Xanthomonadales, phytopathogenic Gammaproteobacteria. The remaining most abundant OTUs in the oxic group are Desulfurellales, mostly sulfur reducing members of class Desulfurellia, and Nitrospira, which oxidizes nitrate. The remaining most abundant OTUs in the anoxic group are two OTUs of Rhodocyclaceae (a metabolically diverse family of Betaproteobacteria), and Rhizobiales, Alphaproteobacteria that range from nitrogen fixation to methanotrophy. The abundance of sulfur reducing bacteria in the oxic zone and iron/sulfur oxidizing bacteria in the anoxic zone is somewhat unexpected, though inferring metabolic function from taxonomy is challenging, and highlights the advantage of looking at differences in whole communities to differentiate between environments, rather than focusing on specific OTUs. Additionally, some visible indications of the reoxidation of formerly reduced iron at the sediment-water interface was observed in the flume (traces of brown precipitate in bedform troughs). The ability to distinguish oxic from anoxic zone samples based on microbial community structure is encouraging: laboratory flumes have long been known to reproduce riverbed redox gradients similar to those observed in nature. As expected, these redox conditions are a major driver of flume microbiome composition.
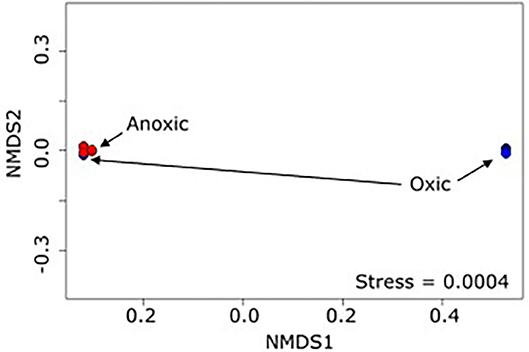
Figure 3. NMDS plot (Bray-Curtis dissimilarity) of flume samples show clustering of the samples into 2 distinct groups, mostly divided by presence of dissolved oxygen.
Flume Microbiome Compared to Natural Microbiomes
We next compare the flume microbiome to microbiomes from a selection of natural environments. While the primary focus is to compare the flume to natural riverbeds, the other environments provide context for these analyses. Comparing the flume microbiome to natural systems revealed patterns consistent with our second hypothesis, whereby flume microbiomes were generally more similar to riverbed microbiomes than they were to microbiomes from other natural settings (Figures 4A,B) both in terms of diversity and community composition. More specifically, while the microbiome diversity metrics [OTU richness and Shannon diversity (Whittaker, 1972)] for flume and other river sediment samples are significantly different from each other [Kruskal–Wallis p < 0.006 (Kruskal, 1952)], their distributions overlapped (Figures 4C,D). The distributions of flume microbiome diversity metrics showed variable levels of overlap with other natural systems (e.g., overlap with hyporheic zone water and divergence from lake water) (Figures 4A,B).
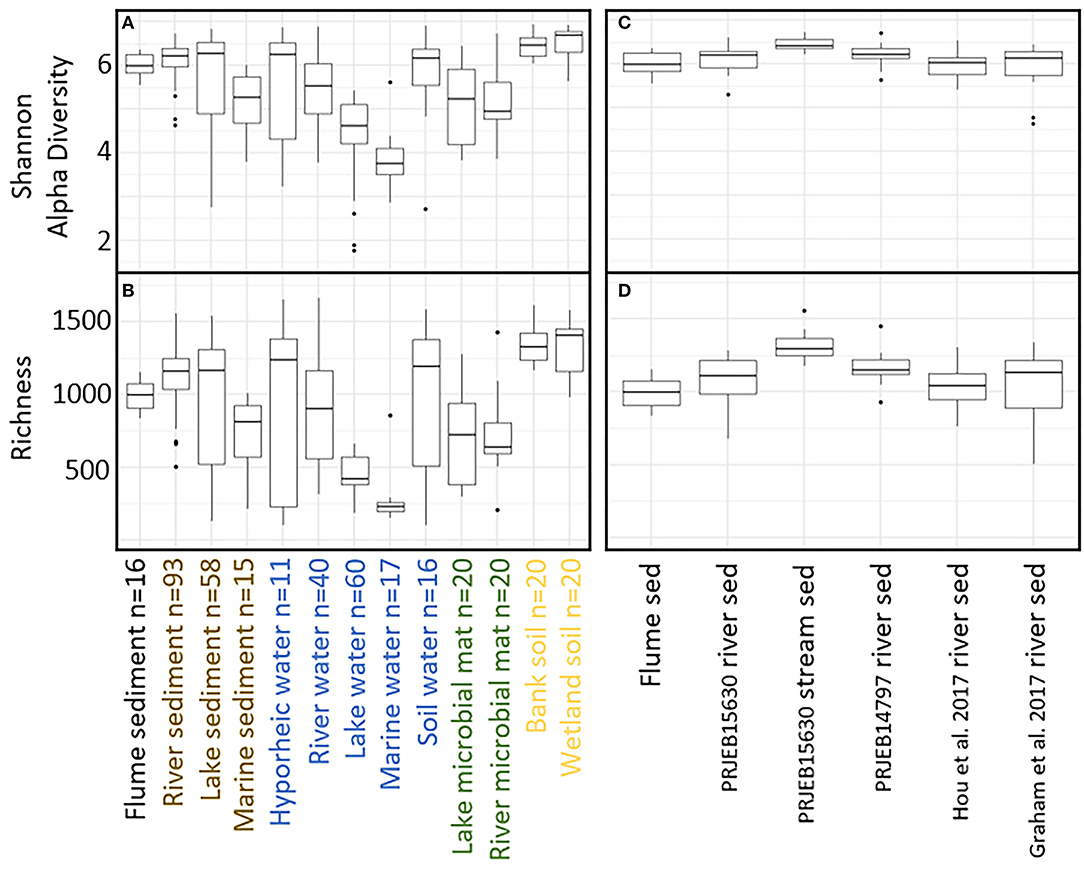
Figure 4. (A) Shannon alpha diversity and (B) richness comparison between flume samples and natural samples. Sample biome/environment groups are color coded by environment with the exception of the flume environment, which is called out in black. (C) Shannon alpha diversity and (D) richness comparison between flume samples and natural river sediment samples.
Analysis of community composition among biome/environment groups provides additional evidence consistent with our second hypothesis, whereby flume communities bear more similarity to the riverbed sediments than to other natural systems (Figure 5). Although PERMANOVA analysis shows that the flume microbiome is significantly different from all of the other biome/environment groups (p < 0.001 for all sets), flume-vs-not flume categorization explained less taxonomic variation between the flume microbiome and the river sediment microbiome (r2 = 0.159) than it did between the flume and water, soil, or microbial mat/biofilm (r2 values of 0.176, 0.173, and 0.212, respectively). The r2 values are relatively low for all biome/environment groups, which indicates that factors other than the biome/environmental grouping are needed to explain all of the observed variation in microbial community.
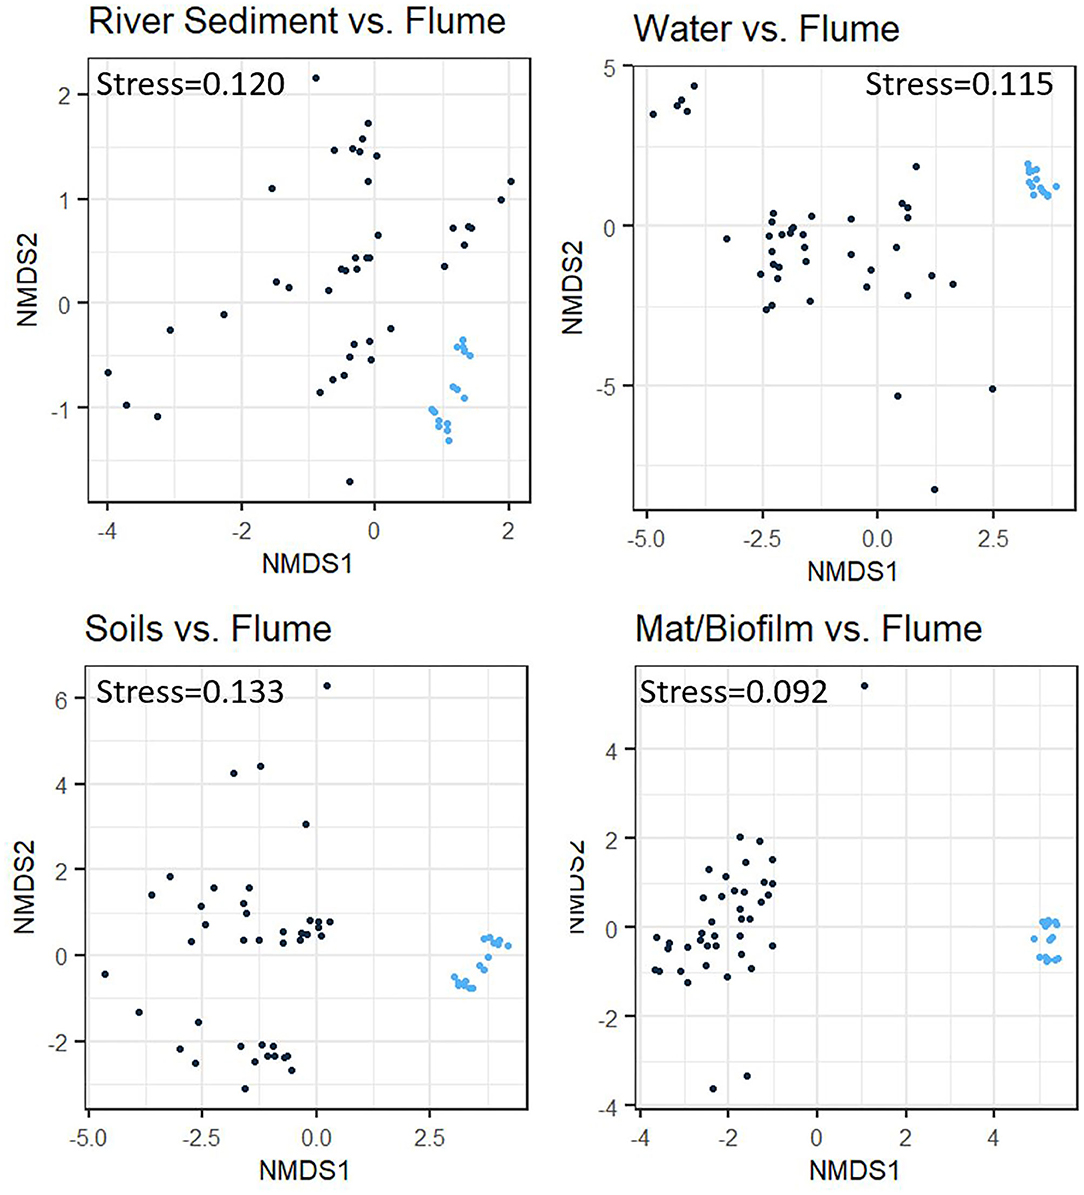
Figure 5. Non-metric multidimensional scaling (NMDS) plots comparing samples from various natural environment groups to experimental flume samples using Bray-Curtis dissimilarity. Each panel represents clustering between the flume samples (blue dots) and one other comparison environment group (black dots) identified by the individual plot title. The flume samples cluster somewhat independently of the comparison environment groups in all cases, but this is more apparent in the comparison with the soil and microbial mat/biofilm environment groups than it is in the river sediments or water environment groups.
The level of Bray-Curtis dissimilarity in microbiome composition in the flume is similar to the level of microbiome variation in natural riverbed systems (Supplementary Table 5). Comparing flume samples to each other indicates a broad distribution of pairwise-sample dissimilarity, as quantified with Bray-Curtis dissimilarity (Bray and Curtis, 1957; Figure 6a). The breadth of the distribution is similar to the Bray-Curtis distribution of riverbed microbiomes (Figure 6b). When the flume microbiome samples were compared to microbiomes from all riverbed studies we observed an increase in Bray-Curtis dissimilarity (Figure 6c). This is consistent with results from the NMDS and PERMANOVA analyses discussed above, and may indicate significant divergence between flume and natural riverbed microbiomes. However, when comparing natural riverbed microbiomes to each other (across studies) we observed the same increase in Bray-Curtis values (Figure 6d). This indicates that the difference between the flume microbiome and riverbed microbiomes is similar to the difference among riverbed microbiomes.
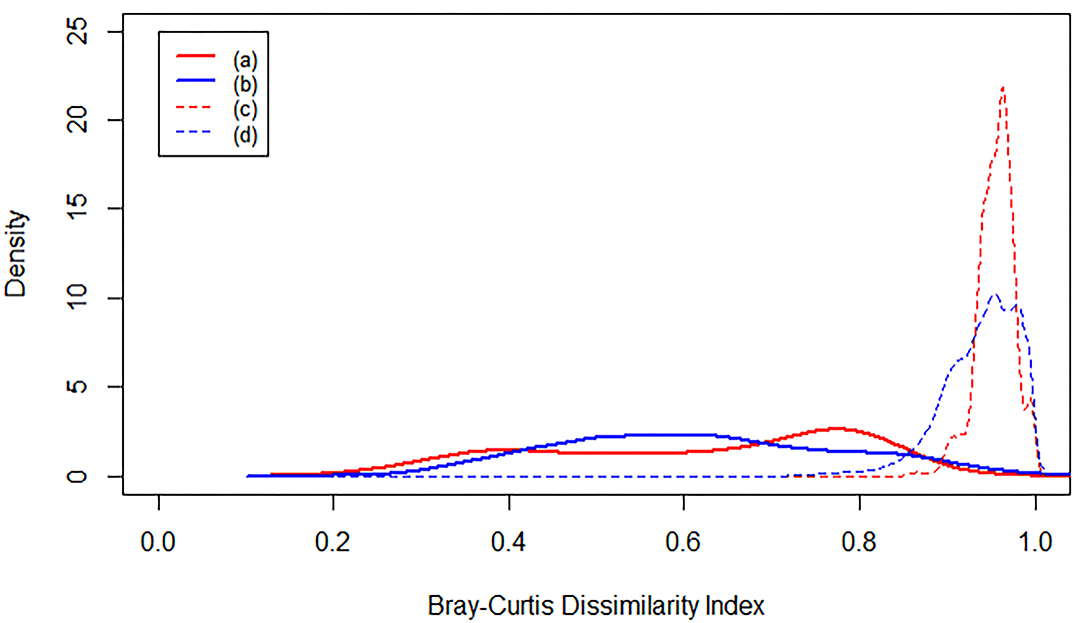
Figure 6. Kernel density plots of Bray-Curtis dissimilarity index. Each line represents an averaged density function. (a) is the dissimilarity between each flume sample and all the other flume samples. (b) is the dissimilarity between each river sediment sample and all the other river sediment samples from the same study. (c) is the dissimilarity between each flume sample and all of the river sediment samples, and (d) is the dissimilarity between each river sediment sample and all the other river sediment samples from all studies.
Bray-Curtis dissimilarities (Figure 6) indicate that the flume microbiome is just as different from natural riverbed systems as those systems are from each other. While encouraging, this analysis does not provide information on whether there are common microbial taxa across flume and river sediment microbiomes. In the past, observations of the occurrence of biogeochemical processes within flumes has been seen as enough justification to use the flume to study those processes. We suggest that as flumes are used for more complex and dynamic biogeochemical studies, it may start to become more important for the actual community to be similar, rather than simply to contain a broad mix of metabolic options. Flumes may be useful for microbial ecology studies, which involve not just the profile of given functional genes, but how those genes are packaged within organisms and how those organisms interact with each other. Thus, in some cases for flume experiments to be considered reflective of natural processes, there needs to be a shared, common microbiome between the flume and river sediment microbiomes (Turnbaugh et al., 2007). To explore common taxa, we extracted “common microorganisms” as the OTUs that were consistently shared between different subsets of the environmental systems.
When examined separately, the flume common microbiome contained a similar number of OTUs as found in the common microbiome of river sediments from a variety studies (Figure 7A). These common microbiomes comprised between 24 and 70% of the total counts for each community. More compelling was the size of the common microbiome after combining studies. When evaluated together, the river sediment samples had a common microbiome of 7 OTUs, comprising 1.6% of the total counts in the community. The relatively small common microbiome indicates that the sediment communities from different rivers vary much more than the communities from different samples from the same river. Adding in the flume samples to this set increased the common microbiome to 8 OTUs, comprising 1.5% of the total counts in the community. While this is a small fraction of the community, it shows there is a common microbiome that is conserved across the flume and all river sediments that were available in the database (Figure 7). 6 OTUs were members of the common microbiome in both the river sediments group and the river sediments + flume group (Table 2).
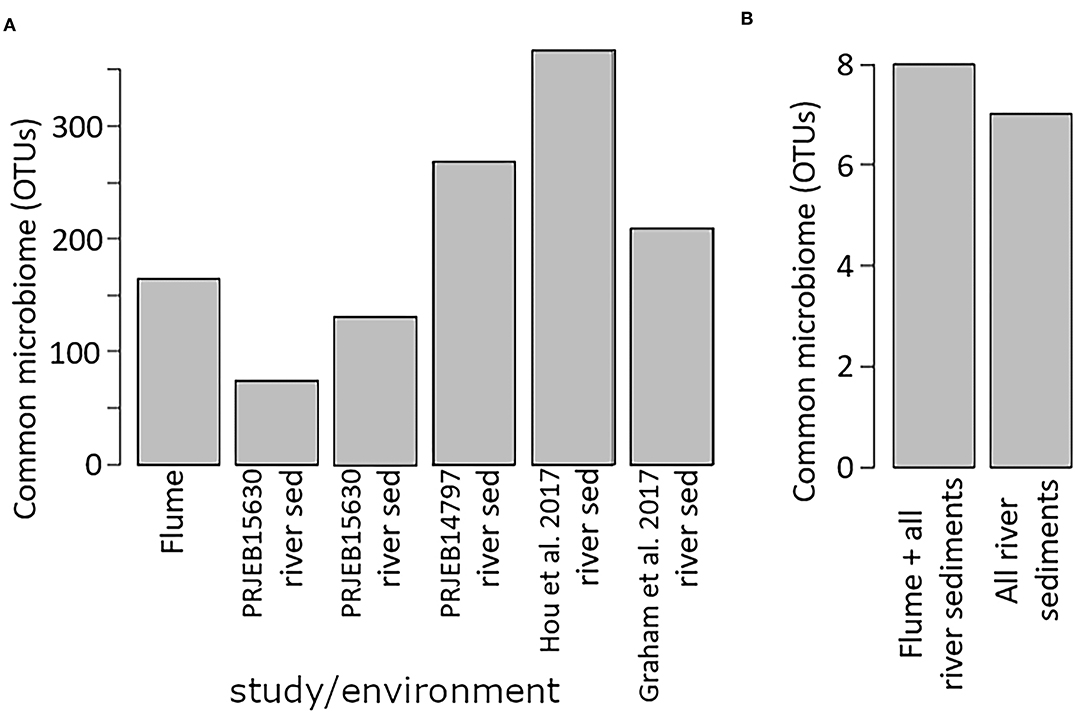
Figure 7. Common microbiome size. (A) shows the common microbiome for the flume and for each river sediment single-study biome/environment group, while (B) shows the size of the common microbiome when the river sediment biome/environment groups are all combined, and also when the flume samples are included in that combination.
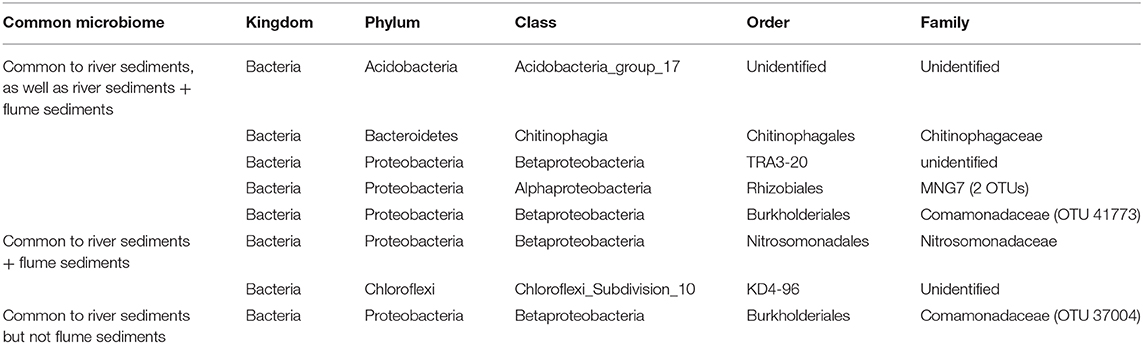
Table 2. Members of the common microbiomes of the river sediment samples with and without the inclusion of flume samples.
These 6 common OTUs may be useful targets for genome-scale metabolic models linking field and laboratory studies. This is particularly true given that the 6 common OTUs were physiologically and metabolically diverse, including aerobes and facultative anaerobes, as well as Betaproteobacteria order TRA3-20, an iron oxidizer. Present in the river sediments group common microbiome but absent when flume sediments were included was the Comamonadaceae family of Betaproteobacteria, an environmentally common motile aerobe. Present in the common microbiome of river sediments and the flume but not in the river sediments alone were two OTUs: one member of the Chloroflexi phylum of metabolically diverse and environmentally common bacteria, and one member of the Nitrosomonadaceae family, a lithotrophic ammonia oxidizing member of the Betaprotobacteria phylum.
While the core microbiome across the flume and riverbed sediments is relatively small (8 OTUs), adding the flume to the riverbed sediment datasets did not decrease (in fact increased slightly from 7 to 8 OTUs) the size of the core microbiome. This provides additional evidence that the flume microbiome overlaps with riverbed sediment microbiomes to a similar degree as natural riverbed microbiomes overlap with each other. This outcome can be contrasted against the alternative in which adding the flume could have resulted in fewer core OTUs, which would have indicated that the flume has a distinct microbiome.
Implications, Limitations, and Recommendations
Laboratory flumes provide an attractive and advantageous method for the study of biogeochemical processes, and their use continues to increase (Kessler et al., 2012; Cardenas et al., 2016; Fox et al., 2018). It is inherently assumed in these studies that the microbiome of the laboratory flume is functionally and structurally similar to microbiomes of natural riverbed sediments. This is a critical assumption as microbial assemblages in natural systems exist in a state of constant feedback with their geochemical environments (Gonzalez and Bell, 2013; Graham et al., 2017). We acknowledged that there are differences between our flume sediment and natural river sediment microbiomes. However, the differences are small, and in most cases the differences observed between the flume and natural river sediments are within the range of differences observed between the various natural river sediments. We leave a more critical evaluation for future research.
In addition to testing hypotheses, we reveal a core microbiome that is shared between the flume and natural systems, which may point to microbial taxa that could be particularly important to the biogeochemical function of both flume and natural riverine systems. These taxa may be good candidates for the development of genome-scale metabolic models that could be used in both flume and natural settings and serve as “connective tissue” between the lab and field.
This study only examines a single laboratory flume at a particular moment in time. Additionally, we do not provide natural system comparisons across redox gradients, stream orders, or other potentially important drivers of natural microbiome differentiation due to limitations in publicly available data. We compare the flume microbiome to diverse natural environments; however, we do not conduct a thorough investigation into the differences and similarities between the various natural environments. Such comparisons are of interest and remain a topic of ongoing research. While our results support the continued use of laboratory flumes as windows into riverbed biogeochemical function, they are inherently limited in scope. Futures studies of how flume microbiomes establish, grow, and change over time and in multiple flumes under varying conditions would provide further insight on the use of laboratory flumes as analogs for natural settings. Such studies should explore how closely a flume microbiome can replicate the microbiome of a single specific riverbed, or a continuum of riverbeds across streams order or climatic gradients. Additionally, 16S rRNA analyses provide only a partial view of the microbial structure present in an environment. Deeper analysis, including fungi and/or shotgun metagenomics and metatranscriptomics would be useful for further exploring the relationship between a flume microbiome and that of a natural riverbed.
Data Availability Statement
The datasets presented in this study can be found in online repositories. The names of the repository/repositories and accession number(s) can be found at: http://ebi.ac.uk, PRJEB34171.
Author Contributions
As the lead author, MK is accountable for the integrity of the data, analysis, and presentation of findings as a whole. Designing of the research was primarily carried out by MK, JW, EG, and JS. Performing the research was primarily carried out by MK and MC for flume experiments, and JB for sequencing and data processing. Data analysis was primarily carried out by MK, JW, and JS. All authors were directly involved in drafting the manuscript itself.
Funding
This research was supported by the U.S. Department of Energy, Office of Science, Office of Biological and Environmental Research, Environmental System Science (ESS) Program. This contribution originates from the River Corridor Scientific Focus Area (SFA) project at Pacific Northwest National Laboratory (PNNL). This research was supported under award DESC0018042. This material is based upon work supported by the National Science Foundation under Grant no. HRD-1345169.
Conflict of Interest
The authors declare that the research was conducted in the absence of any commercial or financial relationships that could be construed as a potential conflict of interest.
Acknowledgments
A great deal of advice and support was provided by Phil Bennett and Sarah Fansler. A portion of the research described in this paper in this report was conducted under the Laboratory Directed Research and Development Program at Pacific Northwest National Laboratory, a multi-program national laboratory operated by Battelle for the U.S. Department of Energy. MK was grateful for the support of the Linus Pauling Distinguished Postdoctoral Fellowship program. The authors deeply appreciate the time and energy of the editorial staff and reviewers. Any use of trade, firm, or product names is for descriptive purposes only and does not imply endorsement by the U.S. Government.
Supplementary Material
The Supplementary Material for this article can be found online at: https://www.frontiersin.org/articles/10.3389/frwa.2021.596260/full#supplementary-material
References
Anderson, M. J. (2001). A new method for non-parametric multivariate analysis of variance. Austral. Ecol. 26, 32–46. doi: 10.1111/j.1442-9993.2001.01070.pp.x
Azizian, M., Grant, S. B., Kessler, A. J., Cook, P. L., Rippy, M. A., and Stewardson, M. J. (2015). Bedforms as biocatalytic filters: a pumping and streamline segregation model for nitrate removal in permeable sediments. Environ. Sci. Technol. 49, 10993–11002. doi: 10.1021/acs.est.5b01941
Battin, T. J., Kaplan, L. A., Findlay, S., Hopkinson, C. S., Marti, E., Packman, A. I., et al. (2008). Biophysical controls on organic carbon fluxes in fluvial networks. Nat. Geosci. 1, 95–100. doi: 10.1038/ngeo101
Boncagni, N. T., Otaegui, J. M., Warner, E., Curran, T., Ren, J., and Fidalgo de Cortalezzi, M. M. (2009). Exchange of TiO2 nanoparticles between streams and streambeds. Environ. Sci. Technol. 43, 7699–7705. doi: 10.1021/es900424n
Braker, G., Ayala-del-Rio, H. L., Devol, A. H., Fesefeldt, A., and Tiedje, J. M. (2001). Community structure of denitrifiers, bacteria, and archaea along redox gradients in Pacific Northwest marine sediments by terminal restriction fragment length polymorphism analysis of amplified nitrite reductase (nirS) and 16S rRNA genes. Appl. Environ. Microbiol. 67, 1893–1901. doi: 10.1128/AEM.67.4.1893-1901.2001
Bray, J. R., and Curtis, J. T. (1957). An ordination of the upland forest communities of southern Wisconsin. Ecol. Monogr. 27, 325–349. doi: 10.2307/1942268
Brown, J., Zavoshy, N., Brislawn, C. J., and McCue, L. A. (2018). Hundo: a snakemake workflow for microbial community sequence data. Peer J. Preprints 6:e27272v1. doi: 10.7287/peerj.preprints.27272v1
Camacho, C., Coulouris, G., Avagyan, V., Ma, N., Papadopoulos, J., Bealer, K., et al. (2009). BLAST+: architecture and applications. BMC Bioinform. 10, 421–421. doi: 10.1186/1471-2105-10-421
Cao, P. (2014). Study on the extraction technology of tannin from mountain walnut shells. Agricult. Biotechnol. 3, 21–23.e28. doi: 10.19759/j.cnki.2164-4993.2014.05.005
Caporaso, J. G., Lauber, C. L., Walters, W. A., Berg-Lyons, D., Huntley, J., Fierer, N., et al. (2012). Ultra-high-throughput microbial community analysis on the Illumina HiSeq and MiSeq platforms. ISME J. 6, 1621–1624. doi: 10.1038/ismej.2012.8
Cardenas, M. B., Ford, A. E., Kaufman, M. H., Kessler, A. J., and Cook, P. L. M. (2016). Hyporheic flow and dissolved oxygen distribution in fish nests: the effects of open channel velocity, permeability patterns, and groundwater upwelling. J. Geophys. Res. Biogeosci. 121, 3113–3130. doi: 10.1002/2016JG003381
Crump, B. C., Amaral-Zettler, L. A., and Kling, G. W. (2012). Microbial diversity in arctic freshwaters is structured by inoculation of microbes from soils. ISME J. 6, 1629–1639. doi: 10.1038/ismej.2012.9
DeAngelis, K. M., Silver, W. L., Thompson, A. W., and Firestone, M. K. (2010). Microbial communities acclimate to recurring changes in soil redox potential status. Environ. Microbiol. 12, 3137–3149. doi: 10.1111/j.1462-2920.2010.02286.x
Findlay, S., Strayer, D., Goumbala, C., and Gould, K. (1993). Metabolism of streamwater dissolved organic carbon in the shallow hyporheic zone. Limnol. Oceanogr. 38, 1493–1499. doi: 10.4319/lo.1993.38.7.1493
Fischer, H., Kloep, F., Wilzcek, S., and Pusch, M. T. (2005). A river's liver - microbial processes within the hyporheic zone of a large lowland river. Biogeochemistry 76, 349–371. doi: 10.1007/s10533-005-6896-y
Fox, A., Packman, A. I., Boano, F., Phillips, C. B., and Arnon, S. (2018). Interactions between suspended kaolinite deposition and hyporheic exchange flux under losing and gaining flow conditions. Geophys. Res. Lett. 45, 4077–4085. doi: 10.1029/2018GL077951
Gibbons, S. M., Jones, E., Bearquiver, A., Blackwolf, F., Roundstone, W., Scott, N., et al. (2014). Human and environmental impacts on river sediment microbial communities. PLoS ONE 9:e97435. doi: 10.1371/journal.pone.0097435
Gomez-Velez, J. D., Harvey, J., Cardenas, M. B., and Kiel, B. (2015). Denitrification in the mississippi river network controlled by flow through river bedforms. Nat. Geosci. 8, 941–975. doi: 10.1038/ngeo2567
Gomez-Velez, J. D., and Harvey, J. W. (2014). A hydrogeomorphic river network model predicts where and why hyporheic exchange is important in large basins. Geophys. Res. Lett. 41, 6403–6412. doi: 10.1002/2014GL061099
Gonzalez, A., and Bell, G. (2013). Evolutionary rescue and adaptation to abrupt environmental change depends upon the history of stress, Philosophical Transactions of the Royal Society B: Biological Sciences, 368(1610), 20120079. doi: 10.1098/rstb.2012.0079
Gooseff, M. N. (2010). Defining hyporheic zones – advancing our conceptual and operational definitions of where stream water and groundwater meet. Geography. Compass 4, 945–955. doi: 10.1111/j.1749-8198.2010.00364.x
Graham, E. B., Crump, A. R., Resch, C. T., Fansler, S., Arntzen, E., Kennedy, D. W., et al. (2017). Deterministic influences exceed dispersal effects on hydrologically-connected microbiomes. Environ. Microbiol. 19, 1552–1567. doi: 10.1111/1462-2920.13720
Graham, E. B., Knelman, J. E., Schindlbacher, A., Siciliano, S., Breulmann, M., Yannarell, A., et al. (2016). Microbes as engines of ecosystem function: when does community structure enhance predictions of ecosystem processes? Front. Microbiol. 7:214. doi: 10.3389/fmicb.2016.00214
Grüning, B., Dale, R., Sjödin, A., Rowe, J., Chapman, B. A., Tomkins-Tinch, C. H., et al. (2017). Bioconda: a sustainable and comprehensive software distribution for the life sciences. bioRxiv. doi: 10.1101/207092
Harvey, J., and Gooseff, M. (2015). River corridor science: hydrologic exchange and ecological consequences from bedforms to basins. Water Resour. Res. 51, 6893–6922. doi: 10.1002/2015WR017617
Harvey, J. W., and Fuller, C. C. (1998). Effect of enhanced manganese oxidation in the hyporheic zone on basin-scale geochemical mass balance. Water Resour. Res. 34, 623–636. doi: 10.1029/97WR03606
Hou, Z., Nelson, W. C., Stegen, J. C., Murray, C. J., Arntzen, E., Crump, A. R., et al. (2017). Geochemical and microbial community attributes in relation to hyporheic zone geological facies. Sci. Rep 7:12006. doi: 10.1038/s41598-017-12275-w
Kaufman, M. H., Cardenas, M. B., Buttles, J., Kessler, A. J., and Cook, P. L. M. (2017). Hyporheic hot moments: dissolved oxygen dynamics in the hyporheic zone in response to surface flow perturbations. Water Resour. Res. 53, 6642–6662. doi: 10.1002/2016WR020296
Kessler, A. J., Bristow, L. A., Cardenas, M. B., Glud, R. N., Thamdrup, B., and Cook, P. L. M. (2014). The isotope effect of denitrification in permeable sediments. Geochim. Cosmochim. Acta. 133, 156–167 doi: 10.1016/j.gca.2014.02.029
Kessler, A. J., Glud, R. N., Cardenas, M. B., Larsen, M., Bourke, M. F., and Cook, P. L. M. (2012). Quantifying denitrification in rippled permeable sands through combined flume experiments and modeling. Limnol. Oceanogr. 57, 1217–1232. doi: 10.4319/lo.2012.57.4.1217
Koster, J., and Rahmann, S. (2012). Snakemake-a scalable bioinformatics workflow engine. Bioinformatics 28, 2520–2522. doi: 10.1093/bioinformatics/bts480
Kruskal, W. H. (1952). A nonparametric test for the several sample problem. Ann. Math. Stat. 23, 525–540. doi: 10.1214/aoms/1177729332
Lanzen, A., Jorgensen, S. L., Huson, D. H., Gorfer, M., Grindhaug, S. H., Jonassen, I., et al. (2012). CREST - classification resources for environmental sequence tags. PLoS ONE 7:e49334. doi: 10.1371/journal.pone.0049334
Larsen, M., Borisov, S. M., Grunwald, B., Klimant, I., and Glud, R. N. (2011). A simple and inexpensive high resolution color ratiometric planar optode imaging approach: application to oxygen and pH sensing. Limnol. Oceanogra. Methods 9, 348–360, doi: 10.4319/lom.2011.9.348
Liu, C., Yao, M. J., Stegen, J. C., Rui, J. P., Li, J. B., and Li, X. Z. (2017). Long-term nitrogen addition affects the phylogenetic turnover of soil microbial community responding to moisture pulse. Sci. Rep. 7:17492. doi: 10.1038/s41598-017-17736-w
Liu, Y., Liu, C., Nelson, W. C., Shi, L., Xu, F., Liu, Y., et al. (2017). Effect of water chemistry and hydrodynamics on nitrogen transformation activity and microbial community functional potential in hyporheic zone sediment columns. Environ. Sci. Technol. 51, 4877–4886. doi: 10.1021/acs.est.6b05018
McDonald, D., Clemente, J. C., Kuczynski, J., Rideout, J. R., Stombaugh, J., Wendel, D., et al. (2012). The biological observation matrix (BIOM) format or: how I learned to stop worrying and love the ome-ome. GigaScience 1:7. doi: 10.1186/2047-217X-1-7
McMurdie, P. J. (2016). biomformat: An Interface Package for the BIOM File Format. Available online at: https://github.com/joey711/biomformat/
McMurdie, P. J., and Holmes, S. (2013). phyloseq: an R package for reproducible interactive analysis and graphics of microbiome census data. PLoS ONE 8:e61217. doi: 10.1371/journal.pone.0061217
Quast, C., Pruesse, E., Yilmaz, P., Gerken, J., Schweer, T., Yarza, P., et al. (2013). The SILVA ribosomal RNA gene database project: improved data processing and web-based tools. Nucleic Acids Res. 41, D590–D596. doi: 10.1093/nar/gks1219
R Core Team (2017). R: A Language and Environment for Statistical Computing. Vienna: R Foundation for Statistical Computing.
Rognes, T., Flouri, T., Nichols, B., Quince, C., and Mahé, F. (2016). VSEARCH: a versatile open source tool for metagenomics. PeerJ 4:e2584. doi: 10.7717/peerj.2584
Rösel, S., Allgaier, M., and Grossart, H. P. (2012). Long-term characterization of free-living and particle-associated bacterial communities in lake tiefwaren reveals distinct seasonal patterns. Microb. Ecol. 64, 571–583. doi: 10.1007/s00248-012-0049-3
Sawyer, A. H., Cardenas, M. B, and Buttles, J. (2011). Hyporheic exchange due to channel-spanning logs. Water Resour. Res. 47:W08502. doi: 10.1029/2011WR010484
Stegen, J. C., Fredrickson, J. K., Wilkins, M. J., Konopka, A. E., Nelson, W. C., Arntzen, E. V., et al. (2016). Groundwater-surface water mixing shifts ecological assembly processes and stimulates organic carbon turnover. Nat. Commun. 7:11237. doi: 10.1038/ncomms11237
Stegen, J. C., Johnson, T., Fredrickson, J. M., Wilkins, M. J., Konopka, A. E., Nelson, W. C., et al. (2018). Influences of organic carbon speciation on hyporheic corridor biogeochemistry and microbial ecology. Nat. Commun. 9:585. doi: 10.1038/s41467-018-02922-9
Thompson, L. R., Sanders, J. G., McDonald, D., Amir, A., Ladau, J., Locey, K. J., et al. (2017). A communal catalogue reveals earth's multiscale microbial diversity. Nature 551, 457–463. doi: 10.1038/nature24621
Turnbaugh, P. J., Ley, R. E., Hamady, M., Fraser-Liggett, C. M., Knight, R., and Gordon, J. I. (2007). The human microbiome project. Nature 449, 804–810. doi: 10.1038/nature06244
Wetzel, R. G. (1993). Microcommunities and microgradients: linking nutrient regeneration, microbial mutualism, and high sustained aquatic primary production. Netherland J. Aquat. Ecol. 27, 3–9. doi: 10.1007/BF02336924
Whittaker, R. H. (1972). Evolution and measurement of species diversity. Taxon 21, 213–251. doi: 10.2307/1218190
Keywords: riverbed, hyporheic, microbiome, biogeochemistry, river
Citation: Kaufman MH, Warden JG, Cardenas MB, Stegen JC, Graham EB and Brown J (2021) Evaluating a Laboratory Flume Microbiome as a Window Into Natural Riverbed Biogeochemistry. Front. Water 3:596260. doi: 10.3389/frwa.2021.596260
Received: 18 August 2020; Accepted: 19 February 2021;
Published: 18 March 2021.
Edited by:
Dipankar Dwivedi, Lawrence Berkeley National Laboratory, United StatesReviewed by:
Christian Dewey, Stanford University, United StatesRaghupathy Karthikeyan, Clemson University, United States
Copyright © 2021 Kaufman, Warden, Cardenas, Stegen, Graham and Brown. This is an open-access article distributed under the terms of the Creative Commons Attribution License (CC BY). The use, distribution or reproduction in other forums is permitted, provided the original author(s) and the copyright owner(s) are credited and that the original publication in this journal is cited, in accordance with accepted academic practice. No use, distribution or reproduction is permitted which does not comply with these terms.
*Correspondence: Matthew H. Kaufman, bWF0dGhldy5rYXVmbWFuQHBubmwuZ292