 Hamid Vahdat-Aboueshagh
 Frank T.-C. Tsai
 Dependra Bhatta3
- 1Department of Civil and Environmental Engineering, Louisiana State University, Baton Rouge, LA, United States
- 2Department of Civil and Environmental Engineering, Patrick F. Taylor Hall, Louisiana State University, Baton Rouge, LA, United States
- 3Department of Agricultural Economics and Agribusiness, Louisiana State University and LSU Agricultural Center, Baton Rouge, LA, United States
This study identifies hydrogeologic characteristics of complex aquifers based on constructing stratigraphic structure with large, non-uniform well log data. The approach was validated through a modeling study of the irrigation-intensive Chicot aquifer system, which is an important Pleistocene-Holocene aquifer of the Coastal Lowlands aquifer system in the southwestern Louisiana. Various well log types were unified into the same data structure, prioritized based on data sources, and interpolated to generate a detailed stratigraphic structure. More than 29,000 well logs were integrated to construct a stratigraphy model of 56 model layers for the Chicot aquifer system. The stratigraphy model revealed interconnections of various sands in the system, where 90% of the model domain is covered by fine-grained sediments. Although the groundwater model estimated a slight groundwater storage gain during 2005–2014 for the entire region, groundwater storage in the agricultural area was depleted. Nevertheless, the quick groundwater storage recovery during the non-irrigation seasons suggests that the Chicot aquifer system is a prolific aquifer system. The groundwater modeling result shows that the gulfward groundwater flow direction prior to pumping has been reversed toward inland pumping areas. The large upward vertical flow from the deeper sands indicates potential saltwater migration from the base of the Chicot aquifer system.
Introduction
Groundwater resource management of coastal aquifers has become a focal center of interest for many studies (Bocanegra et al., 2010; Custodio, 2010; Christelis and Mantoglou, 2016; Quintana et al., 2018). Overdrafting coastal aquifers has reportedly caused significant change in pre-development flow patterns leading to saltwater intrusion (Barlow and Reichard, 2010; Azizi et al., 2019; Parizi et al., 2019) and land subsidence (Eggleston and Pope, 2013; Guo et al., 2015). Hence, sustainable management of the aquifers plays an important role in counteracting the negative impacts (Abd-Elhamid and Javadi, 2011; Sreekanth and Datta, 2015). A key to understand the sustainability of aquifer systems is the analysis of influxes and outfluxes, which is elaborated in the concept of sustainable yield (Bredehoeft, 2002; Alley and Leake, 2004). As previous researches have emphasized, measuring the contributions of different inputs and outputs to a groundwater system is not a straightforward task for complex aquifer systems and flow modeling could help to overcome this issue (Loucks, 2000; Cao et al., 2013). The Chicot aquifer system in the southwestern Louisiana, as a very important groundwater resource in the Coastal Lowlands aquifer system (Weiss, 1990), has been exploited mostly for irrigation during the past decades (Sargent, 2011). Understanding groundwater dynamics in the Chicot aquifer system is the primary step for its future sustainable development.
Understanding the groundwater dynamics in complex aquifers needs the assistance of stratigraphy models as well as groundwater models with different hydrogeologic properties (Zhang et al., 2006; Lee et al., 2007; Berg and Illman, 2015). Selecting an appropriate stratigraphic modeling method mainly depends on data availability, computational resources, and adequacy of results reflecting the reality. Geostatistical methods have been extensively applied to developing stratigraphy models (Johnson and Dreiss, 1989; Soares, 1990; Marinoni, 2003; Kostic et al., 2005). However, computational expenses with a very large dataset are among the limitations of using kriging methods (Pardo-Iguzquiza and Dowd, 1998; Tartakovsky et al., 2007; Cheng, 2013). Non-geostatistical interpolation methods such as the natural neighbor interpolation method (Watson, 1999) and the triangulated irregular networks (Clevis et al., 2006) avoid covariance matrix calculations and are computationally efficient.
One of the challenges associated with constructing stratigraphic structure for large-scale models is processing a huge volume of geological data. Several attempts have been made in organizing well log records and geological information by using Geographic Information System (GIS) tools (Chang and Park, 2004; Ross et al., 2005; Chesnaux et al., 2011). However, how to process raw well log data has not received enough attention. Prioritizing data from different well log sources based on their reliability (Ross et al., 2005) and selecting the most reliable piece of information are solutions to reduce errors in stratigraphy models. Another way to increase the model reliability is to consider an effective depth, to which a given well log includes proper stratigraphic information (Danielsen et al., 2007).
Model calibration is very challenging for an expensive groundwater model. Due to high dimensionality of parameters in a large-scale, complicated aquifer system, it is impossible to tune parameters without the aid of automatic calibration through optimization. Global search optimization methods such as the genetic algorithm (Kumar et al., 2010), the simulated annealing algorithm (Aarts and van Laarhoven, 1987), the ant colony optimization (Dorigo and Di Caro, 1999), and the particle swarm optimization (Poli et al., 2007) have the advantage of being derivative-free (Rios and Sahinidis, 2013) over derivative-based local search optimization methods, but require a large number of model runs. The Covariance Matrix Adaptation Evolutionary Strategy (CMA-ES) (Hansen et al., 2003) has proven to be an efficient method to calibrate expensive groundwater models with parallel computing (Elshall et al., 2015). This study adopted the CMA-ES for model calibration.
The goal of this study is to address the two aforementioned modeling challenges: (1) building a complex stratigraphy structure with large, non-uniform well log data, and (2) calibration of a high dimensional groundwater model, while investigating the groundwater dynamics of the Chicot aquifer system in Southwest Louisiana. The Chicot aquifer system has been known for its intensive use of groundwater for irrigation (Konikow, 2013) and its complex aquifer structure is largely ignored. This study adopted a lithofacies modeling method and a parallel optimization method for model calibration to improve groundwater modeling. Moreover, to the authors' best knowledge, there is no such a detailed large-scale groundwater model been built to advance hydrogeological knowledge in the Gulf of Mexico region and other coastal areas. The study presents an important worked example to bridging the gap between research and professional practice. In section Chicot Aquifer System, the Chicot aquifer system is introduced. Section Data and Methods discusses data and methods to develop a Chicot groundwater model. Section Results and Discussions shows results and discussion. Section Conclusions draws the conclusions.
Chicot Aquifer System
The Chicot aquifer system is part of the Coastal Lowlands aquifer system (Weiss, 1990). It covers Southeast Texas and Southwest Louisiana (Weiss, 1990). Nominally, the Chicot aquifer system only refers to its extent in Southwest Louisiana (Jones et al., 1956; Nyman et al., 1990; Sargent, 2004). The annual precipitation is about 1,473 mm (58 inches). The Chicot aquifer system is the most heavily pumped aquifer in Louisiana, accounting for 41% of the state's groundwater use (Sargent, 2011). Seventy-two percentage of groundwater withdrawals are for the agriculture sector (including aquaculture). The Chicot aquifer system is also a sole source aquifer (USEPA, 2019), providing the major water supply to the public in the region. Figure 1 shows the study domain, major rivers, lakes, the Chenier Plain, and 2,709 pumping wells. The Chicot aquifer boundaries are determined by the USGS (Smoot, 1986). About 87% of total pumping wells have depth <120 m, which are generally irrigation wells. Deep wells are usually public supply wells and industrial wells. More than 2,400 irrigation wells are in the east-central area. Monthly pumping rates for irrigation were estimated based on cultivation area, crop type, growing seasons of crops, and pumping capacity of wells. The pumping wells in the west-central area are mostly industrial wells. The major public supply wells are located in or around municipalities. The pumping rates for the industrial use, public supply, and power generation were obtained from the U.S. Geological Survey (USGS).
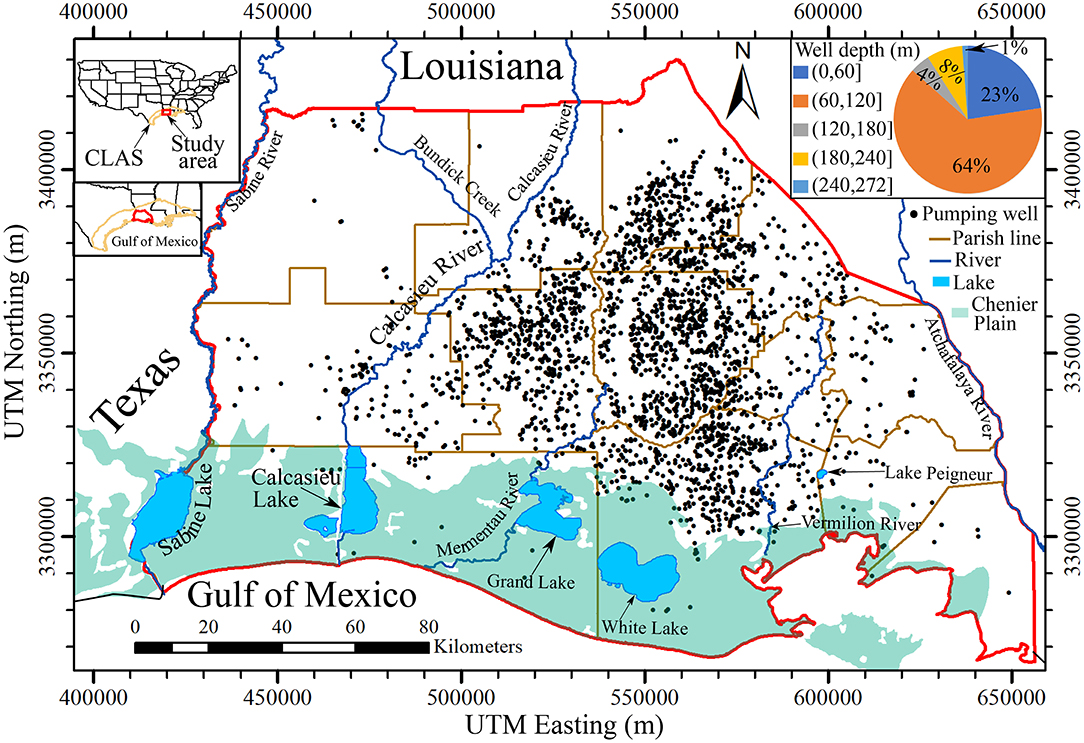
Figure 1. Chicot aquifer domain (red line). Black dots are pumping wells. Blue lines show the major rivers in the Chicot aquifer domain. The pie chart shows the fractions for depth ranges of pumping wells. The coordinates are in NAD83 / UTM zone 15N.
The Chicot aquifer system is the uppermost hydrogeological unit in southwest Louisiana and encompasses seven aquifers (Nyman et al., 1990). The aquifer system gently dips southward at an angle of 0.06° (Jones et al., 1956). Figure 2 displays the location of well logs and geological fault traces. The fault traces are part of the Tepetate fault system (McCulloh and Heinrich, 2013). Well log data include 29,107 drillers' logs and 811 electrical logs that were collected from the Louisiana Department of Natural Resources (LDNR) and the USGS. Well logs are sparse in the Chenier Plain at the south and in the Atchafalaya River Basin at the east. The drillers' logs are mostly shallow (<120 m), accounting for 93% of total well logs. The electrical logs are primarily deep. Seventy percentage of electrical logs have depth deeper than 120 m. The well logs show about 40% of lithological information to be sand facies, indicating a sizable amount of permeable formations for storing groundwater.
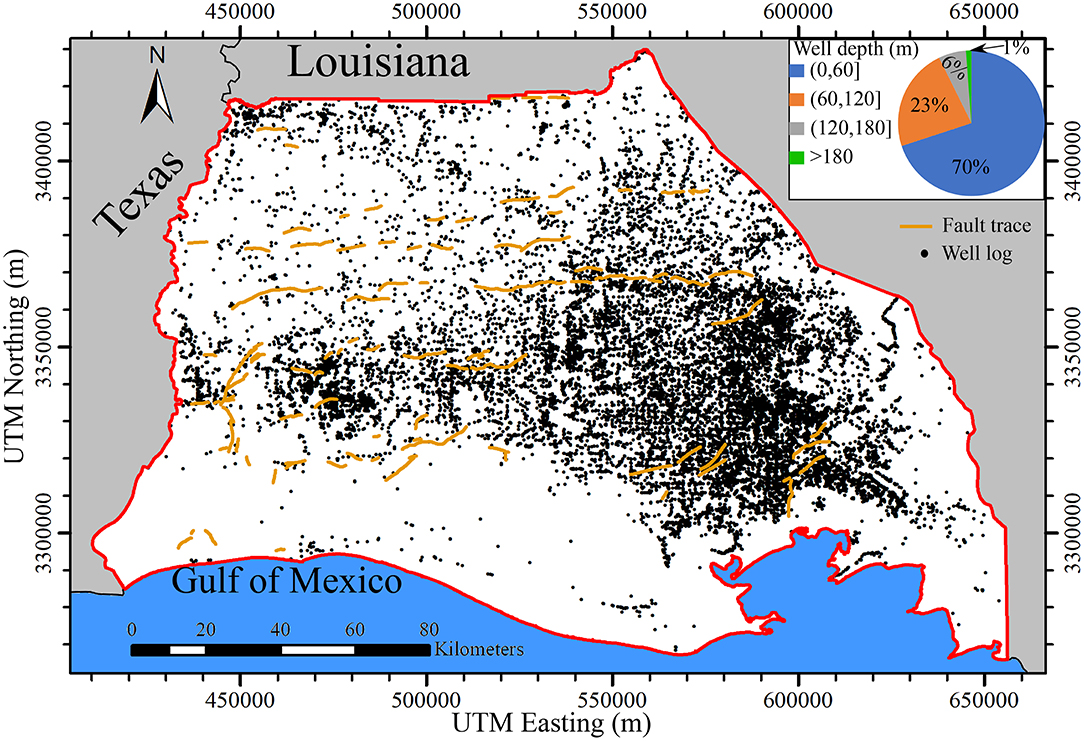
Figure 2. Location of well logs and fault traces in the study area. The pie chart shows the fractions for depth ranges of well logs.
Data and Methods
Well Logs for Stratigraphy Model Development
This study employed two types of well logs to develop a stratigraphy model: electrical logs and drillers' logs. Electrical logs show the electrical properties of strata along a borehole, where in general high resistivity and low resistivity indicate sand facies (high-permeability facies) and clay facies (low-permeability facies), respectively (Archie, 1942; Galloway, 1977). The gamma ray and spontaneous potential curves when available were also used to assist sand picks in the electrical logs. The 811 electrical logs were analyzed. Each electrical log was interpreted as a sequence of sand facies and clay facies. Since electrical logs usually start at a deeper depth below land surface and contain stratigraphic information for deeper formations, they were employed to build the deeper portion of the stratigraphy model.
The drillers' logs contain useful lithologic descriptions along boreholes. Since drillers' logs normally begin at land surface, they provide important lithologic information for the top portion of the stratigraphy model. Lithologic descriptions in all 29,107 drillers' logs were interpreted as a sequence of sand facies and clay facies. Logs with ambiguous descriptions, depths and locations were disregarded. This study used lithologic descriptions of drillers' logs down to 152 m (500 ft). Since some of electrical logs and drillers' logs may be available at the same location, we prioritized geological information of electrical logs over drillers' logs. Moreover, screen intervals of pumping wells were assumed at permeable formations and provided sand facies interval information. Figure 3 shows a composite well log data out of an electrical log, a drillers' log, and two well screens at the same location.
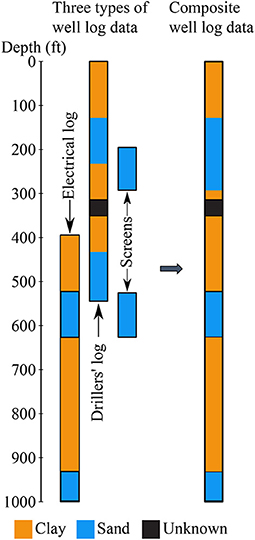
Figure 3. Integration of different well log data.
Lithofacies Modeling
This study adopted the lithofacies modeling technique in Vahdat-Aboueshagh and Tsai (2021) to construct a complex stratigraphy model shown in Figure 4. Lithofacies modeling involves domain translation and facies interpolation. In general, strata in Louisiana have changing dips (Vahdat-Aboueshagh and Tsai, 2021). However, the Chicot aquifer system appears to be homoclinal and dip south. Therefore, the lithofacies model was constructed with the same dip direction and dip angle.
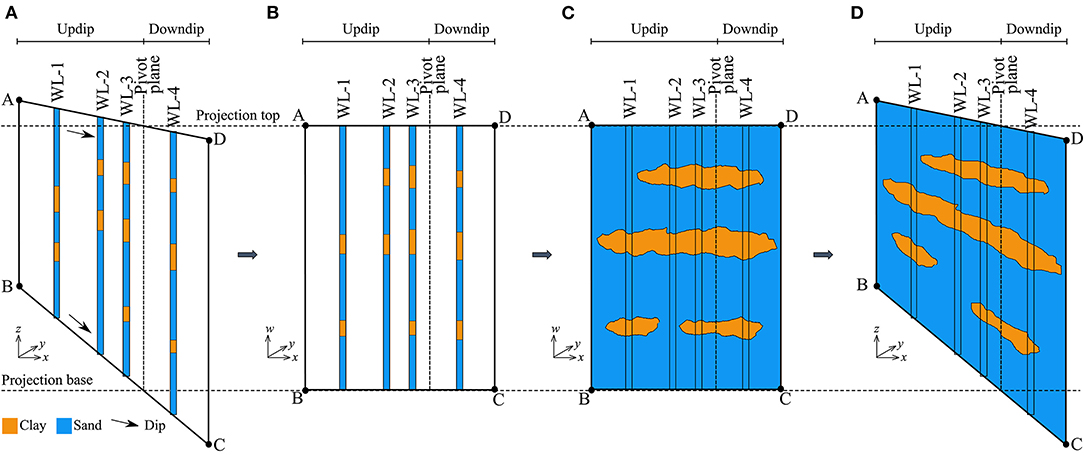
Figure 4. A schematic of lithofacies modeling with domain translation and facies interpolation: (A) well logs in a dipping domain, (B) well logs in a non-dipping domain, (C) lithofacies modeling in the non-dipping domain, and (D) the stratigraphy model in the dipping domain.
Consider a cross section in the coordinate system (x,y,z) with a changing dip angle and a number of well logs that are interpreted and labeled as a sequence of sand facies and clay facies (Figure 4A). The well logs in the dipping cross section is translated to a non-dipping domain (Figure 4B) with respect to the pivot plane in a new coordinate system (x,y,w):
where f(x, y, z) is the facies label data from well logs in the dipping domain, and g(x, y, w) is the facies label data of well logs in the non-dipping domain. The updip area with respect to the pivot plane is translated down and stretched from the projection top to the projection base. The downdip area with respect to the pivot plane is translated up and squeezed between the projection top and the projection base. An indicator interpolation method is performed to generate a non-dipping facies model (Figure 4C):
where ĝ(x, y, w) is the estimated facies label in the non-dipping domain, gi (x, y, w) is the facies label data from well log i in the non-dipping domain, and λi in the weighting coefficient for an interpolation method. Finally, the non-dipping facies model is translated back to the dipping domain (Figure 4D).
where is the estimated facies label in the dipping domain.
An indicator natural neighbor interpolation method (Tsai and Li, 2009) was utilized to construct a stratigraphy model using the 29,918 well logs, the dip direction of 270° (southward), and the structure dip angle of 0.06° (Jones et al., 1956). The indictor value for sand facies is 1 and for clay facies is 0 (Pham and Tsai, 2017). A cutoff value was suggested based on the proportion of sand facies in well logs (Elshall et al., 2013). In this study, the cutoff value was 0.4 for the Chicot aquifer system. The stratigraphy model started at the land surface and extends to a depth of about 305 m (1,000 ft). The study area was discretized into 56 layers. Each layer had 40,755 cells with a resolution of 1 km with varied layer thickness. A MODFLOW-2005 grid (Harbaugh, 2005) was developed based on the stratigraphy model. Readers are referred to Pham and Tsai (2017) for the detailed MODFLOW-2005 grid generation techniques.
Chicot Groundwater Model Development
Different MODFLOW-2005 packages were set up in order to develop a MODFLOW model with monthly stress periods. A River package was used to include river reaches and temporal river stages. The location of USGS stream gages is shown in Figure 5. A Recharge package was created based on a fraction of monthly surficial recharge rates provided by the USGS from January 2004 to December 2014 (Reitz and Sanford, 2019a). The USGS recharge rates were estimated as the residuals between water supply and the rest of water budget components (Reitz and Sanford, 2019b). A Well package was developed to include agriculture, industry, and public supply wells. A Horizontal Flow Barrier package was developed to simulate the Tepetate fault system. The lakes were not included in the groundwater model because of very limit hydraulic connection to the Chicot aquifer system (Vahdat-Aboueshagh and Tsai, 2021).
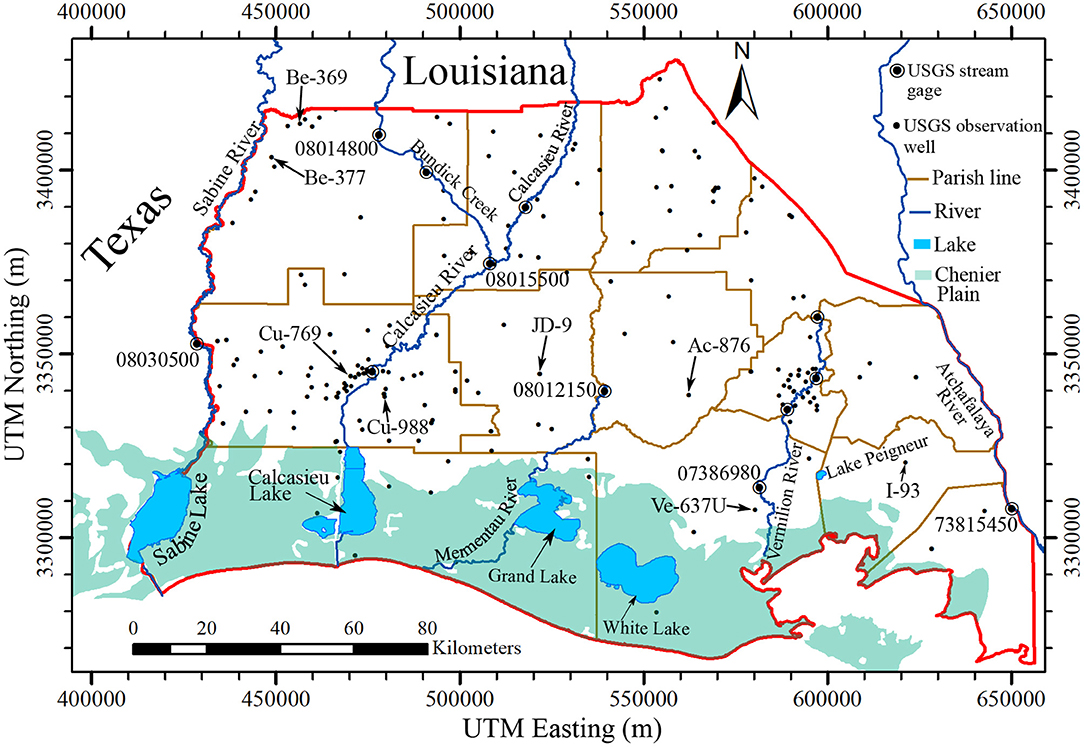
Figure 5. Locations of USGS stream gages and groundwater observation wells. Measured and simulated groundwater levels in the wells with well name are shown in Supplementary Figure 1.
Historical groundwater data were prepared for the simulation period from January 1, 2004 to December 31, 2014. There were 211 USGS wells with 2,161 groundwater level data. The location of USGS observation wells is shown in Figure 5. The groundwater data of January 2004 were employed to determine the initial condition for the groundwater model by spatial interpolation. Groundwater observation wells close to the model boundaries were used for the time-variant specified-head boundaries. The values of groundwater level from observation were interpolated spatially and temporally to obtain groundwater levels at different layers of the model. The temporal river stage data of Sabine River and Atchafalaya River were also used to estimate the boundary values at the stream portions. A total of 132 monthly stress periods were used in the MODFLOW model.
USGS water wells and Borrok and Broussard (2016) indicate that salt water is limited to the southern part of the Chicot aquifer system. The majority of the study region is not impacted by denser groundwater flows. Therefore, the effect of density-dependent flows was assumed insignificant. A future study may include the density effect in the vicinity of the Gulf of Mexico.
Model Calibration With Parallel Computing
Model parameters to be estimated were hydraulic conductivity (K) of sand, specific storage (Ss) of sand, hydraulic conductivity of clay, specific storage of clay, river conductance for 4 rivers, a fraction of USGS surficial recharge rates, and fault hydraulic characteristic (fault permeability per unit width of a fault). This study considered heterogeneous K and Ss for sand. Other parameters were considered to be homogeneous for the purpose of simplicity. The study assumed that the USGS recharge data is only applicable to surficial sand facies that directly link to deep aquifers. Recharge to surficial clay is negligible due to very low K. We applied the pilot point approach (Doherty et al., 2010) to estimate K and Ss of sand at 57 locations of the USGS groundwater observation wells. The natural neighbor interpolation method (Watson, 1999) was used to derive spatial distribution of K and Ss of sand. In total, there were 124 model parameters to be estimated through optimization. The ranges of model parameter values in optimization are shown in Table 1.
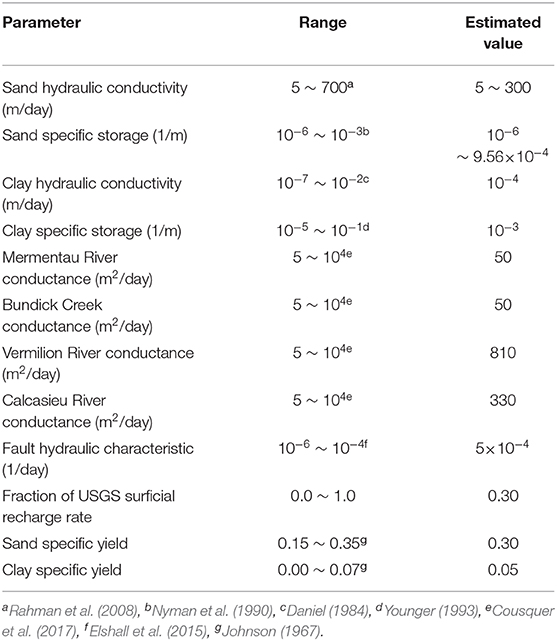
Table 1. Ranges and estimated parameter values for the Chicot groundwater model.
The Chicot groundwater model was calibrated using the parallel CMA-ES (Elshall et al., 2015) approach to minimize the root mean square error (RMSE) (Chai and Draxler, 2014) between the 2,161 observed and simulated groundwater levels:
where hi and represent the ith simulated groundwater level and the ith observed data, respectively, L is the number of observed data, and p is a set of model parameters.
The Nash–Sutcliffe model efficiency coefficient (NSE) was used to evaluate the model calibration result.
where is the mean of the observed groundwater data.
Parallel computation was performed on a supercomputer that has 380 nodes. Each node has 16 processors. A population size of 1,240, a ten-fold size of unknown parameters recommended by Pham and Tsai (2017), was used. The computation time for each model run was about 50 min on a 2.6 GHz Xeon 64-bit Processor. To maximize the computational efficiency, this study ran the parallel CMA-ES code on 1,240 processers. The data-model processes are presented in the flowchart, Figure 6.
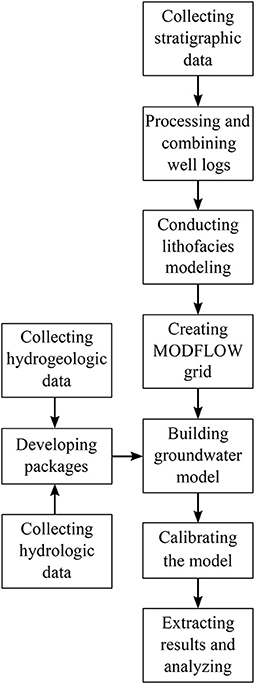
Figure 6. A flowchart of groundwater model development with stratigraphy data, hydrogeologic data and hydrologic data.
Results and Discussions
Stratigraphy Construction
A stratigraphy model of 56 non-uniform model layers was constructed for the Chicot aquifer system. The layer thickness varied from 2.2 to 10.4 m. The distributions of surficial sand facies and surficial clay facies at land surface are shown in Figure 7A. Around 7% of the model domain is covered by the surficial sand facies. The surficial sand facies appear to the northern area, which is the essential recharge zone for the Chicot aquifer system (Jones et al., 1956). The surficial sand facies are also seen in the vicinity of the Sabine River in the northwest.
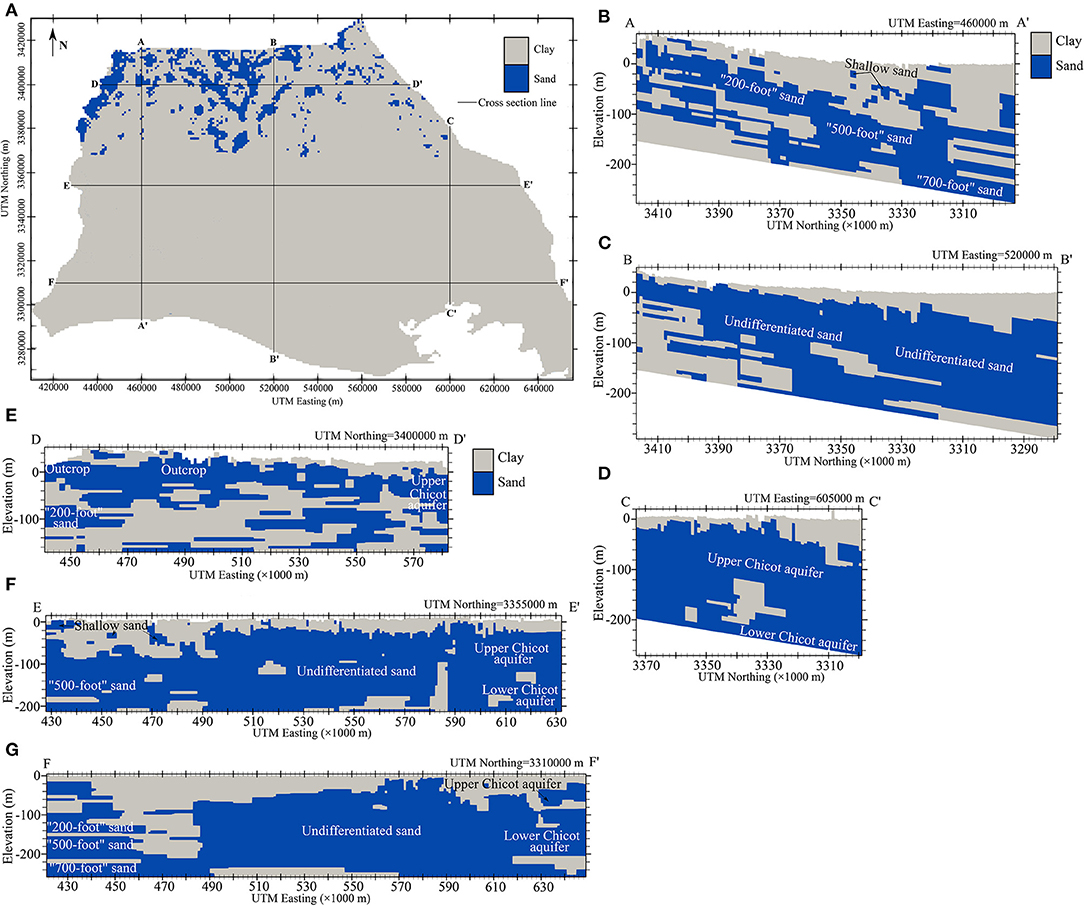
Figure 7. The Chicot stratigraphy model: (A) distributions of surficial sands and surficial clays, (B–D) north-south cross sections, and (E–G) east-west cross sections. The cross sections are magnified 50 times in vertical direction. The vertical datum is NAVD 88.
The north-south cross sections AA′, BB′, and CC′ (Figures 7B–D) show the surficial clay thickening toward the Gulf of Mexico. Most of the surficial sand facies in the north connect to the Chicot aquifer system, where precipitation and streams recharge the aquifer system. The Chicot aquifer system encompasses seven aquifers (Nyman et al., 1990): the Upper Chicot and the Lower Chicot aquifers in the east, the Undifferentiated sand in the central area, and the Shallow sand, the “200-foot” sand, the “500-foot” sand, and the “700-foot” sand in the west. The late Pleistocene-Holocene Shallow sand in the west (AA′ and EE′ cross sections) is underlain by the Pleistocene “200-foot” sand, the “500-foot” sand, and the “700-foot” sand (Nyman et al., 1990). The Shallow sand is sparsely interbedded in the top confining clay layer and has limited spatial extent, implying that the Shallow sand is not as productive as the other sand aquifers. The three sands grade from a fine-medium sand to coarse gravel (Nyman et al., 1990). They are separated by interbedded clays in a few areas, but are connected in the most areas.
The “200-foot” sand, the “500-foot” sand, and the “700-foot” sand (EE′ and FF′ cross sections) merge into the late Pleistocene Undifferentiated sand in the center of the aquifer system (Nyman et al., 1990). The Undifferentiated sand links to the Upper Chicot aquifer and Lower Chicot aquifer in the central and south of the aquifer domain. The Undifferentiated sand is much thicker than other sands in the aquifer system. The Pleistocene Upper Chicot and Lower Chicot aquifers are separated by clay beds as thick as 30 m (100 ft) in a few areas. The clay beds are not extensive (Williams and Duex, 1995). In general, sands in the north are relatively shallow and often interbedded with clays. Sands thicken and clays pinch out from the north to the south.
Model Calibration Result
The model calibration was completed in 300 h with the parallel CMEA-ES code and 1,240 processors. The estimated model parameter values are shown in Table 1. In general, the simulated groundwater levels show good agreement in terms of value, trend, or pattern with respect to the observed groundwater levels (Figure 8). The root mean square error is 2.14 m. The Nash–Sutcliffe model efficiency coefficient (NSE) of 0.98 indicates a good calibration result. However, it is understood that data uncertainty and model error do exist. The groundwater model could not perform satisfactorily at few observation wells. Comparisons of observed and simulated groundwater levels at selected wells (Figure 5) with long records are shown in Supplementary Figure 1. The model calibration result shows that 30% of the USGS surficial recharge amounts (Reitz and Sanford, 2019b) became groundwater recharge to the Chicot aquifer system. The mean monthly surficial recharge rates to the outcrop zone for each quarter in a year are shown in Supplementary Figure 2.
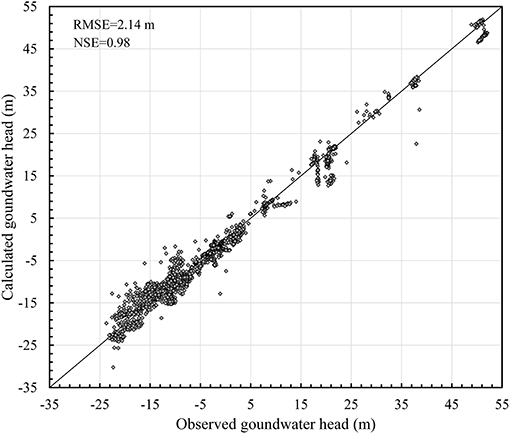
Figure 8. Scatter plot of observed groundwater levels vs. calculated groundwater levels in 2004-2014. The groundwater level datum is NAVD 88.
Temporal Water Budget Analysis
The water budget of the Chicot aquifer system was analyzed by investigating the storage change from January 2005 to December 2014 with respect to the initial storage in January 2005. The model data prior to 2005 was not analyzed in order to skip the influence from the initial condition. Figure 9A shows the cumulative storage change, the monthly storage change, and the monthly pumpage. The average monthly net gain in aquifer storage was estimated about three million m3. By the end of 2014, groundwater storage gain was estimated 350 million m3 with respect to the initial storage in January 2005. However, this storage gain was not significant, on average about 1-mm groundwater level increase across the entire domain per year. The storage increase is likely attributed to groundwater recharge increase and pumping decrease. Groundwater recharge to the Chicot aquifer in 2004–2015 (Reitz and Sanford, 2019b) was estimated about 2.4 times greater than that in 1951–1980 (Wolock, 2003). In addition, groundwater pumping decreased from year 2000 to year 2010 by 18% according to Sargent (2011). The model shows slight decrease in storage during the March-July period due to pumping activities in the rice growing season. The aquifer system is quickly replenished during the non-irrigation season owing to the high transmissivity in the pumping areas (Hartono, 2005). The analysis of annual net groundwater inflows and outflows (Figure 9B) shows that the effect of pumping is virtually counteracted by inflows from boundaries, surficial recharge and rivers.
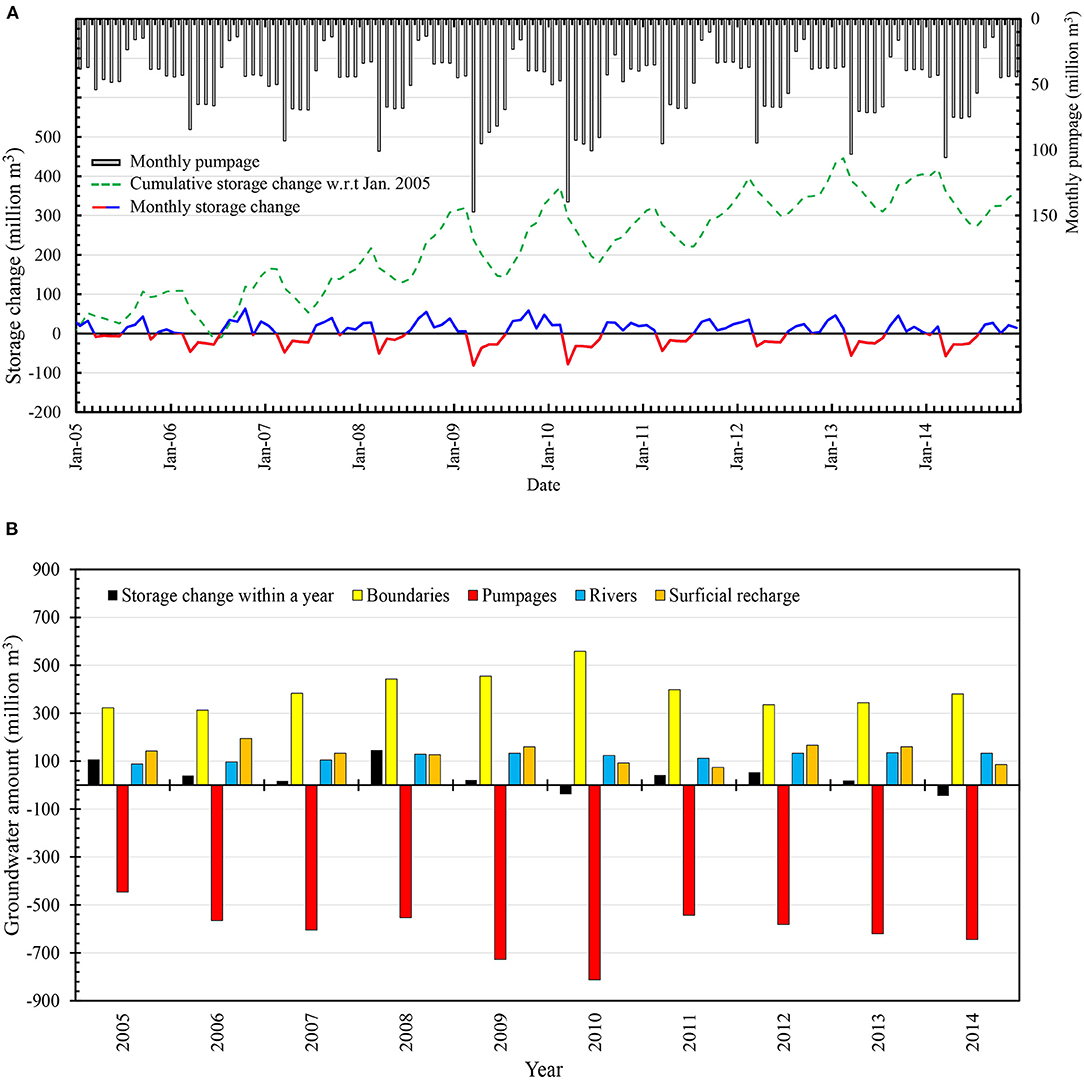
Figure 9. Estimated groundwater budget for the Chicot aquifer system: (A) monthly pumpage (million m3), monthly storage increase/decrease (million m3), and cumulative groundwater storage change (million m3) with respect to January 2005, and (B) annual net groundwater inflow/outflow (million m3) from the model boundaries, the pumping wells, the rivers, and the surficial recharge along with annual groundwater storage change (million m3).
The concept of safe yield or sustainable yield, where groundwater withdrawals do not exceed surficial recharge rate, has been criticized (Alley et al., 2002) and may not be applicable to the Chicot aquifer system. Instead, the concept of “capture” may be proper to explain the sustainability of the Chicot aquifer, where all the contributing factors to the storage change should be taken into account (Bredehoeft, 2002; Zhou, 2009).
Groundwater Level Analysis
The contour map of groundwater levels in 4-m intervals at the end of December 2014 is shown in Figure 10A. The values were calculated by averaging groundwater levels vertically along different model layers. The groundwater level varies from 40 m above the vertical datum NAVD 88 in the north to 20 m below the NAVD 88 in the industrial area. There are two cones of depression. One is in the agricultural area in the east and the other is in the industrial area in the west. The groundwater level distribution pattern in Figure 10A aligns well with the USGS reports (Fendick and Nyman, 1987; Lovelace et al., 2004).
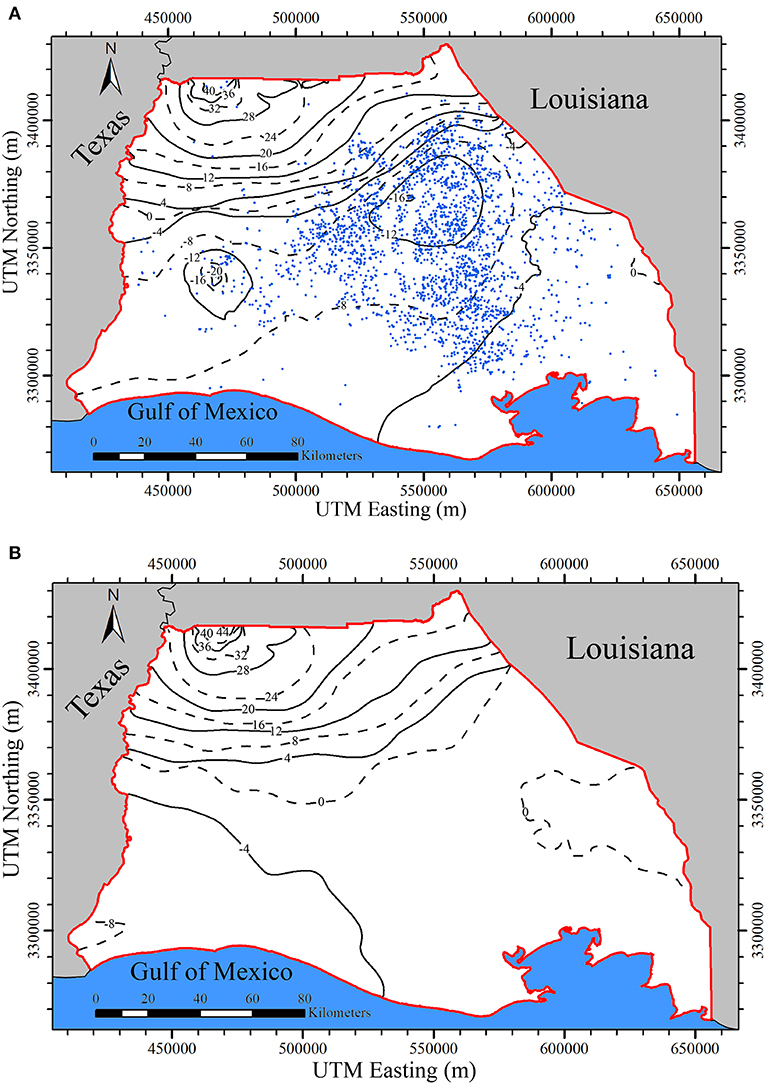
Figure 10. Groundwater level map of December 31, 2014 for the Chicot aquifer domain: (A) with pumping, and (B) without pumping. The groundwater level datum is NAVD 88.
In order to better understand how the pumping activity has altered the groundwater flow in the predevelopment condition, the groundwater model was run without pumping. Figure 10B shows the contour map of groundwater levels at the end of December 2014. The groundwater level pattern resembles the predevelopment groundwater levels according to Martin and Whiteman (1989). The differences between Figures 10A and 10B imply that the pumping activity has reversed the groundwater flow from a gulfward direction to a landward direction. As Jasechko et al. (2020) has shown, the saltwater intrusion in Southwest Louisiana can be connected to groundwater level decline in inland areas. However, the origin of the salt water is not the Gulf of Mexico as they argued. Indeed, since the sand beds of the Chicot aquifer system dip at a greater angle than the Continental Shelf slope, a direct connection between the aquifer system and Gulf of Mexico is not possible (Martin and Whiteman, 1989). The salt water in the Chicot aquifer system is of ancient origin when the sea level rose and resulted in landward deposition of marine environments (Weiss, 1990).
To further analyze the groundwater flow pattern in the Chicot aquifer system, the average groundwater levels were obtained in three zones shown in Figure 11. The zones were defined based on the stratigraphy model and groundwater level variations in different model layers. Zone 1 includes the “200-foot” sand, the “500-foot” sand, and the “700-foot” sand in the west. Zone 2 is for the Undifferentiated sand in the central area. Zone 3 includes the Upper Chicot aquifer and Lower Chicot aquifer in the east.
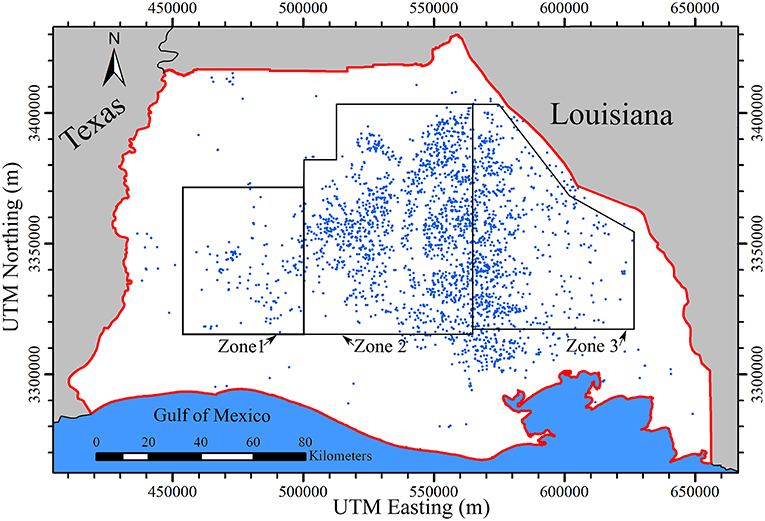
Figure 11. Delineation of three zones, where Zone 1 includes the “200-foot” sand, the “500-foot” sand, and the “700-foot” sand, Zone 2 includes the Undifferentiated sand, and Zone 3 includes the Upper Chicot aquifer and Lower Chicot aquifer. Blue dots are pumping wells.
Monthly average groundwater levels in 2005-2014 in different sand systems are shown in Figure 12A. The average groundwater level in the Undifferentiated sand is always less than that in the Upper Chicot and Lower Chicot aquifers, indicating that groundwater generally flows from the Upper Chicot and Lower Chicot aquifers into the Undifferentiated sand. The heavier pumping in the Upper Chicot sand made the average groundwater level in the Upper Chicot aquifer lower than that in the Lower Chicot aquifer. The seasonal groundwater level decline and recovery in the Upper Chicot aquifer, the Lower Chicot aquifer, and the Undifferentiated sand correspond to the seasonal agriculture pumping. Figure 12A shows fast groundwater level recovery during the non-irrigation season. The low groundwater level variation in the “200-foot” sand, the “500-foot” sand, aind the “700-foot” sand shows that groundwater levels in the west are mildly affected by the agricultural pumping. Figure 12A shows downward gradients from the “200-foot” sand to the 500-foot sand and slight upward gradients from the “700-foot” sand to the “500-foot” sand. This verifies the fact that the “500-foot” sand is the most pumped sand in the west.
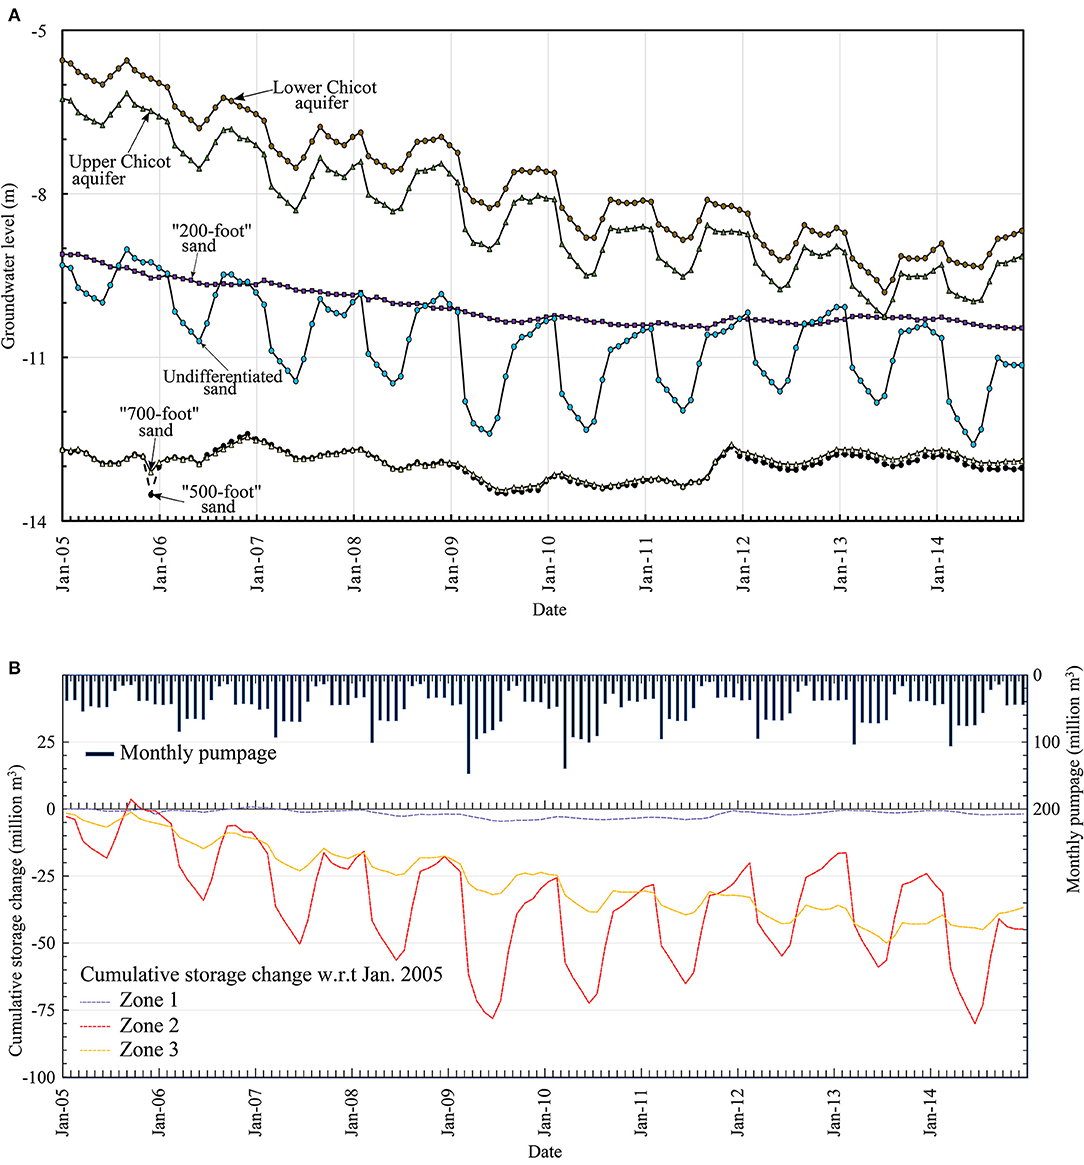
Figure 12. (A) Mean monthly groundwater level (m) in different sands of the Chicot aquifer system from January 2005 to December 2014. The groundwater level datum is NAVD 88, and (B) estimated cumulative groundwater storage change (million m3) with respect to January 2005 for Zone 1, 2, and 3, and monthly pumpage (million m3).
Groundwater depletion in the Chicot aquifer system (Konikow, 2013) mainly occurs in the agricultural zones as shown in Figure 12B, which reflects the groundwater level decline in Figure 12A. By the end of 2014, groundwater storage depletion was estimated about 45 million m3 in the Undifferentiated sand and about 35 million m3 in the Upper Chicot aquifer and the Lower Chicot aquifer with respect to the beginning of 2005. Groundwater storage depletion by the industrial pumping is insignificant during 2005-2014.
A schematic view of flow directions and average flowrates between different sands in 2005 to 2014 is shown in Figure 13. The highest vertical groundwater flows occur between the Upper Chicot aquifer and the Lower Chicot aquifer, and between the “500-foot” sand and the “700-foot” sand. The dominant vertical flow directions indicate that potential salt water may vertically migrate from deep brackish formations to the Upper Chicot in the east and to the “500-foot” sand in the west. The highest horizontal groundwater flows are westward from Zone 3 to Zone 2. The overall horizontal flow is westward.

Figure 13. Flow directions and mean flow rates (m3/day) in 2005–2014 between different sands in the Chicot aquifer system.
The intra-annual monthly average groundwater levels in different sands are shown in Figure 14. The average groundwater levels drop in the Undifferentiated sand, Upper Chicot aquifer, and Lower Chicot aquifer during the rice irrigation season, which accords with the fact that most of the wells in these sands are for rice irrigation. However, the relatively stable average monthly groundwater levels in the “200-foot” sand, the “500-foot” sand, and the “700-foot” sand were due to the year-round continuous groundwater pumping by the industries.
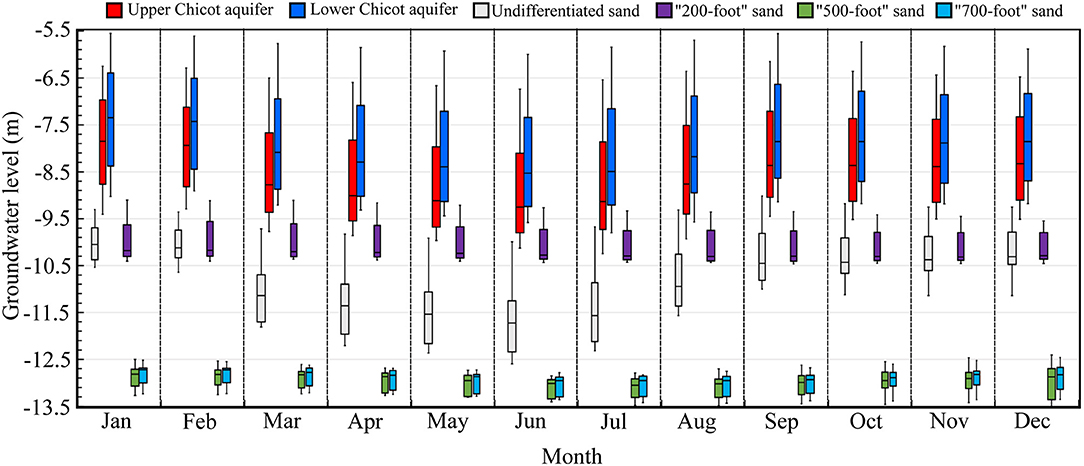
Figure 14. Intra-annual monthly groundwater level variation for different sands in the Chicot aquifer system from 2005 to 2014. The groundwater level datum is NAVD 88.
Conclusions
The methodology in this study is able to take into account structural dip information, build realistic groundwater models using big well log datasets and reveal aquifer complexity. The methodology was successfully applied to discovering Chicot aquifer complexity and developing a detailed Chicot groundwater model for the agriculture-intensive southwestern Louisiana, where the Chicot aquifer system is under high stress by irrigation pumping. More than 29,000 well logs in Southwest Louisiana were interpreted and prioritized. Prioritizing electrical logs, well screens, and drillers' logs in this order helps reduce errors in the lithofacies modeling as electrical logs have better quality than drillers' logs. The developed Chicot model is one of few models that reveals hydrogeological complexity in the Coastal Lowlands aquifer system.
The Chicot stratigraphy model reveals that the aquifer system consists of highly interconnected sand units and outcrops in the north. Central and southern areas are covered by clays thickening toward the Gulf of Mexico. Sand units are relatively thin in the north and are frequently interbedded by clays. Sand units are thick in the central and southern areas. The Upper Chicot aquifer and the Lower Chicot aquifer are interconnected in the east. The “200-foot” sand, the “500-foot” sand, and “700-foot” sand are interconnected in the west. The Undifferentiated sand is thick in the central area. These aquifers are laterally connected.
The groundwater modeling result shows that the storage loss due to groundwater pumping in the Chicot aquifer system is offset by inflows from surficial recharge, rivers and boundaries. The two large cones of depression created by the agricultural pumping in the east and by the industrial pumping in the west represent the key feature in the Chicot aquifer system. The storage loss occurs during the rice irrigation season. The aquifer system can be quickly replenished by the inflows during the non-irrigation season. The storage of the Chicot aquifer system was estimated to slightly increase during the period 2005–2014.
The groundwater model shows that groundwater levels in the Lower Chicot aquifer, the Upper Chicot aquifer, the Undifferentiated sand are heavily impacted by the seasonal irrigation activities and result in groundwater storge depletion. On the contrary, groundwater levels in the “200-foot” sand, the “500-foot” sand, and “700-foot” sand have less variability. In other words, groundwater levels in the west are not heavily impacted by the irrigation activities.
The groundwater model indicates large amounts of upward vertical flows from the Lower Chicot aquifer to the Upper Chicot aquifer and from the “700-foot” sand to the “500-foot” sand. As salt water was reported at the base of the Chicot aquifer system, potential saltwater intrusion due to vertical saltwater migration from the deeper sands is likely to occur in the future.
Data Availability Statement
The original contributions presented in the study are included in the article/Supplementary Material, further inquiries can be directed to the corresponding author/s.
Author Contributions
HV-A and FT contributed to conception and design of the study. DB and KP contributed to the pumping database. FT organized the database. HV-A performed the model development. HV-A and FT performed analysis. All authors contributed to manuscript preparation, read, and approved the submitted version.
Funding
This study was funded in part by the Louisiana Sea Grant College Program as part of Program Project ID R/CRM – 02 under NOAA Award NA18OAR4170098, the U.S. Geological Survey under Grant/Cooperative Agreement No. G16AP00056, and the U.S. National Science Foundation under Award No. 2019561.
Conflict of Interest
The authors declare that the research was conducted in the absence of any commercial or financial relationships that could be construed as a potential conflict of interest.
Acknowledgments
The Louisiana State University High Performance Computing (HPC) is acknowledged for providing a supercomputer facility for this study. USGS is acknowledged for providing industrial and public supply pumping data.
Supplementary Material
The Supplementary Material for this article can be found online at: https://www.frontiersin.org/articles/10.3389/frwa.2021.623476/full#supplementary-material
References
Aarts, E. H., and van Laarhoven, P. J. (1987). “Simulated annealing: a pedestrian review of the theory and some applications,” in Pattern Recognition Theory and Applications. NATO ASI Series (Series F: Computer and Systems Sciences), Vol. 30, eds Devijver P.A., Kittler J, (Berlin: Springer). doi: 10.1007/978-3-642-83069-3_15
Abd-Elhamid, H. F., and Javadi, A. A. (2011). A cost-effective method to control seawater intrusion in coastal aquifers. Water Res. Manag. 25, 2755–2780. doi: 10.1007/s11269-011-9837-7
Alley, W. M., Healy, R. W., LaBaugh, J. W., and Reilly, T. E. (2002). Flow and storage in groundwater systems. Science 296, 1985–1990. doi: 10.1126/science.1067123
Alley, W. M., and Leake, S. A. (2004). The journey from safe yield to sustainability. Groundwater 42, 12–16. doi: 10.1111/j.1745-6584.2004.tb02446.x
Archie, G. E. (1942). The electrical resistivity log as an aid in determining some reservoir characteristics. Transactions AIME 146, 54–62. doi: 10.2118/942054-G
Azizi, F., Vadiati, M., Moghaddam, A. A., Nazemi, A., and Adamowski, J. (2019). A hydrogeological-based multi-criteria method for assessing the vulnerability of coastal aquifers to saltwater intrusion. Environ. Earth Sci. 78:548. doi: 10.1007/s12665-019-8556-x
Barlow, P. M., and Reichard, E. G. (2010). Saltwater intrusion in coastal regions of North America. Hydrogeol. J. 18, 247–260. doi: 10.1007/s10040-009-0514-3
Berg, S. J., and Illman, W. A. (2015). Comparison of hydraulic tomography with traditional methods at a highly heterogeneous site. Groundwater 53, 71–89. doi: 10.1111/gwat.12159
Bocanegra, E., Da Silva, G. C., Custodio, E., Manzano, M., and Montenegro, S. (2010). State of knowledge of coastal aquifer management in South America. Hydrogeol. J. 18, 261–267. doi: 10.1007/s10040-009-0520-5
Borrok, D. M., and Broussard, W. P. III. (2016). Long-term geochemical evaluation of the coastal Chicot aquifer system, Louisiana, USA. J. Hydrol. 533, 320–331. doi: 10.1016/j.jhydrol.2015.12.022
Bredehoeft, J. D. (2002). The water budget myth revisited: why hydrogeologists model. Groundwater 40, 340–345. doi: 10.1111/j.1745-6584.2002.tb02511.x
Cao, G., Zheng, C., Scanlon, B. R., Liu, J., and Li, W. (2013). Use of flow modeling to assess sustainability of groundwater resources in the North China Plain. Water Resour. Res. 49, 159–175. doi: 10.1029/2012WR011899
Chai, T., and Draxler, R. R. (2014). Root mean square error (RMSE) or mean absolute error (MAE)? Arguments against avoiding RMSE in the literature. Geoscientific Model Dev. 7, 1247–1250. doi: 10.5194/gmd-7-1247-2014
Chang, Y. S., and Park, H. D. (2004). Development of a web-based geographic information system for the management of borehole and geological data. Comp. Geosci. 30, 887–897. doi: 10.1016/j.cageo.2004.07.006
Cheng, T. (2013). Accelerating universal Kriging interpolation algorithm using CUDA-enabled GPU. Comp. Geosci. 54, 178–183. doi: 10.1016/j.cageo.2012.11.013
Chesnaux, R., Lambert, M., Walter, J., Fillastre, U., Hay, M., Rouleau, A., et al. (2011). Building a geodatabase for mapping hydrogeological features and 3D modeling of groundwater systems: application to the Saguenay–Lac-St.-Jean region, Canada. Comp. Geosci. 37, 1870–1882. doi: 10.1016/j.cageo.2011.04.013
Christelis, V., and Mantoglou, A. (2016). Coastal aquifer management based on the joint use of density-dependent and sharp interface models. Water Res. Manag. 30, 861–876. doi: 10.1007/s11269-015-1195-4
Clevis, Q., Tucker, G. E., Lancaster, S. T., Desitter, A., Gasparini, N., and Lock, G. (2006). A simple algorithm for the mapping of TIN data onto a static grid: applied to the stratigraphic simulation of river meander deposits. Comp. Geosci. 32, 749–766. doi: 10.1016/j.cageo.2005.05.012
Cousquer, Y., Pryet, A., Flipo, N., Delbart, C., and Dupuy, A. (2017). Estimating river conductance from prior information to improve surface-subsurface model calibration. Groundwater 55, 408–418. doi: 10.1111/gwat.12492
Custodio, E. (2010). Coastal aquifers of Europe: an overview. Hydrogeol. J. 18, 269–280. doi: 10.1007/s10040-009-0496-1
Daniel, D. E. (1984). Predicting hydraulic conductivity of clay liners. J. Geotech. Eng. 110, 285–300. doi: 10.1061/(ASCE)0733-9410(1984)110:2(285)
Danielsen, J. E., Dahlin, T., Owen, R., Mangeya, P., and Auken, E. (2007). Geophysical and hydrogeologic investigation of groundwater in the Karoo stratigraphic sequence at Sawmills in northern Matabeleland, Zimbabwe: a case history. Hydrogeol. J. 15, 945–960. doi: 10.1007/s10040-007-0191-z
Doherty, J. E., Fienen, M. N., and Hunt, R. J. (2010). Approaches to Highly Parameterized Inversion: Pilot-Point Theory, Guidelines, and Research Directions. U.S. Geological Survey Scientific Investigations Report 2010–5168, 36. doi: 10.3133/sir20105168
Dorigo, M., and Di Caro, G. (1999). “Ant colony optimization: a new meta-heuristic,” in Proceedings of the 1999 Congress on Evolutionary Computation-CEC99 (Cat. No. 99TH8406) (IEEE), 1470–1477.
Eggleston, J., and Pope, J. (2013). Land subsidence and relative sea-level rise in the southern Chesapeake Bay region. US Geol. Survey Circular 1392:30. doi: 10.3133/cir1392
Elshall, A. S., Pham, H. V., Tsai, F. T.-C., Yan, L., and Ye, M. (2015). Parallel inverse modeling and uncertainty quantification for computationally demanding groundwater-flow models using covariance matrix adaptation. J. Hydrologic Eng. 20, 04014087. doi: 10.1061/(ASCE)HE.1943-5584.0001126
Elshall, A. S., Tsai, F. T.-C., and Hanor, J. S. (2013). Indicator geostatistics for reconstructing Baton Rouge aquifer-fault hydrostratigraphy, Louisiana, USA. Hydrogeol. J. 21, 1731–1747. doi: 10.1007/s10040-013-1037-5
Fendick, R. B. Jr., and Nyman, D. J. (1987). Louisiana ground-water map no. 1: potentiometric surface, 1985, and water-level changes, 1983-85, of the Chicot aquifer in southwestern Louisiana, Water-Resources Investigations Report 86-4348. US Geological Survey.
Galloway, W. E. (1977). Catahoula Formation of the Texas Coastal Plain: depositional systems, composition, structural development, ground-water flow history, and uranium distribution, Report of Investigations No. 87. Bureau of Economic Geology, The University of Texas at Austin. doi: 10.2172/7301167
Guo, H., Zhang, Z., Cheng, G., Li, W., Li, T., and Jiao, J. J. (2015). Groundwater-derived land subsidence in the North China Plain. Environ. Earth Sci. 74, 1415–1427. doi: 10.1007/s12665-015-4131-2
Hansen, N., Müller, S. D., and Koumoutsakos, P. (2003). Reducing the time complexity of the derandomized evolution strategy with covariance matrix adaptation (CMA-ES). Evol. Comput. 11, 1–18. doi: 10.1162/106365603321828970
Harbaugh, A. W. (2005). “MODFLOW-2005, The U.S. Geological Survey Modular Ground-Water Model: the ground-water flow process,” in: Modeling techniques, Book 6, section A, (Reston, VA US Geological Survey), 253. doi: 10.3133/tm6A16
Hartono, S. (2005). Spatial and temporal estimation of pumping and recharge in groundwater system analysis (Doctoral dissertation), Louisiana State University, Baton Rouge, Louisiana, US. Available online at: https://digitalcommons.lsu.edu/gradschool_dissertations/309
Jasechko, S., Perrone, D., Seybold, H., Fan, Y., and Kirchner, J. W. (2020). Groundwater level observations in 250,000 coastal US wells reveal scope of potential seawater intrusion. Nat. Commun. 11, 1–9. doi: 10.1038/s41467-020-17038-2
Johnson, A. I. (1967). Specific yield: Compilation of specific yields for various materials. U.S. Geological Survey, Water Supply Paper 1662-D. Washington, DC: U.S. Government Printing Office. doi: 10.3133/wsp1662D
Johnson, N. M., and Dreiss, S. J. (1989). Hydrostratigraphic interpretation using indicator geostatistics. Water Resour. Res. 25, 2501–2510. doi: 10.1029/WR025i012p02501
Jones, P. H., Hendricks, E. L., and Irelan, B. (1956). Water resources of southwestern Louisiana, Water Supply Paper 1364. US Government Printing Office, 460 pp. Available online at: https://pubs.er.usgs.gov/publication/wsp1364
Konikow, L. F. (2013). Groundwater depletion in the United States (1900–2008): U.S. Geological Survey Scientific Investigations Report 2013–5079, 63 p., Available online at: http://pubs.usgs.gov/sir/2013/5079. doi: 10.3133/sir20135079
Kostic, B., Becht, A., and Aigner, T. (2005). 3-D sedimentary architecture of a Quaternary gravel delta (SW-Germany): implications for hydrostratigraphy. Sediment. Geol. 181, 147–171. doi: 10.1016/j.sedgeo.2005.07.004
Kumar, M., Husian, M., Upreti, N., and Gupta, D. (2010). Genetic algorithm: review and application. Int. J. Inform. Technol. Knowledge Manage. 2, 451–454. doi: 10.2139/ssrn.3529843
Lee, S. Y., Carle, S. F., and Fogg, G. E. (2007). Geologic heterogeneity and a comparison of two geostatistical models: sequential gaussian and transition probability-based geostatistical simulation. Adv. Water Resour. 30, 1914–1932. doi: 10.1016/j.advwatres.2007.03.005
Loucks, D. P. (2000). Sustainable water resources management. Water Int. 25, 3–10. doi: 10.1080/02508060008686793
Lovelace, J. K., Jared, W., Fontenot, C., and Paul, F. (2004). Withdrawals, water levels, and specific conductance in the Chicot aquifer system in southwestern Louisiana, 2000-03, Scientific Investigations Report 2004-5212. U.S. Geol. Survey. doi: 10.3133/sir20045212
Marinoni, O. (2003). Improving geological models using a combined ordinary–indicator kriging approach. Eng. Geol. 69, 37–45. doi: 10.1016/S0013-7952(02)00246-6
Martin, A., and Whiteman, C. D. (1989). Geohydrology and regional ground-water flow of the Coastal Lowlands aquifer system in parts of Louisiana, Mississippi, Alabama, and Florida–a preliminary analysis. Department of the Interior, US Geological Survey. Series number: 8–4100.
McCulloh, R. P., and Heinrich, P. V. (2013). Surface faults of the south Louisiana growth-fault province. Geol. Soc. Am. Special Papers 493, 37–49. doi: 10.1130/2012.2493(03)
Nyman, D. J., Halford, K. J., and Martin, A. Jr. (1990). Geohydrology and simulation of flow in the Chicot aquifer system of Southwest Louisiana, Water Resources Technical Report 50. Louisiana Department of Transportation and Development, 65.
Pardo-Iguzquiza, E., and Dowd, P. A. (1998). The second-order stationary universal kriging model revisited. Math. Geol. 30, 347–378. doi: 10.1023/A:1021740123100
Parizi, E., Hosseini, S. M., Ataie-Ashtiani, B., and Simmons, C. T. (2019). Vulnerability mapping of coastal aquifers to seawater intrusion: review, development and application. J. Hydrol. 570, 555–573. doi: 10.1016/j.jhydrol.2018.12.021
Pham, H. V., and Tsai, F. T.-C. (2017). Modeling complex aquifer systems: a case study in Baton Rouge, Louisiana (USA). Hydrogeol. J. 25, 601–615. doi: 10.1007/s10040-016-1532-6
Poli, R., Kennedy, J., and Blackwell, T. (2007). Particle swarm optimization. Swarm Intelligence 1, 33–57. doi: 10.1007/s11721-007-0002-0
Quintana, D. S. Z., Rentería, C. M. L., Vega, N. E. M., Peralta, J. E., and Contreras, L. E. V. (2018). Sustainability strategies for coastal aquifers: a case study of the Hermosillo Coast aquifer. J. Clean. Prod. 195, 1170–1182. doi: 10.1016/j.jclepro.2018.05.191
Rahman, A., Tsai, F. T.-C., White, C. D., Carlson, D. A., and Willson, C. S. (2008). Geophysical data integration, stochastic simulation and significance analysis of groundwater responses using ANOVA in the Chicot Aquifer system, Louisiana, USA. Hydrogeol. J. 16, 749–764. doi: 10.1007/s10040-007-0258-x
Reitz, M., and Sanford, W. E. (2019a). Estimating quick-flow runoff at the monthly timescale for the conterminous United States. J. Hydrol. 573, 841–854. doi: 10.1016/j.jhydrol.2019.04.010
Reitz, M., and Sanford, W. E. (2019b). Modern monthly effective recharge maps for the conterminous U.S., 2003-2015. U.S. Geological Survey data release.
Rios, L. M., and Sahinidis, N. V. (2013). Derivative-free optimization: a review of algorithms and comparison of software implementations. J. Global Optimization 56, 1247–1293. doi: 10.1007/s10898-012-9951-y
Ross, M., Parent, M., and Lefebvre, R. (2005). 3D geologic framework models for regional hydrogeology and land-use management: a case study from a Quaternary basin of southwestern Quebec, Canada. Hydrogeol. J. 13, 690–707. doi: 10.1007/s10040-004-0365-x
Sargent, B. P. (2004). Thickness of the Chicot aquifer system surficial confining unit and location of Shallow sands, Southwestern Louisiana. Louisiana Department of Transportation and Development, Water Resources Technical Report 73. 34.
Sargent, B. P. (2011). Water use in Louisiana, 2010. Louisiana Department of Transportation and Development. 136.
Smoot, C. W. (1986). Louisiana hydrologic atlas map no. 2: Areal extent of freshwater in major aquifers of Louisiana: U.S. Geological Survey Water-Resources Investigations Report 86-4150, 1 sheet.
Soares, A. (1990). Geostatistical estimation of orebody geometry: morphological kriging. Math. Geol. 22, 787–802. doi: 10.1007/BF00890663
Sreekanth, J., and Datta, B. (2015). Simulation-optimization models for the management and monitoring of coastal aquifers. Hydrogeol. J. 23, 1155–1166. doi: 10.1007/s10040-015-1272-z
Tartakovsky, D. M., Wohlberg, B., and Guadagnini, A. (2007). Nearest-neighbor classification for facies delineation. Water Resour. Res. 43:W07201. doi: 10.1029/2007WR005968
Tsai, F. T.-C., and Li, X. (2009). “Conditional estimation of distributed hydraulic conductivity in groundwater inverse modeling: indicator-generalized parameterization and natural neighbors,” in Practical Hydroinformatics. Water Science and Technology Library, vol 68, Abrahart, R.J., See, L.M., Solomatine, D.P. (Berlin: Springer).
USEPA (2019). Overview of the Drinking Water Sole Source Aquifer Program. U.S. Environmental Protection Agency. Retrieved from: https://www.epa.gov/dwssa/overview-drinking-water-sole-source-aquifer-program#What_Is_SSA
Vahdat-Aboueshagh, H., and Tsai, F. T. C. (2021). Constructing large-scale complex aquifer systems with big well log data: Louisiana model. Comp. Geosci. 148:104687. doi: 10.1016/j.cageo.2021.104687
Watson, D. (1999). The natural neighbor series manuals and source codes. Comp. Geosci. 25, 463–466. doi: 10.1016/S0098-3004(98)00150-2
Weiss, J. S. (1990). Geohydrologic units of the coastal lowlands aquifer system, south-central United States, Open-File Report 90-173. Department of the Interior, U.S. Geological Survey; Books and Open-File Reports Section, 34 pp. doi: 10.3133/ofr90173
Williams, C. B., and Duex, T. W. (1995). A hydrogeological study of the Chicot aquifer in Lafayette Parish, Louisiana. Gulf Coast Assoc. Geol. Soc. Transactions 45, 165–172.
Wolock, D. M. (2003). Estimated mean annual natural ground-water recharge in the conterminous United States. Open-File Report 2003-311, U.S. Geol. Survey, Reston, VA. doi: 10.3133/ofr03311
Younger, P. L. (1993). Simple generalized methods for estimating aquifer storage parameters. Quarterly J. Eng. Geol. Hydrogeol. 26, 127–135. doi: 10.1144/GSL.QJEG.1993.026.02.04
Zhang, H., Harter, T., and Sivakumar, B. (2006). Nonpoint source solute transport normal to aquifer bedding in heterogeneous, Markov chain random fields. Water Resour. Res. 42:W06403. doi: 10.1029/2004WR003808
Keywords: groundwater, modeling, big data, stratigraphy, water budget, well logs
Citation: Vahdat-Aboueshagh H, Tsai FT-C, Bhatta D and Paudel KP (2021) Irrigation-Intensive Groundwater Modeling of Complex Aquifer Systems Through Integration of Big Geological Data. Front. Water 3:623476. doi: 10.3389/frwa.2021.623476
Received: 30 October 2020; Accepted: 09 March 2021;
Published: 06 April 2021.
Edited by:
Anis Younes, Université de Strasbourg, FranceReviewed by:
Philippe Ackerer, Délégation Alsace (CNRS), FranceMohammad Mahdi Rajabi, Tarbiat Modares University, Iran
Copyright © 2021 Vahdat-Aboueshagh, Tsai, Bhatta and Paudel. This is an open-access article distributed under the terms of the Creative Commons Attribution License (CC BY). The use, distribution or reproduction in other forums is permitted, provided the original author(s) and the copyright owner(s) are credited and that the original publication in this journal is cited, in accordance with accepted academic practice. No use, distribution or reproduction is permitted which does not comply with these terms.
*Correspondence: Frank T.-C. Tsai, ZnRzYWlAbHN1LmVkdQ==