 Haitham A. Saad
 Emad H. Habib*
- Department of Civil Engineering, Louisiana Watershed Flood Center, University of Louisiana at Lafayette, Lafayette, LA, United States
The current study investigates the effect of large-scale channel modifications via riverine dredging on flood dynamics in low-gradient river systems located in inland-coastal flood transition zones. The study site is the Vermilion River in south Louisiana, US, which is characterized by complex flow regimes, reversal and bi-directional flows, presence of large swamps with significant river-swamp interactions, and large volumes of runoff contributions from lateral tributaries. The study aims to understand the interplay of these factors and how they modulate and get affected by different dredging approaches that vary in spatial extent and the modifications introduced to the channel. The study deploys a hybrid, one-/two-dimensional (1D/2D), hydrodynamic model that simulates flow and stage dynamics in the main river and its major tributaries, as well as the flow exchanges with the interconnected swamp system. Overall, the results show that the dredging activities can significantly alter the flow regime in the watershed and affect flow exchanges between the river and the swamp system. In terms of flooding impact, only dredging approaches that are extensive in spatial extent and modifications to channel longitudinal slope can result in sizeable reductions in flood stages. However, these benefits come at the expense of significant increases in the amplitude and inland propagation of the Gulf tidal wave. On the other hand, less-extensive dredging can still provide moderate and spatially limited flood mitigation; however, they further expose downstream communities to increased levels of flooding, especially during more frequent events. The results reveal that while dredging can increase the hydraulic conveyance of the river system, the large runoff volumes delivered by the urbanized tributaries seem to outweigh the added improvement in the in-channel storage, thus reducing the anticipated flood relief. The results suggest that a watershed-centered approach, instead of a riverine-centered approach is needed for flood management in these systems so that the relative benefits and tradeoffs of different mitigation alternatives can be examined.
Introduction
Watersheds that are located in inland-coastal transition zones (Bilskie and Hagen, 2018) are increasingly subject to extreme flooding due to both man-made alterations and natural processes. Examples of such processes include compound inland and coastal storms, accelerated relative sea-level rise, and increased population and urbanization (Crossett et al., 2013; NCEI, 2020). Flooding in these areas is further exacerbated by the typical low gradients that characterize the main rivers and their tributaries. Flow regimes under low-gradient conditions typically lead to channel sedimentation and reduction of the channel conveyance capacity, and thus an increase in fluvial flooding during moderate and extreme storms.
Flood mitigation measures are often sought in these regions to alleviate the impact of riverine-induced flooding. One of the traditional and most common flood mitigation practices in coastal watersheds is watercourse dredging or channelization (Liao et al., 2019). Dredging refers to activities that include any combination of removing instream and riparian sediment and vegetation, modifying channel width, depth, and gradient, and straightening the river (Hooke, 1990). By structurally altering one or more of the hydraulic variables that govern channel flow and its conveyance capacity (e.g., slope, depth, width, roughness), the water stages are typically decreased, which can reduce the spatial extent of the flood inundation and the associated flood risk.
Early studies on watercourse dredging provided empirical and theoretical evidence that channelization, if appropriately designed to prevent the bank erosion and channel silting, can be quite effective as a flood mitigation measure (Nunnally, 1978; Shankman and Pugh, 1992). However, recent feasibility studies examined potential dredging scenarios for tidally-dominated sections of coastal rivers in southwest UK and demonstrated that dredging did not lower the peak flood levels significantly during winter storms (Webster et al., 2014). The study showed that the shape of the river cross-section and the heights of the riverbanks played a significant role in determining the actual flood level reduction. Other studies showed that dredging can have unintended consequences in other parts of the watershed, especially in the downstream communities. For example, Prestegaard et al. (1994) reported that areas downstream of a modified section of the Raccoon River in Iowa had experienced higher-magnitude floods compared to sections from rivers that have upstream similarly-sized drainage areas. Rose and Peters (2001) showed that channel cross-section enlargement increases the flood wave velocity, thereby speeding the arrival time of flood peaks downstream.
Other studies have focused primarily on the adverse effects of channelization on water quality (Schoof, 1980), ecological alterations of the stream and the riparian corridor (Juan et al., 2020), and stream degradation (Pierce and King, 2013). Another potential aspect of river dredging activities is the effect on tidal propagation. Cai et al. (2012) applied an analytical model to show that a reduction in river discharge and degradation of the riverbed both lead to a significant reduction in the travel time of the tidal wave. The study also highlighted that the amplification of the tidal amplitude, as a result of dredging, could facilitate the penetration of storm surges into the estuary. Likewise, Ralston et al. (2019) studied the effect of dredging on New York Harbor and the tidal Hudson River and found that such modification doubled the tidal amplitude and increased the landward conveyance of coastal storm surge.
While dredging can increase the hydraulic efficiency of river channels and potentially reduce overbank flooding, the impact on flow hydrodynamics and the overall flooding regime needs to be better understood, especially in watersheds that are located within inland-coastal transition zones. In such regions, river systems are typically characterized with complex flow dynamics due to factors, such as flow reversals and bi-directional flows (e.g., Burton and Demas, 2016; Watson et al., 2017), dynamic connectivity and flow exchanges with large natural storage areas, such as swamps and wetlands (Saad et al., 2020); tidal influences, and the large volumes of synchronized tributary flows from urbanized sub-watersheds (e.g., Pattison et al., 2014; Wang et al., 2019). The complexity of flow regimes in these regions has implications for flood mitigation; therefore, it is imperative to develop a comprehensive understanding of the impacts of riverine dredging that emerge as a possible mitigation strategy in response to decreased channel capacities and increased flood risk. This study deploys a hydrodynamic model to investigate the various impacts of channel dredging and their implications for flood mitigation and how it may alter the overall flow regime. The study site is in the Vermilion River in southern Louisiana, US, a representative of low-gradient tidally-influenced river systems that are located in flood transition zones. The study focuses on understanding the effect on flow regime and reduction in water surface elevations under a suite of dredging approaches that represent varying degrees of channel cross-sectional modifications, changes to the riverbed slope, and the spatial extent of the dredging along the river. The analysis will be performed for different storm conditions (e.g., 10-year and >100-year return periods) to assess the dependence on the storm magnitude and the amount of runoff generated in the watershed. A special attention is given to how dredging may also alter the river-swamp interactions. Swamps, which are a common feature in low-gradient coastal watersheds, play a significant role in flood mitigation and provide flood relief in large river basins (Wu et al., 2020). The scientific literature shows a need for understanding the impact of riverine dredging on flow exchanges with swamp areas and their ecosystem viability. Given the direct connection with the Gulf of Mexico, the analysis will also examine the effects of the spatial location and extent of the dredging on the amplitude and propagation of the tidal wave along the river. Besides the main river, it is also of importance to assess the propagation of any potential flood mitigation benefits into the tributaries that are connected to the river. Unlike most previous studies that depended on 1-dimensional (1D) hydraulic modeling in simulating pre- and post-dredging conditions, the current study utilizes a hybrid 1D/2D approach that allows for more accurate representation of the flow dynamics in low-gradient complex river systems (Saad et al., 2020).
Methods
Study Area
The Vermilion River is a tidally-influenced river located in south central Louisiana, US, and has a watershed that covers an area of about 1,560 km2 (Figure 1). The Vermilion River basin, a representative of other low-gradient inland-coastal transitional basins (Bilskie and Hagen, 2018), has a long history of severe flooding since the major flood that occurred in August 1940 until the most recent in August 2016 (USACE, 1995; Watson et al., 2017). The river starts at the confluence of Bayou Bourbeux and Bayou Fusilier, after which it travels ~115 km until it intersects with the Gulf Intracoastal Waterway (GIWW). The river eventually drains into the Gulf of Mexico through the Vermilion Bay. The river functions as a major artery that collects runoff from many intersecting lateral tributaries, locally referred to as coulees (Kim et al., 2012). The Vermilion River receives flow diversions from another river in the east, Bayou Teche, through Bayou Fusilier and Ruth Canal (Figure 1). Flow diversions are regulated through a concrete weir and a manually-operated gate that permits about 25% the flow of Bayou Teche to be diverted during non-flood conditions (Baker, 1988).
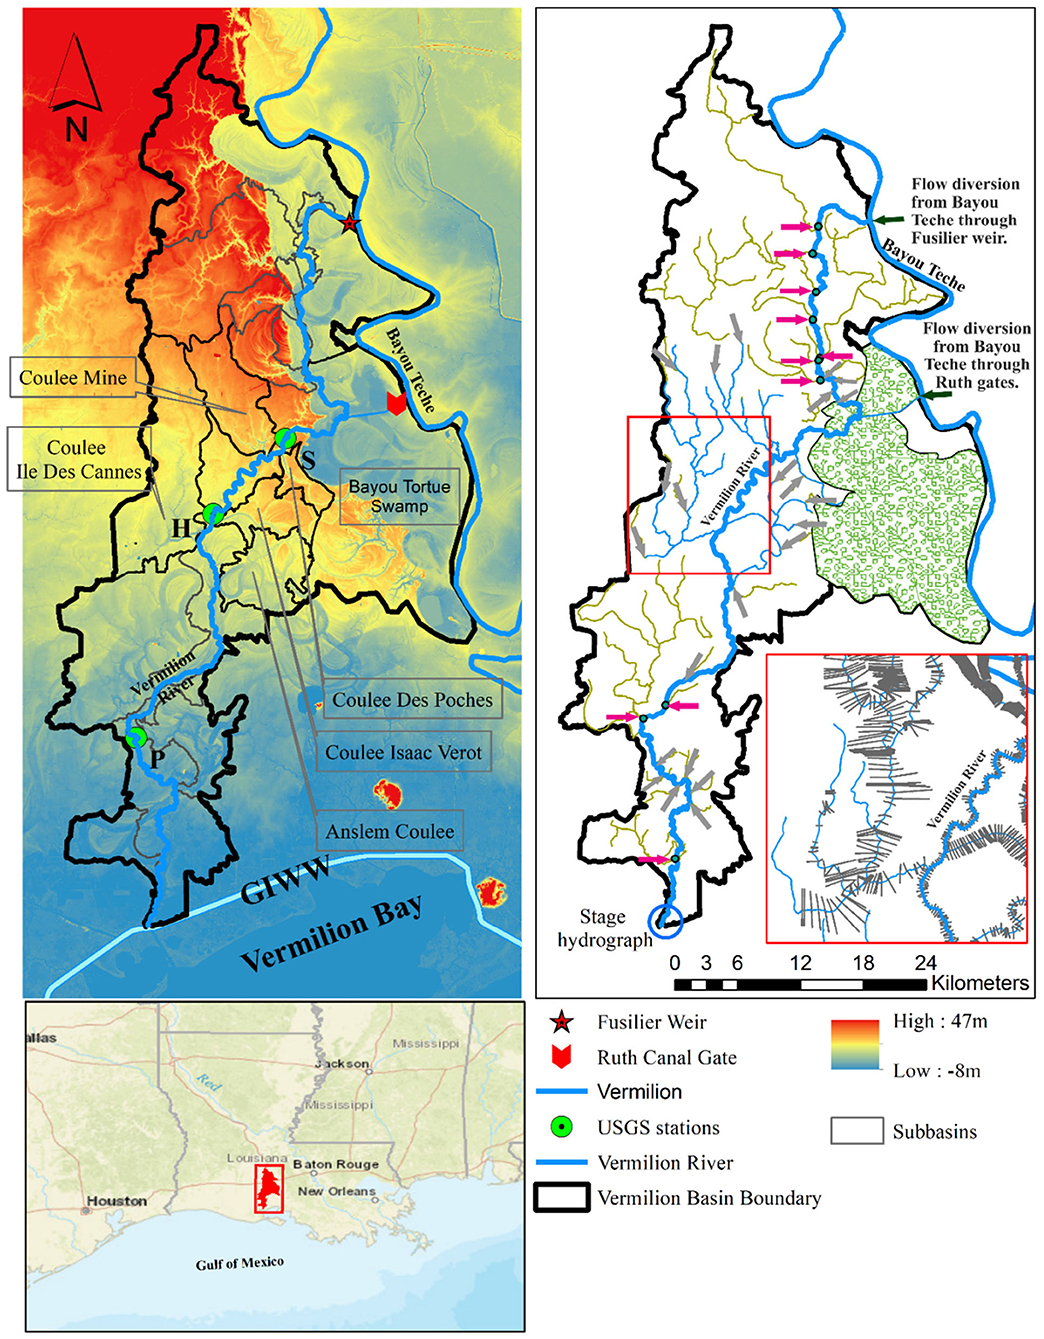
Figure 1. (Left) Digital elevation model of the Vermilion watershed in south Louisiana, US. The five lateral tributaries (coulees) that are simulated in the hydrodynamic model are shown. Locations of USGS gauges are also shown (S: Surrey, H: HYW733 and P: Perry). (Right) Stream network of the Vermillion River and its 15 tributaries. Streams in blue represent the main river and the five tributaries that are explicitly simulated in the hydrodynamic model as 1D reaches. Gray arrows indicate locations of NWM streamflow hydrographs that feed the upstream ends of the five tributaries. Streams in green represent the other 10 tributaries that were not explicitly simulated in the hydrodynamic model. NWM streamflow hydrographs at the outlets of the 10 tributaries were directly provided into the main river (red arrows). The model is forced by a stage hydrograph at its most downstream boundary and by two upstream streamflow hydrographs that capture flow diversions from Bayou Teche through Ruth Canal gates and Fuselier Weir. The swamp area (hatched) is represented in the model using a 2D setup and is enforced by direct rainfall-over-grid from the Stage IV radar-rainfall product. The inset in the right panel shows an example representation of channel cross sections used in the 1D hydrodynamic simulations.
A major feature that adds complexity to flood dynamics in the basin is a series of inter-connected swamps and lakes, locally known as the Bayou Tortue Swamp and Lake Martin (Figure 1) that occupy a large area of the watershed (~35.2 km2). These swamps function as a natural storage area by accepting reverse flows (i.e., flow traveling upstream) from the Vermilion River. During low and normal river stages, the river collects inflows from its tributaries and travels downstream (south) toward the bay. However, during extreme flooding events, the river becomes bidirectional and shows a reverse flow toward the north where it drains into the Bayou Tortue swamps. The division point between downstream flows (toward the Vermilion Bay) and upstream flows (toward the Bayou Tortue swamps) depends on the severity of the flooding event. During high-frequency events, the bidirectional flow often initiates where one of the main tributaries, Coulee Mine, enters the river (Figure 1). If the storm event is extreme enough, a further downstream change in bidirectional flow division may occur where two other major tributaries, Coulee Ile des Cannes and Isaac Verot Coulee, enter the river. In both cases, extensive flooding occurs along many reaches of the river and its tributaries, and especially over the urbanized areas of the City of Lafayette and its surrounding communities. Examples of reverse flows are shown in Figure 2. The hydrographs also show excessively slow recession of flood peaks, which are driven by outflows from the swamp after the river stage has started to recede. Observations on river stage and streamflow are available at four locations within the domain of interest to the current study (Figure 1). Stage measurements are available at three road crossings over the Vermilion river, namely Surrey, HWY733, and Perry, while the fourth location is just upstream the inlet control gates of Ruth canal (Figure 1). Streamflow (flow rate) data are available only at Surrey and Perry gauges. More details about the streamflow observations are available in the Supplementary Material.
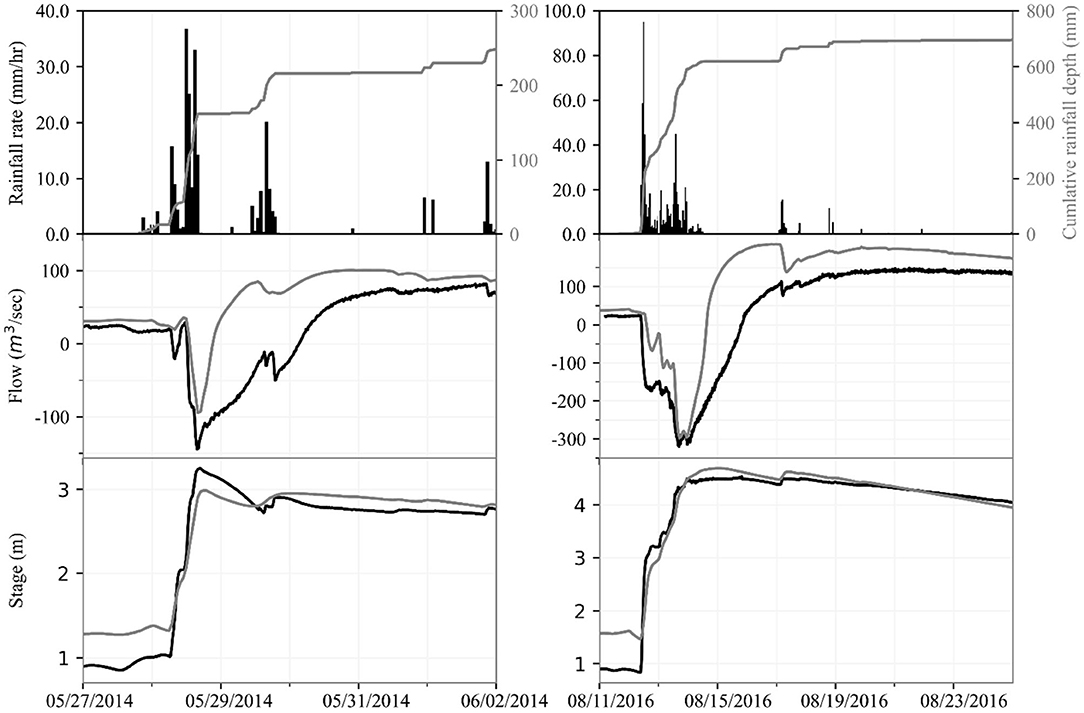
Figure 2. (Top) Hourly rainfall rates (black) and accumulations (gray) extracted from the Stage IV radar product. (Middle and lower) Streamflow and stage hydrographs at the USGS Surrey gauge during the 2014 (left) and 2016 (right) simulation periods. Model simulations are in gray and USGS observations are in black.
The historically navigable reach of the Vermilion River extends between the City of Lafayette (river kilometer of 76, measured from the river mouth at the Vermilion bay) and the GIWW (river kilometer 5), and has periodically been subject to channel dredging for maintenance purposes. However, due to the declining navigation activities and other logistical reasons, the river has not been dredged for the last two decades. This has resulted in riverbed shoaling and reduction in the conveyance capacity of the river, especially in the central reaches that pass through the urbanized sub-watersheds in Lafayette.
Simulation Periods
The dredging analysis of this study was conducted for two multi-storm simulation periods, August 1st−30th, 2016 and May 15th–June 5th, 2014 (Figure 2), that capture different storm magnitudes and flooding impacts. The two simulation periods were associated with widespread flooding in different parts of the watershed. The stage and streamflow hydrographs observed during both periods clearly illustrate the reverse flows that happen within the Vermilion River, as well as the extremely slow recession that continue for several days after the end of the rainfall storm.
The August 2016 storms generated devastating flooding within the basin and across many areas of the state (van der Wiel et al., 2017; Watson et al., 2017). Based on a rainfall duration-depth analysis, the August 2016 storm can be classified as a 100–200-year storm. A total of 762 mm of rainfall was recorded during the August 2016 period, with hourly rainfall intensities exceeding 90 mm/h. Rainfall events during the 2014 simulation period can be classified as a 2–10-year storm, depending on the duration considered. During the May–June 2014 period, a total rainfall depth of 250 mm was recorded, with hourly rainfall intensities reaching 37 mm/h, causing significant flooding where lateral coulees meet the Vermilion River (Advanced Hydrologic Prediction Service, 2018).
Hydrodynamic Model
In this study, an unsteady hybrid 1D/2D hydrodynamic model for the Vermilion River and its main tributaries was used to simulate the existing conditions and the proposed dredging scenarios. The model is an expansion of an earlier version (Saad et al., 2020) that was developed using the Hydrologic Engineering Center's River Analysis System (HEC-RAS) version 5.0.7. The HEC-RAS system allows for 1D and 2D unsteady flow simulations using either dynamic or diffusive wave approximations of the shallow water equations. For the purposes of this study, the HEC-RAS 1D solver was used in the case of 1D simulations (e.g., the main channel of the river) to solve the full 1D St. Venant equations for unsteady open channel flow. These equations are discretized using the finite difference method and solved using a four point implicit method (USACE, 2016). For 2D simulations, this study opted to use the diffusive wave approximation of the shallow water equations since similar results were obtained when the full dynamic solver was used. While performing the 2D computations, the HEC-RAS uses an implicit finite difference scheme to discretize time derivatives and a combination of finite difference and finite volume solver (hybrid discretization) to solve for spatial derivatives.
Model 1D/2D Setup
The model encompasses a total of 115 km of the mainstream of the Vermilion River (Figure 1), starting at its headwaters, where a flow hydrograph from the Fusilier weir provides an upstream boundary condition. The river also receives flows through the Ruth canal structure that conveys flows from Bayou Teche to Vermilion River. Time-series of flow diversions through the Ruth canal structure and over the Fusilier weir were constructed based on information provided by the Teche-Vermilion Freshwater District responsible for operation of the structures. The model terminates at its intersection with the GIWW, where a stage hydrograph available from a Gulf monitoring station is used as downstream boundary condition.
The hybrid 1D-2D model setup includes the mainstem of the river and five of its major tributaries represented as 1D (Figure 1), while the Bayou Tortue swamp system and its surrounding areas were represented as 2D (Figure 3). The narrow and steep-sided channel of the Vermilion River (Kinsland and Wildgen, 2006) makes the 1D characterization of the river rather reasonable. Significant flow exchanges occur between the river and the Bayou Tortue swamp system through several tributaries as well as direct bank overflows. To simulate such exchanges, a 2D setup was used to represent the swamp using a total of eight 2D flow areas (Figure 3). An unstructured mesh was developed with varying resolutions of 30–90 m. The varying resolution was needed to address model stability and terrain representation. Generally, a fine mesh size was heavily enforced around breaklines and in areas where abrupt changes in the velocity field was encountered. Breaklines were used in the 2D areas to enforce key features of the terrain and ensure that the model reasonably simulates the movement of overland flow. Breaklines were used along channels with concentrated flows and ridgelines that allow flows to spill from one area to another across features, such as road embankments, levees, and natural ridgelines. On the other hand, a coarse mesh resolution was adopted in areas where the 2D flow is relatively uniform. Even in areas with relatively coarse computational grids, a reasonable representation of the swamp hydrodynamics is achieved due to the HEC-RAS implementation of a sub-grid approach that allows for a relatively coarse grid while capturing the finer scale underlying topography (Brunner, 2016). To allow for flow exchanges between the river and the swamp, the 1D (river) and 2D (swamp) parts of the model were coupled through lateral connections represented in the model as fictitious weir structures. During the unsteady flow simulation, the solution algorithm allows for direct feedback at each time step between the 1D and 2D flow elements, which enables an accurate calculation of headwater, tailwater, flow, and any submergence that occurs at the hydraulic structure on a time-step-by-step basis.
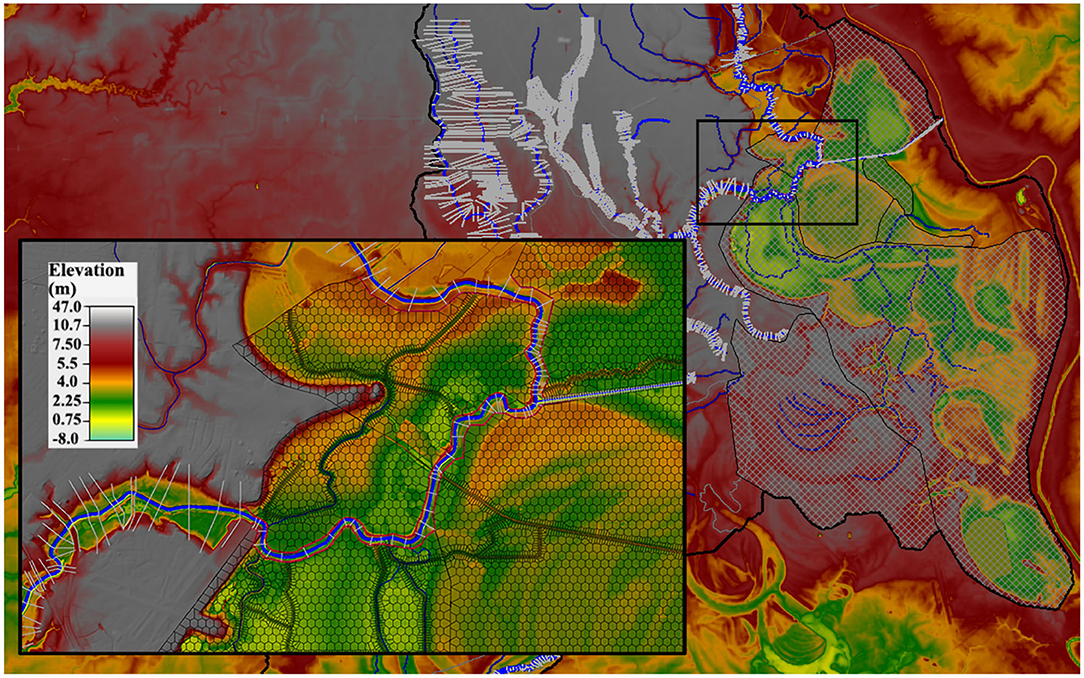
Figure 3. Bayou Tortue swamp system represented using a 2D setup in the hydrodynamic model. The close-up view shows the Vermilion River (modeled as 1D) flowing through the Bayou Tortue swamp. The red lines around the riverbanks represent a set of fictitious lateral structures that were used to simulate the connection between the river and the swamp.
Representation of Tributaries and Surface Runoff
Along its main course, the Vermilion River receives runoff contributions from 15 main tributaries and about 23 minor lateral streams. Due to the absence of tributary streamflow observations, the current study depended on readily-available hydrologic simulations from the National Water Model (NWM) Reanalysis to obtain tributary streamflow hydrographs. These tributary hydrographs were then used to drive the hydrodynamic model simulations (red and gray arrows in Figure 1). The NWM is a modeling framework that depends on a fully coupled surface/subsurface hydrological model called WRF-Hydro (Gochis et al., 2018). The NWM uses diffusive wave surface routing and saturated subsurface flow routing on a 250-m grid, and channel routing down the NHDPlus stream reaches using the Muskingum-Cunge (MC) method (Shastry et al., 2017). Only five major tributaries (Coulee Des Poches, Coulee Mine, Coulee Isaac Verot, Coulee Ile Des Cannes, and Anslem Coulee), were explicitly simulated in the hydraulic model as 1D reaches (Figure 1). These specific tributaries were selected since they play a key role in the river hydrodynamics. Hydrographs were extracted from the NWM dataset at the outlets of the lower-order streams of the five tributaries (gray arrows in Figure 1) and the outlets of the 10 main tributaries that were not fully included in the hydrodynamic model (red arrows in Figure 1). These hydrographs were then used to drive the 1D hydrodynamic simulations of the five tributaries and the main river. Examples of NWM hydrographs that were used to enforce the hydrodynamic model are shown in the Supplementary Material.
It is also noted that, besides the concentrated streamflow hydrographs, additional overland streamflow hydrographs were extracted from the spatially-distributed NWM outputs. These were then provided as laterally-distributed hydrographs to the 1D reaches of the five tributaries and the main river to capture overland surface runoff that drain directly to the channels (see Supplementary Material for more details). Additional surface runoff comes from direct rainfall over the Bayou Tortue swamps. Since the swamps were represented in the model using a 2D setup, a rainfall-on-grid HEC-RAS approach was adopted over the swamps. Rainfall data was available via the hourly, spatially distributed (4 × 4 km2) Stage IV radar-rainfall product (Eldardiry et al., 2015). Hourly Stage IV rainfall data were extracted over each of the eight 2D swamp areas and used to drive the 2D hydrodynamic simulations over the swamp domain.
Terrain and Land-Use Representation
A modified terrain model was developed for the Vermilion River basin using a combination of cross sectional surveys, high-resolution LiDAR-based Digital Elevation Models (DEM; Cunningham et al., 2009), and detailed bathymetric surveys for the river (USACE, 2015). To compensate for the inability of the LiDAR technology to “see-through” the water surface (Cook and Merwade, 2009), the LiDAR DEM and the riverine bathymetry were merged to generate an improved terrain model that includes the riverbed survey along the channel reaches and the DEM data elsewhere in the model domain. The merged terrain model was hydrodynamically-corrected following Jarihani et al. (2015). Merging these elevation sources into a single DEM, while keeping the priority for the local surveys and river bathymetry in overlap areas, produces a base DEM that is used in the hydraulic modeling and subsequent analysis of dredging scenarios.
The Vermilion River watershed exhibits a significant heterogeneity in the land-use and land-cover characteristics. To reliably model the flood response of the watershed, the 2011 30-m National Land Cover Database (NLCD) (Homer et al., 2015) was used to develop a lookup table that links each NLCD grid cell with a representative value of the Manning's roughness coefficient. This allowed the model to incorporate a spatially distributed representation for overland and channel roughness characteristics.
Model Calibration
The model was calibrated using the May–June 2014 multi-storm simulation period, while the results were tested under the August 2016 simulation period (Figure 2). Due to the lack of adequate flow and stage observations in the basin, only a limited level of model calibration was possible. A visual-based calibration was performed to adjust the model parameters by focusing on key attributes of the river flow regime during flood events (e.g., reverse flows, river-swamp flow exchanges, slow recession of flood waves). The calibration was done primarily by adjusting the Manning's roughness coefficient in the channel reaches that were simulated as 1D and the swamp areas that were simulated as 2D. In channel reaches, the roughness coefficient was adjusted for the main channel as well as for the overbanks. The calibration focused primarily on simulating the magnitudes and timings of flow and stage peaks at the two gauges. In calibrating the model, special attention was given to re-produce the reverse flows that were observed at the Surrey gauge, which is an indication of the model's ability to capture river-to-swamp flow exchanges. Adjustments roughness coefficients were also spatially adjusted over the swamp areas that were simulated using a 2D grid. The adjustments were key in improving the model's ability to simulate the prolonged recession of the receding flood waves, a typical behavior of the river during extreme events that is attributed to swamp-to-river flow exchanges. More details about the model performance and the calibration results are available in Saad et al. (2020).
Description of Dredging Scenarios
To investigate the impact of dredging on flow regime within the river, four different scenarios were considered. The scenarios reflect different combinations of spatial extents and changes to the dimensions of the river channel and its longitudinal slope (Table 1 and Figure 4). These combinations also reflect a wide range in the expected volume of the dredged material. Despite the differences between the four dredging scenarios, they all share some common features. All dredging scenarios intend to cut the river cross-section to a 30-m width and side slopes of 2H:1V, while maintaining the river alignment unchanged. These new channel dimensions were based on navigation and flood control criteria set by the Bayou Teche and Vermilion River Operations and Maintenance project (USACE, 1995). In all scenarios, the roughness coefficient was adjusted in the dredged sections to reflect the expected improvement in channel irregularity and bed roughness.
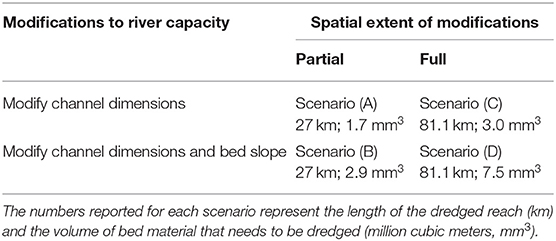
Table 1. The four dredging scenarios considered for evaluation.
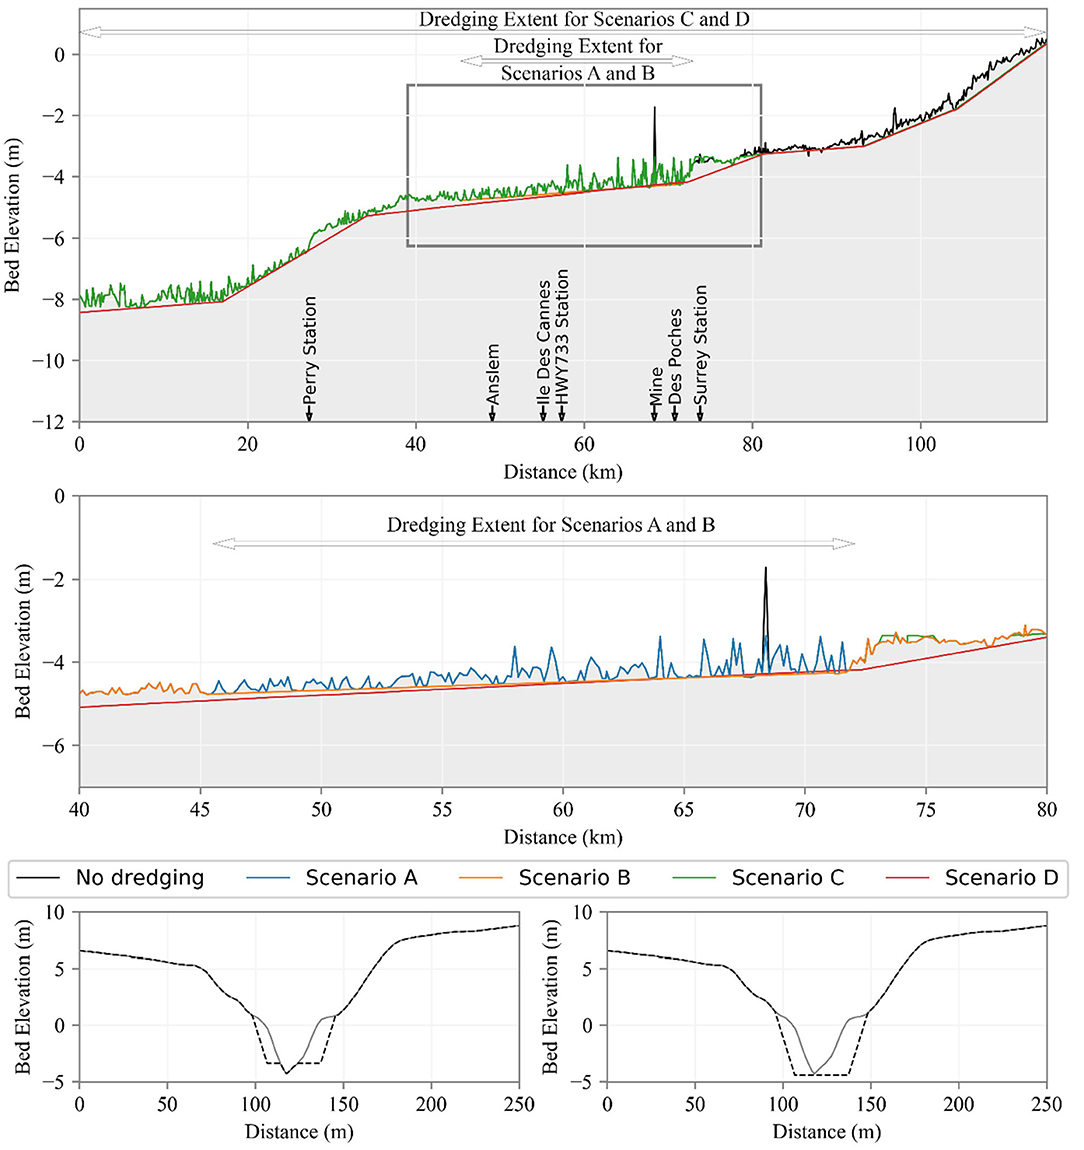
Figure 4. (Top) Bed elevation of the Vermilion River starting from its downstream intersection with the GIWW until its most upstream station. The bed elevation is shown for the existing condition of the river (base scenario, black line in top panel) and the four dredging scenarios, A–D. (Middle) Shows a close-up view on the dredging extents of scenarios A and B. A full description of the four dredging scenarios is presented in Table 1. Note that the existing bed elevation follows the irregular bed profile and overlaps with some of the scenarios in certain reaches. (Lower) Show examples of cross section modified for dredging (solid lines indicate the existing cross section while the dashed lines show the same section after dredging).
Dredging scenarios A and C focused on changing the channel dimensions only, while scenarios B and D included changes to both of the channel dimensions and the longitudinal bed slope. Modifying the channel dimensions intends to dredge the river bed to a fixed elevation of −3.35 m, based on the North American Vertical Datum of 1988 (NAVD 88), with a width of 30-m and side slopes of 2H:1V (Figure 4). However, if the existing bed elevation located within the intended dredging reach was already lower than the −3.35-m elevation, which was the case for most of the dredged reaches, the bed elevation is kept unchanged while the new width is carved at the elevation of −3.35 m. In addition to increasing the channel cross-sectional dimensions, scenarios B and D included grading the river bed to achieve a downstream-oriented longitudinal slope (Figure 4).
The study also examined two spatial extents of river dredging, a partial dredging extent (scenarios A and B) and a full dredging extent (scenario C and D). The “Full” spatial extent applies dredging for the whole navigation reach of the river, starting from its intersection with the GIWW in the south, and extends north for 81.1 km where the Ruth Canal joins the river. Alternatively, the “Partial” dredging extent covers only 27 km of the river where it passes through the heavily-urbanized areas within the City of Lafayette. The four dredging scenarios capture different degrees of modifications to the channel conveyance capacity and will allow a comprehensive evaluation of impacts on flow regimes and flooding in the river basin. Each dredging scenario will be tested separately using the hydrodynamic numerical model under the 2014 and 2016 simulation periods. The results will then be compared against those of a baseline scenario that represents the existing conditions of the river geometry.
Results and Discussion
This section presents the results of the hydrodynamic model for the Vermilion River under the existing conditions (baseline scenario) in addition to the four proposed dredging scenarios. To isolate the effects of changing the river bathymetry, the forcing boundary conditions, including the tributary inflow hydrographs and tidal downstream boundary conditions, were all kept the same in all scenarios including the baseline scenario. This approach will allow for inter-scenario comparisons and ensure that reflect only the effect of bathymetric changes due to river dredging.
Effect on Flow Regime in the Main River
Figures 5, 6 show the simulated flow hydrographs at three key locations along the Vermilion River for the two simulation periods, May–June 2014, and August 2016. The three locations (Surrey, HWY733, and Perry crossings) are selected in such a way to reflect different flow regimes along the river (e.g., reverse flows, upstream and downstream conditions, water surface gradients). These figures illustrate flow hydrographs from simulating the baseline case (no dredging scenario), and those from the four proposed dredging scenarios (Table 1). Prior to discussing the effect of the different dredging scenarios, it is necessary to discuss the flow regime in the river under the existing conditions. The Vermilion River, under its current status, tends to show reverse (negative) flow values at Surrey station (top panels in Figures 5, 6) under moderate and extreme rainfall storm events. These negative values indicate a reverse in flow direction where the river starts to travel north and exchange flows with the Bayou Tortue Swamp, rather than following its normal course south toward the Gulf of Mexico. The specific location where this flow inversion starts mostly depends on the severity of the storm and the spatial distribution of the rainfall over the watershed. This can be seen when comparing the simulated flow hydrographs at HWY733 during May–June 2014 period (moderate 2–10-year events) and August 2016 period (extreme >100-year events). The results suggest that the reach of the river where inversion in flow direction occurred extended much further downstream to reach south of HWY733 during the more extreme August-2016 storm, while it was only limited to shorter reaches during more moderate rainfall events. The degree and spatial extent of the reverse flow are also apparent in the longitudinal water surface profiles shown later in Figures 7, 8.
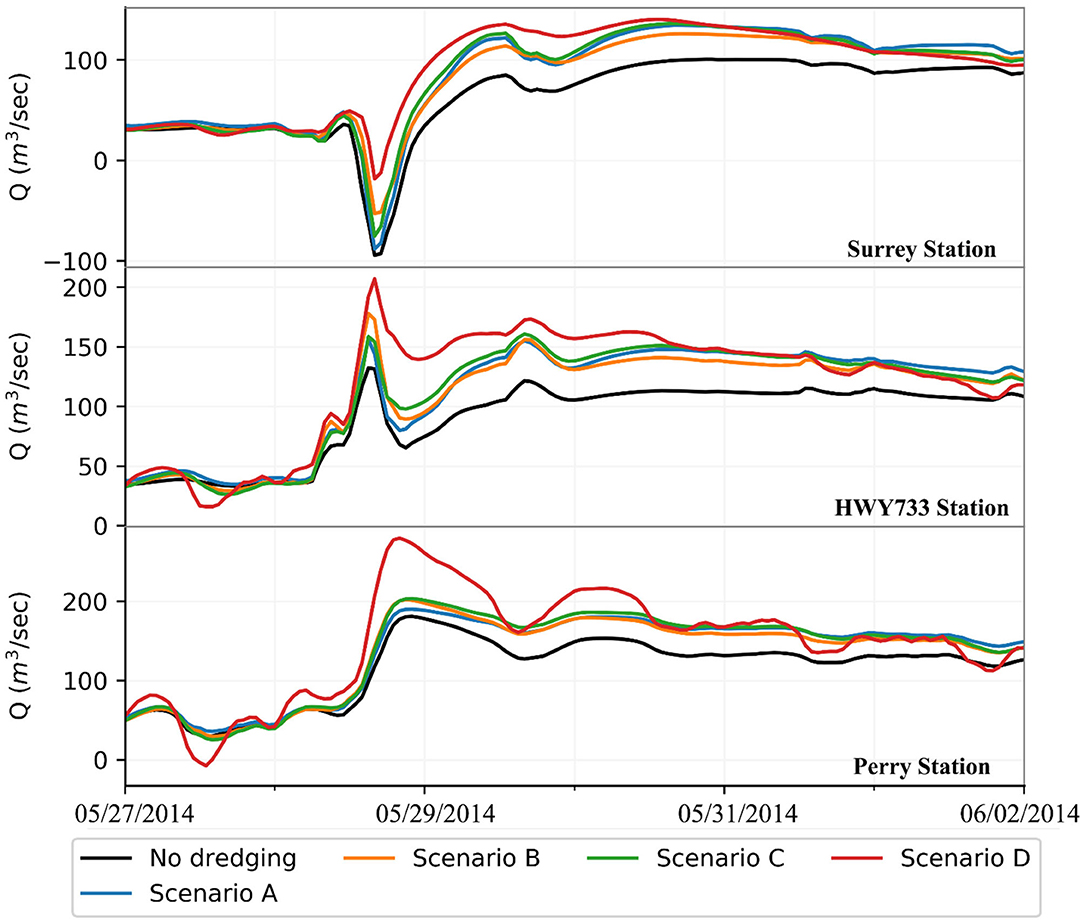
Figure 5. Simulated flow hydrographs at three key stations along the Vermilion River (top: Surrey, middle: HWY733, bottom: Perry; see Figure 1 for specific locations) during the May–June 2014 simulation period for the no-dredging baseline condition and the four dredging scenarios.
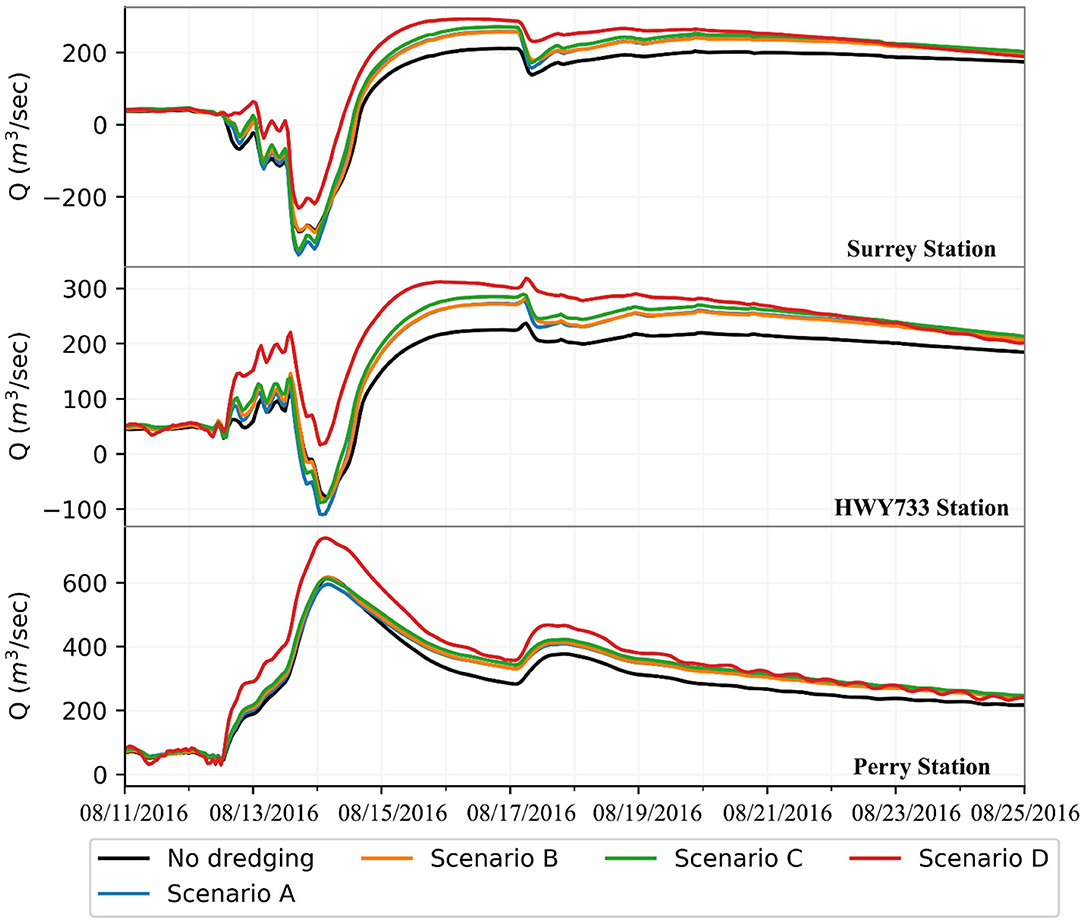
Figure 6. Simulated flow hydrographs at three key stations along the Vermilion River (top: Surrey, middle: HWY733, bottom: Perry; see Figure 1 for specific locations) during the August 2016 simulation period for the no-dredging baseline case and the four dredging scenarios.
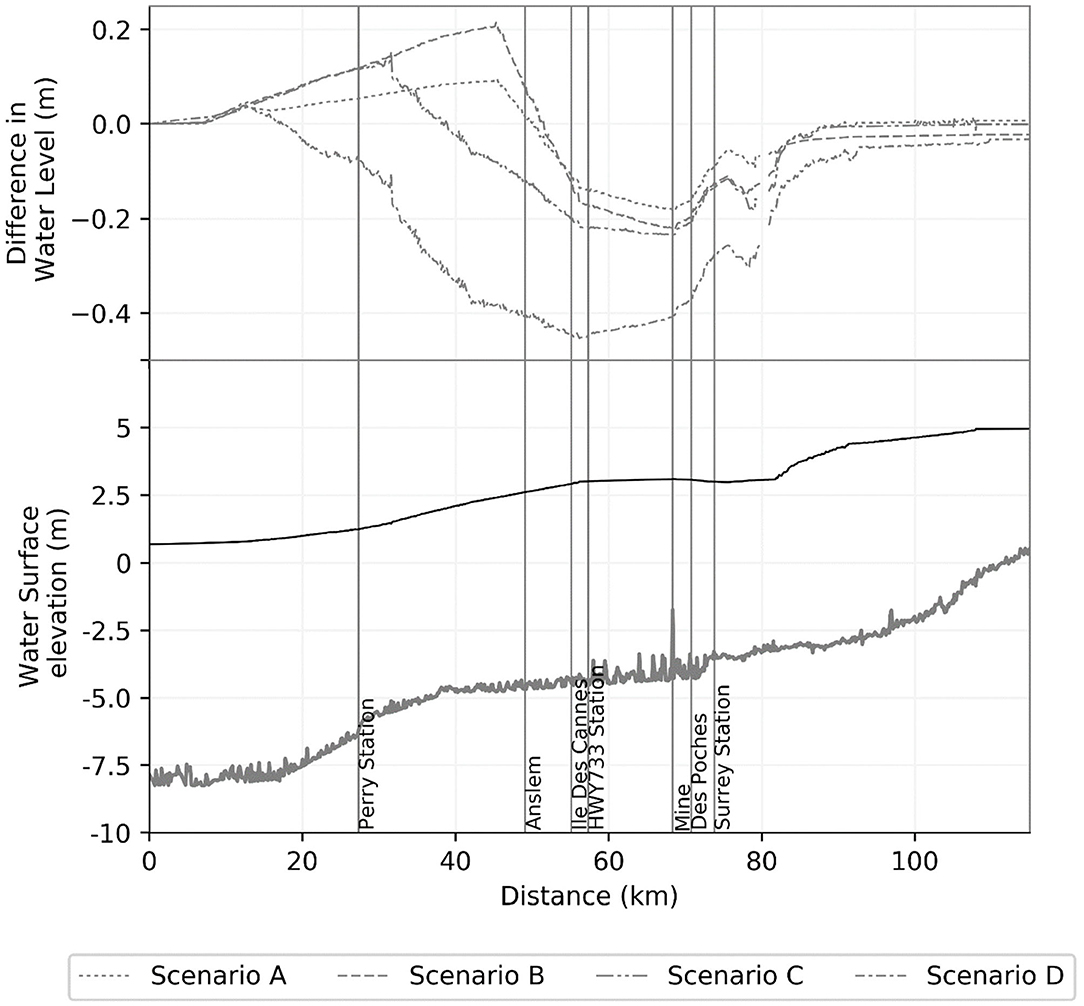
Figure 7. (Lower) Longitudinal profile of maximum water surface elevation (WSE) along the mainstem of the Vermilion River simulated under the baseline case during the May–June 2014 simulation period. The existing river bathymetry is also shown (irregular line). (Top) Longitudinal profile of the differences between the maximum WSE simulated under each dredging scenario and the baseline case.
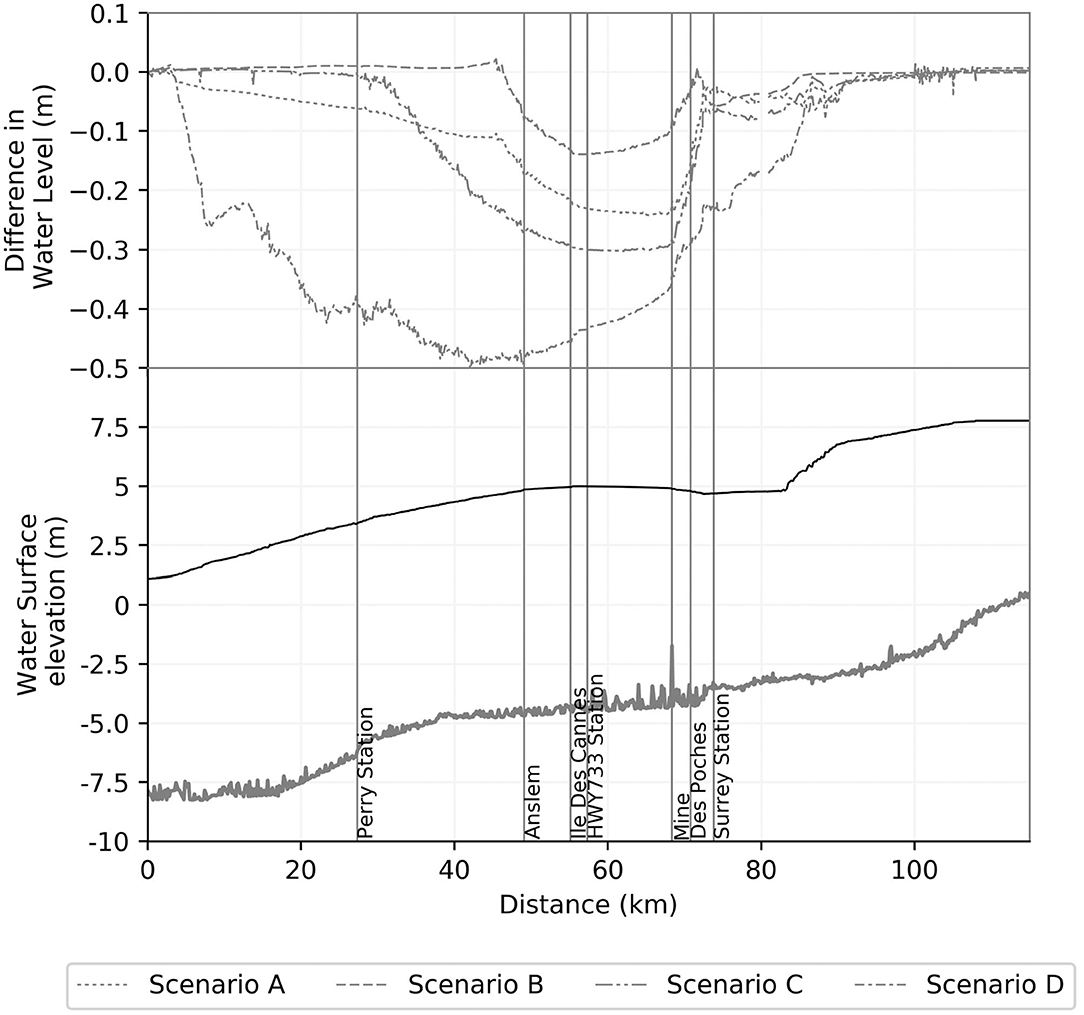
Figure 8. (Lower) Longitudinal profile of maximum water surface elevation (WSE) along the mainstem of the Vermilion River simulated under the no-dredging baseline case during the August 2016 simulation period. The existing river bathymetry is also shown (irregular line). (Top) Longitudinal profile of the differences between the maximum WSE simulated under each dredging scenario and the baseline case.
Generally, the different dredging scenarios appear to alter the overall flow regime in the river, especially during moderate storms, such as the May–June 2014 period. All dredging four scenarios tend to reduce the reverse flows during the peak period of the storm while increasing the positive flows during the recession period. Despite differences in the spatial extent and degree of channel modification across the four dredging scenarios, the dredging activities tend to cause the main river to flow in its normal course toward the Gulf of Mexico. This is further evident in the simulated flow hydrographs at HWY733 and Perry locations (Figure 5) which experience a general promotion in the positive flow values. Increases in in the magnitudes of downstream flows are also apparent in the slow and elongated recession curve, indicating that the river is now accepting more flows coming from the swamp system and moving into the downstream direction.
The results under a more extreme storm (August 2016) provide other interesting insights on how dredging can significantly alter the flow regime in the river. Note that during this extreme flooding event, the extent of the reverse flow reached much further downstream (top and middle rows in Figure 6) than during the 2014 moderate events. During the August 2016 period, only the more aggressive Scenarios B and D, which involve implementing downstream-sloped riverbed grading, acted similar to the May–June 2014 period and reduced reverse flows. On the other hand, the less aggressive dredging Scenarios A and C showed an opposite behavior where some increases in the reverse flows were obtained, indicating an increase in the peak flows traveling north toward the Bayou Tortue Swamp. The dredging approach of scenarios A and C involve only enlarging the river cross-sectional dimensions without any grading of the longitudinal bed slope as was done in scenarios B and D. Apparently such approaches lead to an increase in the in-channel storage capacity within the dredged reach of the river without changes the bed slope. During extreme events, such as the August-2016 event, the in-channel storage of the river gets dominated by the amount of rainfall and thus plays a less significant role in controlling the water surface gradient. The runoff delivered to the river through its tributaries overwhelm the river storage capacity and build a hydraulic gradient that makes it easier for the river to travel in the reverse direction toward the Bayou Tortue Swamp system.
The results clearly suggest that the dredging scenarios have an effect on flow exchanges between the river and the swamp system that provide a valuable flood mitigation service for the entire watershed (Saad et al., 2020). During the peak of the storm, the river flows north into the swamp providing relief for the downstream areas of the watershed. However, after the peak, the large volumes of water that were diverted into the swamp start to drain back into the river resulting in an extremely extended recession of the hydrograph, which leaves the downstream communities under high flood stages for several days. To further examine the impacts of the different dredging scenarios on the river-swamp interactions, hydrographs of flow exchange between the river and the swamp were examined. These hydrographs (not shown) were constructed by tracking the exchange flows through the tributaries and lateral connections that connect the swamp and the river (Figure 3). The results confirmed a significant reduction in the volume of river-to-swamp flows by as much as 40–64% under scenario D and an increase in the swamp-to-river outflows into the river by as much as 23%.
Effect on Water Surface Elevations (WSE) in the Main River
Figures 7, 8 show longitudinal profiles of the maximum water surface elevation (WSE) along the river during the two simulation periods for the baseline scenario and the four dredging scenarios. For better clarity, the results for the four dredging scenarios are presented in the form of differences from those of the baseline scenario. In general, the dredging scenarios reduced water surface elevations along some reaches the river, but to various degrees. During the August 2016 period, maximum reductions in water surface elevation were 0.14, 0.22, 0.30, and 0.49 m for dredging scenarios A, B, C, and D, respectively. Smaller reductions (0.19, 0.21, 0.22, and 0.42 m) were obtained during the more-frequent storms of May–June 2014. The reductions are more noticeable over the middle section of the river (~river km 50 to river km 80). The reduction reached further downstream (~river km 5–20) under the most aggressive dredging scenario D. Despite the overall reduction in WSE, it is interesting to see that local dredging that doesn't extend downstream enough (e.g., Scenarios A and B), although may reduce water surface elevations within the dredged reach, had actually triggered downstream increases in water surface elevations during the May–June 2014 period where up to a 0.2 m increase was observed in the last third of the river (~river km 10–45). During more frequent events, spatially-limited increases in the in-channel storage of the river offered localized relief to the water surface profiles but led to a significant backup in water volumes and thus an increase in downstream water surface elevations.
Interestingly, the results obtained from Scenario C, despite being a full dredging scenario that extends for a longer distance down the river, also showed some increase (~0.15 m) in the water surface elevation in the last reach of the river (up to river km 25). Considering that Scenario C includes increasing the channel dimensions only, the lack of any enhancements to the channel bed slope as it approaches the Gulf didn't allow the river to benefit from the enlargement added to channel size. It is also noted that channel size enlargement implemented in Scenario C were actually much less needed in the last section of the river due it its already existing large channel. The negative consequences of increasing the water surface elevation were not obtained under more extreme storm of 2016. This is simply because the water elevations were already high and the large rainfall volumes created their own gradients regardless of the channel slope or its dimensions.
Effect on the WSE in the Tributaries
In addition to examining the impact of riverine dredging on the main stem of the river, it is also of interest to assess the propagation of such impacts into the tributaries that drain into the river. To allow such examination, five of the main tributaries that drain into the Vermilion River (Coulee Des Poches, Coulee Mine, Coulee Isaac Verot, Coulee Ile des Cannes, and Anslem Coulee) were explicitly modeled as part of the hydrodynamic model. The maximum WSE profiles along two of these tributaries (Coulee Ile des Cannes and Coulee Isaac Verot) are shown in Figures 9, 10. Observations drawn from the profiles of these two tributaries were found consistent for the other tributaries as well.
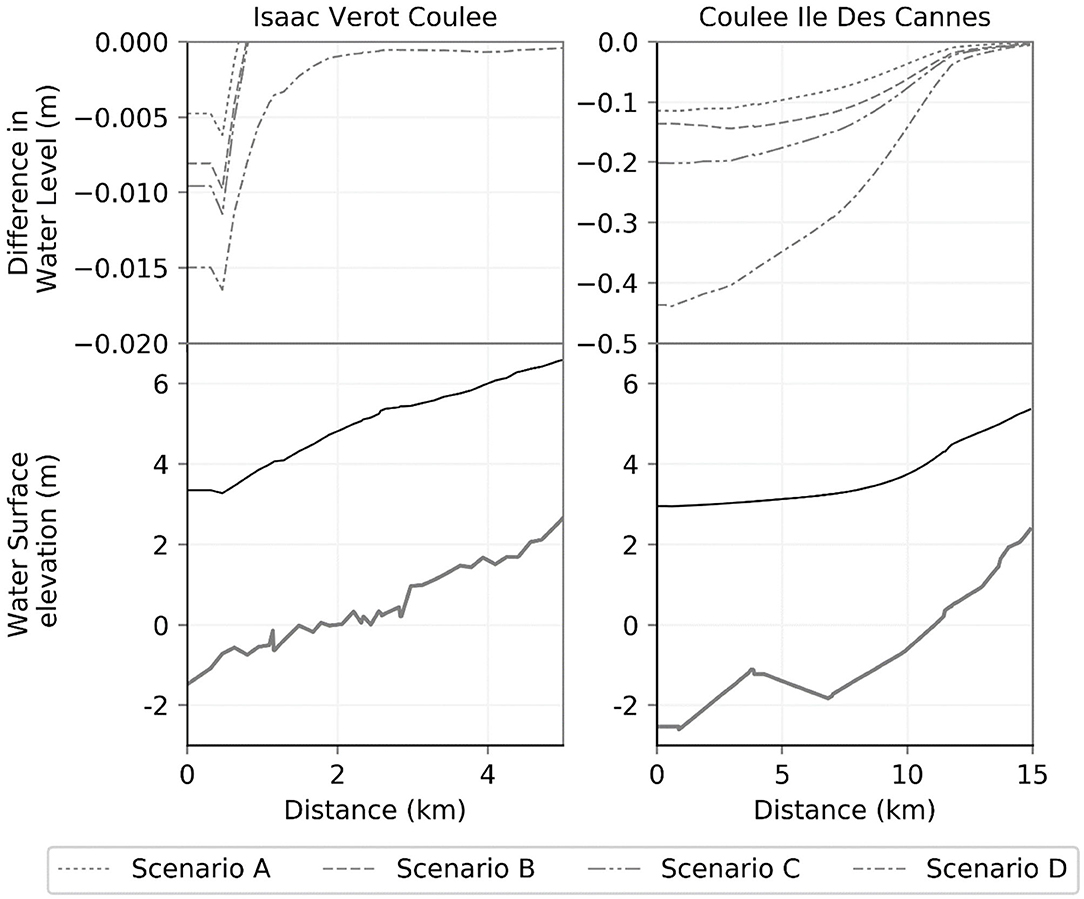
Figure 9. (Lower) Longitudinal profiles of maximum water surface elevation (WSE) for the baseline case during the 2014 simulation period. The existing river bathymetry is shown (irregular line). (Top) Longitudinal profile of differences between the maximum WSE of each dredging scenario and that of the baseline case.
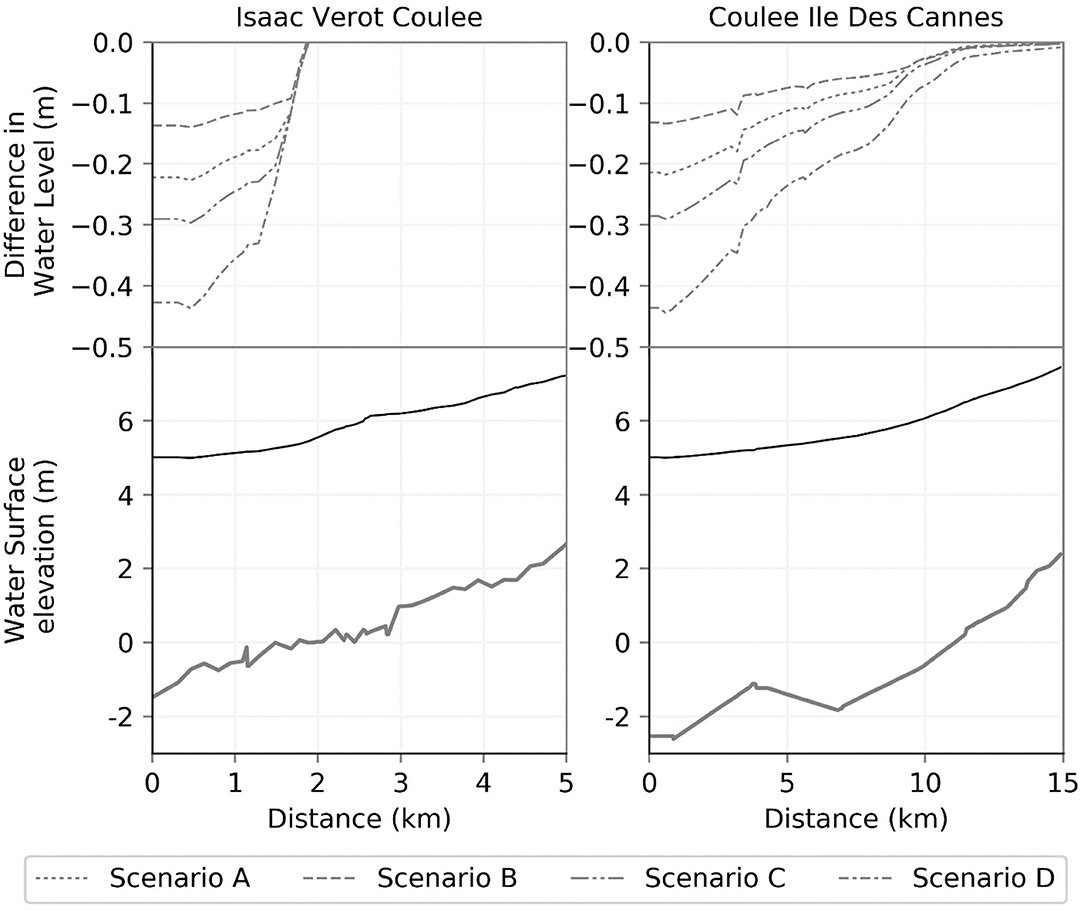
Figure 10. (Lower) Longitudinal profiles of maximum water surface elevation (WSE) for the baseline scenario during the August 2016 simulation period; the existing river bathymetry is shown (irregular line). (Top) Longitudinal profile of differences between the maximum WSE of each dredging scenario and the baseline case.
Compared to the results inside the main river, generally, a lesser reduction in water stage across the tributaries are attained. The Ile des Cannes tributary showed larger drops in water surface elevation, both in magnitude and spatial extent. As expected, the maximum WSE reduction occurred at the outlet of the tributaries, with Scenario D showing the most WSE reduction in both events. Scenario A and Scenario B showed the least WSE reduction, similar to their in the main river. The reduction in WSE propagated upstream into the coulees for relatively limited distances of mostly ~2 km and no more than 10–13 km. The magnitude and spatial extent of the reduction within each tributary is largely dependent on the longitudinal bed slopes of each tributary and the hydraulic gradient during the flood event. The most downstream reach of Coulee Ile des Cannes is characterized by an average bed slope of 0.037%, while the same reach in Coulee Isaac Verot exhibits a steeper average bed slope of 0.084%. The WSE reduction apparently increases in coulees that have milder slopes. Examining the hydraulic gradient provides some additional insight. During the more frequent storm, May–June 2014, the hydraulic gradient inside the Isaac Verot tributary was estimated as 5.4% for the baseline scenario, resulting in a minimal WSE reduction (0.015 m) that extended for a distance of <2 km under the most extensive dredging scenario (Scenario D). However, the same tributary had a milder hydraulic slope of 3% during the August 2016 extreme event, and thus resulted in a larger reduction in water surface elevation of 0.42 m that extended slightly further upstream under the same dredging Scenario D. Unlike Isaac Verot tributary, the hydraulic gradient in the Ile des Cannes tributary, under the baseline scenario, was 0.004 and 0.005% during the May–June 2014 and August-2016 periods, respectively. As such, these conditions resulted in larger reductions of 0.44 and 0.42 m that extended for longer distances of 13 and 12.1 km, respectively (Scenario D). The very flat bed slope for the Ile des Cannes tributary diminished the effects of differences in the hydraulic gradient between the periods of May–June 2014 and August 2016.
Effect on Tidal Propagation
Modifications to the river channel are expected to affect the propagation of tidal wave for rivers, such as the Vermilion River, especially with its connectivity to the Gulf of Mexico through the Vermilion Bay. To assess such potential effects, the model simulations were used to quantify the tidal amplitudes under the different dredging scenarios and compare them to the existing baseline condition. Figure 12 illustrates the maximum tidal amplitude along the main stem of the river starting from its most downstream intersection with the bay. The amplitudes shown in Figure 12 were calculated by taking the difference between the maximum and minimum water elevation at each cross section along the river over the temporal span of the simulation period. However, this was performed for the pre-storm period only and without including the water stages during the main storm. The main reason for doing so is to isolate the potential impact of the dredging activities on the tidal hydrodynamics during non-flooding conditions and without including the effects of the inland rainfall storms.
The results (Figure 12) obtained under the baseline scenario suggest that the tidal signal in the river is largely diminished around 65–70 km from its outlet to the Gulf. Generally, the results suggest that all dredging scenarios caused a significant alteration in the tidal range along the course of the main river. However, it is clear that dredging Scenario D has the most significant impact in allowing the tidal signal to propagate for longer distances upstream. Scenario D resulted in a drastic increase in the tidal amplitude that extended across the entire river, with an increase of as high as 1.8 times the magnitudes obtained under the baseline scenario. This amplification extended for significant distances upstream and as far as Surrey crossing, ~73 km landward into the heart of the City of Lafayette. Scenarios A, B, and C resulted in tidal amplitudes similar to the baseline condition, but with some minimal attenuation in the downstream reaches of the river [0–50 km]. Starting at ~50 km and further north, an inflection in the tidal propagation starts to occur and the reach witnesses a relatively constant tidal amplitude that tends to be higher than the baseline scenario. Such increases are apparently triggered by the channel size enlargement and bed grading involved in this middle reach under scenarios A, B, and C. Also, the results shown in Figure 11 highlight the value of the Bayou Tortue swamp as a coastal mitigation measure. Along the river reach where it has interconnections with the swamp (73–85 km), the maximum tidal wave height dropped sharply, especially under dredging scenarios B and D, which emphasizes the vital role of the swamp system in attenuating the tidal wave. The swamp storage capacity and its accessibility to the main river seems to have absorbed the effect of the tidal signal and reduced its propagation further upstream.
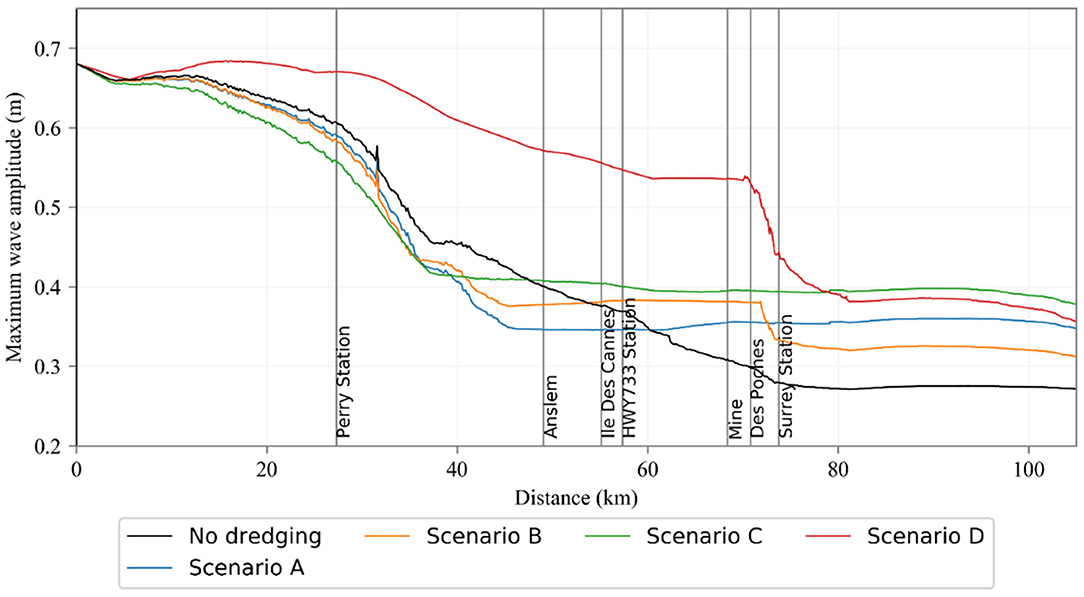
Figure 11. Propagation of tidal amplitude along the Vermilion River under the baseline case and each dredging scenario. Results are based on a non-flood period (07/25/2016 to 08/08/2016) that precedes the August 2016 flood. The vertical gray lines depict the inlet locations of key tributaries along the Vermilion River.
Effect on Inundation Extent and Duration
The impact of riverine dredging on flooding regime is further examined by assessing the flood inundation along the main river and its major tributaries. The maximum extent of flooded areas that would occur for each dredging scenario and for the baseline case were calculated during both simulation periods. The spatial extent of flood inundation was estimated by comparing the simulated water surface elevations and the LiDAR-based DEM. For the river channel and tributaries that were modeled as 1-D, a water surface model was developed by interpolating the maximum water stages at each cross-section on a grid that has the same spatial extent and resolution of the DEM surface. In areas that were simulated as 2D, the water surface grid is a direct output of the hydraulic model and no extra interpolation was required. After mosaicking the water surface grids estimated from 1D and 2D areas, the final water surface grid was overlaid onto the LiDAR grid to calculate differences between the surfaces and delineate the extent of the flood inundation. The results are summarized by calculating the total inundated areas for the entire domain of the river and its tributaries (Table 2). As expected, the dredging scenarios resulted in some reductions in the inundated areas; however, such reductions appear rather minimal. The results report reductions in the flooded area in the order of (0.97–6.87 km2) and (0.48–2.29 km2) during the August 2016 and May–June 2014 periods, respectively. It is interesting to contrast these rather minimal reductions in inundation spatial extents vs. the more noticeable reductions in the water surface profiles reported earlier (~0.4–0.5 m reduction; Figures 7, 8). These results indicate that the main river doesn't necessarily fully control the actual extent of inundation on adjacent floodplains, and further suggest that floodwaters of the river are mostly contained within its own main channel. These results are also consistent with the earlier observations on the relatively small propagation of reductions in the water surface elevation from the river into its tributaries (Figures 9, 10).
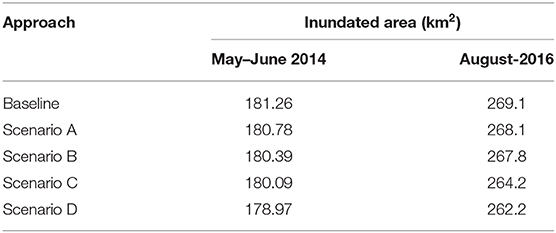
Table 2. Inundation areas estimated for each dredging scenario.
Besides examining the spatial extent of inundation, it is also of interest to examine the duration of inundation. This becomes particularly relevant given the extreme slow recession of flood waters in low-gradient rivers, such as the Vermilion River (Figures 5, 6). The duration of inundation was quantified by calculating the total number of hours each cell in the composite spatial inundation grid experienced a positive water depth. The number of hours were summed over the full duration of each simulation period. When compiled over the entire domain of the model, scenarios A, B, and C resulted in average reductions of 2–4 days in the inundation duration, while scenario D showed average reductions of 4–6 days. Example of the results are shown in Figures 12, 13 for selected areas within the model domain. In these areas and depending on the dredging scenario, the average reduction in inundation duration was in the range of 9.5–28.6 and 6.7–33.3% for the May–June 2014 and the August-2016 periods, respectively. Reductions as high as 6–8 days were obtained, especially with scenario D and in areas around the City of Lafayette and before the river enters connects to the Bayou Tortue Swamp system. Such results reveal that while the dredging activities didn't significantly reduce the spatial extent of inundation, they seem to reduce the duration of such inundations. The reduced inundation durations have implications for communities who are impacted by flooding conditions that last for several days after the peak of the storms.
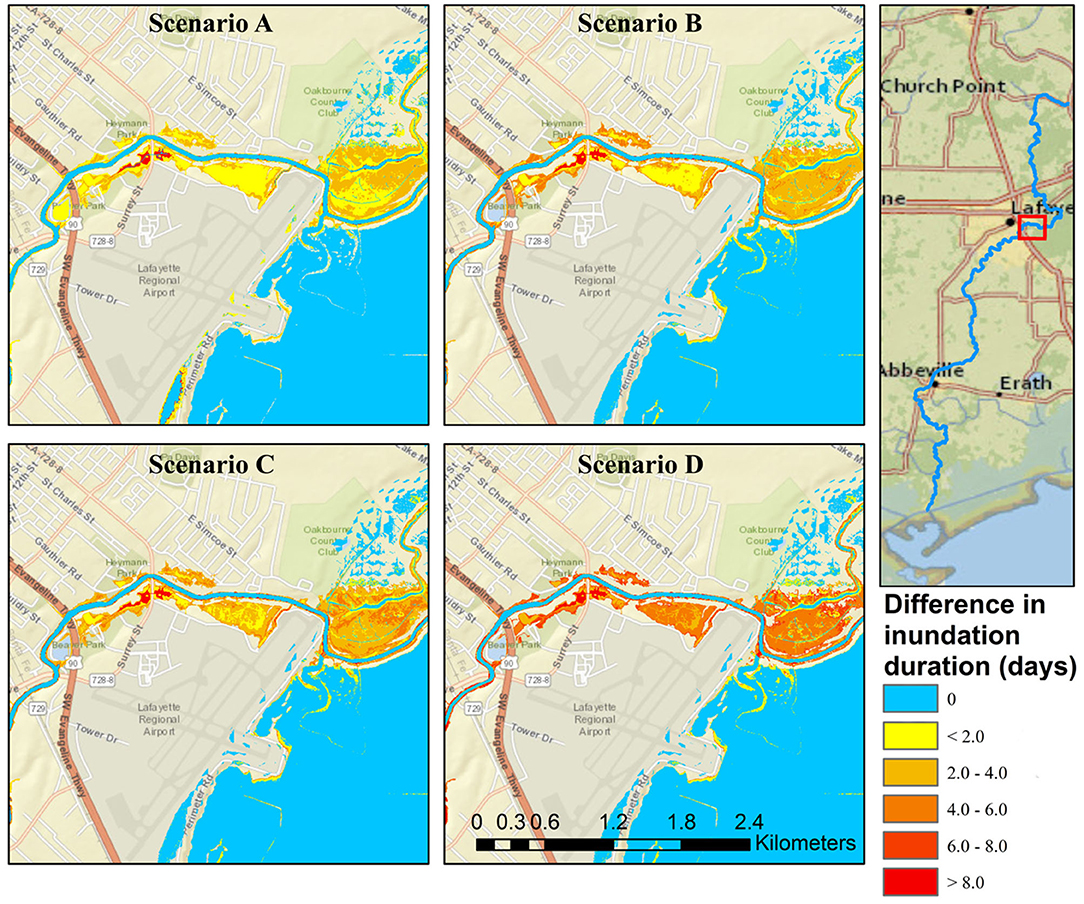
Figure 12. Differences in inundation duration between the baseline case and each dredging scenario during the May–June 2014 simulation period.
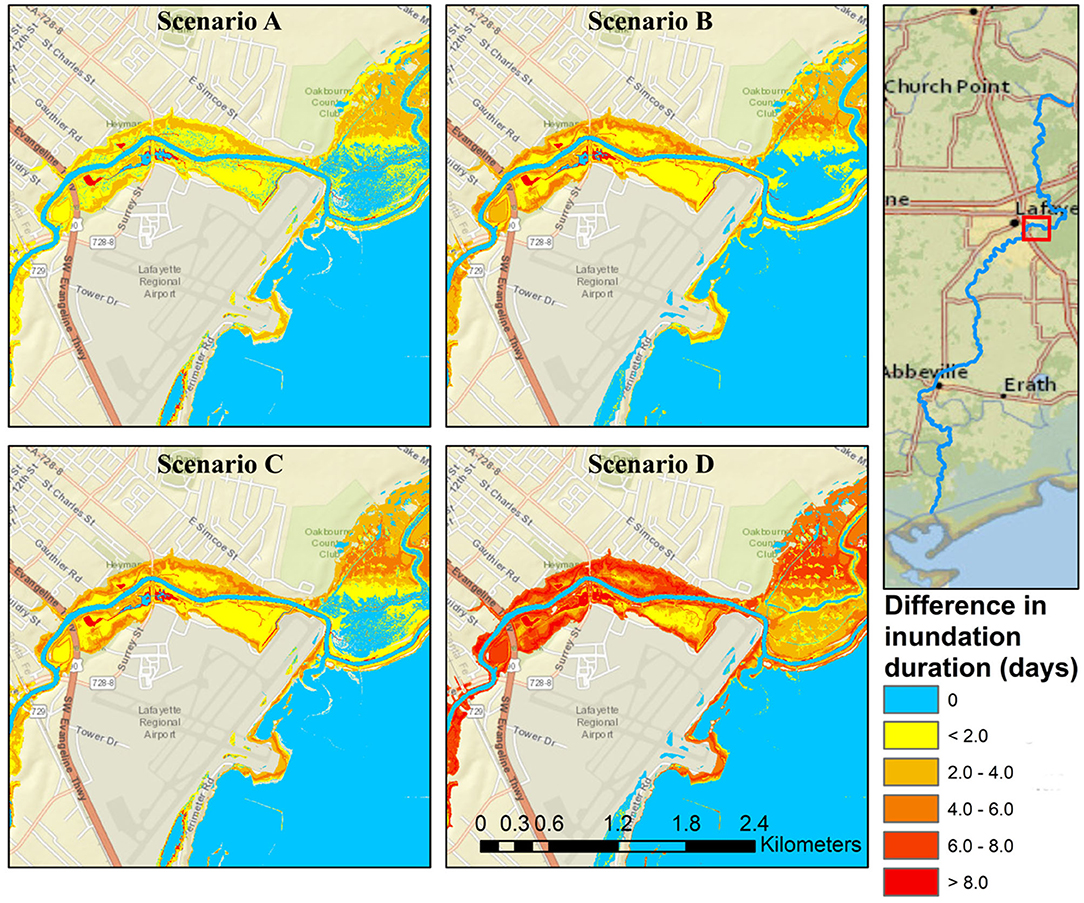
Figure 13. Differences in inundation duration between the baseline condition and each dredging scenario during the August 2016 simulation period.
Conclusions and Recommendations
This study investigated how large-scale channel modifications via riverine dredging may alter flood dynamics in the Vermilion River in southern Louisiana, a representative of low-gradient tidally-influenced river systems. With the presence of large swamp system within its watershed, the river is characterized by complex flow dynamics where frequent reverse (upstream) flows occur allowing flood waters to travel upstream for temporary storage in the swamps. The study examined the impacts of four different dredging scenarios that represent varying degrees of spatial extent and modifications to the channel cross section and longitudinal bed slope. A hybrid 1D/2D numerical model was used to simulate the impact of dredging activities on the flow hydrodynamics along the main course of the river and five of its major tributaries. The analysis was performed on two flooding periods, May–June 2014 and August 2016, which are classified as <10-year and >100-year storms, respectively. The four different dredging scenarios were assessed by evaluating key characteristics of the flow regime, including changes in flow hydrographs at key locations, reductions in water surface profiles and flood inundation, alterations to river-swamp interactions, and impact on tidal amplitudes and propagation. The results from each dredging scenario were compared against those obtained under the existing no-dredging scenario.
Overall, the results suggest that a watershed-centered approach, instead of a riverine-centered approach is needed for assessment of flood mitigation alternatives in such riverine systems. The following conclusions can be formulated based on the findings of the study:
1. The effect of large-scale riverine dredging on the flow regime in the river and the resultant flood conditions is highly controlled and modulated by inter-related and often competing factors, such as extent of the dredging in both volume and spatial coverage, flow exchanges between the river and the inter-connected natural swamps, bed slopes and hydraulic gradients, and the large volumes of runoff contributions from river tributaries and how they compare to induced changes to the river in-channel capacity.
2. Dredging scenarios that modified the river channel modifications and the riverbed slope lead to significant changes to the river flow regime. Overall, reverse river flows that travel to the swamp during the peak period of the storms were reduced. Such impacts have significantly altered the flow exchanges between the river and the swamp and severed the river-to-swamp inflows and increased the swamp outflows. This is expected to affect the hydroperiod of the swamp system and its residence time and may eventually affect its viability as a natural ecosystem.
3. Dredging approaches that were spatially extensive and included modifications to the river slope can result in sizeable reductions in water surface profiles (40–50 cm) along the river during flood conditions. However, such extensive dredging brings significant increase in the amplitude and propagation of the Gulf tidal wave that extended as far as 70 km inland.
4. While less-extensive, spatially-limited dredging approaches can also reduce the water surface profiles to some extent (10–30 cm), they tend to cause an increase in the water surface elevations downstream of the dredged river reaches. Such increases can extend over 20–40 km along the river, exposing downstream communities to increased flooding especially during more frequent events.
5. The results reveal that while the dredging activities can increase the hydraulic conveyance of the river system and improve its drainage characteristics, the large runoff volumes delivered by the contributing tributaries eventually overwhelm the river and outweigh the added improvement in terms of in-channel storage, thus reducing the anticipated flood relief benefit expected from the dredging.
6. Reductions in water surface profiles in the Vermilion River propagated along the tributaries that drain into the river, but only to limited spatial extents. The degree of reduction inside the tributaries was dependent on the hydraulic gradient and longitudinal bed slopes of each tributary.
7. While there is evidence that dredging can increase channel conveyance and reduce water levels inside the Vermilion River, such reduction was not reflected in a parallel reduction in the spatial extent of flood inundation boundaries under any of the four dredging scenarios. On the other hand, reductions in the duration of inundation were found to be substantial, suggesting that while dredging didn't significantly reduce the maximum extent of inundation, it seems to reduce the duration that flooded areas get inundated.
8. Generally, the results suggest that, regardless of the specific scenario, dredging activities caused a noticeable alteration in the tidal wave range along the river. Extensive dredging scenarios caused a substantial amplification in the tidal signal along the main course of the river, which can facilitate the landward penetration of storm surges into the river.
Data Availability Statement
Publicly available datasets were analyzed in this study. This data can be found at: https://registry.opendata.aws/nwm-archive/; https://data.eol.ucar.edu/dataset/21.093.
Author Contributions
HS and EH conceived of the presented idea. HS planned and carried out the numerical simulations, drafted the manuscript, and designed the figures. EH secured the funding for the project, supervised the project, aided in interpreting the results, and worked on reviewing and finalizing the manuscript. Both authors contributed to the article and approved the submitted version.
Funding
Model development was supported by institutional resources from the University of Louisiana at Lafayette. Additional support was provided by the United States Army Corps of Engineers New Orleans District to perform the dredging under contract number W912P820P0003.
Conflict of Interest
The authors declare that the research was conducted in the absence of any commercial or financial relationships that could be construed as a potential conflict of interest.
Acknowledgments
The authors thank Mr. Donald Sagrera with the Teche Vermilion Freshwater District for providing operational data on the hydraulic structures. The authors also thank Mr. Clyde Barre and Mr. Jeffrey Varisco from the United States Army Corps of Engineers–New Orleans District, for the valuable discussions that informed this study. Insights provided by Dr. Michael Waldon on the complex flow regimes in the river are greatly appreciated.
Supplementary Material
The Supplementary Material for this article can be found online at: https://www.frontiersin.org/articles/10.3389/frwa.2021.628829/full#supplementary-material
References
Advanced Hydrologic Prediction Service (2018). National Weather Service, 2018. Lake Charles: Historic Crests at Surrey Station.
Baker, N. T. (1988). Hydrologic Features and Processes of the Vermilion River, Louisiana. Baton Rouge: U.S. Geological Survey. doi: 10.3133/wri884019
Bilskie, M. V., and Hagen, S. C. (2018). Defining flood zone transitions in low-gradient coastal regions. Geophys. Res. Lett. 45, 2761–2770. doi: 10.1002/2018GL077524
Brunner, G. W. (2016). HEC-RAS River Analysis System. Hydraulic Reference Manual. Version 5.0. Davis, CA: Hydrologic Engineering Center.
Cai, H., Savenije, H., Yang, Q., Ou, S., and Lei, Y. (2012). Influence of river discharge and dredging on tidal wave propagation: Modaomen estuary case. J. Hydraul. Eng. 138, 885–896. doi: 10.1061/(ASCE)HY.1943-7900.0000594
Cook, A., and Merwade, V. (2009). Effect of topographic data, geometric configuration and modeling approach on flood inundation mapping. J. Hydrol. 377, 131–142. doi: 10.1016/j.jhydrol.2009.08.015
Crossett, K., Ache, B., Pacheco, P., and Haber, K. (2013). National Coastal Population Report, Population Trends From 1970 to 2020. Washington, DC: NOAA State of the Coast Report Series, US Department of Commerce.
Cunningham, R., Gisclair, D., and Craig, J. (2009). The Louisiana Statewide LiDAR Project. Baton Rouge, LA: LSU Department of Geography and Anthropology. Available online at: http://atlas.lsu.edu
Eldardiry, H., Habib, E., Zhang, Y., and Graschel, J. (2015). Artifacts in stage IV NWS real-time multisensor precipitation estimates and impacts on identification of maximum series. J. Hydrol. Eng. 22:E4015003. doi: 10.1061/(ASCE)HE.1943-5584.0001291
Gochis, D., Barlage, M., Dugger, A., FitzGerald, K., Karsten, L., McAllister, M., et al (2018). The WRF-Hydro Modeling System Technical Description (Version 5.0). NCAR Technical Note, 107. Available online at: https://ral.ucar.edu/sites/default/files/public/WRFHydroV511TechnicalDescription.pdf
Homer, C., Dewitz, J., Yang, L., Jin, S., Danielson, P., Xian, G., et al. (2015). Completion of the 2011 National Land Cover Database for the Conterminous United States – Representing a Decade of Land Cover Change. Information 81, 346–354. doi: 10.14358/PERS.81.5.345
Hooke, J. M. (1990). Channelized RIVERS: PERSPECTIVES for environmental management, Andrew Brookes, Wiley, Chichester, 1988. No. of pages: 326. Earth Surf. Process. Landforms 15, 291–292. doi: 10.1002/esp.3290150312
Jarihani, A. A., Callow, J. N., McVicar, T. R., Van Niel, T. G., and Larsen, J. R. (2015). Satellite-derived digital elevation model (DEM) selection, preparation and correction for hydrodynamic modelling in large, low-gradient and data-sparse catchments. J. Hydrol. 524, 489–506. doi: 10.1016/j.jhydrol.2015.02.049
Juan, A., Gori, A., and Sebastian, A. (2020). Comparing floodplain evolution in channelized and unchannelized urban watersheds in Houston, Texas. J. Flood Risk Manage. 13:e12604. doi: 10.1111/jfr3.12604
Kim, J., Warnock, A., Ivanov, V. Y., and Katopodes, N. D. (2012). Coupled modeling of hydrologic and hydrodynamic processes including overland and channel flow. Adv. Water Resour. 37, 104–126. doi: 10.1016/j.advwatres.2011.11.009
Kinsland, G. L., and Wildgen, J. (2006). “Evolution of the Morphology of the Vermilion River Near Lafayette, Louisiana, USA; Consequent Flooding Problems and a Mitigation Plan; Some Features on the Surface of the Prairie Complex: All Illustrated With LIDAR Imagery”, Gulf Coast Association of Geological Societies Transactions, Vol. 56, 353–365.
Liao, K. H., Chan, J. K. H., and Huang, Y. L. (2019). Environmental justice and flood prevention: the moral cost of floodwater redistribution. Landsc. Urban Plan. 189, 36–45. doi: 10.1016/j.landurbplan.2019.04.012
NCEI (2020). Billion-Dollar Weather and Climate Disasters. NOAA National Centers for Environmental Information (NCEI). Available online at: https://www.ncdc.noaa.gov/billions/.
Nunnally, N. R. (1978). Stream renovation: an alternative to channelization. Environ. Manage. 2, 403–411. doi: 10.1007/BF01872915
Pattison, I., Lane, S. N., Hardy, R. J., and Reaney, S. M. (2014). The role of tributary relative timing and sequencing in controlling large floods. Water Resour. Res. 50, 5444–5458. doi: 10.1002/2013WR014067
Pierce, A. R., and King, S. L. (2013). “12.14 Valley plugs, land use, and phytogeomorphic response,” in Treatise on Geomorphology, ed Shroder, J. F., (San Diego, CA: Academic Press), 221–235. doi: 10.1016/B978-0-12-374739-6.00330-4
Prestegaard, K. L., and Matherne Katyl, N. (1994). Spatial variations in the magnitude of the 1993 floods, Raccoon River Basin, Iowa. Geomorphol. Nat. Hazards 10, 169–182. doi: 10.1016/B978-0-444-82012-9.50016-5
Ralston, D. K., Talke, S., Geyer, W. R., Al-Zubaidi, H. A. M., and Sommerfield, C. K. (2019). Bigger tides, less flooding: effects of dredging on barotropic dynamics in a highly modified estuary. J. Geophys. Res. Oceans 124, 196–211. doi: 10.1029/2018JC014313
Rose, S., and Peters, N. E. (2001). Effects of urbanization on streamflow in the Atlanta area (Georgia, USA): a comparative hydrological approach. Hydrol. Process. 15, 1441–1457. doi: 10.1002/hyp.218
Saad, H. A., Habib, E. H., and Miller, R. L. (2020). Effect of model setup complexity on flood modeling in low-gradient basins. J. Am. Water Resour. Assoc. 1–19. doi: 10.1111/1752-1688.12884
Schoof, R. (1980). Environmental impact of channel modification 1. J. Am. Water Resour. Assoc. 16, 697–701. doi: 10.1111/j.1752-1688.1980.tb02451.x
Shankman, D., and Pugh, T. B. (1992). Discharge response to channelization of a coastal plain stream. Wetlands 12, 157–162. doi: 10.1007/BF03160604
Shastry, A., Luo, C., Aristizabal, F., and Egbert, R. (2017). Comparing NWM Inundation Predictions With Hydrodynamic Modeling. National Water Center Innovators Program Summer Institute Report 2017, 49. Washington, DC: Consortium of Universities for the Advancement of Hydrologic Science, Inc.
USACE (1995). Lafayette Parish, Louisiana Flood Control: Reconnaissance Report. New Orleans, LA: US Army Corps of Engineers, New Orleans District.
USACE (2015). Navigation Condition Surveys. New Orleans, LA: US Army Corps of Engineers, New Orleans District, Operations Division.
USACE (2016). HEC-RAS River Analysis System Hydraulic Reference Manual. Version 5.0. Davis, CA: Institute of Water Resources, Hydrological Engineering Center.
van der Wiel, K., Kapnick, S. B., van Oldenborgh, G. J., Whan, K., Philip, S., Vecchi, G. A., et al. (2017). Rapid attribution of the August 2016 flood-inducing extreme precipitation in south Louisiana to climate change. Hydrol. Earth Syst. Sci. 21, 897–921. doi: 10.5194/hess-21-897-2017
Wang, X., Kinsland, G., Poudel, D., and Fenech, A. (2019). Urban flood prediction under heavy precipitation. J. Hydrol. 577:123984. doi: 10.1016/j.jhydrol.2019.123984
Watson, K. M., Storm, J. B., Breaker, B. K., and Rose, C. E. (2017). Characterization of Peak Streamflows and Flood Inundation of Selected Areas in Louisiana from the August 2016 Flood (2017–5005). Reston, VA: U.S. Geological Survey. doi: 10.3133/sir20175005
Webster, P., Rangeley-Wilson, C., Juniper, T., and Harrison, P. (2014). Floods and Dredginga Reality Check. London: CIWEM.
Keywords: riverine dredging, channel modification, tidal propagation, swamps, floods, reverse flows
Citation: Saad HA and Habib EH (2021) Assessment of Riverine Dredging Impact on Flooding in Low-Gradient Coastal Rivers Using a Hybrid 1D/2D Hydrodynamic Model. Front. Water 3:628829. doi: 10.3389/frwa.2021.628829
Received: 13 November 2020; Accepted: 15 February 2021;
Published: 15 March 2021.
Edited by:
Valentina Prigiobbe, Stevens Institute of Technology, United StatesReviewed by:
Hong Xuan Do, Ho Chi Minh City University of Agriculture and Forestry, VietnamHatim O. Sharif, University of Texas at San Antonio, United States
Copyright © 2021 Saad and Habib. This is an open-access article distributed under the terms of the Creative Commons Attribution License (CC BY). The use, distribution or reproduction in other forums is permitted, provided the original author(s) and the copyright owner(s) are credited and that the original publication in this journal is cited, in accordance with accepted academic practice. No use, distribution or reproduction is permitted which does not comply with these terms.
*Correspondence: Emad H. Habib, ZW1hZC5oYWJpYkBsb3Vpc2lhbmEuZWR1