 Juan A. Rivera
 Sebastián Otta
 Carolina Lauro
 Natalia Zazulie2,3
- 1Instituto Argentino de Nivología, Glaciología y Ciencias Ambientales (IANIGLA), Centro Científico-Tecnológico CONICET Mendoza, Mendoza, Argentina
- 2Departamento de Ciencias de la Atmósfera y los Océanos, Facultad de Ciencias Exactas y Naturales, Universidad de Buenos Aires, Buenos Aires, Argentina
- 3Consejo Nacional de Investigaciones Científicas y Técnicas, Buenos Aires, Argentina
Most of the water used for the development of the main socio-economic activities in Central-Western Argentina (CWA), an arid to semi-arid region, home to most of the Argentinean wine production, relies on surface streamflow from several snow-fed rivers. During the last decade (2010-2020), reduced snow accumulation over the higher elevations of the Andes mountains triggered the occurrence of hydrological drought over CWA, affecting winter tourism, restricting water use for irrigation and domestic use, and leading to socio-political disputes. This study provides a detailed description of the recent hydrological drought conditions through the use of streamflow records from 15 river basins, which were complemented by precipitation, snowpack, and water equivalent thickness measurements to provide a comprehensive picture of the water losses over the last decade. Hydrological drought indices derived from the threshold level method and the standardized streamflow index allowed characterizing the unusualness of this dry period in the context of the last 49 years. The hydrological deficit over the last decade highlighted the challenges faced by the water managers to provide water for irrigation in the main agricultural oases, with a likely overexploitation of the groundwater resources to supplement the limited surface runoff. The hydrological drought severity increased since 2017, with record-breaking levels in several basins, particularly during the period between July 2019 and June 2020 for the rivers located between 35° and 36°S. We identified the main hydrological drought impacts in CWA, as well as the need for improved mitigation strategies to cope with current and future drought conditions. We also analyzed the current limitations in terms of snow and groundwater observations, highlighting the necessity for an effective hydrological drought monitoring system, together with an improved forecast of snow accumulation in the headwaters, which can contribute to better regional water management plans.
Introduction
Water availability in arid and semi-arid regions has been subject to large variations over the last decades; as a result of the increasing frequency of hydrometeorological extreme events due to global warming (Feng et al., 2020; Zhao et al., 2020). Improving the understanding of the situations that are prone to generate water scarcity issues is a relevant topic for the development of better water management practices over these regions. In Central-Western Argentina (CWA), snow accumulation over the higher elevations of the Andes is the main source of water for the rivers that sustain the mountain ecosystems, the recharge of aquifers, the development of agricultural activities, and the drinking water supply (Masiokas et al., 2020). As observed in several mid-latitude regions of the Southern Hemisphere (Cai et al., 2012), a sustained long-term precipitation decline along the Andes mountain range, likely attributed to the poleward expansion of the descending branch of the Hadley Circulation (Villamayor et al., 2019; Rivera and Arnould, 2020; Rivera et al., 2020), set a complex scenario for the regional water resources over both Argentina and Chile. With the intensification and a more southward position of the semipermanent South Pacific Anticyclone, the storm tracks responsible for the winter precipitation over the Andes were displaced poleward, leading to long-term precipitation declines that are particularly striking over Central Chile (Boisier et al., 2018; Villamayor et al., 2019). The trends in streamflow records over CWA showed a decline since the 1900s, which partially reversed during the late 1970s (Carril et al., 1997). Caragunis et al. (2020) found lower streamflow records in the rivers of CWA during 1990-2014 compared to the values based on the 1920-1944 period. Since the winter of 2010, the snowpack over the Andes between 30° and 37° S was well below its long-term average (Saavedra et al., 2018; Masiokas et al., 2020), leading to a reduced snow contribution to the discharge for the major rivers of CWA. This condition favored the occurrence of hydrological droughts, typically defined as periods with abnormally low streamflow in rivers, low levels in lakes and reservoirs, and reduced groundwater (Van Loon, 2015).
Numerous indices exist for the definition and description of hydrological droughts, which are primarily based on daily or monthly streamflow data (Stahl et al., 2020) and can roughly be divided into threshold-based indices and standardized indices (Van Loon, 2015). Hydrological droughts over CWA were characterized by Rivera et al. (2017a) using threshold-based indices for the quantification of drought frequency, duration, and severity for the period 1957-2014. The authors found that hydrological droughts are significantly modulated by the El Niño-Southern Oscillation (ENSO), and the Pacific Decadal Oscillation (PDO), highlighting the influence of the tropical Pacific Ocean in the development of hydrological drought conditions and its relevance for potential predictability of hydroclimatic variations over the region. The recent hydrological drought was analyzed over the period 2010-2015 using standardized indices (Rivera et al., 2017b). This allowed the comparison between the recent drought period, in terms of duration and severity, with other previous hydrological drought events, and also to explore some of its atmospheric and oceanic drivers. Over Central Chile, this recent drought period was defined as a “mega-drought” and has been extensively analyzed in terms of its impacts on the hydroclimate and vegetation (Garreaud et al., 2017) as well as its dynamical patterns (Garreaud et al., 2020).
The recent decade of hydrological drought affected the main socio-economic activities over CWA, particularly along the Andean foothills, which are only possible through irrigation. This snow drought period, together with the regional increases in temperature, favored a sustained glacier mass loss over the higher elevations of the Andes ranges (Dussaillant et al., 2019; Ferri et al., 2020). Future projections show that temperature increases will be more pronounced at higher elevations compared to the lowlands, in line with a significant reduction in albedo over the Andes (Zazulie et al., 2018; Rivera et al., 2020). Projected changes in the regional circulation patterns, as the southward expansion of the Hadley Circulation, are expected to favor the continuity of the precipitation decline that has been observed since the last Century, leading to more frequent drought conditions (Cook et al., 2020; Fahad et al., 2020; Rivera et al., 2020; Spinoni et al., 2020). The decrease in precipitation, together with the expected increase in temperature will generate glacier mass balance losses, with an early snowpack melting that is expected to have serious implications for water management practices (Zazulie et al., 2018; Hock et al., 2019). This calls for improved monitoring of hydrological drought conditions and the creation of drought management plans to provide water security for the local communities and environmental needs.
The objective of this study is to provide an updated evaluation of the recent (2010-2020) hydrological drought conditions over CWA, using records from the main rivers of the region and two of the most commonly used hydrological drought indices for its monitoring and characterization. We complemented these records with the available snow course data over the higher elevation of the Andes in order to link the evolution of snow accumulation to hydrological drought severity. The main impacts arising from this decade of hydrological drought were quantified, as well as the current regional limitations in terms of drought management plans, drought monitoring, and forecasting. We aim to provide relevant information for an improved drought characterization considering several components of the hydrological cycle over CWA, which can aid the decision making processes in terms of drought declaration and monitoring, and to assist future water practices over the region.
Data and Methods
Study Area
The CWA is a region located roughly between 30°S and 37°S and 67° to 70°W (Figures 1A,B), characterized by a strong influence of topography on the regional and local climate (Viale et al., 2019). The Andes mountain range creates a marked longitudinal gradient in precipitation, with a strong rain shadow effect over CWA that contributes to its arid to semi-arid condition (Viale et al., 2019; Rivera et al., 2020). This precipitation gradient is also evident in a north-south direction, from less than 200 mm at 30°S to over 600 mm south of 36°S (Rivera and Arnould, 2020). Snow-fed rivers are born at the higher elevations of the Andes ranges, where much of the precipitation falls as snow during the cold season (April to October) and is strongly modulated by the El Niño-Southern Oscillation, the Pacific Decadal Oscillation, and the Southern Annular Mode on interannual to multidecadal timescales (Rivera et al., 2017a; Lauro et al., 2019; Sarricolea et al., 2019). The seasonal displacement of the Southeastern Pacific High allows the northward progression of frontal systems associated with mid-latitude cyclones that provide most of the precipitation over the Andes, with atmospheric rivers playing a significant role in precipitation and snow accumulation (Viale et al., 2018; Saavedra et al., 2020). The summer dry season along the Andes is characterized by isolated convective storms in the valleys and the Andean foothills, triggered by diurnal warming and occasional incursions of moist air from Southeastern South America (Garbarini et al., 2019; Camisay et al., 2020). These precipitation events usually generate a peak in streamflow that lasts only a few days, activating ephemeral rivers and increasing the sediment load that affects drinking water treatment plants (Sepúlveda et al., 2015).
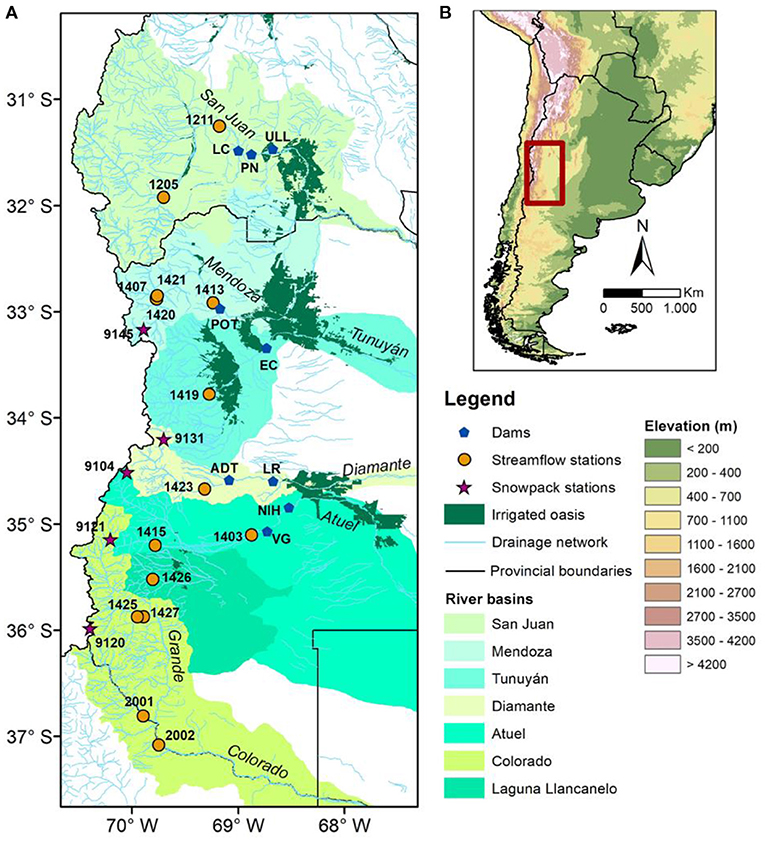
Figure 1. (A) Study area with the location of the main river basins, the natural drainage network, the irrigated oases, the streamflow and snowpack stations, and the main dams. The names of the dams are the following: PN, Punta Negra; ULL, Ullúm; LC, Los Caracoles; POT, Potrerillos; EC, El Carrizal; ADT, Agua del Toro; LR, Los Reyunos; VG, Valle Grande; NIH, Nihuil. Details of the capacity of each dam can be found in Table 2. (B) Regional setting of Central-Western Argentina, with the main orographic features.
The main river basins of CWA are, from north to south, San Juan, Mendoza, Tunuyán, Diamante, Atuel, Grande, and Colorado (Figure 1A). Between 66 and 76% of the annual discharge occurs during the warm season, due to snowmelt and glacier ablation with increased temperatures over the higher elevation of the Andes, leading to a unimodal hydrological regime (Lauro et al., 2019). Over 85% of the interannual variability in the Andean streamflows along CWA can be explained by variations in winter snow accumulation (Masiokas et al., 2020), highlighting the significant role of snow droughts in the occurrence of hydrological droughts over the study area (Rivera et al., 2017b). Temperature variations during the warm season also contribute to streamflow variability, modulating the timing of occurrence of the maximum yearly streamflow (Araneo and Villalba, 2015) and also playing a relevant role at intraseasonal time scales (Araneo et al., 2015). The contribution of glacier ablation is particularly significant during snow drought periods, with groundwater also being a water source to the Andean streamflow (Crespo et al., 2020).
These rivers irrigate several oases over CWA (Figure 1A), where the main agro-industrial activities take place This region is the largest producer of wine in Argentina, with more than 90% of the total grapevine production (Cabré and Nuñez, 2020). Agricultural water use ranges from 50% of the available water during dry years, to 90% during years with average snow accumulation, with regional differences between river basins. In an adaptation strategy to overcome the limited water resources from a warmer and drier climate, large producers gradually set the new grape production areas at upper elevations by the Andes foothills, looking for lower temperatures, proximity to water sources, better water quality, and less pollution (Montaña et al., 2016; Rojas et al., 2020). However, these territorial transformations generated social conflicts due to the lack of planning and regulation, as well as the inequities in water use and distribution (Salomón-Sirolesi and Farinós-Dasí, 2019). The construction of dams and reservoirs near the agricultural oases has become a common practice to increase the resiliency to drought conditions, with 9 main dams (Figure 1A) that provide water for irrigation, hydropower generation, tourism and recreational activities, and human consumption. Between the headwaters and the location of the streamgauges, there are no large reservoirs or dam constructions that can alter the natural flow and, therefore, the estimation of hydrological drought occurrences (Rivera et al., 2017a).
Data Sets
We used daily streamflow records from 15 stations located between 31°S and 38°S, in the headwaters on the main rivers of CWA (Figure 1). These records were obtained through the National System of Hydrological Information (https://snih.hidricosargentina.gob.ar/), spanning the period between July 1971 and June 2020. Table 1 shows details for the selected stations. Records from San Juan (1211), Barrancas (2001), and Colorado (2002) rivers were only available until June 2019. Previous studies demonstrated the quality and representativeness of the selected records (Vich et al., 2014; Rivera et al., 2017a; b; Rivera and Penalba, 2018; Lauro et al., 2019), which allows a comprehensive evaluation of the hydrological aspects of the region. These records were subjected to quality control procedures and several gap-filling routines. These infilling methods were applied depending on the size of the missing data gap, the hydrological conditions at the site when the gap occurred, and the availability of nearby gauging stations, as described in Vich et al. (2014) and Rivera et al. (2017a). Nevertheless, the need for data infilling was minimal given that the selected stations had less than 5% missing records. Most of the data gaps were completed by the calculation of linear regressions between the selected series and data from alternative neighboring gauge stations.
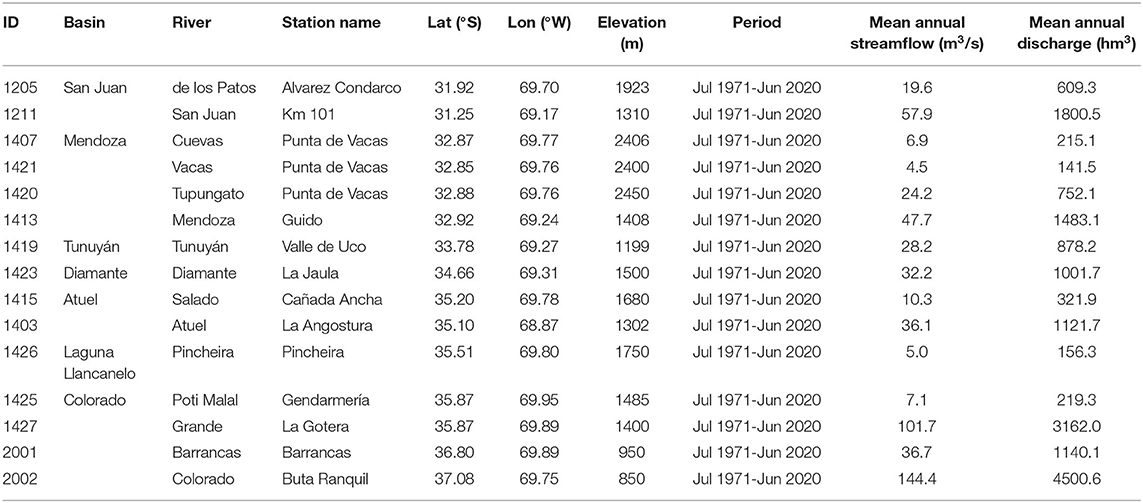
Table 1. Main characteristics of the streamflow stations used in this study.
Given the significant relationship between streamflow variability during the warm season and snow accumulation during the cold season, we analyzed data from five snow pillows located in the higher elevations of the Andes (Figure 1A), also part of the National System of Hydrological Information. Table 2 indicates the location and period of record for each snow course. From these records, we obtained the maximum yearly value of snow water equivalent (MSWE) between 1989 and 2020. The MSWE was selected to overcome limitations linked to snow measurements over the region, which affect the estimation of the snowpack during the cold season (Masiokas et al., 2006). The MSWE anomalies (MSWEA) were calculated based on the 1990-2020 base period except for the records from Paso Pehuenches station, which starts in 1999 and, therefore, uses the 1999-2020 as reference period. In order to give a broader perspective of the observed precipitation decline over the study area, the snow observations were supplemented by data from the Global Precipitation Climatology Center (GPCC, Becker et al., 2013). For this purpose, we concatenated two GPCC products: the GPCC Full Data Monthly Version 2018 (GPCC v2018), which covers the period from 1891 to 2016, with the GPCC Monitoring Product Version 6, from January 2017 to October 2020. Both datasets were selected to have the same spatial resolution to optimize homogeneity. This allowed to obtain monthly precipitation records covering the period 1891-2020 with a horizontal resolution of 1° x 1°. Then, we selected the months corresponding to the wet season (April to October) to obtain a precipitation climatology for the 1981-2010 baseline period. The monthly precipitation totals during the wet season of the period 2010-2020 were expressed as departures from the 1981-2010 climatology, considering the pixels between 28° and 40°S west of 67°W, allowing to obtain the spatial pattern of the GPCC precipitation anomalies.
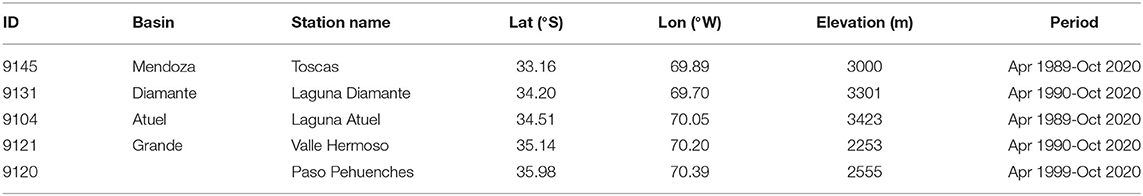
Table 2. Main characteristics of the snowpack stations used in this study.
Finally, in view of the lack of water level records at piezometric wells over CWA, we used monthly Water Equivalent Thickness (WET) anomalies from the Gravity Recovery and Climate Experiment (GRACE, Tapley et al., 2004, 2019) as a proxy to monitor changes in groundwater levels. The objective of the GRACE project is to measure the Earth's gravity field and its changes, which could be linked to changes in the components of the hydrological cycle. GRACE estimates provide a complementary tool for monitoring and measuring groundwater changes at global and regional scales (Chen et al., 2016). Data were retrieved from the NASA Jet Propulsion Laboratory Data Analysis Tool for the GRACE (2002-2017) and GRACE Follow-On (GRACE-FO) (2018-present) missions. Given the effective spatial resolution of GRACE (>150,000 km2) is too coarse to characterize the spatial variability of groundwater over CWA, we used WET records interpolated to a 1° x 1° grid for the pixels located over the study area. While GRACE and GRACE-FO estimates have shown good performances for the identification of changes in the hydrological conditions over regions of South America as La Plata Basin (Chen et al., 2010), Colombia (Bolaños et al., inpress), and Patagonia (Richter et al., 2019), and the use of gravity measurements has been recommended for the Andean region (Masiokas et al., 2019), little research focused on the use of GRACE data to quantify hydrological drought conditions over CWA. For instance, Rodell et al. (2018) identified a hot spot of water loss over CWA due to the recent multi-year drought condition using GRACE estimations of terrestrial water storage.
Hydrological Drought Indices
For the monitoring and evaluation of hydrological drought conditions, several indicators were developed mainly from threshold-based indices and standardized indices. These indices allow the identification of relevant drought characteristics such as the onset, timing, duration, severity, spatial extent, and frequency. While the main water management agencies over CWA lack the use of hydrological drought indices for the monitoring of streamflow levels, previous research have used a variety of indices to characterize hydrological droughts over the study area (Díaz et al., 2016, 2018; Rivera et al., 2017a,b; Rivera and Penalba, 2018; Caragunis et al., 2020). Two of the most commonly used drought indices over the study area are described in the following sections.
Indicators Derived From the Threshold Level Method
Hydrological drought characteristics on a daily basis were identified by using the threshold level approach, considering truncation levels derived from the flow-duration curve (Zelenhasić and Salvai, 1987; Tallaksen et al., 1997). The thresholds can be either fixed or variable over the year, depending on the desired application. Even when the seasonality in the streamflow records over the study area is important, we decided to analyze both high and low flow seasons; therefore, a variable threshold at a daily resolution was selected for the identification of hydrological droughts. For perennial rivers, thresholds levels range between the 70th and 95th percentile (Van Loon, 2015). In this study, three daily varying thresholds were selected, corresponding to the flow equaled or exceeded for 70% (Q70), 80% (Q80), and 90% (Q90) of the time, as indicators of moderate, severe, and extreme hydrological droughts, respectively (Rivera et al., 2017a,b). The daily varying thresholds were computed from the selected percentiles of the flow-duration curve, based on the 49 years of streamflow records, with the 29 February values of the leap years excluded. We applied a 7-day moving average to the daily streamflow values in order to increase the sample size and to create a smooth flow-duration curve for each day of the year. This allowed not only to obtain smooth threshold levels, but also to eliminate minor and mutually dependent drought events (Stahl, 2001; Beyene et al., 2014; Rivera et al., 2017a). Thus, a hydrological drought period can be defined for the days when streamflow is below the thresholds for a given period of interest. Figure 2 illustrates the method using data from the Atuel River and the Q70 as the threshold level for the identification of hydrological drought conditions during the hydrological year 2010/11. During most of the selected period, the streamflow was below the Q70, indicating the occurrence of hydrological droughts, particularly during the austral summer of the selected year, when a large deficit volume was observed.
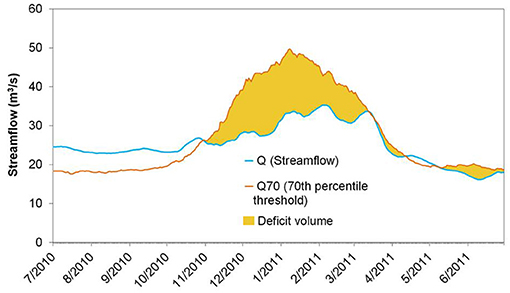
Figure 2. Identification of hydrological drought conditions based on the daily varying threshold level Q70, using streamflow records from Atuel river during the period from July 2010 to June 2011. The data was smoothed by 15-day moving average. Hydrological drought conditions are observed when the observed daily streamflow records (Q) are lower than the Q70 threshold, with the difference between the streamflow and the selected threshold quantifying the hydrological deficit (marked with orange color).
Annual indices describing hydrological drought characteristics were defined using two indices (Hisdal et al., 2001): the annual number of drought days (ANDD), calculated by counting the days per year with streamflow observations below the selected thresholds; the annual cumulative deficit volume (ACDV), calculated as the sum of the differences between the streamflow observations and the threshold levels over the hydrological drought periods, divided by the mean annual streamflow. For each hydrological year, the mathematical expressions of the indices are the following:
where n = number of hydrological drought events; ts, n = hydrological drought onset of the event n; te, n = hydrological drought demise of the event n; Dn = hydrological drought duration of the event n.
where Qi is the daily observed streamflow at day i (i = 1,…, 365) and QT, i is the selected threshold (T = 70, 80, 90) at day i.
The ANDD is an indicator of hydrological drought duration while the ACDV is proportional to the drought severity. Similar metrics were applied for the assessment of hydrological droughts in the United States (Poshtiri and Pal, 2016), France (Giuntoli et al., 2013), and South Korea (Sung and Chung, 2014), as well as over CWA (Rivera et al., 2017a) and Patagonia (Rivera et al., 2018). The annual indices were calculated for each of the selected stations, for the hydrological years considering the period between July 1st and June 30th.
Standardized Streamflow Index (SSI)
In order to evaluate hydrological drought conditions on a monthly time step, we have calculated the standardized streamflow index (SSI, Vicente-Serrano et al., 2012), developed following the theoretical concept of the standardized precipitation index (SPI, McKee et al., 1993). The SSI characterizes the streamflow deficit in terms of standard deviations relative to the long-term mean at a given location and for a given time scale (Rivera and Penalba, 2018). The SSI consists of multiple time scales, where streamflow is aggregated over a user-defined period ranging typically from 1 (SSI1) to 48 (SSI48) months. In this study we considered a time scale of 3 months (SSI3) to filter high-frequency variations (Rivera et al., 2017b; Rivera and Penalba, 2018). The following steps were used for deriving the SSI3 time series. The monthly streamflow time series were aggregated to obtain 3-month streamflow series for each calendar end-month (of the accumulation period) for the 49 years of records. Each of them was fitted to a two-parameter lognormal probability density function, which was demonstrated to be the distribution better representing the streamflow records over the study area (Rivera and Penalba, 2018). The lognormal distribution is given as
where Q denotes the aggregated streamflow, μ and σ are the mean and standard deviation of the logarithmically transformed streamflow, respectively (Zorn and Waylen, 1997). Once F(x) is calculated, the 12 probability density functions were transformed to the standard normal distribution with mean zero and variance one to finally obtain the SSI3 time series, following the approximation from Abramowitz and Stegun (1965):
P is the probability of exceeding a determined Q value, and P = 1 – F(Q). If P > 0.5, P is replaced by 1 – P and the sign of the resultant SSI3 is reversed. The constants are C0 = 2.515517; C1 = 0.802853; C2 = 0.010328; d1 = 1.432788; d2 = 0.189269; and d3 = 0.001308. More details for the calculation of the SSI can be found in Vicente-Serrano et al. (2012). The SSI3 was computed using the R-package “SCI” (Gudmundsson and Stagge, 2016).
From the SSI3 time series, a hydrological drought event was defined as a period in which the SSI is continuously negative and the index reaches a value of −1.0 or less (Barker et al., 2016; Rivera et al., 2017b; Chen et al., 2019). Figure 3 illustrates the main characteristics of a hydrological drought event based on the SSI3 of the Mendoza River during the period from January 1995 to December 2000. Two hydrological drought events (E1 and E2) with durations D1 and D2 can be identified. Each of them begins when the SSI3 first falls below zero and then reaches a value of −1.0 or less and ends with the first positive value of SSI3. The severity of each event (S1 and S2) was identified as the minimum SSI3 value within the drought event. Three drought categories were used for classifying the hydrological drought severity: −1.5 < SSI3 ≤ −1.0 (moderate drought), −2.0 < SSI3 ≤ −1.5 (severe drought), and SSI3 ≤ −2.0 (extreme drought). This classification was based on the categories established for the SPI to define meteorological drought conditions (Lloyd-Hughes and Saunders, 2002).
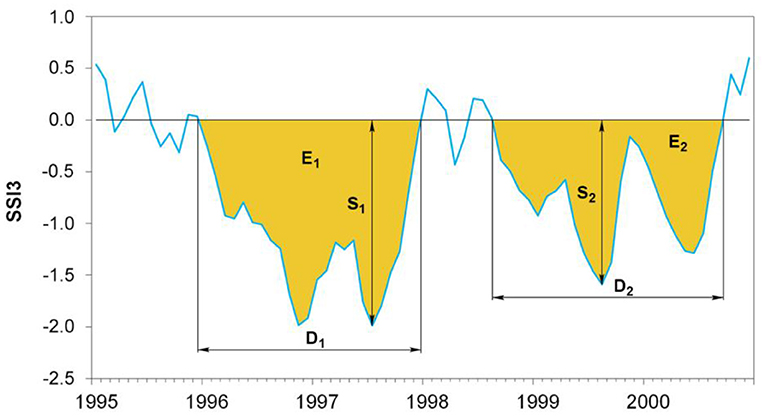
Figure 3. Temporal evolution of the SSI3 for the Mendoza River between January 1995 and December 2000 and the main hydrological drought characteristics. En, event n; Dn, duration of the event n; Sn, severity of the event n (n = 1, 2).
Results
Precipitation Deficits Triggering Hydrological Drought Conditions
The recent hydrological drought conditions over CWA and Central Chile responds to precipitation deficits during the wet season (April-October), with a spatial pattern showing anomalies larger than −10 mm/month located mainly between 32° and 40°S, west of 70° W (Figure 4A). While the deficit over the lowest areas of Central Chile is related to rainfall and, thus, meteorological drought conditions, the precipitation deficit over the higher elevations of the Andes mountain range impacted the snowpack that provides the main source of water for the rivers of CWA. Therefore, the snow drought signal propagated through the diverse components of the hydrological cycle, leading to hydrological drought conditions in the adjacent foothills east of the Andes. In order to illustrate the variability of snow accumulation, Figure 4B shows the annual time series of the MSWEA for the five snow pillows distributed along the Central Andes of Argentina, with records spanning the period 1990-2020. The MSWEA was used as a surrogate for the total snow accumulation at each site. The anomalies during the 1990-2009 period show alternations between above-average and below-average snow accumulation, with large interannual variability and also spatial patchiness (Figure 4B). The largest deficit over the 31 years period was recorded during the winter of 1996, while the higher snow accumulation was registered in 2005. Between 2010 and 2020, persistent below-average snow accumulation was observed over the Andes. The exception being the winter of 2015, characterized by the influence of El Niño conditions, with above-average MSWE at Toscas, Laguna Atuel, and Valle Hermoso stations, although close to the long-term (1990-2020) average and negative MSWEA at Laguna Diamante and Paso Pehuenches. The lowest snow accumulation of the 2010-2020 period was registered during the winter of 2019, with a MSWEA lower than 450 mm considering the average at the 5 sites, being the lowest regional accumulation since 1996. Even when snow droughts are a recurrent hazard over the study area (Rivera et al., 2017b), the temporal consistency of the reduced snow storage during the 2010-2020 period is remarkable in the context of the last 31 years.
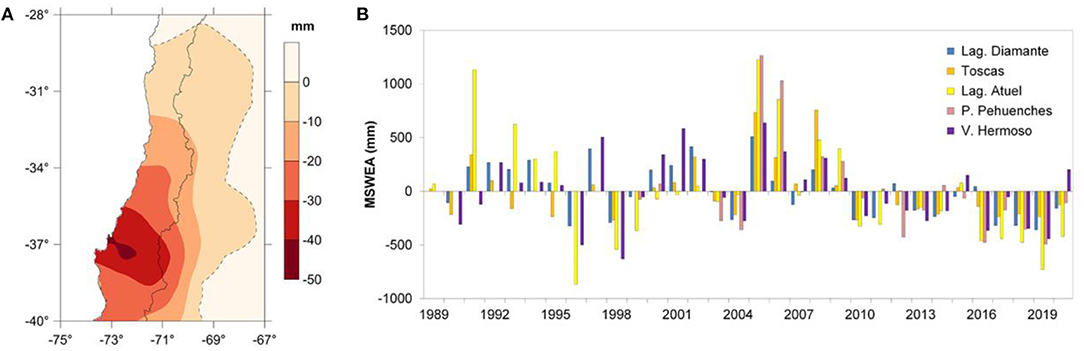
Figure 4. (A) Spatial pattern of the GPCC precipitation anomalies (in mm/month) during the months of April to October of the years 2010-2020, based on the 1981-2010 climatology. (B) Temporal evolution of MSWEA in the five selected snow pillow stations, calculated as departures from the period 1990–2020.
Hydrological Drought Characteristics Based on the Threshold Level Method
We analyzed the streamflow variability over the last 49 years, through the hydrological drought indices described previously, with focus on the hydrological drought conditions during the 2010-2020 period. For this, we performed a basin-scale analysis (Figure 5) and a regional evaluation of the hydrological drought for different severity levels (Figure 6). The basin-scale assessment is expressed in the form of a heat map using the metrics ANDD (Figure 5A) and ACDV (Figure 5B) based on the Q70 threshold, with catchments orientated roughly from north to south. In general, a homogeneous spatial behavior can be observed in terms of streamflow variations over CWA, given that in most cases the increases in both ANDD and ACDV are synchronous. The main hydrological drought periods can be identified during 1971/72, 1975/76-1976/77, 1989/90-1990/91, 1996/97-1999/00, and 2010/11-2019/20. The recent hydrological drought exhibit higher values of ANDD and ACDV over the southern basins of the study area, particularly south of 35°S. This result is contrasting with the findings of Alvarez-Garreton et al. (2021) considering the streamflow records in Central Chile, which show higher severity for the basins located between 30° and 35°S. In average, 4 basins had more than 300 days per year with hydrological drought conditions over the last decade: Salado River (1415), Pincheira River (1426), Poti Malal River (1425), and Colorado River (2002). Figure 6 shows the regional time series of the ANDD (Figure 6A) and ACDV (Figure 6B), for the three selected threshold levels, calculated as the average of the time series of each of the 15 selected rivers over the study area. Both annual indices show that the recent hydrological drought period over CWA is remarkable in terms of temporal consistency, duration, and severity. The maximum values of ANDD and ACDV were observed during the hydrological year 2019/20 for all the severity levels (Figure 6), in agreement with the large negative anomalies of MSWE during winter 2019, being the year with lowest snow accumulation since 1998 (Figure 4B). During the last decade, 8 years registered more than 250 days with hydrological drought conditions in CWA, a condition that is unprecedented over the analyzed period. The hydrological years 2010/11 to 2014/15 and 2017/18 to 2019/20 experienced more than 200 days with severe hydrological drought conditions. Extreme hydrological drought periods overpassing 100 days were observed in 7 of the last 10 years of streamflow records, a condition previously registered only during the hydrological years 1971/72 and 1996/97 (Figure 6A). Given the direct and significant relationship between the number of days with streamflow below the selected thresholds and the cumulative deficit volume (Rivera et al., 2017a, 2018), similar results in terms of unusualness were found considering the ACDV over the last decade (Figure 6B).
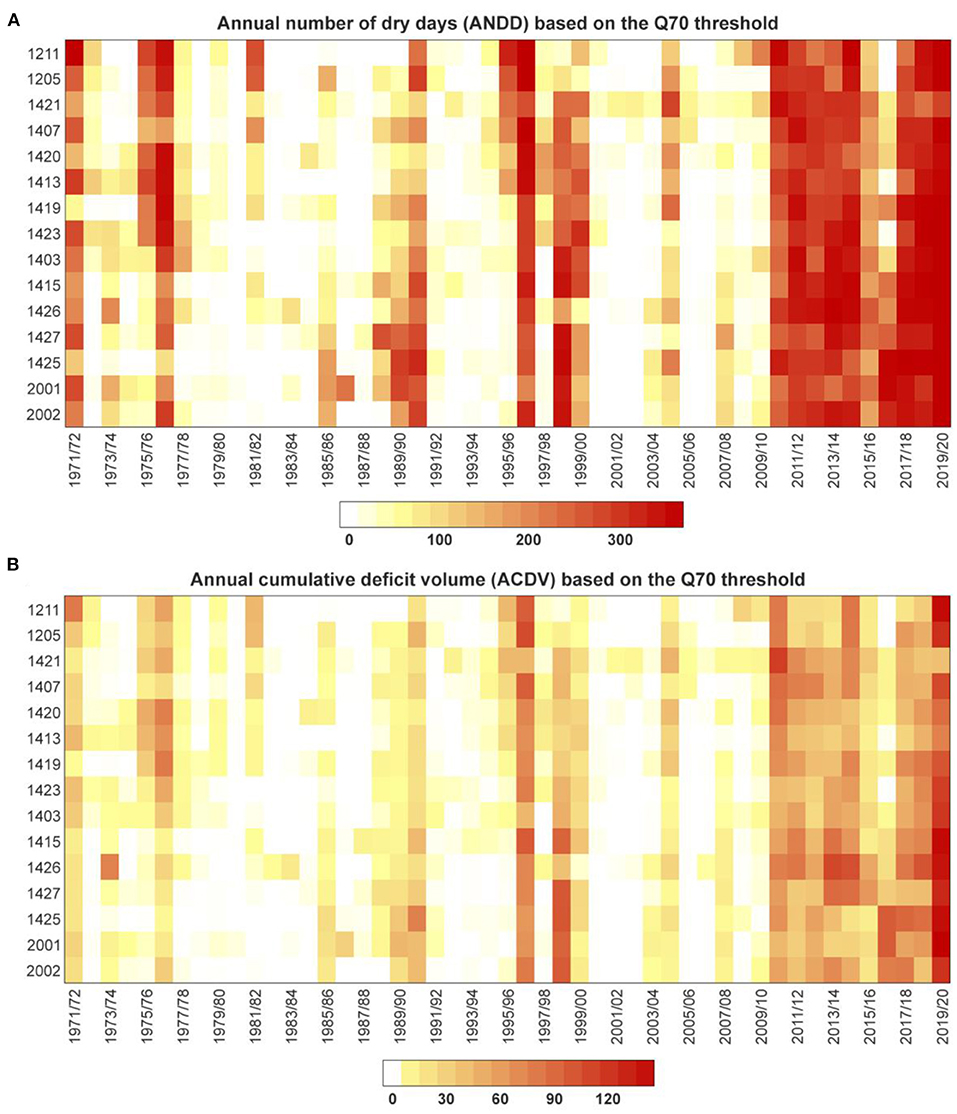
Figure 5. (A) Heat map of the annual number of dry days (ANDD) based on the Q70 threshold for the 15 selected rivers of the CWA, arranged roughly from north to south on the y axis, for the 1971/72-2019/20 period. (B) Same as (A) for the annual cumulative deficit volume (ACDV) at each location.
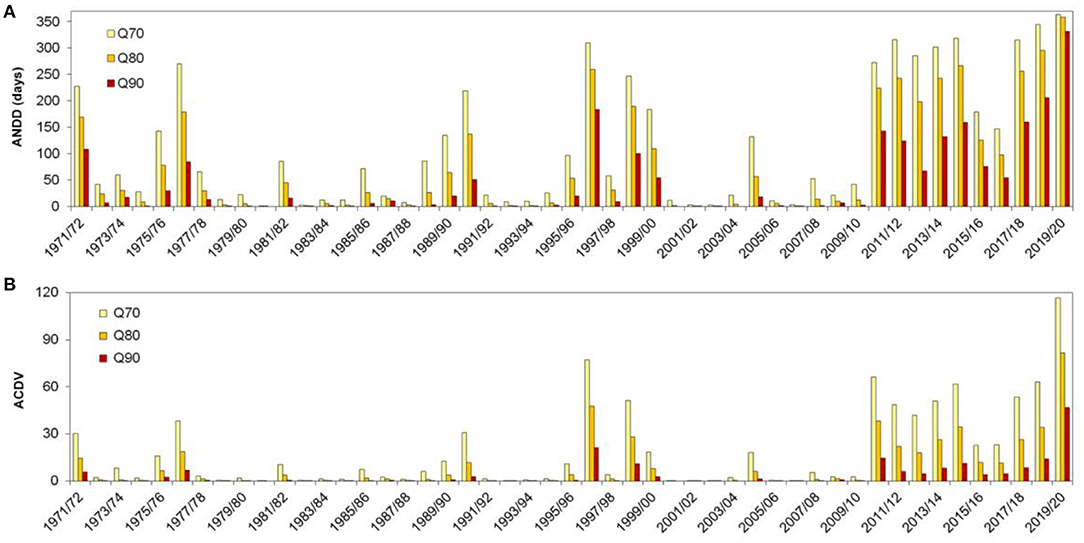
Figure 6. Regional time series of the ANDD (A) and the ACDV (B) for the three selected threshold levels during 1971/72-2019/20.
Hydrological Drought Characteristics Based on the Standardized Streamflow Index
Considering monthly streamflow records, the SSI3 time series shows a homogeneous behavior for all the analyzed basins (Figure 7), supporting our choice to perform a regional average considering the indices based on the threshold level method. During the 2010-2020 period, the SSI3 shows a prolonged drought period between the years 2010/11 and 2014/15, followed by a drought recovery due to the winter snow accumulation during 2015. Nevertheless, there was a spatial and temporal heterogeneity in the streamflow response during 2015/16 given that not all the basins recorded above-normal MSWE, with differences in catchment characteristics and also in temperature anomalies playing a relevant role. Since 2016/17, a marked decrease in monthly streamflow levels was inferred through the SSI3 time series, reaching extreme hydrological drought conditions particularly during the years 2018/19 and 2019/20 (Figure 7). Thus, the 2010-2020 period was characterized by persistent negative SSI3 values across all the basins of CWA, with hydrological drought duration and severities that are unprecedented in the context of at least the last 49 years of record.
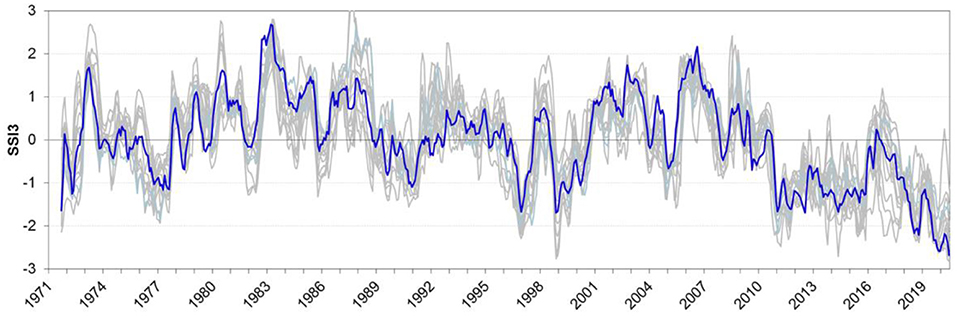
Figure 7. Time series of monthly SSI3 for the selected gauging stations during 1971/72-2019/20. The blue line indicates the time series for the Atuel River (1403).
The percentage of streamgauges within each hydrological drought category is useful to quantify the spatial extension of drought events (Rivera et al., 2017b). This percentage was calculated for each month during the 1971/72-2019/20 period, using the drought categories defined for the SSI3. For the construction of this spatial index, the percentage of stations in the moderate hydrological drought category includes those stations showing severe and extreme drought conditions. Likewise, the percentage of stations in the severe category includes those stations showing extreme drought. Figure 8 shows the temporal behavior of this spatial index. The 2010-2020 hydrological drought period is a striking feature over the last 49 years of records. In particular, record-breaking conditions were observed considering the percentage of stations under severe and extreme hydrological drought conditions during 2019, with all the rivers showing severe drought during October and November and 80% of the rivers with extreme hydrological drought during November 2019. Twelve months showed the synchronous occurrence of moderate to extreme hydrological drought conditions in all the rivers of CWA over the last decade, with 6 consecutive months between July to December 2019 with all the rivers under hydrological drought.
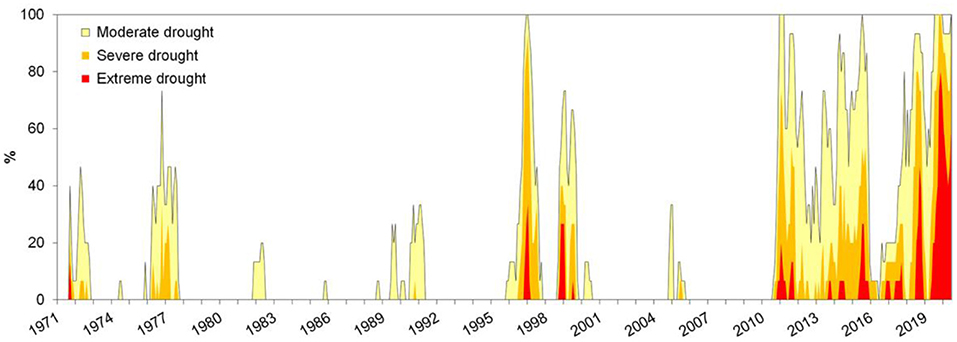
Figure 8. Temporal evolution of the percentage of stations in CWA with hydrological drought conditions during 1971/72-2019/20. Yellow, orange, and red colors indicate moderate, severe, and extreme hydrological drought categories, respectively.
As shown in Figures 4–8, the hydrological drought over CWA can be divided into three sub-periods in terms of drought severity and spatial extent: a first drought period between the hydrological years 2010/11 to 2014/15, a partial drought recovery between 2015/16 and 2016/17 and a more severe and widespread drought period between 2017/18 to 2019/20. To summarize the hydrological drought in terms of spatio-temporal variability, Figure 9 shows pie charts with the proportion of months under the SSI3 drought categories for each of the 15 rivers considered the three different sub-periods. This proportion of months was expressed as the percentage of months under each hydrological drought category compared to the total number of months within the sub-period, also including the periods where the streamflows were under normal or excess conditions. During the 2010/11-2014/15 period, most of the rivers showed a larger proportion of months with hydrological drought conditions at different severity levels, particularly for the Atuel (1403), Pincheira (1426), and Vacas (1421) rivers, with more than 75% of the period under hydrological drought conditions (Figure 9A). Only 5 rivers reached extreme hydrological drought conditions, most of them belonging to the Mendoza basin. A general drought recovery is evident during the period 2015/16-2016/17, which is dominated by normal to excess conditions particularly north of 36°S (Figure 9B). Nevertheless, rivers as Grande (1427), Poti Malal (1425), Barrancas (2001), and Colorado (2002) showed more than 50% of the time under hydrological drought conditions. During the last 3 years, hydrological drought severity increased in all the rivers compared with the 2015/16-2016/17 period (Figure 9C). A proportion of months exceeding 25% of the time under extreme hydrological drought conditions was observed for the rivers located between 35° and 36°S. Eight of the analyzed rivers showed more than 75% of the time with hydrological drought conditions, which means over 27 months under drought from a total of 36 months. Our results showed the main spatio-temporal characteristics of the hydrological drought that took place over CWA during the last decade. A discussion of the main implications in the socio-economic activities in the study area is provided in the following section.
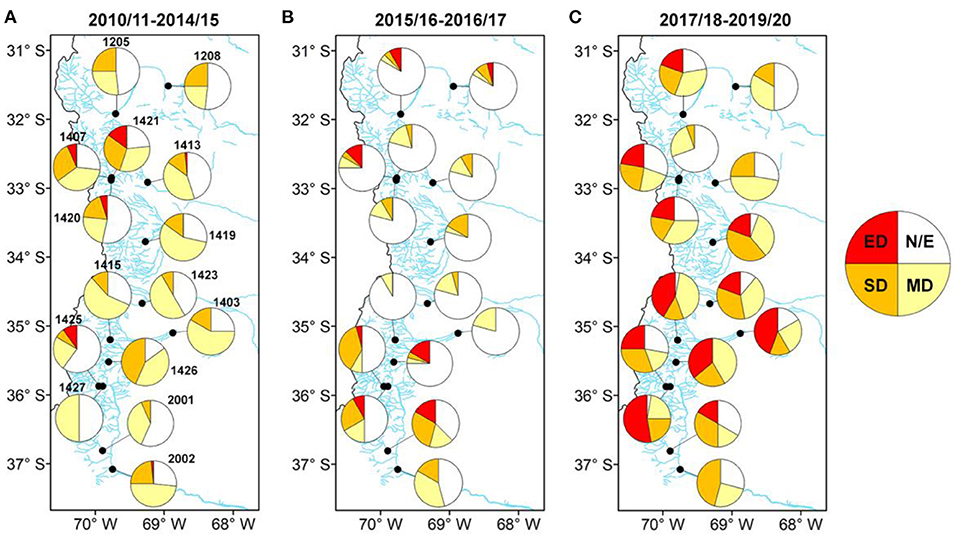
Figure 9. Pie charts showing the proportion of months (expressed as percentage) under the categories determined by the SSI3 time series for each of the 15 analyzed rives over CWA during three sub-periods: 2010/11-2014/15 (A), 2015/16-2016/17 (B), and 2017/18-2019/20 (C). Yellow, orange and red colors indicate moderate, severe and extreme hydrological drought conditions (MD, SD, and ED), respectively; white color indicates normal/excess (N/E) conditions. Panel A shows the number of each streamflow station.
Cascading Impacts of the Recent Hydrological Drought
We characterized the main impacts of the recent hydrological drought over CWA by analyzing more than 100 articles published in local newspapers since 2010 (Supplementary Table 1). From these articles, the main sectors impacted by drought were identified, as well as some of the on-going mitigation plans developed by local authorities to face water scarcity. These mitigation actions will be described in the Discussion section. We do not intend to provide an extensive and detailed search, but to highlight the media coverage during this decade of drought, the main impacted sectors, and the local community awareness considering a reasonable sample of the available media content. It was not possible to quantify the hydrological drought impacts from the available scientific literature given the limited number of studies covering this topic. Most of the research quantified reductions in streamflow (Díaz et al., 2016; Rivera et al., 2017a,b; Caragunis et al., 2020), snow (Rivera et al., 2017b; Masiokas et al., 2020), glaciers (Dussaillant et al., 2019; Ferri et al., 2020), and lake levels (Bianchi et al., 2017; Alvarez et al., 2018) during the last 10 years, with some studies addressing aspects of the institutional water governance system and the adaptation capabilities to droughts (Hurlbert and Montana, 2015; Hurlbert and Mussetta, 2016; Hurlbert et al., 2019).
During the first period of hydrological drought (2010/11-2014/15), the main impacts were identified in the agricultural sector, with water shortages for grape production and seasonal crops, and the loss of livestock, resulting in a decrease in regional food security. The Intergovernmental Panel on Climate Change (IPCC) Special Report on Climate Change and Land (Mbow et al., 2019) highlights the role of extreme events such as droughts affecting food security, particularly in drylands and mountain regions of South America. The impact of hydrological drought on agricultural production is often difficult to quantify. Grape production, the main crop in the agricultural oases, presents a high interannual variability modulated by the health status (cryptogamic diseases), climatic events (frost, hailstorms), and water availability (Agosta et al., 2012). In general, there is evidence for a positive effect of water deficits on red wine quality; due to increases in grape skin phenolics and better evolution during bottle aging, although with lower yields (van Leeuwen et al., 2019). However, there is no evidence for the role of hydrological drought in the quality of wines over CWA. The low water levels observed in the dams of the region, particularly the ones located in San Juan, Diamante, and Atuel basins, resulted in impacts for tourism and hydropower generation. For example, in 2013, the level of the Ullum dam dropped to 744 m.a.s.l., the lowest value during this hydrological drought sub-period. The Water Administration Department from the Mendoza province (Departamento General de Irrigación – DGI) declared the hydrological emergency in 2010 due to reduced streamflow levels (Hurlbert and Gupta, 2017). To a lesser extent, local media reported impacts related to the regional ecosystems, due to decreased or restricted inflows to the wetlands in the lower parts of the San Juan, Mendoza, Laguna Llancanelo, and Atuel basins. Being the Atuel a transboundary basin, water conflicts between provincial administrations also increased during this period of hydrological drought (Rojas and Wagner, 2017; Barbosa, 2019).
In the 2015/16-2016/17 sub-period, a generalized recovery is identified in the regional streamflows, particularly from the Pincheira River toward the north. This recovery was also evident in the dams levels, which were close to 100% in the San Juan River basin, favoring recreational activities, and increasing hydropower generation. There is also evidence for a recovery in the wetlands of the “Presidente Sarmiento” protected area in the San Juan basin, as well as in Laguna Llancanelo wetlands, where the lagoon reached 60% of its normal size during the winter of 2016. However, the near-normal snow accumulation over the Andes was not enough to avoid the declaration of emergency over 5 of the main basins of Mendoza province; due to the accumulated impacts of the previous 5 years of hydrological drought.
During the most recent hydrological drought sub-period (2017/18-2019/20), we identified a significant increase in the local media coverage of the prevailing drought conditions, particularly focusing on drought impacts. The persistence of the hydrological drought intensified the environmental degradation of the Guanacache Wetlands, in the lower parts of the Mendoza and San Juan River basins. In addition to the environmental degradation of this wetland ecosystem, there is evidence for the diminish of their productive capacity due to the death of livestock reported by local communities. During this last sub-period, the stored water in reservoirs was crucial to compensate for the reduced streamflows in the basins of CWA, at least during the 2017/18 hydrological year. The increase in rainfall in the lowlands adjacent to the Andes was also mentioned to play a relevant role as an alternative source of water for the agricultural oases of Mendoza province. The decreasing levels of the reservoirs during the last 2 years harmed tourism and recreational activities, especially in the Ullum and El Carrizal dams (Figure 1). This also affected the hydropower generation, which markedly decreased since 2018 given that the dams were below the operational levels required to generate hydropower. The grapes production in 2020 was 27% lower than in 2019 in San Juan province, with a reduction of 16% in Mendoza province. The harvest from San Juan province (478 tons) was the lowest in 24 years, after that registered in 1996 (473 tons), from which a loss of 30% is estimated to be due to the hydrological drought conditions. This can be attributed to water restrictions over the main agricultural oases, which also affected annual and seasonal crops from small orchards.
To summarize, the recent decade of hydrological drought shows widespread impacts in CWA, which are related to the changes in the severity of the drought event during its three sub-periods. The main impacts are evident in the socio-economic sectors of CWA, with a reduction of water for irrigation that mainly affected agriculture and livestock, and a reduction of hydropower generation due to extremely low dams levels, affecting also tourism and recreational activities due to low lake levels. Figure 10 illustrates the proportion of articles mentioning each of the sectors affected by this recent decade of hydrological drought. We condensed the impacts into 6 main sectors: agriculture, cattle, domestic water supply, ecosystems, hydropower, and tourism and recreation (see Supplementary Table 1), with agriculture representing the impacts of reduced water for irrigation. The main impacts are observed in the agriculture sector, with 40% of the analyzed articles, and a balanced media coverage for all the remaining impacted sectors. The impact of the reduced streamflow on hydropower generation was particularly relevant in the media of San Juan province. The domestic water supply was threatened during the recent hydrological drought, particularly over Mendoza and San Juan cities, with a population close to 2 million inhabitants (Table 3). The main impacts of the hydrological drought in terms of ecosystems was highlighted over the main wetlands of CWA, which are located in the lower portions of the basins, thus, prone to be largely affected by the limited streamflow reaching those areas. Finally, tourism and recreation activities have been negatively affected by the hydrological drought due to the low levels of dams and rivers, limiting water sports like kayaking or rafting. Also, ski resorts had to shorten or even cancel the winter activities due to below-normal snow accumulation over the Andes.
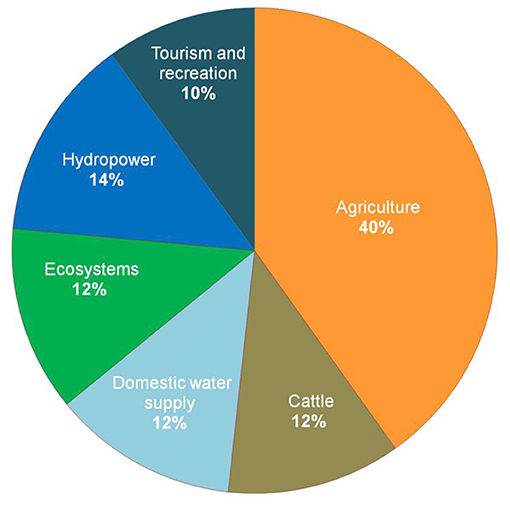
Figure 10. Pie chart showing the proportion of articles published in local media (expressed as percentage) describing the impacts of the recent hydrological drought conditions over CWA for each of the main affected sectors.
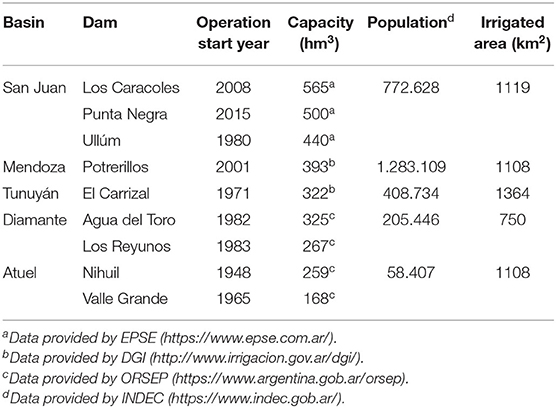
Table 3. Dams, population and irrigated area in each river basin.
Discussion and Future Perspectives
Hydrological Drought Mitigation Strategies in CWA
Water resources management in semi-arid areas as CWA is of vital importance to guarantee the water security of the population. Since the 1940s, most public policies aimed to increase and guarantee water supply, considering the construction of reservoirs, improving the network of irrigation channels, modernizing irrigation systems, and encouraging the extraction of groundwater. Three new dams were built since the beginning of the twenty-first Century, increasing the capacity to face drought conditions, particularly over the San Juan basin (Table 3). Also in this basin, Tambolar dam is expected to be operating in the next few years, increasing the volume of water storage to face the projected decreases in future water availability. This also shows the political differences between Mendoza and San Juan provinces in terms of the construction of reservoirs. Besides the beneficial role of dams for hydropower generation, water storage, and distribution, there are still some concerns in terms of the impact on downstream ecosystems, wetlands, and breeder communities (Montaña et al., 2016), calling for improved quantification of ecological flows (Suen, 2011).
Sediment load affects the maximum capacity of water storage in the dams, resulting in a reduced usable life (Kondolf et al., 2014). This was particularly the case of Potrerillos and Carrizal dams. Potrerillos dam lost nearly 15% of maximum capacity in the last 10 years. For the Carrizal dam, irrigation authorities focused on the recovery of storage volume, with an increase of 50 hm3 between 2015 and 2016. Indeed, the biggest technical challenges regarding water security in CWA are in water distribution, for both human consumption and irrigation (Díaz-Caravantes et al., 2020). In this sense, during the recent decade of hydrological drought, several improvements increased the irrigation efficiency in the region, as the waterproofing of channels and the implementation of pressurized and dripping systems. In San Juan City, ditch irrigation of urban trees was replaced by mechanized irrigation methods, with higher costs but lower water consumption. During the last 2 years, the intensification of the hydrological drought in CWA required more restrictive actions for the management of irrigation in several basins of the region. For example, water authorities proposed the reduction of the irrigation coefficients during lower demand periods, to increase provision cut-off days, to restrict water allocation, and to promote greater use of pressurized systems for parks in the main urban areas of CWA, replacing the conventional ditch irrigation (Supplementary Table 1). The new irrigation scheme also includes water cut-off during rainy periods, showing the partial role of rainfall in the agricultural oases to compensate for hydrological drought periods.
The decrease in streamflow and, therefore, the volume of water in the dams implies irrigation restrictions, affecting the quality and quantity of agricultural production (Mussetta and Barrientos, 2015). To compensate for this, groundwater extraction has been a common practice over the agricultural oases of CWA. Despite being a strategic resource, it is difficult to quantify the compensation obtained from groundwater during the recent hydrological drought as there are no measurements of the water volume pumped at the wells. A study for the Tunuyán River basin showed that the number of existing wells exceeds the optimized number of wells required to sustainably irrigate the basin (Tromboni et al., 2014), which calls for better integration between groundwater and surface water management (Zuniga-Teran et al., inpress). With the projected decrease in surface water availability over the next decades and the expected increase in water demand, groundwater extraction could increase in the coming years, as the main water agencies plan to deepen the use of groundwater to increase the available water supply (Supplementary Table 1). In the Mendoza River basin, 27% of the farmers irrigate with groundwater only, and 28% use both surface water and groundwater (Montaña et al., 2016). Considering the hydrological drought conditions that prevailed over the last decade, it is presumed that the percentage of farmers using groundwater could exceed the ones using the limited surface water from the main rivers of the region. The use of groundwater for irrigation is predominant in the lower portions of the basins, where streamflow can only be used during years with normal or above-average snowfalls. Nevertheless, recent viticulture developments in the upper Tunuyán basin, mostly from foreign capitals, modified the agrarian structure by irrigating with groundwater in a region traditionally irrigated with surface water, increasing regional inequities and vulnerability with the approval of the water authorities (Zuniga-Teran et al., inpress; Saldi and Petz, 2015).
In the case of domestic water use, the number of penalties concerning water misuse increased in quantity and cost in an attempt to optimize the limited water resources by the water administration agencies (Rivera et al., 2017b), with charging fees according to the consumed volume being evaluated nowadays. The domestic water consumption per person exceeds 400 liters per day, well above the recommendations of the World Health Organization (Howard and Bartram, 2003). This high consumption, coupled with population growth and an inefficient distribution system with losses of 40%, exerts a significant and growing demand on the water resources of the region, especially in the urban areas of CWA. During the last decade of hydrological drought, water agencies declared the hydrological emergency status between 2010 and 2018. The purpose of this declaration is to adopt, under a legal framework, preventive and corrective measures to reduce the harmful effects of drought on the economy and society. In 2018, due to the prolonged drought condition, irrigation authorities from Mendoza presented a “drought plan” for the consideration of policymakers, which is still under analysis. The plan aims to minimize the social, environmental, and economic impacts of the drought situation (Dirección General de Irrigación, 2018). The water authorities from San Juan province also advanced toward the generation of the legal framework for a drought plan (Supplementary Table 1).
Perspectives for Improved Hydrological Drought Monitoring
Hydrological drought indices provide information that is important for the design and operation of many sectors relevant to the society and the economy of CWA, including domestic water supply, irrigation for agriculture and cattle, hydropower generation, tourism and recreation, and industry. By using hydrological drought indices, it is possible to analyze temporal trends and the influence of climate change, to provide information about drought vulnerability and risk, and to perform large-scale comparative monitoring and forecasting of streamflow and drought conditions (Stahl et al., 2020). The emergence of new hydrological drought indicators during the last years, as well as the new drought definitions like ecological drought (Crausbay et al., 2017) or anthropogenic drought (AghaKouchak et al., 2015), provide evidence for an urgent need to advance hydrological drought research and operational applications (Poshtiri and Pal, 2016), particularly in arid and semi-arid regions that are vulnerable to climate variability and change.
Although the proposals for the legal framework of the drought plans in CWA foresee the implementation of a system of indicators to determine the drought thresholds, there is still no monitoring system that allows the characterization of hydrological drought events at a basin level. The use of metrics based on the threshold level method, as well as the monitoring through the SSI, has been adopted by the scientific community to analyze hydrological drought conditions over CWA and other regions of the world. This study characterized the recent decade of hydrological drought considering only two annual indices based on a daily varying threshold, for three severity levels. Other studies using the threshold level method evaluated drought characteristics related to extremes and performed regionalizations (Tallaksen and Hisdal, 1997), calculated areal indices (Zaidman et al., 2002), analyzed the timing of the hydrological drought events, and quantified the human influence on drought (Margariti et al., 2019). A systematic review performed by Hasan et al. (2019) highlighted the use of the threshold level method for the characterization of drought severity. This is because of the direct quantification of streamflow deficit, making it easy to interpret by water managers and the general public. On the other hand, while the severity expressed in terms of the SSI has a probabilistic background, and therefore might be more difficult to interpret without the proper knowledge of the index, it allows the direct comparison of streamflow time series based on diverse hydrological regimes (Rivera and Penalba, 2018). Moreover, standardized indices have been recommended by the World Meteorological Organization (WMO) for the characterization of drought events. For example, WMO HydroHub (https://hydrohub.wmo.int/en/home) is expected to provide hydrological services through the monitoring of low and high streamflow levels using drought indicators as the SSI and the threshold level method. Considering that the occurrences of hydrological droughts are the result of the propagation of the snow drought signal through the hydrological cycle over CWA, we believe that 5 snow pillows are not enough to provide a proper characterization of winter precipitation over the Andes mountain range. The snowpack observations are used for the annual streamflow forecast that the main irrigation authorities generate between October and November. To illustrate a potential application of the hydrological drought indices, we calculated the SSI3 using the streamflow forecast for Mendoza River produced by the DGI for the period between October 2020 and September 2021. Figure 11 shows the observed evolution of streamflow and SSI3 for Mendoza River between October 2019 and September 2020, together with the streamflow and hydrological drought forecast. The forecast indicates below-normal conditions for all the months, with 10 out of 12 forecasted months under moderate hydrological drought category and a slight recovery, although with below-normal streamflows, between December 2020 and January 2021 (Figure 11). This provides information related to the hydrological drought categories, that is more meaningful than the comparison between forecasted streamflow and long-term streamflow average. Even when the streamflow forecasts have a good performance, we think that a major improvement can be achieved using remote sensing of snow, combined with the use of seasonal temperature forecasts for the estimation of the snowmelt pulse (Bennett et al., 2019; Washington et al., 2019).
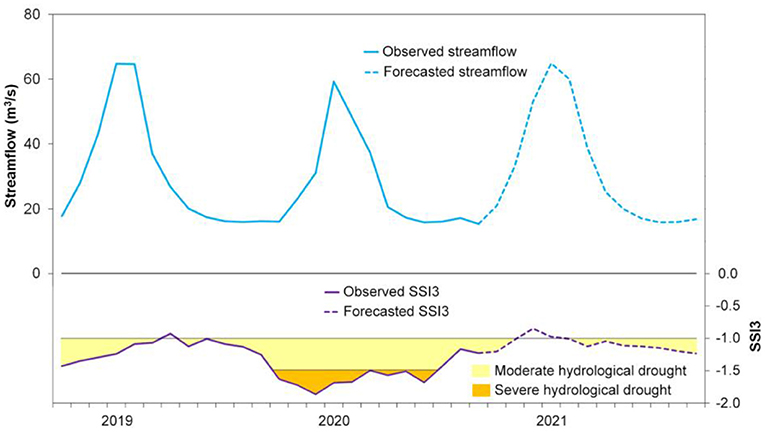
Figure 11. Hydrological drought forecast for the Mendoza River based on the SSI3. The monthly observed streamflow was complemented with the streamflow forecast generated by the DGI from October 2020 to September 2021 to calculate the SSI3 and the corresponding hydrological drought category.
Little research has been done on the occurrence and propagation of droughts in groundwater (Mishra and Singh, 2010; Wendt et al., 2020). The interaction between groundwater and surface water is ignored because the connection is difficult to observe and measure and, therefore, even more difficult to consider in policy (Mizzell and Lakshmi, 2003). The recent decade of hydrological drought in CWA showed the pivotal role of groundwater to mitigate surface water scarcity, with aquifers likely overexploited to satisfy human consumption, ecological demands, and irrigation in the agricultural oases. There is limited information about the quality and volume of groundwater over those areas. Gomez et al. (2014) detected high salt content and hardness in an aquifer located between Mendoza and San Juan basins, with a signature of human activities due to increased nitrate concentrations near livestock gathering areas. Irrigation return flows from the agricultural areas were linked to the increases in groundwater salinity levels (Gomez et al., 2021). Arsenic levels over this area were also well above the international quality standards, with negative effects on the health of rural communities (Gomez et al., 2019). Long-term monitoring of groundwater levels over CWA has been performed by private companies that manufacture products as bottled mineral water. Those datasets are not publicly available for the scientific community, which precludes improving our understanding related to the propagation of drought signal through the different components of the hydrological cycle. To overcome this limitation, we analyzed the variations in the WET anomalies estimated from GRACE missions for the period between 2002 and 2020. Figure 12 shows the temporal evolution of WET over the CWA. Negative anomalies are evident since 2010, with large water losses during the summers of 2011/12 and 2013/14, higher than 10 cm (i.e., 10 cm layer of water over all CWA), followed by a short period of drought recovery between 2016 and 2018. Since 2018 there is a trend toward more negative anomalies of WET, likely reflecting an increase in groundwater demand due to the hydrological drought conditions. Considering the complete period of estimations, there is a clear trend that reflects water losses over CWA, in line with previous results from Rodell et al. (2018) and Tapley et al. (2019). This trend can be linked not only to groundwater overexploitation but also due to low snow accumulation, streamflow deficiencies, reductions in glaciers and in lake and reservoirs levels over the last decade.
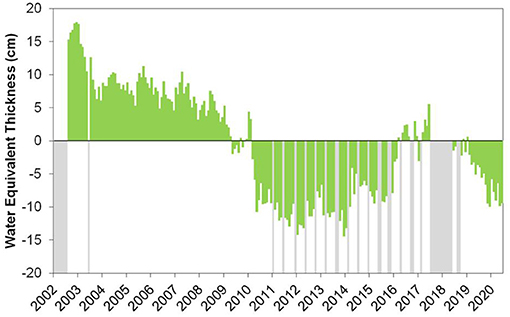
Figure 12. Temporal evolution of the monthly WET anomalies over CWA retrieved by GRACE (2002-2017) and GRACE-FO (2018-2020) missions. Gray bars indicate missing data.
Some drought adaptation management plans combine the information from drought indices and groundwater resources to ensure sustainable water resilience and governance (Al Adaileh et al., 2019). Considering the heterogeneity of the soil in the oases of the region, the diversity of crops, and the occasional water supply from rainfall, this strategy should be complemented with the monitoring of soil water content in order to improve irrigation management and water use efficiency (Nolz et al., 2016; Barker et al., 2017; Hu et al., 2019; Lei et al., 2020).
Conclusions
This work characterized the most severe and long-lasting hydrological drought period over Central-Western Argentina, which started in 2010 and is expected to continue through much of 2021. Two of the most widely-used hydrological drought indices were calculated based on high-quality streamflow data from 15 basins located in the arid and semi-arid Andes between 30°S and 37°S. This hydrological drought originated from a snow drought condition over the higher elevations of the Andes mountains, favored by a combination of several atmospheric and oceanic features that generated a southward displacement of the storm-tracks, leading to a decline in winter snowfall. While we only provided evidence for the reduction of regional snow accumulation and streamflows, the evaluation of the impacts associated with this drought event indicated that the drought signal propagated through other components of the hydrological cycle, with a decline in water bodies as lagoons and lakes, reservoirs and dams, but also favoring glacier shrinkage and increasing pressure on the groundwater resources. In this sense, the use of satellite estimates of Water Equivalent Thickness can be considered as an integrator of the available water resources in the region, which exhibit a declining trend over the last 20 years.
Three sub-periods can be identified considering the temporal changes in hydrological drought severity, which are consistent with the fluctuations in snow accumulation over the higher elevations of the Andes mountains. The first period covers the hydrological years from 2010/11 to 2014/15, when reduced snowpack led to below-normal streamflow, affecting particularly the Mendoza River basin. In average, the region registered close to 300 days per year with streamflows below the Q70 threshold, with more than 120 days with streamflows below the Q90 threshold. The SSI3 indicated that at least 60% of the basins were simultaneously affected by hydrological drought conditions between July 2010 and June 2015, with the highest severity levels recorded during 2011 and 2014. A partial recovery in streamflows was observed during the period 2015/16-2016/17 due to the near-normal snow accumulation over the Andes. Drought severity levels decreased over much of the basins located north of 35°S, with almost half of the annual number of days with streamflows below the selected thresholds compared to the previous sub-period. Nevertheless, the more recent 2017/18-2019/20 period had record-breaking hydrological drought severity levels over most of the analyzed basins. More than 90% of the hydrological year 2019/20 had extreme hydrological drought conditions, although with a heterogeneous spatial pattern. The spatial extent of the hydrological drought identified through the SSI3 set record values for the severe and extreme drought category, particularly between October 2019 and January 2020, a period where the demand for water is particularly high for irrigation and domestic consumption. Therefore, according to the spatial extension, duration, and severity of this event, the recent decade of hydrological drought is unprecedented in the last 50 years of streamflow records over CWA. It must be noted that, although the different datasets used in the study differ in its measurement periods, all confirm the unusualness of the recent decade of drought.
Different approaches were considered by local water managers to face the hydrological drought conditions. Nevertheless, the widespread impacts linked to the severity of this drought event were evident in the main socio-economic sectors of CWA, with a reduction of water for irrigation that mainly affected agriculture and livestock. Hydropower generation was reduced or even interrupted due to dams levels below operational requirements, affecting also tourism and recreational activities due to low lake levels. The main reservoirs had a pivotal role for drought mitigation purposes, although the wetlands located in the lower portions of the basins of CWA were affected by the water management in the middle portions of the basins, calling for a better quantification of ecological water requirements in the region. We discussed options for the implementation of a system based on the monitoring of hydrological drought indices. The indices used in this study are easy to calculate and to interpret, the colors used are intuitive for the quantification of drought severity levels, and streamflow data can be freely accessed online. Those indices can be computed using the streamflow forecasts that are routinely generated by the local irrigation authorities, allowing the prediction of drought severity levels. This was illustrated with example of hydrological drought forecasting for the period between October 2020 and September 2021 using the SSI3 based on streamflow forecasts for Mendoza River basin. Moreover, we consider that a better quantification of both the snow amount and groundwater volumes can assist decision-makers and irrigation authorities to evaluate water resources availability and to declare drought severity status.
Data Availability Statement
Daily streamflow records from the 15 analyzed rivers and the 5 snow courses can be accessed online through the National System of Hydrological Information from the Secretariat of Infrastructure and Water Policy of Argentina: https://snih.hidricosargentina.gob.ar/. Additional precipitation data from GPCC is available at ftp://ftp.cdc.noaa.gov/Datasets/gpcc/combined/precip.comb.v2018to2016-v6monitorafter.total.nc. The Water Equivalent Thickness anomalies from the GRACE missions can be accessed at https://grace.jpl.nasa.gov/data-analysis-tool/.
Author Contributions
JR conceived the design of the paper and wrote the first draft of the manuscript. NZ calculated the snow water equivalent anomalies and described its results. SO analyzed the impacts of the hydrological drought. SO and CL created the maps of the study area and the tables, and contributed to the discussion section. JR, CL, SO, and NZ provided additional edits to the manuscript. All authors revised and approved the submitted version of the manuscript.
Funding
This work was supported by the National Agency for Scientific and Technological Promotion (ANPCyT) (Grant Numbers: PICT-2016-0431 and PICT-2019-2019-03430) and by the University of Buenos Aires (UBA) (Grant Number: 20020190200326BA).
Conflict of Interest
The authors declare that the research was conducted in the absence of any commercial or financial relationships that could be construed as a potential conflict of interest.
Acknowledgments
The authors want to thank the Secretaría de Infraestructura y Política Hídrica de Argentina for providing the streamflow and snow records used in the study.
Supplementary Material
The Supplementary Material for this article can be found online at: https://www.frontiersin.org/articles/10.3389/frwa.2021.640544/full#supplementary-material
References
AghaKouchak, A., Feldman, D., Hoerling, M., Huxman, T., and Lund, J. (2015). Water and climate: recognize anthropogenic drought. Nature 524, 409–411. doi: 10.1038/524409a
Agosta, E., Canziani, P., and Cavagnaro, M. (2012). Regional climate variability impacts on the annual grape yield in Mendoza, Argentina. J. Appl. Meteorol. Climatol. 51, 993–1009. doi: 10.1175/JAMC-D-11-0165.1
Al Adaileh, H., Al Qinna, M., Barta, K., Al-Karablieh, E., Rakonczai, J., and Alobeiaat, H. (2019). A drought adaptation management system for groundwater resources based on combined drought index and vulnerability analysis. Earth Syst. Environ. 3, 445–461. doi: 10.1007/s41748-019-00118-9
Alvarez, L. M., Meglioli, P. A., Rivera, J. A., Bianchi, L. O., Martín, S., and Sosa, H. (2018). Effects of hydrological variation on the population dynamics of Chilean Flamingo (Phoenicopterus chilensis) at the Ramsar site Llancanelo lagoon, Mendoza, Argentina. Ornitol. Neotrop. 29, 275–280.
Alvarez-Garreton, C., Boisier, J. P., Garreaud, R., Seibert, J., and Vis, M. (2021). Progressive water deficits during multiyear droughts in basins with long hydrological memory in Chile. Hydrol. Earth Syst. Sci. 25, 429–446. doi: 10.5194/hess-25-429-2021
Araneo, D., and Villalba, R. (2015). Variability in the annual cycle of the Río Atuel streamflows and its relationship with tropospheric circulation. Int. J. Climatol. 35, 2948–2967. doi: 10.1002/joc.4185
Araneo, D. C., Rivera, J. A., and Villalba, R. (2015). Variabilidad intraestacional de las condiciones níveas en los Andes Centrales relacionadas con los cambios en el régimen hidrológico del río Atuel. Acta Geol. Lilloana 27, 77–86.
Barbosa, L. (2019). Trayectoria del conflicto ambiental del río Atuel en la escala provincial. Dinámicas discursivas provinciales, La Pampa-Mendoza, Argentina. Bol. Estud. Geogr. 111, 95–119.
Barker, J. B., Franz, T. E., Heeren, D. M., Neale, C. M. U., and Luck, J. D. (2017). Soil water content monitoring for irrigation management: a geostatistical analysis. Agric. Water Manage. 188, 36–49. doi: 10.1016/j.agwat.2017.03.024
Barker, L. J., Hannaford, J., Chiverton, A., and Svensson, C. (2016). From meteorological to hydrological drought using standardised indicators. Hydrol. Earth Syst. Sci. 20, 2483–2505. doi: 10.5194/hess-20-2483-2016
Becker, A., Finger, P., Meyer-Christoffer, A., Rudolf, B., Schamm, K., Schneider, U., et al. (2013). A description of the global land-surface precipitation data products of the Global Precipitation Climatology Centre with sample applications including centennial (trend) analysis from 1901–present. Earth Syst. Sci. Data 5, 71–99. doi: 10.5194/essd-5-71-2013
Bennett, K. E., Cherry, J. E., Balk, B., and Lindsey, S. (2019). Using MODIS estimates of fractional snow cover area to improve streamflow forecasts in interior Alaska. Hydrol. Earth Syst. Sci. 23, 2439–2459. doi: 10.5194/hess-23-2439-2019
Beyene, B. S., Van Loon, A. F., Van Lanen, H. A. J., and Torfs, P. J. J. F. (2014). Investigation of variable threshold level approaches for hydrological drought identification. Hydrol. Earth Syst. Sci. Discuss. 11, 12765–12797. doi: 10.5194/hessd-11-12765-2014
Bianchi, L., Rivera, J., Rojas, F., Britos Navarro, M., and Villalba, R. (2017). A regional water balance indicator inferred from satellite images of an Andean endorheic basin in central-western Argentina. Hydrol. Sci. J. 62:533–45. doi: 10.1080/02626667.2016.1247210
Boisier, J. P., Alvarez-Garreton, C., Cordero, R. R., Damiani, A., Gallardo, L., Garreaud, R. D., et al. (2018). Anthropogenic drying in central-southern Chile evidenced by long-term observations and climate model simulations. Elem. Sci. Anth. 6:74. doi: 10.1525/elementa.328
Bolaños, S, Salazar, J. F., Betancur, T., and Werner, M. (inpress). GRACE reveals depletion of water storage in northwestern South America between ENSO extremes. J. Hydrol. 125687. doi: 10.1016/j.jhydrol.2020.125687
Cabré, F., and Nuñez, M. (2020). Impacts of climate change on viticulture in Argentina, Reg. Environ. Change 20:12. doi: 10.1007/s10113-020-01607-8
Cai, W., Cowan, T., and Thatcher, M. (2012). Rainfall reductions over Southern Hemisphere semi-arid regions: the role of subtropical dry zone expansion. Sci. Rep. 2:702. doi: 10.1038/srep00702
Camisay, M. F., Rivera, J. A., Matteo, L., Morichetti, P., and Mackern, M. V. (2020). Estimation of integrated water vapor from GNSS ground stations over Central-Western Argentina. Role in the development of regional precipitation events. J. Atmos. Solar Terres. Phys. 197:105143. doi: 10.1016/j.jastp.2019.105143
Caragunis, J. I., Rivera, J. A., and Penalba, O. C. (2020). Characterization of hydrological droughts in central-north Argentina and its atmospheric and oceanic drivers. Clim. Res. 80, 1–18. doi: 10.3354/cr01593
Carril, A. F., Doyle, M. E., Barros, V. R., and Núñez, M. N. (1997). Impacts of climate change on the oases of the Argentinean cordillera. Clim. Res. 9, 121–129. doi: 10.3354/cr009121
Chen, J., Famigliett, J. S., Scanlon, B. R., and Rodell, M. (2016). Groundwater storage changes: present status from GRACE observations. Surv. Geophys. 37, 397–417. doi: 10.1007/s10712-015-9332-4
Chen, J. L., Wilson, C. R., Tapley, B. D., Longuevergne, L., Yang, Z. L., and Scanlon, B. R. (2010). Recent La Plata basin drought conditions observed by satellite gravimetry. J. Geophys. Res. 115:D22108. doi: 10.1029/2010JD014689
Chen, X., Li, F.-W., Li, J.-Z., and Feng, P. (2019). Three-dimensional identification of hydrological drought and multivariate drought risk probability assessment in the Luanhe River basin, China. Theor. Appl. Climatol. 137, 3055–3076. doi: 10.1007/s00704-019-02780-5
Cook, B. I., Mankin, J. S., Marvel, K., Williams, A. P., Smerdon, J. E., and Anchukaitis, K. J. (2020). Twenty-first century drought projections in the CMIP6 forcing scenarios. Earths Future 8:e2019EF001461. doi: 10.1029/2019EF001461
Crausbay, S. D., Ramirez, A. R., Carter, S. L., Cross, M. S., Hall, K. R., Bathke, D. J., et al. (2017). Defining ecological drought for the twenty-first century. Bull. Am. Meteorol. Soc. 98, 12, 2543–2550. doi: 10.1175/BAMS-D-16-0292.1
Crespo, S. A., Fernandoy, F., Cara, L., Klarian, S., and Lavergne, C. (2020). First snow, glacier and groundwater contribution quantification in the upper Mendoza River basin using stable water isotopes. Isotopes Environ. Health Stud.s 56, 5–6, 566–585. doi: 10.1080/10256016.2020.1797713
Díaz, E., García, M., Rodríguez, A., Dölling, O., Ochoa, S., and Bertoni, J. (2018). Temporal evolution of hydrological drought in Argentina and its relationship with macroclimatic indicators. Tecnol. Cienc. Agua 9, 1–32. doi: 10.24850/j-tyca-2018-05-01
Díaz, E., Rodríguez, A., Dölling, O., Bertoni, J. C., and Smrekar, M. (2016). Identificación y caracterización de sequías hidrológicas en Argentina. Tecnol. Cienc. Agua 7, 125–133.
Díaz-Caravantes, R. E., Zuniga-Teran, A., Martín, F., Bernabeu, M., Stoker, P., and Scott, C. (2020). Urban water security: a comparative study of cities in the arid Americas. Environ. Urban. 32, 275–294. doi: 10.1177/0956247819900468
Dirección General de Irrigación (2018). Proyecto de Ley con los lineamientos para un Plan de Sequía Provincial. Available online at: https://www.irrigacion.gov.ar/web/2018/10/12/proyecto-de-ley-con-los-lineamientos-para-un-plan-de-sequia-provincial/ (accessed December 6, 2020)
Dussaillant, I., Berthier, E., Brun, F., Masiokas, M., Hugonnet, R., Favier, V., et al. (2019). Two decades of glacier mass loss along the Andes. Nat. Geosci. 12, 802–808. doi: 10.1038/s41561-019-0432-5
Fahad, A., Burls, N. J., and Strasberg, Z. (2020). How will southern hemisphere subtropical anticyclones respond to global warming? Mechanisms and seasonality in CMIP5 and CMIP6 model projections. Clim. Dyn. 55, 703–718. doi: 10.1007/s00382-020-05290-7
Feng, K., Su, X., Zhang, G., Javed, T., and Zhang, Z. (2020). Development of a new integrated hydrological drought index (SRGI) and its application in the Heihe River Basin, China. Theor. Appl. Climatol. 141, 43–59. doi: 10.1007/s00704-020-03184-6
Ferri, L., Dussaillant, I., Zalazar, L., Masiokas, M. H., Ruiz, L., Pitte, P., et al. (2020). Ice Mass Loss in the Central Andes of Argentina Between 2000 and 2018 Derived From a New Glacier Inventory and Satellite Stereo-Imagery. Front. Earth Sci. 8:530997. doi: 10.3389/feart.2020.530997
Garbarini, E. M., González, M. H., and Rolla, A. L. (2019). The influence of Atlantic High on seasonal rainfall in Argentina. Int. J. Climatol. 39, 4688–4702. doi: 10.1002/joc.6098
Garreaud, R. D., Alvarez-Garreton, C., Barichivich, J., Boisier, J. P., Christie, D., Galleguillos, M., et al. (2017). The 2010–2015 megadrought in central Chile: impacts on regional hydroclimate and vegetation. Hydrol. Earth Syst. Sci. 21, 6307–6327. doi: 10.5194/hess-21-6307-2017
Garreaud, R. D., Boisier, J. P., Rondanelli, R., Montecinos, A., Sepúlveda, H. H., and Veloso-Aguila, D. (2020). The Central Chile mega drought (2010–2018): a climate dynamics perspective. Int. J. Climatol. 40, 421–439. doi: 10.1002/joc.6219
Giuntoli, I., Renard, B., Vidal, J.-P., and Bard, A. (2013). Low flows in France and their relationship to large-scale climate indices. J. Hydrol. 482, 105–118. doi: 10.1016/j.jhydrol.2012.12.038
Gomez, L., Alvarez, A., D'Ambrosio, S., Zalazar, G., and Aravena, R. (2021). Use of isotopes techniques to reveal the origin of water salinity in an arid region of Central-Western Argentina. Sci. Tot. Environ. 763:142935. doi: 10.1016/j.scitotenv.2020.142935
Gomez, L., Canizo, B., Lana, B., Zalazar, G., Wuilloud, R., and Aravena, R. (2019). Hydrochemical processes, variability and natural background levels of Arsenic in groundwater of northeastern Mendoza, Argentina. J. Iber. Geol. 45, 365–382. doi: 10.1007/s41513-018-00099-0
Gomez, M., Aranibar, J., Wuilloud, R., Rubio, C., Martínez, D., Soria, D., et al. (2014). Hydrogeology and hidrogeochemical modeling in phreatic aquifer of NE Mendoza, Argentina. J. Iber. Geol. 40, 521–538. doi: 10.5209/rev_JIGE.2014.v40.n3.43302
Gudmundsson, L., and Stagge, J. H. (2016). SCI: Standardized Climate Indices such as SPI, SRI or SPEI. R package version 1.0-2. Available online at: http://cran.r-project.org/web/packages/SCI/SCI.pdf
Hasan, H. H., Mohd Razali, S. F., Muhammad, N. S., and Ahmad, A. (2019). Research trends of hydrological drought: a systematic review. Water 11:2252. doi: 10.3390/w11112252
Hisdal, H., Stahl, K., Tallaksen, L. M., and Demuth, S. (2001). Have streamflow droughts in Europe become more severe or frequent? Int. J. Climatol. 21, 317–333. doi: 10.1002/joc.619
Hock, R., Bliss, A., Marzeion, B., Giesen, R., Hirabayashi, Y., Huss, M., et al. (2019). GlacierMIP – A model intercomparison of global-scale glacier mass-balance models and projections. J. Glaciol. 65, 453–467. doi: 10.1017/jog.2019.22
Howard, G., and Bartram, J. (2003). Domestic Water Quantity, Service, Level and Health. World Health Organization. Available online at: https://www.who.int/water_sanitation_health/diseases/WSH0302.pdf (accessed December 6, 2020)
Hu, Y., Li, H., Wang, W., and Li, Q. (2019). Application of remote sensing in monitoring the soil moisture of the irrigation area in the lower Yellow River Coastal Area. J. Coast. Res. 94, 96–100. doi: 10.2112/SI94-018.1
Hurlbert, M., and Gupta, J. (2017). The adaptive capacity of institutions in Canada, Argentina, and Chile to droughts and floods. Reg. Environ. Change 17, 865–877. doi: 10.1007/s10113-016-1078-0
Hurlbert, M., and Mussetta, P. (2016). Creating resilient water governance for irrigated producers in Mendoza, Argentina. Environ. Sci. Policy 58, 83–94. doi: 10.1016/j.envsci.2016.01.004
Hurlbert, M. A., Gupta, J., and Verrest, H. (2019). A Comparison of drought instruments and livelihood capitals. Clim. Dev. 11, 863–872. doi: 10.1080/17565529.2019.1585318
Hurlbert, M. A., and Montana, E. (2015). Dimensions of adaptive water governance and drought in argentina and Canada. J. Sustain. Dev. 8, 120–137. doi: 10.5539/jsd.v8n1p120
Kondolf, G. M., Gao, Y., Annandale, G. W., Morris, G. L., Jiang, E., Zhang, J., et al. (2014). Sustainable sediment management in reservoirs and regulated rivers: experiences from five continents. Earths Future 2, 256–280. doi: 10.1002/2013EF000184
Lauro, C., Vich, A. I., and Moreiras, S. M. (2019). Streamflow variability and its relationship with climate indices in western rivers of Argentina. Hydrol. Sci. J. 64, 607–619. doi: 10.1080/02626667.2019.1594820
Lei, F., Crow, W. T., Kustas, W. P., Dong, J., Yang, Y., Knipper, K. R., et al. (2020). Data assimilation of high-resolution thermal and radar remote sensing retrievals for soil moisture monitoring in a drip-irrigated vineyard. Remote Sens. Environ. 239:111622. doi: 10.1016/j.rse.2019.111622
Lloyd-Hughes, B., and Saunders, M. A. (2002). A drought climatology for Europe. Int. J. Climatol. 22, 1571–1592. doi: 10.1002/joc.846
Margariti, J., Rangecroft, S., Parry, S., Wendt, D. E., Van Loon, A. F., and Chadwick, O. (2019). Anthropogenic activities alter drought termination. Elementa 7:27. doi: 10.1525/elementa.365
Masiokas, M., Villalba, R., Luckman, B. H., Le Quesne, C., and Aravena, J. C. (2006). Snowpack variations in the Central Andes of Argentina and Chile, 1951-2005: large-scale atmospheric influences and implications for water resources in the region. J. Clim. 19, 6334–6352. doi: 10.1175/JCLI3969.1
Masiokas, M. H., Cara, L., Villalba, R., Pitte, P., Luckman, B. H., Toum, E., et al. (2019). Streamflow variations across the Andes (18°-55°S) during the instrumental era. Sci. Rep. 9:17879. doi: 10.1038/s41598-019-53981-x
Masiokas, M. H., Rabatel, A., Rivera, A., Ruiz, L., Pitte, P., Ceballos, J. L., et al. (2020). A review of the current state and recent changes of the andean cryosphere. Front. Earth Sci. 8:99. doi: 10.3389/feart.2020.00099
Mbow, C., Rosenzweig, C., Barioni, L. G., Benton, T. G., Herrero, H., Krishnapillai, M., et al. (2019). “Food Security,” in Climate Change and Land: an IPCC Special Report on Climate Change, Desertification, Land Degradation, Sustainable Land Management, Food Security, and Greenhouse Gas Fluxes in Terrestrial Ecosystems, eds P. R. Shukla, J. Skea, E. Calvo Buendia, V. Masson-Delmotte, H. -O. Pörtner, D. C. Roberts, P. Zhai, R. Slade, S. Connors, R. van Diemen, M. Ferrat, E. Haughey, S. Luz, S. Neogi, M. Pathak, J. Petzold, J. Portugal Pereira, P. Vyas, E. Huntley, K. Kissick, M. Belkacemi, and J. Malley, (Geneva).
McKee, T. B., Doesken, N. J., and Kleist, J. (1993). “The relationship of drought frequency and duration to time scales,” in Proceedings of the Eight Conference on Applied Climatology (Anaheim, CA: American Meteorological Society), 179–184.
Mishra, A. K., and Singh, V. P. (2010). A review of drought concepts. J. Hydrol. 391, 202–216. doi: 10.1016/j.jhydrol.2010.07.012
Mizzell, H. P., and Lakshmi, V. (2003). “Integration of science and policy during the evolution of South Carolina's drought program,” in Water: Science, Policy and Management: Challenges and Opportunities, eds R. G. Lawford, D. D. Fort, H. C. Hartmann, and S. Eden (Washington, DC: American Geophysical Union), 311–339.
Montaña, E., Diaz, H. P., and Hurlbert, M. (2016). Development, local livelihoods, and vulnerabilities to global environmental change in the South American Dry Andes. Reg. Environ. Change 16, 2215–2228. doi: 10.1007/s10113-015-0888-9
Mussetta, P., and Barrientos, M. J. (2015). Vulnerabilidad de productores rurales de Mendoza ante el Cambio Ambiental Global: clima, agua, economía y sociedad. Rev. FCA UNCUYO 47, 145–170.
Nolz, R., Cepuder, P., Balas, J., and Loiskandl, W. (2016). Soil water monitoring in a vineyard and assessment of unsaturated hydraulic parameters as thresholds for irrigation management. Agric. Water Manage. 64, 235–242. doi: 10.1016/j.agwat.2015.10.030
Poshtiri, M. P., and Pal, I. (2016). Patterns of hydrological drought indicators in major U.S. River basins. Clim. Change 134, 549–563. doi: 10.1007/s10584-015-1542-8
Richter, A., Groh, A., Horwath, M., Ivins, E., Marderwald, E., Hormaechea, J.L., et al. (2019). The rapid and steady mass loss of the patagonian icefields throughout the GRACE Era: 2002-2017. Rem. Sens. 11:909. doi: 10.3390/rs11080909
Rivera, J. A., Araneo, D. C., and Penalba, O. C. (2017a). Threshold level approach for streamflow droughts analysis in the Central Andes of Argentina: a climatological assessment. Hydrol. Sci. J. 62, 1949–1964. doi: 10.1080/02626667.2017.1367095
Rivera, J. A., Araneo, D. C., Penalba, O. C., and Villalba, R. (2018). Regional aspects of streamflow droughts in the Andean rivers of Patagonia, Argentina. Links with large-scale climatic oscillations. Hydrol. Res. 49, 134–149. doi: 10.2166/nh.2017.207
Rivera, J. A., and Arnould, G. (2020). Evaluation of the ability of CMIP6 models to simulate precipitation over Southwestern South America: climatic features and long-term trends (1901-2014). Atmos. Res. 241:104953. doi: 10.1016/j.atmosres.2020.104953
Rivera, J. A., Naranjo Tamayo, E., and Viale, M. (2020). Water resources change in Central-Western Argentina under the Paris Agreement warming targets. Front. Clim. 2:587126. doi: 10.3389/fclim.2020.587126
Rivera, J. A., and Penalba, O. C. (2018). Distribución de probabilidades de los caudales mensuales en las regiones de Cuyo y Patagonia (Argentina). Aplicación al monitoreo de sequías hidrológicas. Meteorológica 43, 25–46.
Rivera, J. A., Penalba, O. C., Villalba, R., and Araneo, D. C. (2017b). Spatio-temporal patterns of the 2010-2015 extreme hydrological drought across the Central Andes, Argentina. Water 9:652. doi: 10.3390/w9090652
Rodell, M., Famiglietti, J. S., Wiese, D. N., Reager, J. T., Beaudoing, H. K., Landerer, F. W., et al. (2018). Emerging trends in global freshwater availability. Nature 557, 651–659. doi: 10.1038/s41586-018-0123-1
Rojas, F., Rubio, C., Rizzo, M., Bernabeu, M., Akil, N., and Martín, F. (2020). Land use and land cover in irrigated drylands: a long-term analysis of changes in the Mendoza and Tunuyán River Basins, Argentina (1986–2018). Appl. Spatial Anal. 13, 875–899. doi: 10.1007/s12061-020-09335-6
Rojas, J., and Wagner, L. (2017). Conflicto por la apropiación del río Atuel entre Mendoza y La Pampa (Argentina). Historia Ambiental Latinoamericana Y Caribeña (HALAC). Revista De La Solcha 6, 278–297. doi: 10.5935/2237-2717.20160016
Saavedra, F., Cortés, G., Viale, M., Margulis, S., and McPhee, J. (2020). Atmospheric rivers contribution to the snow accumulation over the Southern Andes (26.5° S−37.5° S). Front. Earth Sci. 8:261. doi: 10.3389/feart.2020.00261
Saavedra, F. A., Kampf, S. K., Fassnacht, S. R., and Sibold, J. S. (2018). Changes in Andes snow cover from MODIS data, 2000–2016. Cryosphere 12, 1027–1046. doi: 10.5194/tc-12-1027-2018
Saldi, L., and Petz, I. (2015). Aguas ajenas, tierras extrañas. Desigualdad hídrica al sur de la cordillera de los Andes en Mendoza (Argentina) a principios del siglo XXI. Cuadernos de Desarrollo Rural 12, 123–144. doi: 10.11144/Javeriana.cdr12-75.aate
Salomón-Sirolesi, M., and Farinós-Dasí, J. (2019). A new water governance model aimed at supply–demand management for irrigation and land development in the Mendoza River Basin, Argentina. Water 11:463. doi: 10.3390/w11030463
Sarricolea, P., Meseguer-Ruiz, Ó., Serrano-Notivoli, R., Soto, M. V., and Martin-Vide, J. (2019). Trends of daily precipitation concentration in Central-Southern Chile. Atmos. Res. 215, 85–98. doi: 10.1016/j.atmosres.2018.09.005
Sepúlveda, S. A., Moreiras, S. M., Lara, M., and Alfaro, A. (2015). Debris flows in the Andean ranges of central Chile and Argentina triggered by 2013 summer storms: characteristics and consequences. Landslides 12, 115–133. doi: 10.1007/s10346-014-0539-0
Spinoni, J., Barbosa, P., Bucchignani, E., Cassano, J., Cavazos, T., Christensen, J. H., et al. (2020). Future global meteorological drought hotspots. A study based on CORDEX data. J. Clim. 33, 3635–3661. doi: 10.1175/JCLI-D-19-0084.1
Stahl, K. (2001). Hydrological drought - A study across Europe (Ph.D. Thesis). Albert-Ludwigs-Universität Freiburg im Breisgau, Germany.
Stahl, K., Vidal, J.-P., Hannaford, J., Tijdeman, E., Laaha, G., Gauster, T., et al. (2020). The challenges of hydrological drought definition, quantification and communication: an interdisciplinary perspective. Proc. IAHS 383, 291–295. doi: 10.5194/piahs-383-291-2020
Suen, J. P. (2011). Determining the ecological flow regime for existing reservoir operation. Water Resour. Manage. 25, 817–835. doi: 10.1007/s11269-010-9728-3
Sung, J. H., and Chung, E.-S. (2014). Development of streamflow drought severity–duration–frequency curves using the threshold level method. Hydrol. Earth Syst. Sci. 18, 3341–3351. doi: 10.5194/hess-18-3341-2014
Tallaksen, L. M., and Hisdal, H. (1997). Regional analysis of extreme streamflow drought duration and deficit volume. Int. Assoc. Hydrol. Sci. 246, 141–150.
Tallaksen, L. M., Madsen, H., and Clausen, B. (1997). On the definition and modelling of stream-flow drought duration and deficit volume. Hydrol. Sci. J. 42, 15–33. doi: 10.1080/02626669709492003
Tapley, B. D., Bettadpur, S., Ries, J. C., Thompson, P. F., and Watkins, M. M. (2004). GRACE measurements of mass variability in the earth system. Science 305, 503–505. doi: 10.1126/science.1099192
Tapley, B. D., Watkins, M. M., Flechtner, F., Reigber, C., Bettadpur, S., Rodell, M., et al. (2019). Contributions of GRACE to understanding climate change. Nat. Clim. Change 9, 358–369. doi: 10.1038/s41558-019-0456-2
Tromboni, F., Bortolini, L., and Morábito, J. A. (2014). Integrated hydrologic–economic decision support system for groundwater use confronting climate change uncertainties in the Tunuyán River basin, Argentina. Environ. Dev. Sustain. 16, 1317–1336. doi: 10.1007/s10668-014-9521-1
van Leeuwen, C., Destrac-Irvine, A., Dubernet, M., Duchêne, E., Gowdy, M., Marguerit, E., et al. (2019). An update on the impact of climate change in viticulture and potential adaptations. Agronomy 9:514. doi: 10.3390/agronomy9090514
Van Loon, A. F. (2015). Hydrological drought explained. WIREs Water 2, 359–392. doi: 10.1002/wat2.1085
Viale, M., Bianchi, E., Cara, L., Ruiz, L. E., Villalba, R., Pitte, P., et al. (2019). Contrasting climates at both sides of the Andes in Argentina and Chile. Front. Environ. Sci. 7:69. doi: 10.3389/fenvs.2019.00069
Viale, M., Valenzuela, R., Garreaud, R. D., and Ralph, F. M. (2018). Impacts of atmospheric rivers on precipitation in Southern South America. J. Hydrometeorol. 19, 1671–1687. doi: 10.1175/JHM-D-18-0006.1
Vicente-Serrano, S. M., López-Moreno, J. I., Beguería, S., Lorenzo-Lacruz, J., Azorin-Molina, C., and Morán-Tejada, E. (2012). Accurate computation of a streamflow drought index. J. Hydrol. Eng. 17, 318–332. doi: 10.1061/(ASCE)HE.1943-5584.0000433
Vich, A. I. J., Norte, F. A., and Lauro, C. (2014). Análisis regional de frecuencias de caudales de ríos pertenecientes a cuencas con nacientes en la Cordillera de los Andes. Meteorologica 39, 3–26.
Villamayor, J., Khodri, M., Rivera, J. A., Naranjo, E. B., and Daux, V. (2019). The expanding tropics impact on central Andes precipitation. In: EGU General Assembly Conference Abstracts 21, EGU2019–17403.
Washington, B., Seymour, L., Mote, T., Robinson, D., and Estilow, T. (2019). Identifying and extracting a seasonal streamflow signal from remotely sensed snow cover in the Columbia River Basin. Remote Sens. Appl. Soc. Environ. 14, 207–223. doi: 10.1016/j.rsase.2018.03.003
Wendt, D. E., Van Loon, A. F., Bloomfield, J. P., and Hannah, D. M. (2020). Asymmetric impact of groundwater use on groundwater droughts. Hydrol. Earth Syst. Sci. 24, 4853–4868. doi: 10.5194/hess-24-4853-2020
Zaidman, M. D., Rees, H. G., and Young, A. R. (2002). Spatio-temporal development of streamflow droughts in north-west Europe. Hydrol. Earth Syst. Sci. 6, 733–751. doi: 10.5194/hess-6-733-2002
Zazulie, N., Rusticucci, M., and Raga, G. B. (2018). Regional climate of the Subtropical Central Andes using high-resolution CMIP5 models. Part II: future projections for the twenty-first century. Clim. Dyn. 51, 2913–2925. doi: 10.1007/s00382-017-4056-4
Zelenhasić, E., and Salvai, A. (1987). A method of streamflow drought analysis. Water Resour. Res. 23, 156–168. doi: 10.1029/WR023i001p00156
Zhao, C., Brissette, F., Chen, J., and Martel, J.-L. (2020). Frequency change of future extreme summer meteorological and hydrological droughts over North America. J. Hydrol. 584:124316. doi: 10.1016/j.jhydrol.2019.124316
Zorn, M. R., and Waylen, P. R. (1997). Seasonal response of mean monthly streamflow to El Niño/Southern Oscillation in North Central Florida. Profess. Geogr. 49, 51–62. doi: 10.1111/0033-0124.00055
Keywords: hydrological drought, mountain hydroclimatology, snow-fed basins, drought impacts, drought monitoring, water management
Citation: Rivera JA, Otta S, Lauro C and Zazulie N (2021) A Decade of Hydrological Drought in Central-Western Argentina. Front. Water 3:640544. doi: 10.3389/frwa.2021.640544
Received: 11 December 2020; Accepted: 08 March 2021;
Published: 06 April 2021.
Edited by:
Luca Brocca, National Research Council (CNR), ItalyReviewed by:
Sara Modanesi, Institute for Geo-Hydrological Protection (IRPI), ItalyXiaofan Yang, Beijing Normal University, China
Copyright © 2021 Rivera, Otta, Lauro and Zazulie. This is an open-access article distributed under the terms of the Creative Commons Attribution License (CC BY). The use, distribution or reproduction in other forums is permitted, provided the original author(s) and the copyright owner(s) are credited and that the original publication in this journal is cited, in accordance with accepted academic practice. No use, distribution or reproduction is permitted which does not comply with these terms.
*Correspondence: Juan A. Rivera, anJpdmVyYUBtZW5kb3phLWNvbmljZXQuZ29iLmFy