 Grinson George1
 Nandini N. Menon2*
 Anas Abdulaziz3
 Robert J. W. Brewin4
 P. Pranav1
 A. Gopalakrishnan1K. G. Mini1Somy Kuriakose1
 Shubha Sathyendranath5
 Trevor Platt5
- 1Indian Council of Agricultural Research (ICAR)-Central Marine Fisheries Research Institute, Cochin, India
- 2Nansen Environmental Research Centre India, Kerala University of Fisheries and Ocean Studies (KUFOS) Amenity Centre, Cochin, India
- 3Council of Scientific and Industrial Research (CSIR)-National Institute of Oceanography, Regional Centre Cochin, Cochin, India
- 4Centre for Geography and Environmental Science, College of Life and Environmental Sciences, University of Exeter, Penryn, United Kingdom
- 5Plymouth Marine Laboratory, Plymouth, United Kingdom
Citizen science aims to mobilise the general public, motivated by curiosity, to collect scientific data and contribute to the advancement of scientific knowledge. In this article, we describe a citizen science network that has been developed to assess the water quality in a 100 km long tropical lake-estuarine system (Vembanad Lake), which directly or indirectly influences the livelihood of around 1.6 million people. Deterioration of water quality in the lake has resulted in frequent outbreaks of water-associated diseases, leading to morbidity and occasionally, to mortality. Water colour and clarity are easily measurable and can be used to study water quality. Continuous observations on relevant spatial and temporal scales can be used to generate maps of water colour and clarity for identifying areas that are turbid or eutrophic. A network of citizen scientists was established with the support of students from 16 colleges affiliated with three universities of Kerala (India) and research institutions, and stakeholders such as houseboat owners, non-government organisations (NGOs), regular commuters, inland fishermen, and others residing in the vicinity of Vembanad Lake and keen to contribute. Mini Secchi disks, with Forel-Ule colour scale stickers, were used to measure the colour and clarity of the water. A mobile application, named “TurbAqua,” was developed for easy transmission of data in near-real time. In-situ data from scientists were used to check the quality of a subset of the citizen observations. We highlight the major economic benefits from the citizen network, with stakeholders voluntarily monitoring water quality in the lake at low cost, and the increased potential for sustainable monitoring in the long term. The data can be used to validate satellite products of water quality and can provide scientific information on natural or anthropogenic events impacting the lake. Citizens provided with scientific tools can make their own judgement on the quality of water that they use, helping toward Sustainable Development Goal 6 of clean water. The study highlights potential for world-wide application of similar citizen-science initiatives, using simple tools for generating long-term time series data sets, which may also help monitor climate change.
Introduction
Sustainable Development Goal (SDG) indicator 6.3.2 (on the “proportion of bodies of water with good ambient water quality”) (UN Water, 2017) aims to address the lack of data from less developed countries on water quality indices. Satellite remote sensing has global reach, and has made important strides in data collection on synoptic scales, but validation and formulation of appropriate, often regionally-tuned, algorithms are required to enhance the quality of regional products. Satellite data are also constrained by operational difficulties such as cloud cover, the limited frequency of passes of certain satellites, difficulties with atmospheric correction, and the optical complexity of nearshore and fresh waters, which hamper the performance of satellite algorithms in such waters. Citizen science data carves out a separate niche of observations which can supplement satellite and in-situ measurements. Globally, there are established programmes for time-series measurements of water properties using sensors such as Argo, Global Alliance of Continuous Plankton Recorder Service (GACS), Global Ocean Observing System (GOOS) and many more (Belward et al., 2016). Such networks serve a very useful service, but when dealing with local studies at locations out of the range of such networks, other solutions are needed, such as data collection by citizens (HLPF, 2018; UN Water, 2018; Quinlivan et al., 2020).
The involvement of citizens in hydrological studies has a long history. The earliest prototype is probably the drift bottles used to study surface current patterns in the 1960s (Njue et al., 2019). Monitoring turbidity of the Lake George, New York is cited as one of the long-term citizen science activities wherein the turbidity measurements from various parts of the lake have been continuing since 1986 and improving public awareness of the water quality (Boylen et al., 2004). Engaging citizens in a project activity not only provide additional manpower but also serve to educate them. Abbott et al. (2018) have successfully used 18 years of riverine nutrient data collected by secondary school students and community volunteers to assess how improvements in land management affect the interannual trends and seasonality of river nutrient concentrations in western France. Water quality monitoring of seven rivers and streams in Hong Kong (Ho et al., 2020) is proof for the reliability of the data collected by citizen scientists. They obtained moderate to strong correlations in pH, turbidity and dissolved oxygen (DO) data collected by citizen scientists and professional scientists. To evaluate the performance of citizen scientists and to design strategies for efficient water quality monitoring by citizens, various scientific projects have been implemented. In the SIMILE Interreg Italy-Switzerland project, smartphone applications were employed and analysed (Carrion et al., 2020). Realising that none of the applications for water quality monitoring are open-source ones, SIMILE team designed a new free, open-source application with the option for the users as well as the developers to customise and improve it. Oberoi et al. (2018) call the citizen scientists as “sensors” who can supplement advents in internet and mobile technology. Location sensors (GPS) and cameras on board the mobile devices equip the citizens to collect geotagged data and store them. The use of smartphones and digital cameras in citizen science programmes are improving day by day, an example of which is the mobile application HydroColor that derives water leaving reflectance from digital images (Gao et al., 2020). Most of the citizen science programmes in hydrology from 2001 to 2018 seem to have focused on the monitoring of water quality (Njue et al., 2019), probably due to the increased global awareness on the deterioration of water quality plus the availability of low-cost kits to measure basic water quality variables.
Citizen science offers a way to collect large sets of temporal and spatial data at minimal cost; and can therefore bridge the data gap that the international community faces (Loperfido et al., 2010; Buytaert et al., 2014; Hulbert, 2016; Walker et al., 2016; Ballard et al., 2017; Assumpção et al., 2018; Carlson and Cohen, 2018). However, the quality of citizen-derived data has to be assured, and can be promoted through training programmes (Brouwer et al., 2018). But the expenditures related to citizen science are modest compared with those needed for more sophisticated water quality data collection. Involvement of the general public or stakeholders in scientific data collection process will not only help in the generation of time-series of scientific information, but also promote awareness among the public on the need to protect the water bodies from pollution. This will eventually lead to stakeholder-based evaluation of the quality of water they use and prevent usage of un-safe water, and degradation of water quality. Such improvements are essential to the reduction in water-borne disease incidences from unhygienic or contaminated water.
Awareness raising among the general public, and their participation in conservation efforts have been shown to be important for the successful restoration of many ecosystems (Suman, 2017). Wetlands are an example of sensitive ecosystems whose conservation can benefit from public participation. In this paper, we describe the establishment of a citizen-science network used to monitor the water quality of Vembanad Lake, a large fresh and brackish water lake and one of the three Ramsar sites in Kerala, India. Around 10 rivers drain in to this lake. Vembanad Lake is classified as a critically vulnerable coastal area (CVCA) under Coastal regulation zone (CRZ) notification of 2011. The lake is rich in biodiversity and plays a major role in the livelihoods of 1.6 million people, which ranges from agriculture and fishing to tourism. Anthropogenic activities of different scales, such as construction of a barrier controlling the exchange of water between the northern and southern parts of the lake, dumping of domestic wastes and industrial pollutants, eutrophication, faecal contamination, and aquatic weed infestation, have imposed multiple stresses on the lake, leading to its deterioration. This in turn has led to the proliferation of disease vectors such as mosquitoes, and the lake has become a source of infection for water-associated diseases. The lake is narrow and sinuous in the north, but much broader, with a maximum width of 14.5 km in the south (Figure 1). Running parallel to the sea from Azhikode to Alappuzha, the lake is connected to the sea at two places, Azhikode and Kochi. Routine sampling along the entire extent of the lake, that includes many polders or “padasekharams” (vernacular for agricultural fields) surrounded by narrow inlets, is cumbersome and expensive.
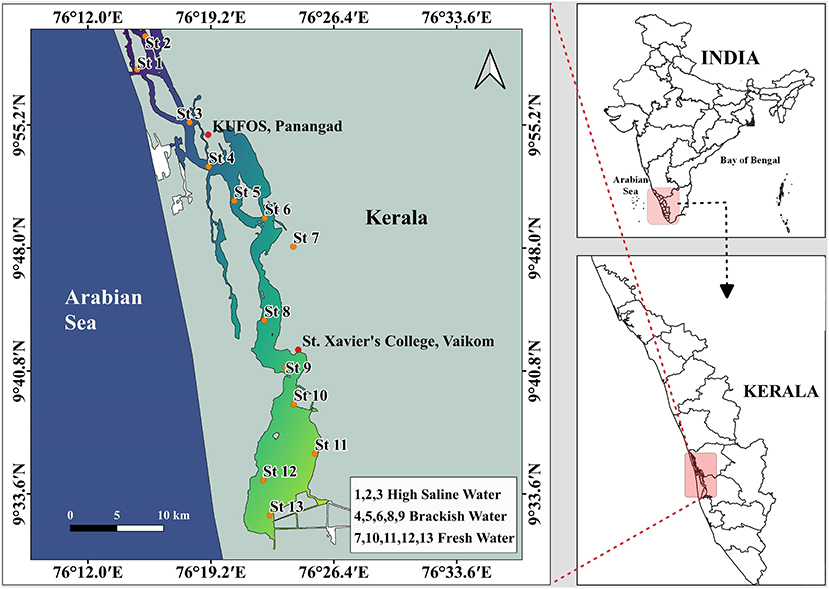
Figure 1. Study area—Vembanad Lake showing the 13 stations from which water quality data were collected by scientists at 20 days interval for one and half years. The two academic institutions—KUFOS and St. Xavier's College where we initiated the pilot study are also indicted in the map.
The lives of the people in the vicinity of the lake are intimately linked to the lake. It is used for bathing, washing, cooking, and is an important means of local transport. The southern part of the lake, Kuttanad, is known as the rice bowl of Kerala where cultivation is done below mean sea level. The lake and the surrounding low-lying regions are subject to frequent flooding, especially during the monsoon season. The high literacy (96.2%) and willingness to obey the instructions given by experts is perhaps the reason for this. It is imperative that such a literate society be educated about the deterioration of the water body, which is their lifeline. This aspect is being addressed in the present study under the India-UK water quality initiative, which combines in-situ and remote sensing approaches to understand the relationship between water-borne diseases and environmental conditions, and aims to propose remedial action for microbial contamination in the lake, to enhance social welfare by improving public health.
The citizen-science network established in connection with this study aims to increase scientific understanding by enabling public participation in data collection and monitoring. With public support a database on the water clarity of Vembanad Lake was created, which has the potential to grow into a time-series, which can aid climate-related research in the long-term.
Methodology
The Secchi disk is a standardised method to measure the transparency of water bodies in a simple, quick and accurate way (Secchi, 1885; Wernand, 2010). One of the traditional measurements of light attenuation in water, it is simple, inexpensive and provides an informal visual index of the optical properties of the water body (Preisendorfer, 1986). Optical properties of a water body can be used as indicators of biological activity, sediment load, and even pollution, and hence can provide a direct indication of the water quality. Change in optical properties cause change in the colour of the water. The Forel-Ule (FU) colour scale is another traditional tool used to quantify the colour of water, with a scale of 21 colours ranging from blue to brown (Forel, 1890; Ule, 1892), with the observations typically taken using a submersed Secchi disk, at roughly half the Secchi depth (Wernand and van der Woerd, 2010). Both the Secchi disk and the FU colour scale have proven to work successfully in many citizen-science projects monitoring water quality (e.g., Lottig et al., 2014; Garaba et al., 2015; Busch et al., 2016a,b; Seafarers et al., 2017). Recently, a miniaturised 3D-printed Secchi disk tool (3DMSD), with a FU colour scale sticker, has been developed (Brewin et al., 2019). Building on the traditional Secchi disk and FU colour scale, the pocket-sized 3DMSD was modified for ease of operation in smaller water bodies, such as lakes, and from small watercraft and platforms (Brewin et al., 2019). It is a small, light and convenient-to-use device, designed specifically for citizen science projects. The device is primarily manufactured using a 3D printer and basic workshop tools, meaning any citizen has the potential to make the device (see instructions and files provided in Brewin et al., 2019). It also offers potential for large-scale bespoke manufacture. Designed specifically for use in lakes and estuaries, where the water is typically more turbid than in the ocean, the device has a smaller disk size of 10 cm (see justification for this decision in section 2.1 of Brewin et al., 2019). Should data be compared with Secchi disk measurements that used a large disk (not conducted here), one might need to consider a small correction in measurement for a change in disk size, but this would be possible given knowledge of Secchi depth theory (e.g., Preisendorfer, 1986), if required at all [see discussion of this in Hou et al. (2007), whose results suggest the disk size does not significantly alter the Secchi depth].
As part of the India-UK water quality initiative, under the project REVIVAL, 85 3DMSD were produced and distributed for the citizen science activity. Combining the data with a smartphone app that collects information on GPS, time and date, geolocated and time-stamped Secchi depth and FU data were collected by the citizens.
The smart-phone application named “TurbAqua” can transfer photos taken using a mobile camera, the GPS locations of the measurements, and the 3DMSD data (Secchi depth as well as colour code) to a central database. In the following sections, we describe the research design of the citizen science network, the development and implementation of the network, data generated by the network, the scientific analysis undertaken, and the effectiveness and the economic benefits of citizen science data collection.
Strategy
As a first step, a number of 3DMSDs were handed over to selected faculty members of St. Xavier's College, Vaikom, Kerala and Kerala University of Fisheries and Ocean Studies (KUFOS), Panangad, Kerala both situated along the banks of Vembanad Lake. These 3DMSD were then distributed to students living on the banks of the lake. They were trained near their campus premises to collect data using the 3DMSD on Secchi depth, select the FU code corresponding to the water colour when the Secchi disk is submersed (at half the Secchi depth) and to take a photo of the water surface using the smartphone camera. Data recorded using the app TurbAqua were uploaded onto the server when the phone had an internet connection. The initial pilot study proved successful, as data began to flow into the server. However, teething issues on the handling of the 3DMSD led to errors in measurement and in the usage of the mobile application TurbAqua. Following the pilot study, these issues were rectified by providing additional training for all student stakeholders, and by improving the TurbAqua app.
Organisation of Citizen Science Network
A training programme was organised for college students. We sent invitations to all the colleges located in the vicinity of the lake with under-graduate programmes in fisheries, biology, or environmental sciences. We also sought and received media support in informing the public about the training programme held at the Indian Council of Agricultural Research—Central Marine Fisheries Research Institute (ICAR-CMFRI) as part of the citizen science initiative. Sixteen colleges/research institutions responded to be part of the Vembanad Lake citizen science network (Table 1). College students were selected for building the network because it became part of their education, with support at the very highest levels in the colleges.
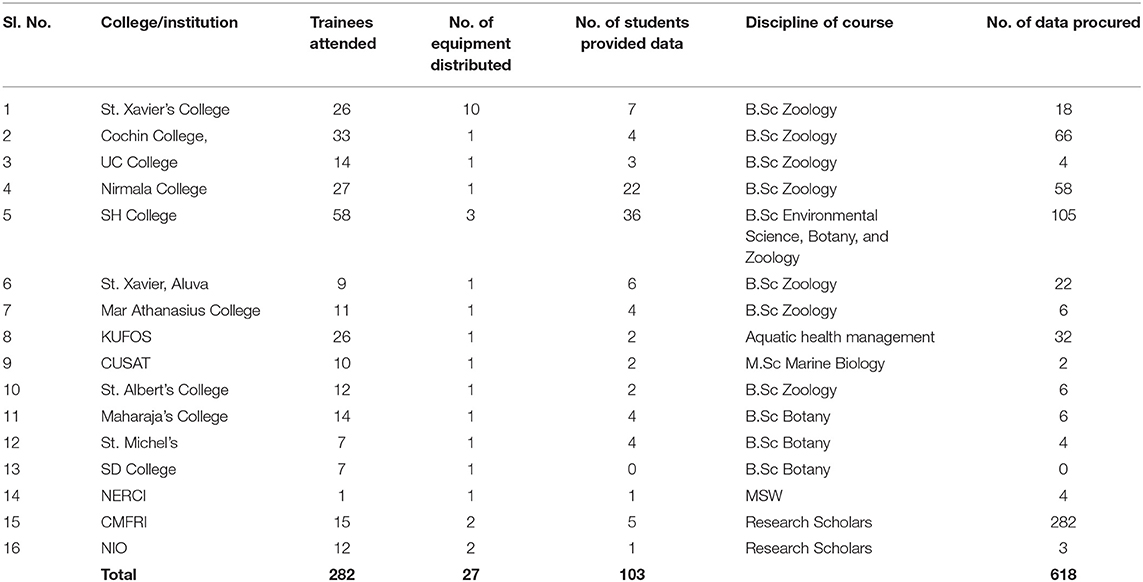
Table 1. Activity summary of the colleges along the vicinity of the lake who participated in the citizen science programmes.
A brochure for citizen science training workshop was prepared (Supplementary Material 1) and circulated among the colleges conducting undergraduate (UG) and postgraduate (PG) courses in biology, fisheries and environmental sciences in the districts Ernakulam, Alappuzha and Kottayam straddling the lake. A training manual with detailed instructions on the operation of the 3DMSD and TurbAqua was prepared (Supplementary Material 2).
The first training workshop was conducted at ICAR-CMFRI, Kochi on 9th August, 2019 in which 282 students from 16 colleges and institutions (Figure 2) participated. Both theoretical and practical training on the operation of the 3DMSD and TurbAqua were given to trainees (programme schedule as Supplementary Material 3). After the training, 3DMSDs were distributed to some of the students, who also installed the mobile application on their smart phones. From August 2019 to March 2020, continuous data inflow began from the student activity.
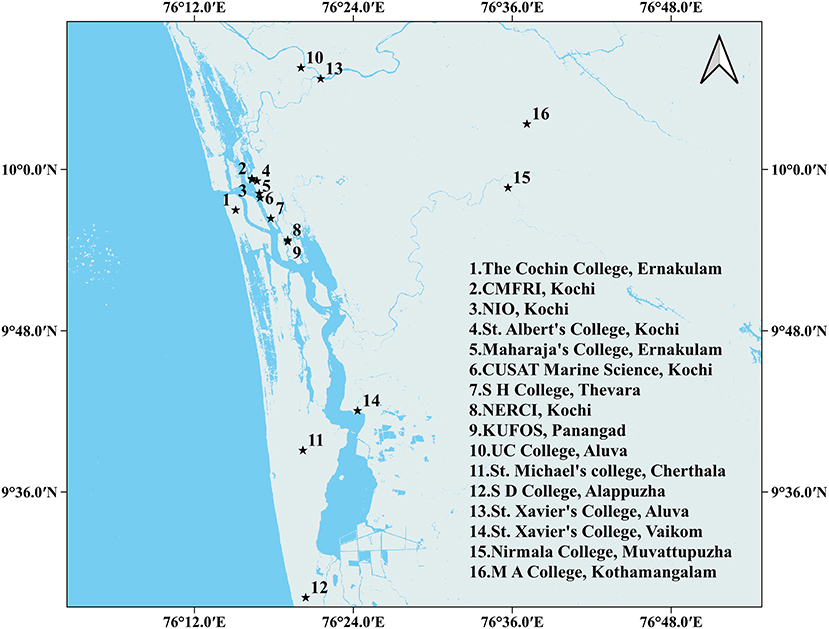
Figure 2. The spatial spread of 16 academic institutions which were part of the citizen science network.
Encouraged by the success achieved in the first training workshop, a second training workshop was organised for different stakeholders of the Vembanad Lake, such as fishermen, boat owners, NGOs, farmers, social scientists and environmentalists. The programme was hosted on 20th December, 2019 and was attended by 46 participants from different sectors. Secchi disks were distributed to participants after the successful training (programme schedule as Supplementary Material 3). Boat owners were asked to encourage their passengers to use the 3DMSD for measuring water transparency and colour. The activity details of the stakeholders other than students are summarised in Table 2.
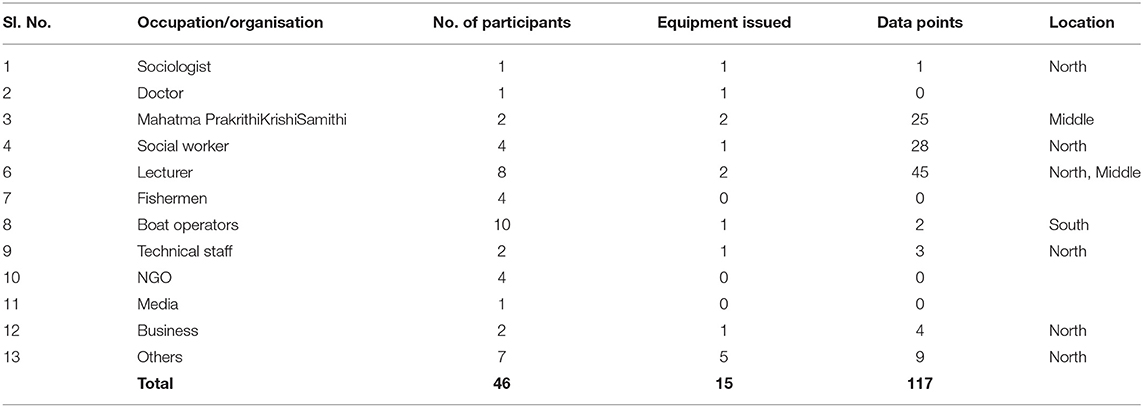
Table 2. Activity summary of the stakeholders other than students.
Print, Visual, Social Media, and Follow-Up Interventions
The local community residing along the vicinity of the lake is highly literate and we used a two-pronged strategy to sustain the enthusiasm among the citizen scientists. First strategy was to keep the faculty among the colleges linked to us, scientists with the help of a WhatsApp group, where we regularly started posting information on our initiative and sensitising them about the need and progress of our scheduled activities. We provided lectures to the participating students both online and in person, to keep them interested in the network and to continue to contribute data. In all citizen-science-related scientific presentations, we involved them online by providing them with links to the seminars (Supplementary Material 7). Many of them attended the seminars, and video links were provided to the network mostly for the benefit of those who were unable to attend. The second strategy was to use print, visual and social media to impress the network and the general public on the need for generating scientific information related to the Vembanad Lake and popular dailies produced separate supplements highlighting the need for supporting this project (Supplementary Material 4). Further, we encouraged personal interviews with visual media on the training sessions held and circulated the same using Facebook and WhatsApp which seemed to create a good-will for the programme. There are 29 participants in the WhatsApp group named Citizens Science Secchi who are the coordinators of the entire network. Further, an oral feedback survey was conducted among the citizens who provided data using “TurbAqua” app to assess the good-will generated. The results show that 46% of the participants rated the programme as excellent, 51% as good and only 3% rated it as not useful. In the case of students, main reasons for discontinuing the activity were either the restrictions imposed as part of fighting the COVID pandemic (43%) or course completion (23%) following which they left the institution (Supplementary Material 8).
Preliminary Validation Exercises
The data collected by the citizens were examined by us and to assure the quality of the data collected, few simple statistical analyses and comparison with our data were done. The CTD measurements (SEABIRD CTD Model SBE 19plus V2 SeaCAT Profiler) taken during our routine survey of the lake provided data on turbidity also as it carries a turbidity metre. Turbidity data from CTD was correlated against the Secchi depth data obtained through citizen science measurements.
Optical properties of the lake water such as absorption by CDOM, phytoplankton and detrital material measured (Bricaud et al., 1981, 1995; Kishino et al., 1985) regularly during our lake sampling were also used for comparison. The absorption co-efficient at 440 nm of the phytoplankton, CDOM and detritus were plotted as a ternary plot, in which the axes represent the fractional contributions due to each of the three components (Prieur and Sathyendranath, 1981). The ternary plot thus prepared was compared with the FU codes reported by citizens so as to check if the maximum represented colour codes matched with the dominating component in the ternary plot.
Another method adopted was to cross-check the colour codes reported by the citizens with that of the respective photos provided by them. The mismatches in data were removed and the correlation between Secchi depth and FU colour code was estimated before and after removal of the outliers.
Results
Citizen Science Observations
Over a period of 17 months from August 2019 to December 2020, college students acquired continuous data reaching a total of 735 readings (618 from the student team and 117 from other stakeholder team) taken from different parts of the lake (Figure 3), of which 643 data points were found to have all requisites needed for our analysis. The complete data set received as part of the study is provided as Supplementary Material 5. Out of the total photos taken by the citizen scientists and saved in the server, those representing each water colour code has been given as a collage in Supplementary Material 5a. National lockdown announced on 24th March 2020 in the wake of COVID-19 pandemic put an unexpected sudden stop to the citizen science activity, but it picked up again when the lockdown was lifted. The complete time-series data were partitioned into three phases—pre-lockdown, lockdown and post-lockdown to show the variability in data acquisition in these phases (Figure 4).
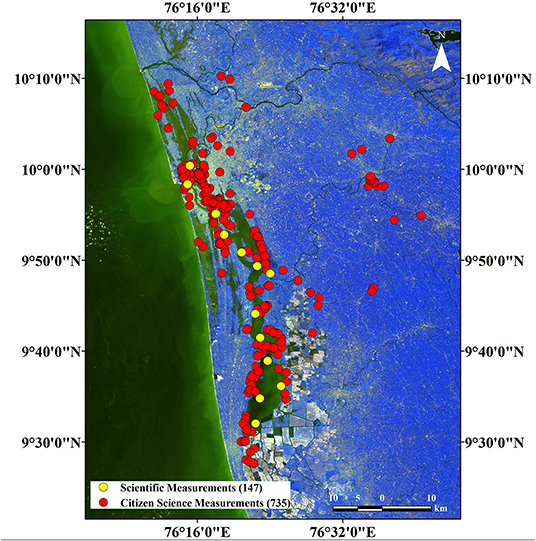
Figure 3. Total number of data points collected by the citizen scientists from the Vembanad Lake.
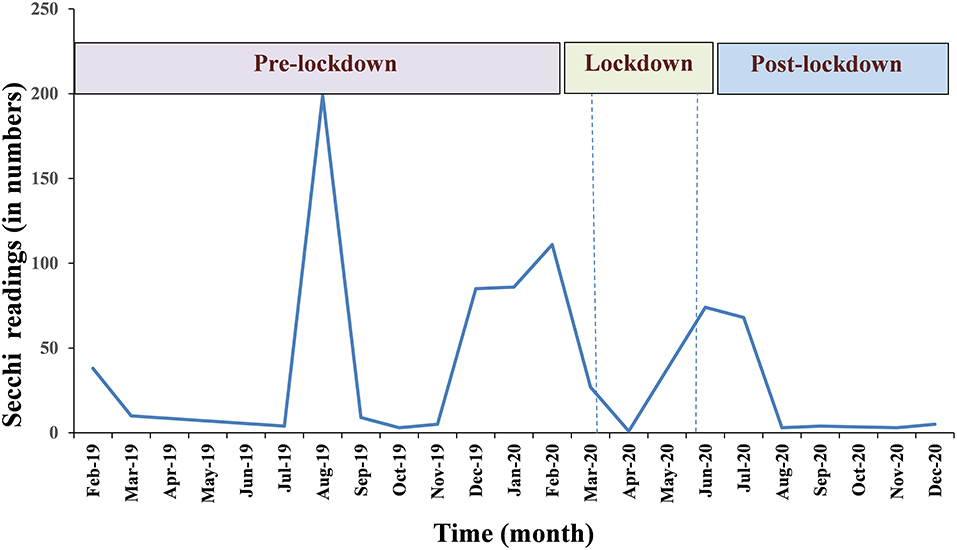
Figure 4. Variability in the number of Secchi readings during different phases of COVID related restrictions—pre-lockdown, lockdown, and post-lockdown.
In contrast to the 13 stations sampled by the scientific team of the project for 16 times over a period of one and half years, the citizens collected 735 sets of data from over 100 points along the length and breadth of the lake. The size of the circles in Figure 5 indicate the frequency of measurements in each location. Citizens deployed the 3DMSD from the banks of the lake and along the tributaries which are inaccessible by our research vessels. Further, the map used in Figure 5 was overlaid on the study area map procured from Landsat 8 satellite, which did not highlight each and every inlet and tributary. Hence the data points seem to be on the land, whereas in reality they are not.
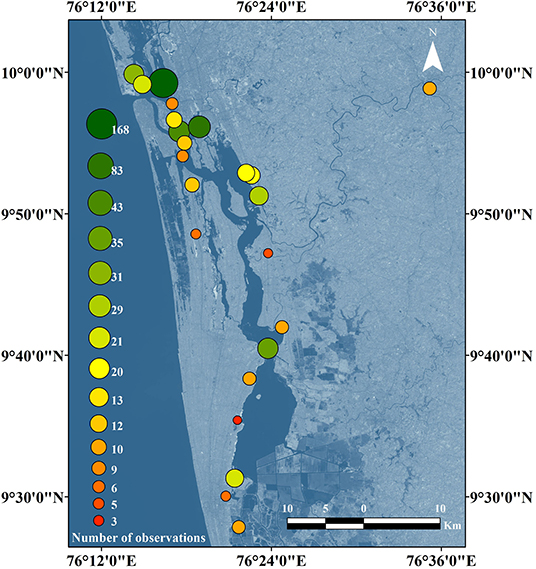
Figure 5. Number of observations made by citizen scientists from each point of the lake.
The Secchi depth data collected by scientists during regular sampling of the Vembanad Lake was compared with that of the data collected by citizen scientists. There was high complementarity of citizen and scientist measurements in the case of Secchi depth (Figure 6A), whereas the relation was not very good in the case of water colour (Figure 6B).
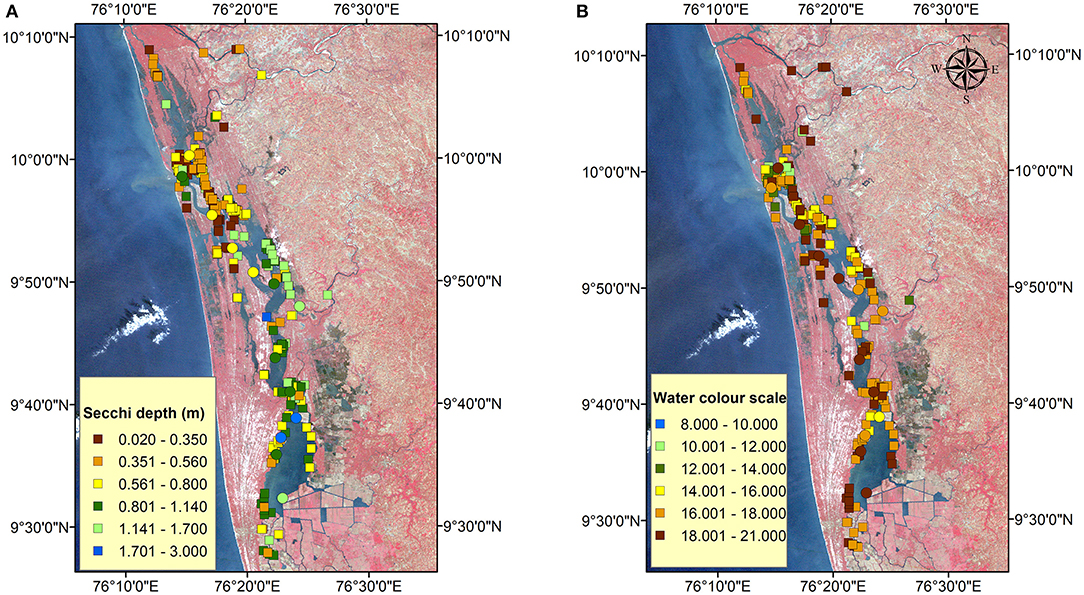
Figure 6. (A) Secchi depth observations and (B) water colour codes obtained from the measurements of both scientists from 13 locations as well as citizens in the Vembanad Lake for 17 months of citizen science activity during August 2019–December 2020. Circles represent the measurements by scientists and squares represent citizens' observations.
Validation Results
Secchi depth data collected by the citizen scientists were validated using the turbidity values measured simultaneously by marine scientists using CTD. Figure 7A shows that the relation is statistically significant with r-value of −0.75 (N = 64). Further, using the equation given by Anon (2012), turbidity was derived from Secchi depth measured by citizen scientists. Figures 7B,C show the similarity in turbidity profile of the lake plotted using the CTD data (Figure 7B) as well as the citizen science data (Figure 7C).
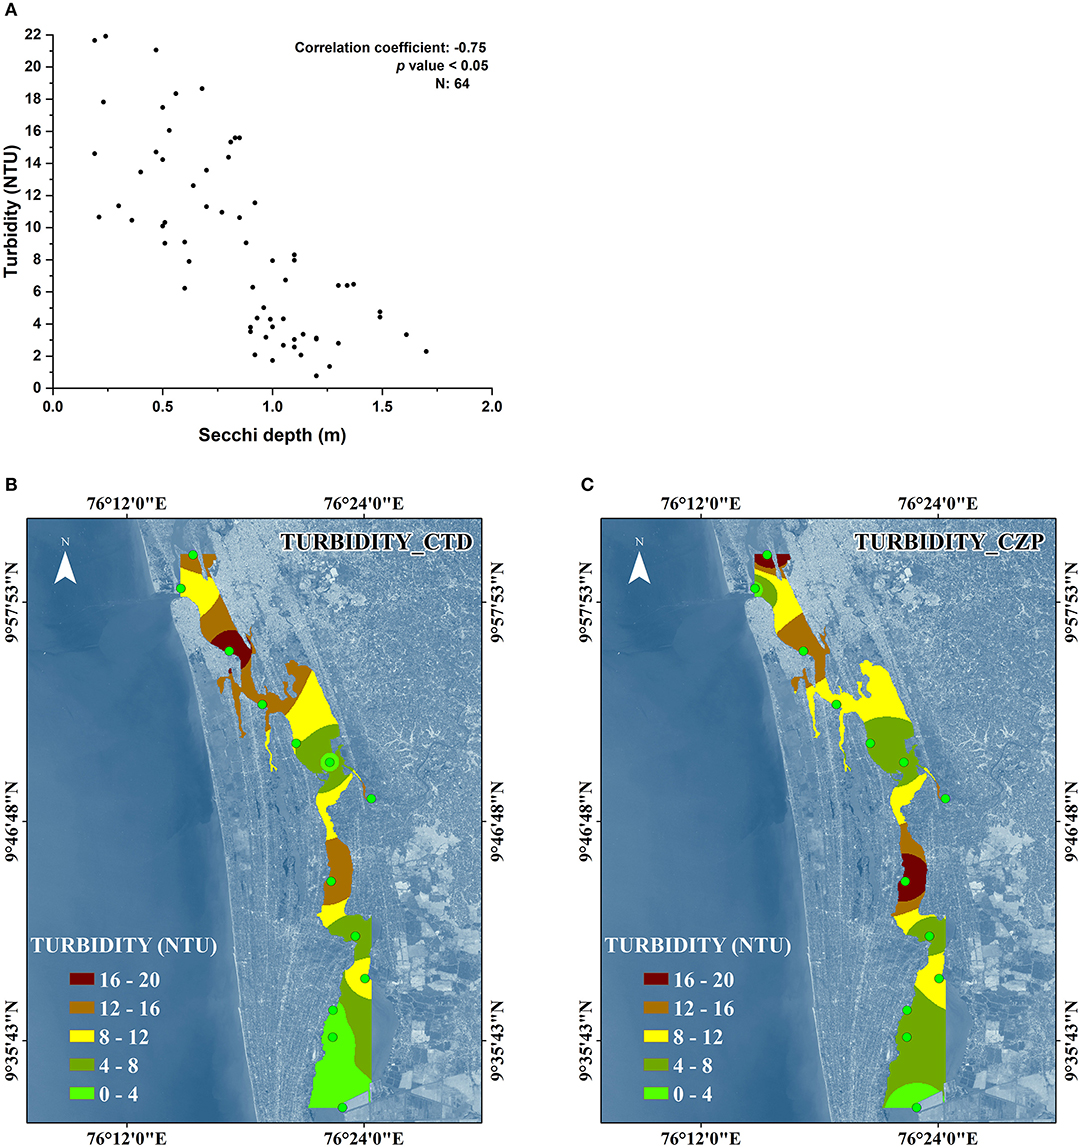
Figure 7. (A) Correlation between Secchi depth measured by citizens and turbidity measured simultaneously using the CTD instrument by scientists. (B) Spatial turbidity profile of Vembanad Lake based on the CTD data. (C) Spatial turbidity profile of Vembanad Lake based on the turbidity derived from Secchi depth data, using the model of Anon (2012). Average of data collected from August 2019 to December 2020 are used.
The FU colour codes recorded by the citizens (Figure 8A) were compared with the optical characteristics of the lake measured by scientists. Around 44% of the total measurements belonged to colour codes in the range 19–21 (brownish green to cola brown) that represent murky yellow to brown colours. Ternary plot (Figure 8B) of bio-optics of Vembanad Lake also show the dominance of absorption by detritus in the lake, which typically colours the water yellow or brown.
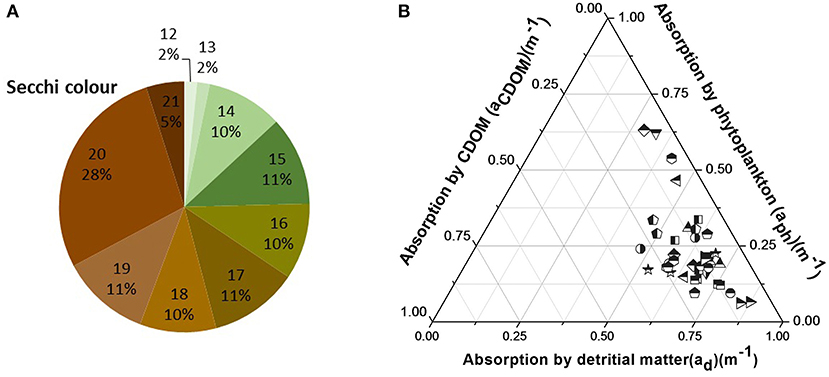
Figure 8. (A) Percentage contribution of FU colour codes obtained from citizen science data (colour code and percentage are given in each division). (B) Ternary plot showing absorption properties of Vembanad Lake.
Correlation measurement between the FU index and Secchi depth obtained using the 3DMSD showed that the results improved significantly when the outliers were removed (Figure 9).
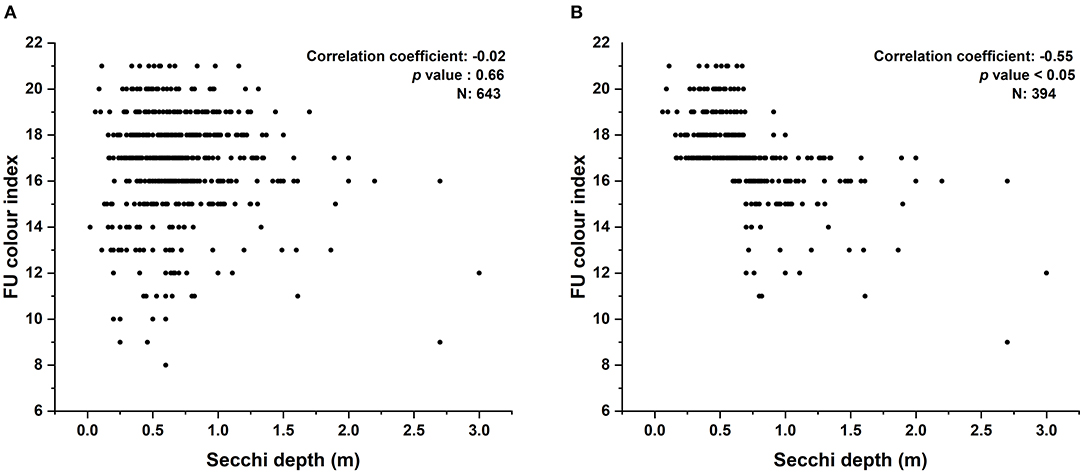
Figure 9. Correlation between FU index and Secchi depth obtained using the MSD. (A) Using the entire data collected by citizens (N = 643). (B) After removing outliers (N = 394). Relation became statistically significant (p < 0.05) after removal of outliers.
Economics of Citizen Science Activity
A comparison was done to assess the economics of citizen science data collection in comparison with their professional counterparts. Here, we compared the costs per data point. Table 3 gives an overview of the expenses incurred for data collection by citizens and scientists, and demonstrates how costs for data collection are lower when using the network of citizen scientists. Detailed economic analysis worksheet is given as Supplementary Material 6.
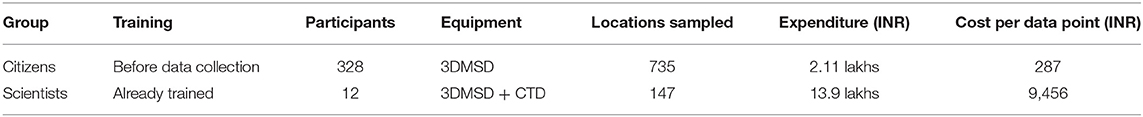
Table 3. Comparison of the relevant variables and cost associated with data collection using 3DMSD by citizens and scientists.
Discussion
Terrestrial citizen science networks are more prevalent globally, but in recent years, marine and freshwater citizen science endeavours have been gaining momentum (Ceccaroni et al., 2020). With our coastal environments in peril due to increased anthropogenic impacts, citizen science provides a platform to address challenges such as deterioration of water quality for which there is scarcity of data. Citizen science projects to measure lake water transparency started as early as 1938 (Lottig et al., 2014). One of the recently successful projects of estimation of ocean transparency is the seafarer citizen science Secchi disk study that began in 2013 (http://www.secchidisk.org) which has demonstrated how the Secchi disk measurements of ocean transparency by citizens could help assessments of climate-induced changes in the phytoplankton (Seafarers et al., 2017). In the REVIVAL project, the 3DMSD designed and fabricated in a high school in the UK (Brewin et al., 2019) was combined with a free mobile application “TurbAqua” for android operating systems. The biggest advantage of the mobile application is the hassle-free collection of data and the immediate receipt of the readings and photographs on the server. Students actively supported the project by providing most of the in-situ data (727 out of 826 readings). The number of data generated in the short time of 17 months is testimony to the success of the network.
Vembanad Lake and the surrounding areas constitute a dynamic ecosystem containing elements of fresh water, brackish water, and saline water so that the lake can be treated as a prototypical tropical system. The dense population along its shoreline is vulnerable to periodic flooding and consequent deterioration of the local sanitary conditions. Dry summers followed by heavy rains during monsoons, lead to strong seasonal variability in flushing rates, salinity, temperature, and pH. River discharges into the lake also follow a seasonal pattern: sluggish in summer, and torrential during the rainy season. The stressors that have been imposed on the lake by humans in the form of industrial pollution, agricultural pollution, reclamation, tourism, construction of bunds, and barriers preventing free flow of water, have all had their share in deteriorating the water quality of the lake. The lake is now a breeding ground of mosquitoes that act as vectors for many diseases such as Chikungunya, malaria, filariasis, and microbial pathogens such as Vibrio cholerae that cause water-borne diseases impacting the health of the population (Sathyendranath et al., 2020). Water quality determines its suitability for human consumption and the ecological status of the water body. The elongated and indented shape of the lake with its narrow channels makes it difficult for monitoring. In light of this, the citizen science network was established to operationalise monitoring of water quality, specifically the water clarity and colour. Water clarity is controlled by the scattering and absorption of light by particulate dissolved matter in the water, including phytoplankton, dissolved and suspended organic and inorganic matter, and by pure water itself. The simplest way of measuring it is by using the Secchi disk. The change in water colour with the concentrations of these optically-active substances can be obtained using the FU scale. Sensors on satellites and in-situ sampling devices are used for estimation of water clarity and colour. Multispectral Imager (MSI) on two Sentinel-2 satellites used to determine seasonal variation in the colour of water of 170 Italian lakes in 2017 showed that while 13 lakes moved from blue to yellow, indicating reduction in water clarity, another 16 lakes showed transitions in the opposite direction, from green to blue or from yellow to green, suggesting improved water clarity from spring to late summer (Giardino et al., 2019). Li et al. (2016) based on the study of the largest 10 lakes in China in 2000–2012 are of the view that the relations of FU index with water clarity and trophic state are not accurate, as the FU index reflects both Secchi depth and chl-a, which are important input parameters in trophic state assessment models. A rough classification of water body into oligotrophic, mesotrophic, and eutrophic is the only possibility. Comparative evaluation of three sensor-based models from Landsat ETM+-VNIR data and two smartphone apps—EyeOnWater and HydroColor—to predict the water quality of Kesses Dam in Kenya showed that the estimation of turbidity from the EyeOnWater app, which is based on the FUI-XYZ colour space, was marginally lower than from the HydroColor app which uses the RGB colour space, possibly due to the error contribution by the x-chromaticity coordinate conversion process (Ouma et al., 2018).
The measurements on Secchi depth and FU index obtained with the help of crowd sourcing are used in REVIVAL project to validate the satellite-derived water colour and turbidity (Van der Woerd and Wernand, 2015) which we employ as an innovative pathway to monitor water quality.
When scientists monitor the lake, there are limitations to the number of data points that can be procured by deploying the small number of trained manpower available, but when citizens are involved, there is scope to procure more data. The difference in the number of data points recorded in the REVIVAL project by scientists and citizens testifies to this. Figures 6A, 7A show the accuracy of Secchi depth data collected by citizens in comparison with those collected by scientists. The initial training that was provided to the college students and stakeholders have helped in achieving this success rate. Capdevila et al. (2020) also are of the view that “knowledge and experience on data gathering,” which comes from initial training prior to data collection and feedback after collection, definitely improves the quality of the data collected. We have also provided feedback and follow-up to rectify the practical difficulties faced by the citizens during initial stages of data collection. However, it was found that the training as well as the follow-ups provided did not meet the required standard as far as the FU indices were concerned. FU colour index recorded by the University students as well as stakeholders had many mismatches with the corresponding Secchi depths. As noted by Weeser et al. (2018) in Kenya, the educational background of the citizens had no impact on the quality of the data collected with regard to this variable. The difference in the FU indices recorded by both citizens and scientists (Figure 6B) and the lack of significant correlation between Secchi depth and FU colour code derived using the entire data (N = 643) received in the server (Figure 9A) prove this. Significant relationship was obtained between Secchi depth and FU index only after the removal of outliers (N = 394). But, Chase and Levine (2017) disagree with us and are of the opinion that highly educated volunteers enhance the output of a project.
Motivation is an important factor influencing the continued participation of a person in a citizen science project. Maintaining enthusiasm of participants over long periods is particularly challenging (Bear, 2016). To combat this challenge, we selected University students for the first phase of our citizen science programme. The advantage is that new participants are added to the network every year as the student population turns over, and the average number of participants does not decline. Our strategy matches the view of Thiel et al. (2014) wherein they state that greater understanding of the scientific processes, development of a skill base and social commitment act as motivators. For students, it is a chance to understand the environment and contribute to scientific research for its conservation (Domroese and Johnson, 2017). Further, the data will help to monitor unusual and long-term changes in water quality and validate satellite data which provide a synoptic view of the study area. In addition, as pointed out by Bonney et al. (2009), we also realised that engaging with academic institutions provide a way for collaboration, improving the reach of the activity and easy communication about the areas and frequency of measurements.
The success of the activity depends on how it influences the outcome of the projects of which citizen science is a part. To maintain data quality, statistical comparison of results reported by citizen scientists with those by scientists is desirable as a means of data validation (Thiel et al., 2014; Earp et al., 2018). The citizen science data being collected using a simple equipment is prone to human errors. Our study showed that the Secchi depth data collected by citizens were comparable to that collected by scientists. Step by step instructions given to the citizens on how to measure the Secchi depth helped ensure data quality. Reviews also have shown that data collected by citizen scientists can meet, or surpass, accepted quality standards, or be used to detect important ecological trends (Cox et al., 2012; Forrester et al., 2015; Kosmala et al., 2016; Schläppy et al., 2017). However, the wide variation in the FU colour index measured by the citizens is a matter of concern. In our study, the citizen reports a FU colour code, supported by a photo taken using his/her smartphone camera. It was found that in ~40% cases, the code reported by the citizen and the photo were different. Significant filtration was needed to obtain data points which really fulfilled the scientific criteria for a research study (Figure 9B). In a similar citizen science project using FU index to measure water colour of Australian inland waters, Malthus et al. (2020) have reported difference of more than 2 FUI units between the observer data and the photo-based colour code in only 3% of the cases. Therefore, the reason for the larger bias in our case needs to be investigated. Further, we have only 17 months data from August 2019 to December 2020, out of which many months had <50 data points. This scanty data are insufficient to make any inference on the temporal fluctuations in water quality of the dynamic lake system, which is a limitation of the paper. In our experimental design, the photograph of the water along with the FU colour index provides another avenue for testing the quality of the colour scale reported by the citizen scientists. In the next step of the project, we plan to undertake a detailed comparison of the two, to establish deviations between the two, and propose improvements to the protocol, as needed.
Cost effectiveness of the citizen science activity (Table 3) shows that citizen science data has been acquired at virtually no cost, in comparison with the samplings conducted by scientists. This reiterates the need and relevance of citizen science programmes for regions where funding for scientific monitoring is low. Before the advent of citizen science, building a monitoring infrastructure and collecting time series data required a colossal pool of capital. The value of citizen science in meeting the objectives at a lower cost is well-recognised, with the European Commission dedicating several million euros to initiate citizen science work, through projects such as Citclops (Ceccaroni et al., 2020). Data collection in an aquatic environment is often tiresome and expensive. Modelled and satellite remote sensing data validated for time and space can supplement observational gaps in assessing water quality in aquatic environment (George, 2014). But in-situ observations are often insufficient to meet the scientific requirement for the validation processes also. Citizen science data carves out a separate niche for such observational lacunae in in-situ experiments which seems to be cost effective and feasible.
The model that is worth reproducing in this arena is the global citizen science network “eBird.” The provision of mobile application to enter information regarding birds has led to an exponential growth in citizen participation, leading to over 1 million observations of birds in India alone. But as correctly stated by Capdevila et al. (2020), water quality is an invisible subject, calling for specific equipment whose handling can be particularly challenging. Nevertheless, water is fundamental for life and has enormous impacts on health and well-being of the people. Therefore, monitoring the quality of the waterbody in your backyard and rejuvenating it oneself can be the biggest motivation for citizens to take up this programme and expand the network. Our experience shows that citizen science has a strong potential to address the lacunas in water quality research and address the SDG indicator 6.3.2 (UN Water, 2018). Encouraged by the success of the first phase of citizen science programme, we have taken steps to diversify the citizen science activities. Another mobile application on sanitation, “CLEANSE” is in the experimental stage. Step by step improvements in the reliability and utility of the apps, further studies including seasonal observations, calibration, and validation in different geographically homogeneous case studies using satellite sensor-derived water quality parameters are being conducted. Expertise of global scientists working in the field of water quality and human health is also being explored with the establishment of an open network called “ONWARD.” As an imminent outcome, we could provide a scientific correspondence to an anthropogenic event that occurred in the lake as a follow-up to this study (Menon et al., 2021). Further, our researchers in the team could come up with possible links which can be utilised for using such time-series datasets for identifying environmental reservoirs of cholera in a tropical lacustrine system such as the lake Vembanad (Racault et al., 2019; Anas et al., 2021).
To conclude, the quality of Vembanad Lake water is under pressure and a dedicated monitoring effort is needed to evaluate changes and detect rapid changes. A strong and constructive association of citizen science is required for further deliberations with support from the localities especially youngsters who are the backbone of the society. Working hand in hand with scientists, our network of citizens can help revive Vembanad Lake and potentially expand to a global network.
Data Availability Statement
The original contributions presented in the study are included in the article/Supplementary Materials, further inquiries can be directed to the corresponding author.
Author Contributions
GG implemented the programme, developed TurbAqua application, wrote, and revised MS. NNM analysed the data, wrote, and revised the MS. AA resource person for citizen science and edited the MS. SS and TP introduced the concept and supervised the activity. Revised the MS. RJWB developed the 3DMSD and edited the MS. AG, KGM, and SK co-ordination of citizen science workshop, storage and retrieval of data, and logistics for the programme. PP analysed the data and plotted the graphs. All authors contributed to the article and approved the submitted version.
Funding
This work was funded by REVIVAL; grant numbers NE/R003521/1 and DST/TM/INDO-UK/2K17/64 C & G.
Conflict of Interest
The authors declare that the research was conducted in the absence of any commercial or financial relationships that could be construed as a potential conflict of interest.
Acknowledgments
This paper is part of the Department of Science and Technology, India funded project REVIVAL (under Indo-UK water quality programme), under which regular water quality assessment of Vembanad Lake is being done since April 2018. The effort put by citizen scientists along the Vembanad Lake is acknowledged. The Agricultural Knowledge Management Unit, CMFRI and staff of Fisheries Resource Assessment Division, especially Mr. Manu V. facilitated the TurbAqua App development and data transmission and retrieval mechanisms. We want to thank the support received from staff and infrastructure of ICAR-CMFRI, NERCI, Kochi, CSIR-NIO, and PML for their facilitation, support, and encouragement. Thomas Brewin is thanked for his contributions to the design and manufacture of the mini-Secchi disks. This work is also a contribution to the ONWARD (Open Network for WAter-Related Diseases) project established with funding from the Global Challenges Research Fund (GCRF) of the United Kingdom Research and Innovation (UKRI). This paper is dedicated to the memory of Prof. Trevor Platt, our mentor and the brains behind REVIVAL, without whom this work would not have borne fruit.
Supplementary Material
The Supplementary Material for this article can be found online at: https://www.frontiersin.org/articles/10.3389/frwa.2021.662142/full#supplementary-material
References
Abbott, B. W., Moatar, F., Gauthier, O., Fovet, O., Antoine, V., and Ragueneau, O. (2018). Trends and seasonality of river nutrients in agricultural catchments: 18 years of weekly citizen science in France. Sci. Total Environ. 624, 845–858. doi: 10.1016/j.scitotenv.2017.12.176
Anas, A., Krishna, K., Vijayakumar, S., George, G., Menon, N., Kulk, G., et al. (2021). Dynamics of Vibrio cholerae in a typical tropical lake and estuarine system: potential of remote sensing for risk mapping. Remote Sens. 13:1034. doi: 10.3390/rs13051034
Anon (2012). Addendum to 2007 Anacostia River Sediment/TSS TMDL – Final Document Version: June 11, 2012. Available online at: https://mde.maryland.gov/programs/Water/TMDL/DocLibAnacostia/Anacostia_Appendix_E_061112_Final.pdf
Assumpção, T. H., Popescu, I., Jonoski, A., and Solomatine, D. P. (2018). Citizen observations contributing to flood modelling: opportunities and challenges. Hydrol. Earth Syst. Sci. 22, 1473–1489. doi: 10.5194/hess-22-1473-2018
Ballard, H. L., Dixon, C. G. H., and Harris, E. M. (2017). Youth-focused citizen science: examining the role of environmental science learning and agency for conservation. Biol. Conserv. 208, 65–75. doi: 10.1016/j.biocon.2016.05.024
Bear, M. (2016). Perspectives in marine citizen science. J. Microbiol. Biol. Educ. 17, 56–59. doi: 10.1128/jmbe.v17i1.1037
Belward, A., Bourassa, M., Dowell, M., Briggs, S., Dolman, H., Holmlund, K., et al. (2016). The Global Observing System for Climate: Implementation Needs. GCOS-200, 342.
Bonney, R., Ballard, H., Jordan, R., McCallie, E., Phillips, T., Shirk, J., et al. (2009). Public Participation in Scientific Research: Defining the Field and Science Education. A CAISE Inquiry Group Report. Available online at: http://www.informalscience.org/documents/PPSRreportFINAL.pdf
Boylen, C. W., Howe, E. A., Bartkowski, J. S., and Eichler, L. W. (2004). Augmentation of a long-term monitoring program for Lake George, NY by citizen volunteers. Lake Reserv. Manage. 20, 121–129. doi: 10.1080/07438140409354356
Brewin, R., Brewin, T., Phillips, J., Rose, S., Abdulaziz, A., Wimmer, W., et al. (2019). A printable device for measuring clarity and colour in lake and nearshore waters. Sensors 19:936. doi: 10.3390/s19040936
Bricaud, A., Babin, M., Morel, A., and Claustre, H. (1995). Variability in the chlorophyll-specific absorption coefficients of natural phytoplankton: analysis and parameterization. J. Geophys. Res. 100, 13321–13332. doi: 10.1029/95JC00463
Bricaud, A., Morel, A., and Prieur, L. (1981). Absorption by dissolved organic matter of the sea (yellow substance) in the UV and visible domains. Limnol. Oceanogr. 26, 43–53. doi: 10.4319/lo.1981.26.1.0043
Brouwer, S., van der Wielen, P., Schriks, M., Claassen, M., and Frijns, J. (2018). Public participation in science: the future and value of citizen science in the drinking water research. Water 10:284. doi: 10.3390/w10030284
Busch, J. A., Bardaji, R., Ceccaroni, L., Friedrichs, A., Piera, J., Simon, C., et al. (2016a). Citizen bio-optical observations from coast-and ocean and their compatibility with ocean colour satellite measurements. Remote Sens. 8:879. doi: 10.3390/rs8110879
Busch, J. A., Price, I., Jeansou, E., Zielinski, O., and van der Woerd, H. J. (2016b). Citizens and satellites: assessment of phytoplankton dynamics in a NW Mediterranean aquaculture zone. Int. J. Appl. Earth Observ. Geoinf. 47, 40–49. doi: 10.1016/j.jag.2015.11.017
Buytaert, W., Zulkafli, Z., Grainger, S., Acosta, L., Alemie, T. C., Bastiaensen, J., et al. (2014). Citizen science in hydrology and water resources: opportunities for knowledge generation, ecosystem service management, and sustainable development. Front. Earth Sci. 2:26. doi: 10.3389/feart.2014.00026
Capdevila, S. L. A., Kokimova, A., Sinha Ray, S., Avellán, T., Kim, J., and Kirschke, S. (2020). Success factors for citizen science projects in water quality monitoring. Sci. Total Environ. 728:137843. doi: 10.1016/j.scitotenv.2020.137843
Carlson, T., and Cohen, A. (2018). Linking community-based monitoring to water policy: perceptions of citizen scientists. J. Environ. Manag. 219, 168–177. doi: 10.1016/j.jenvman.2018.04.077
Carrion, D., Pessina, E., Biraghi, C. A., and Bratic, G. (2020). Crowdsourcing water quality with the simile app. Int. Arch. Photogramm. Remote Sens. Spatial Inf. Sci. 43, 245–251. doi: 10.5194/isprs-archives-XLIII-B4-2020-245-2020
Ceccaroni, L., Piera, J., Wernand, M. R., Zielinski, O., Busch, J. A., Van Der Woerd, H. J., et al. (2020). Citclops: a next-generation sensor system for the monitoring of natural waters and a citizens' observatory for the assessment of ecosystems' status. PLoS ONE 15:e0230084. doi: 10.1371/journal.pone.0230084
Chase, S. K., and Levine, A. (2017). Citizen science: exploring the potential of natural resource monitoring programs to influence environmental attitudes and behaviors. Conserv. Biol. 11:e12382. doi: 10.1111/conl.12382
Cox, T. E., Philippoff, J., Baumgartner, E., and Smith, C. M. (2012). Expert variability provides perspective on the strengths and weaknesses of citizen-driven intertidal monitoring program. Ecol. Appl. 22, 1201–1212. doi: 10.1890/11-1614.1
Domroese, M. C., and Johnson, E. A. (2017). Why watch bees? Motivations of citizen science volunteers in the Great Pollinator Project. Biol. Conserv. 208, 40–47. doi: 10.1016/j.biocon.2016.08.020
Earp, H. S., Vye, S. R., West, V., Grist, H., Lamont, P., Burrows, M., et al. (2018). Do you see what I see? Quantifying inter-observer variability in an intertidal disturbance experiment. Poster presented at YOUMARES 9, University of Oldenburg, Germany, 11–14 September 2018 (Oldenburg). doi: 10.13140/RG.2.2.16915.73761
Forel, F. A. (1890). Une nouvelle forme de la gamme de couleur pour l'étude de l'eau des lacs. Arch. Sci. Phys. Naturelles Soc. Phys. etd' Histoire Naturelle Genève 6:25.
Forrester, G., Baily, P., Conetta, D., Forrester, L., Kintzing, E., and Jarecki, L. (2015). Comparing monitoring data collected by volunteers and professionals shows that citizen scientists can detect long-term change on coral reefs. J. Nat. Conserv. 24, 1–9. doi: 10.1016/j.jnc.2015.01.002
Gao, M., Li, J., Zhang, F., Wang, S., Xie, Y., Yin, Z., et al. (2020). Measurement of water leaving reflectance using a digital camera based on multiple reflectance reference cards. Sensors 20:6580. doi: 10.3390/s20226580
Garaba, S. P., Friedrichs, A., Voß, D., and Zielinski, O. (2015). Classifying natural waters with the forel-ule colour index system: results, applications, correlations and crowdsourcing. Int. J. Environ. Res. Public Health 12, 16096–16109. doi: 10.3390/ijerph121215044
George, G. (2014). “Numerical modelling and satellite remote sensing as tools for research and management of marine fishery resources,” in Remote Sensing and Modelling: Advances in Coastal and Marine Resources. Coastal Research Library, Vol. 9 (Cham: Springer), 431–452. doi: 10.1007/978-3-319-06326-3_18
Giardino, C., Kõks, K. L., Bolpagni, R., Luciani, G., Candiani, G., Lehmann, M. K., et al. (2019). “The color of water from space: a case study for Italian lakes from Sentinel-2,” in Geospatial Analyses of Earth Observation (EO) Data, eds A. Pepe, and Q. Zhao (London: Intech Open), 1–14. doi: 10.5772/intechopen.86596
HLPF (2018). HLPF Review of SDG Implementation: SDG 6 – Ensure Availability and Sustainable Management of Water and Sanitation for All. Available online at: https://sustainabledevelopment.un.org/content/documents/195716.29_Formatted_2018_background_notes_SDG_6.pdf
Ho, S. Y., Xu, S. J., and Lee, F. W. (2020). Citizen science: an alternative way for water monitoring in Hong Kong. PLoS ONE 15:e0238349. doi: 10.1371/journal.pone.0238349
Hou, W., Lee, Z., and Weidemann, A. D. (2007). Why does the Secchi disk disappear? An imaging perspective. Opt. Express. 15, 2791–2802. doi: 10.1364/OE.15.002791
Hulbert, J. M. (2016). Citizen science tools available for ecological research in South Africa. S. Afr. J. Sci. 112, 1–2. doi: 10.17159/sajs.2016/a0152
Kishino, M., Takahashi, M., Okami, N., and Ichimura, S. (1985). Estimation of the spectral absorption coefficients of phytoplankton in the sea. Bull. Mar. Sci. 37, 634–642.
Kosmala, M., Wiggins, A., Swanson, A., and Simmons, B. (2016). Assessing data quality in citizen science. Front. Ecol. Environ. 14, 551–560. doi: 10.1002/fee.1436
Li, J., Wang, S., Wu, Y., Zhang, B., Chen, X., Zhang, F., et al. (2016). MODIS observations of water color of the largest 10 lakes in China between 2000 and 2012. Int. J. Digit. Earth 9, 788–805. doi: 10.1080/17538947.2016.1139637
Loperfido, J. V., Beyer, P., Just, C. L., and Schnoor, J. L. (2010). Uses and biases of volunteer water quality data. Environ. Sci. Technol. 44, 7193–7199. doi: 10.1021/es100164c
Lottig, N. R., Wagner, T., Norton Henry, E., Spence Cheruvelil, K., Webster, K. E., Downing, J. A., et al. (2014). Long-term citizen-collected data reveal geographical patterns and temporal trends in lake water clarity. PLoS ONE 9:e95769. doi: 10.1371/journal.pone.0095769
Malthus, T. J., Ohmsen, R., and Woerd, H. J. van der. (2020). An evaluation of citizen science smartphone apps for inland water quality assessment. Remote Sens. 12:1578. doi: 10.3390/rs12101578
Menon, N. N., George, G., Ranith, R., Sajin, V., Murali, S., Anas, A., et al. (2021). Citizen science tools reveal changes in estuarine water quality following demolition of buildings. Remote Sens. 13:1683. doi: 10.3390/rs13091683
Njue, N., Kroese, J. S., Gräf, J., Jacobs, S. R., Weeser, B., Breuer, L., et al. (2019). Citizen science in hydrological monitoring and ecosystem services management: state of the art and future prospects. Sci. Total. Environ. 693:133531. doi: 10.1016/j.scitotenv.2019.07.337
Oberoi, K., Purohit, S., Verma, P. A., Deshmukh, A., Saran, S., and Chauhan, P. (2018). Geospatial based citizen centric water quality measurement solution. Int. Arch. Photogramm. Remote Sens. Spatial Inf. Sci. XLII-5, 75–78. doi: 10.5194/isprs-archives-XLII-5-75-2018
Ouma, Y. O., Waga, J., Okech, M., Lavisa, O., and Mbuthia, D. (2018). Estimation of reservoir bio-optical water quality parameters using smartphone sensor apps and Landsat ETM+: review and comparative experimental results. J. Sens. 2018:3490757. doi: 10.1155/2018/3490757
Preisendorfer, R. W. (1986). Secchi disk science: visual optics of natural waters. Limnol. Oceanogr. 31, 909–926. doi: 10.4319/lo.1986.31.5.0909
Prieur, L., and Sathyendranath, S. (1981). An optical classification of coastal and oceanic waters based on the specific spectral absorption curves of phytoplankton pigments, dissolved organic matter, and other particulate materials. Limnol. Oceanogr. 26, 671–689. doi: 10.4319/lo.1981.26.4.0671
Quinlivan, L., Chapman, D. V., and Sullivan, T. (2020). Validating citizen science monitoring of ambient water quality for the United Nations sustainable development goals. Sci. Total Environ. 699:134255. doi: 10.1016/j.scitotenv.2019.134255
Racault, M.-F., Abdulaziz, A., George, G., Menon, N., Jasmin, C., Minu, P., et al. (2019). Environmental reservoirs of vibrio cholerae: challenges and opportunities for ocean-colour remote sensing. Remote Sens. 11, 1–27. doi: 10.3390/rs11232763
Sathyendranath, S., Abdulaziz, A., Menon, N., George, G., Evers-King, H., Kulk, G., et al. (2020). “Building capacity and resilience against diseases transmitted via water under climate perturbations and extreme weather stress,” in Space Capacity Building in the XXI Century, ed S. Ferretti (Cham: Springer International Publishing), 281–298. doi: 10.1007/978-3-030-21938-3_24
Schläppy, M. L., Loder, J., Salmond, J., Lea, A., Dean, A. J., and Roelfsema, C. M. (2017). Making waves: marine citizen science for impact. Front. Mar. Sci. 4:146. doi: 10.3389/fmars.2017.00146
Seafarers, S. D., Lavender, S., Beaugrand, G., Outram, N., Barlow, N., Crotty, D., et al. (2017). Seafarer citizen scientist ocean transparency data as a resource for phytoplankton and climate research. PLoS ONE 12:e0186092. doi: 10.1371/journal.pone.0186092
Secchi, P. A. (1885). “Relazionedelleesperienzefatte a bordodellapontificiapirocorvetta Imacolata Concezione per determinare la trasparenzadel mare,” in Il Nuovo Cimento Giornale de Fisica, Chimica e Storia Naturale, Vol. 20 (Berlin: Springer), 205–237. doi: 10.1007/BF02726911
Suman, V. (2017). Role of Citizen Science in Ecological Restoration. Available online at: https://cuesonline.org/2017/12/26/role-of-citizen-science-in-ecological-restoration/ (accessed January 21, 2021).
Thiel, M., Penna-Díaz, M. A., Luna-Jorquera, G., Salas, S., Sellanes, J., and Stotz, W. (2014). Citizen scientists and marine research: volunteer participants, their contributions, and projection for the future. Oceanogr. Marine Biol. Annu. Rev. 52, 257–314. doi: 10.1201/b17143-6
Ule, W. (1892). “Die bestimmung der Wasserfarbe in den Seen in Kleinere Mittheilungen,” in Dr. A. Petermanns Mittheilungenaus Justus Perthesgeographischer Anstalt Justus Perthes (Gotha), 70–71.
UN Water (2017). UN Revised List of Global Sustainable Development Goal Indicators. Report of the Inter-Agency and Expert Group on Sustainable Development Goal Indicators (E/CN.3/2017/2), Annex III. United Nations, New York, NY. Available online at: https://unstats.un.org/sdgs/indicators/Official%20Revised%20List%20of%20global%20SDG%20indicators.pdf (accessed December 28, 2020).
UN Water (2018). UN Water Progress on Ambient Water Quality. Piloting the Monitoring Methodology and Initial Findings for SDG Indicator 6.3.2. Available online at: https://www.unwater.org/publications/progress-on-ambient-water-quality-632/(2018) (accessed January 4, 2021).
Van der Woerd, H., and Wernand, M. (2015). True colour classification of natural waters with medium-spectral resolution satellites: SeaWiFS, MODIS, MERIS and OLCI. Sensors 15, 25663–25680. doi: 10.3390/s151025663
Walker, D., Forsythe, N., Parkin, G., and Gowing, J. (2016). Filling the observational void: scientific value and quantitative validation of hydrometeorological data from a community-based monitoring programme. J. Hydrol. 538, 713–725. doi: 10.1016/j.jhydrol.2016.04.062
Weeser, B., Stenfert Kroese, J., Jacobs, S. R., Njue, N., Kemboi, Z., Ran, A., et al. (2018). Citizen science pioneers in Kenya – a crowdsourced approach for hydrological monitoring. Sci. Total Environ. 631–632, 1590–1599. doi: 10.1016/j.scitotenv.2018.03.130
Wernand, M. R. (2010). On the history of the Secchi disc. J. Eur. Opt. Soc. Rapid Publ. 5:10013s. doi: 10.2971/jeos.2010.10013s
Keywords: citizen science, mini Secchi disk, TurbAqua, Vembanad lake, FU scale, turbidity
Citation: George G, Menon NN, Abdulaziz A, Brewin RJW, Pranav P, Gopalakrishnan A, Mini KG, Kuriakose S, Sathyendranath S and Platt T (2021) Citizen Scientists Contribute to Real-Time Monitoring of Lake Water Quality Using 3D Printed Mini Secchi Disks. Front. Water 3:662142. doi: 10.3389/frwa.2021.662142
Received: 10 February 2021; Accepted: 09 April 2021;
Published: 12 May 2021.
Edited by:
Alex de Sherbinin, Columbia University, United StatesReviewed by:
Junsheng Li, Chinese Academy of Sciences (CAS), ChinaUlrich Ofterdinger, Queen's University Belfast, United Kingdom
Copyright © 2021 George, Menon, Abdulaziz, Brewin, Pranav, Gopalakrishnan, Mini, Kuriakose, Sathyendranath and Platt. This is an open-access article distributed under the terms of the Creative Commons Attribution License (CC BY). The use, distribution or reproduction in other forums is permitted, provided the original author(s) and the copyright owner(s) are credited and that the original publication in this journal is cited, in accordance with accepted academic practice. No use, distribution or reproduction is permitted which does not comply with these terms.
*Correspondence: Nandini N. Menon, bWVub25uYW5kaW5pLm5AZ21haWwuY29t