 Kieran Khamis1,2*†
 Phillip J. Blaen1,2,3†Sophie Comer-Warner1
 David M. Hannah1A. Rob MacKenzie1,2
 Stefan Krause1,2
- 1School of Geography, Earth and Environmental Sciences, University of Birmingham, Birmingham, United Kingdom
- 2Birmingham Institute of Forest Research, University of Birmingham, Birmingham, United Kingdom
- 3Yorkshire Water, Leeds, United Kingdom
The uptake of aquatic nutrients can represent a major pathway for their removal from river ecosystems and is a key control on nitrogen and carbon export from watersheds. Our understanding of temporal variability in nutrient mass balance is incomplete as conventional methods for estimating uptake rates are suited to low-frequency analysis. Here, we utilised hourly streamflow, nitrate (-N) and dissolved organic carbon (DOC) to generate near-continuous estimates of nutrient uptake along a 1 km reach in a headwater catchment with a history of agricultural activity. We identified variability in nutrient mass balance at multiple frequencies. Over seasonal timescales, a shift from nitrate release during spring to uptake during autumn was apparent. In contrast, consistent uptake of DOC was observed across the whole monitoring period (i.e., spring—autumn). Both DOC and nitrate uptake were related significantly to environmental variables (river discharge) and antecedent discharge conditions. DOC:nitrate stoichiometry appeared to be a key control on nitrate uptake rates, yet this coupling weakened from summer to autumn as DOC became more abundant and physical controls become more important. Daily cycles in nutrient uptake were evident and at times the investigated reach acted as a net sink of DOC during the day and a source at night. Short-term impacts of storm events on uptake rates varied seasonally but no consistent changes were observed between pre- and post-event conditions, suggesting aquatic communities were resilient to short-term flow disturbances. For the duration of our study, the reach acted as net sink from the water for DOC (−1.7% of upstream flux) and a net source for nitrate (+2.6%). Even during autumn, when uptake was greatest, mass removal represented <3% of nitrate exported downstream. Our results facilitate new insights into multi-timescale patterns and drivers of stream ecosystem processes, which are essential for developing effective catchment-scale management strategies.
Introduction
Nutrient inputs into terrestrial ecosystems have increased in many regions of the world in recent decades as a consequence of direct and deliberate human activities such as fertiliser application and the burning of fossil fuels, as well as inadvertent remobilisation as a result of land-use change (He et al., 2011; Beusen et al., 2016; Goyenola et al., 2020). Large quantities of nutrients, including nitrogen, carbon, and phosphorous, continue to be exported from terrestrial environments to river corridors that transport them further downstream. Over the course of their passage through fluvial networks, nutrients may be removed, on either a temporary or permanent basis, from the water column by a range of processes including biotic assimilation, denitrification, sorption, and photodegradation (Battin et al., 2008; Hood et al., 2015; Wollheim et al., 2015). In a Lagrangian frame, the relative impact of these individual processes for aquatic nutrient loads varies according to the biogeochemical conditions and residence (reaction) times a parcel of water is exposed to during transport from the source to the sea. For example, photodegradation of dissolved organic carbon (DOC) occurs primarily in shallow, clear, unshaded headwaters (Cory et al., 2014), while flocculation and sedimentation are more likely to dominate in turbid, deep, and slow flowing lowland rivers (Battin et al., 2008; Jones et al., 2016). Modelling studies suggest that up to 45% of DOC and 54% of nitrogen (N) inputs may be removed from the water column within river corridors (Beusen et al., 2016; Mineau et al., 2016), with the highest rates of removal often found in headwaters (Peterson et al., 2001) or in narrow catchments (Helton et al., 2018). As such, instream retention and transformation represent major controls on both aquatic export of nutrients and greenhouse gas evasion from inland waters at the landscape scale (Mulholland et al., 2008; Raymond et al., 2013).
In addition to spatial differences in the relative importance of different nutrient uptake processes across river catchments, it is also plausible that the drivers of uptake will vary over multiple time scales, for example during baseflow and stormflow elements of the hydrograph (see below), and between seasons. Yet only a few studies have directly explored the short-term temporal dynamics of nutrient uptake rates over extended periods (Rode et al., 2016; Preiner et al., 2020). This knowledge gap results largely from limitations of conventional observation methods for estimating nutrient uptake rates that do not enable continuous measurements. Hence, most of our understanding of the spatial-temporal variability and controls on nutrient uptake come from experimental field additions of labile tracers or stable isotopes (Catalán et al., 2018; Tank et al., 2018), which are generally limited to steady-state conditions, however see Covino et al. (2010) for a method to overcome this limitation. Despite this, field additions have identified key drivers of nutrient removal from rivers over continental scales and across biomes, with riparian land cover, nutrient concentrations and more recently nutrient stoichiometry having the strongest correlations (Mulholland et al., 2008; Wymore et al., 2016; Tank et al., 2018). In particular, the molar ratio of DOC: nitrate has been highlighted as a primary control on the potential for microbial denitrification, nitrification or assimilation of N (Taylor and Townsend, 2010; Helton et al., 2015). However, the coupling between the molar ratio of DOC: nitrate and N uptake across the annual hydrograph has yet to be fully explored (Heppell et al., 2017).
Our understanding of the temporal dynamics of nutrient mass balance remains limited, particularly over medium-short term (i.e., seasonal to sub-daily) timescales, when many environmental variables likely to influence nutrient uptake, such as streamflow, nutrient concentration, and light availability, can exhibit highly dynamic behaviour (Bowes et al., 2009; Krause et al., 2015; Blaen et al., 2016). For example, there has been debate regarding the role transport processes play in regulating nutrient retention at the reach scale, specifically the importance of medium to short-term variability in residence time. Seybold and McGlynn (2018) suggested nutrient concentration rather than residence time is the key control on uptake, while Ward et al. (2019) suggested that storage age rather than residence time dictates transformation potential. Hence, given the importance of instream uptake for regulating downstream nutrient fluxes (Hood et al., 2015; Jarvie et al., 2018), further insights into seasonal to sub-daily dynamics and drivers of nutrient uptake are required to develop management strategies to mitigate nutrient loading of aquatic ecosystems. This need is especially pressing for headwater streams given their cumulative potential to influence the integrity of downstream waters (Bishop et al., 2008; Mulholland et al., 2008; Heathwaite, 2010).
Recent developments in optical sensor technologies, particularly the reduction in cost and increased reliability of ultra-violet light-emitting diodes (UV LEDs), have increased the availability of sensors that enable continuous in situ nutrient measurements (Ruhala and Zarnetske, 2017; Khamis et al., 2018). With careful site-specific calibration, optical nutrient sensors can provide reliable estimates of concentration at frequencies that cannot be sustained using manual sampling and laboratory analysis techniques (Blaen et al., 2016). High-frequency time series data can be used to estimate continuous rates of instream nutrient uptake (Heffernan and Cohen, 2010; Rode et al., 2016; Kunz et al., 2017) and export (Shogren et al., 2020). For example, Heffernan and Cohen (2010) used data from a single sensor in a spring-fed river with relatively stable flow conditions to estimate assimilatory nitrogen demand from diel variation in time series data over periods of 1–4 weeks. More recently, Kunz et al. (2017) extended this methodology using paired sensors to take into account temporal variability in streamflow and ambient nutrient concentrations. High-frequency nutrient measurements therefore represent a potentially valuable tool to explore the temporal dynamics and drivers of nutrient uptake and release.
To provide a better understanding of how aquatic nutrient mass balance varies over a range of temporal scales (using high-frequency, optical, in situ sensors), and how uptake and release rates are influenced by co-varying environmental conditions, we investigated nutrient dynamics over three periods (each of ~60 days duration) spanning an 11-month study period in a headwater agricultural stream. We selected the study site, Wood Brook at the Birmingham Institute of Forest Research, as we have a good understanding of hydrology and nutrient transport processes (see Blaen et al., 2017) in particularly we knew that both nitrate and DOC displayed dynamic behaviour that varied seasonally and in response to meteorological drivers. Our specific objectives were to: (i) quantify nitrogen (as -N) and carbon (as DOC) uptake and release dynamics over a range of temporal scales (seasonal, diel, episodic); (ii) identify the key environmental drivers of variability in daily nutrient uptake and release rates at annual and seasonal scales; and (iii) characterise the short-term impacts of storm events on nutrient mass balance. Our results provide new insights into the scaling of temporal variability of nutrient processing dynamics over hourly, daily, and seasonal timescales, and inform practical decisions concerning the relative value of real-time monitoring under different environmental conditions.
Methods
Study Site Description
Experimental observations of this study were conducted at the Wood Brook at the Birmingham Institute of Forest Research (www.birmingham.ac.uk/bifor) field site in Staffordshire, UK, between December 2016 and November 2017 (Figure 1). The second-order stream drains a 3.1 km2 catchment characterised by a mixture of arable farmland and young (trees planted as “whips” in 2014) and mature (ages >100 year-old) mostly deciduous woodland. The catchment is underlain by Permotriassic sandstone with superficial deposits of glacial till up to 10 m thick and organic rich, sandy clay top soils between 0.15 and 0.6 m thick (Blaen et al., 2017).
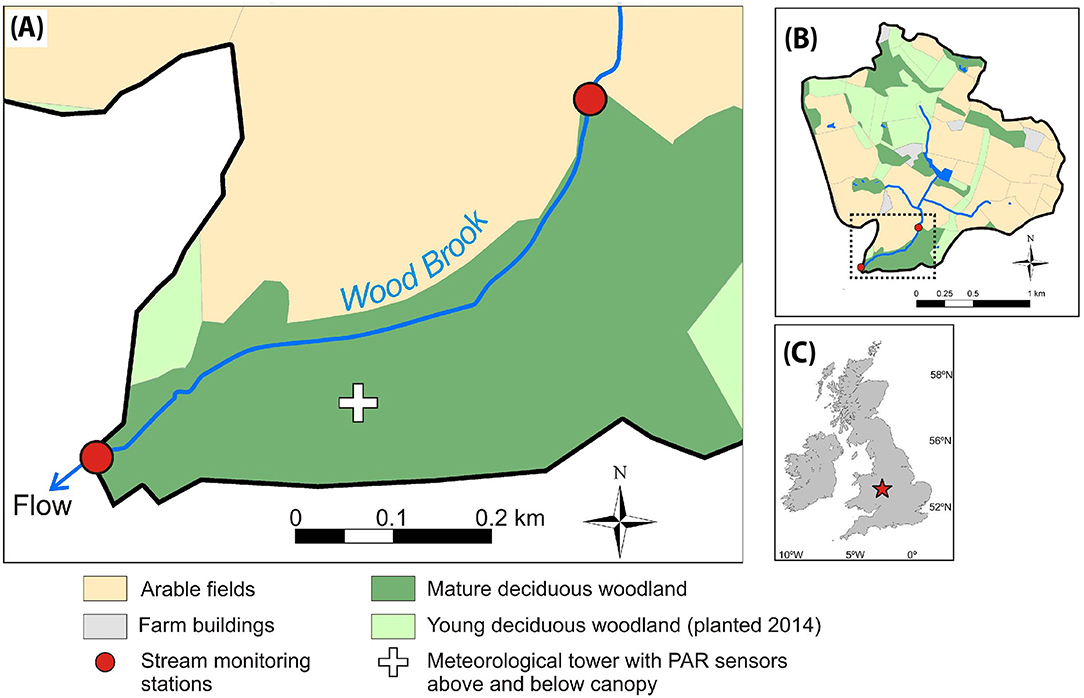
Figure 1. Map of monitoring location showing (A) the study reach, (B) the stream catchment, and (C) location of the site in the UK.
A 1000 m study reach was established in an area of mature deciduous woodland upstream of the outflow of the catchment (Figure 1). The woodland is dominated by English oak (Quercus robur) with an understory of coppice hazel (Corylus avellana), hawthorn (Crataegus spp.), and sycamore (Acer pseudoplatanus). Common alder (Alnus glutinosa), goat willow (Salix caprea), and wych elm (Ulmus glabra) are also present adjacent to the stream (Hart et al., 2020). Dense canopy cover resulted in intensive shading throughout the reach during periods of full leaf-out (April to October; Day of year [DOY] ~90–300). The land cover of the contributing catchment at the lower end of the reach consisted of 19.3% broadleaf woodland, 45.4% arable farmland, and 33.0% improved grassland. While the lower end of the reach consisted of 15.4% broadleaf woodland, 47.2% arable farmland, and 35.3% improved grassland.
The study reach is characterised by steep incised banks for the majority of its length. Under baseflow conditions, the mean stream width along the reach is 1.6 m and the median travel time (derived from conservative solute tracer tests; Supplementary Figure 1) was 2 h. The streambed sediments are dominated by fine silt up to 0.8 m deep in the upper half of the study reach, and coarser sands and gravels up to 0.3 m deep further downstream. Consistent with the geology of the area, streambed core samples indicated the presence of an underlying clay layer throughout the study reach (except for one location where an outcrop of red sandstone was observed) and as such stream losses to groundwater were expected to be minimal. Similarly, substantial groundwater inflows were unlikely because the local water table was several metres below the streambed (Blaen et al., 2017). See Supplementary Figure 2 for further details.
Environmental Monitoring
Stream monitoring stations were established 1000 m apart, at the upper and lower ends of the study reach (Figure 1). The downstream station was operated for the full duration of the study and was equipped with a pressure transducer (Adcon, Austria) for water depth measurements and a Manta 2 multi-probe (Eureka, TX, USA). The Manta 2 housed sensors for measurement of water temperature, electrical conductivity, pH, and dissolved oxygen (DO). A stage-discharge relationship (R2 = 0.88; Supplementary Figure 3) was established from salt dilution gauging measurements (Hudson and Fraser, 2005; Blaen et al., 2017). The upstream station was operated over three periods in 2017 during spring (DOY 74–123), summer (DOY 146–200), and autumn (DOY 259–306). During these periods, OPUS UV spectral sensors (TriOS GmbH, Germany) for measurement of -N and DOC concentrations were deployed at both upstream and downstream stations. Discharge was not measured continuously at the upstream station. However, repeated dilution gauging measurements over a range of flow conditions through the study period showed that discharge at the upstream station could be predicted reliably from the discharge time series at the downstream station (see Supplementary Figure 4 for details).
Due to shallow water depth for much of the study period the sensors could not be reliably submerged in the river channel. To overcome this problem all sensors (except the pressure transducer) were housed in insulated kiosks 1 m from the stream bank. At both the upstream and downstream stations, 1 L of water was pumped every hour from intake points in the thalweg of the stream using ISCO 3710 automatic samplers (Lincoln, NE, USA). Water was passed through silicone tubing to flow cells containing the water quality sensors. The intakes were covered with coarse (1 mm) nylon mesh to reduce damage to the pump tubing from large particulates. Sensors remained wet between sample readings, and the volume of the tubing and flow cells was <15% that of the pumping volume (i.e., flow cells were purged sufficiently on each sampling occasion). Instruments were programmed to acquire sample readings 3 min after the completion of each pumping cycle. Data at the upstream station were stored locally on a CR1000 datalogger (Campbell Scientific, Loughborough, UK). Records from the downstream station were uploaded every 3 h via a telemetry system to an internet server.
Sensors were cleaned weekly using acetone on optical detection windows and a mild detergent on other components. Pump tubing was flushed on each cleaning occasion with 10% HCl to inhibit biofilm development. In addition to the manual cleaning regime, the Manta 2 probe had an automatic wiper that cleaned all sensors every hour. Sensors within the Manta 2 were calibrated every 2 months. The OPUS UV spectral sensors were cross-calibrated in the laboratory at the beginning and middle of the study period, and measurements exhibited strong linear relationships over a range of -N (R2 = 0.997) and DOC (R2 = 0.993) concentrations. The downstream OPUS UV spectral sensor was also calibrated against laboratory reference samples following Blaen et al. (2017). The Limit of detection (i.e., 3 SD of lowest concentration standard) was 0.31 and 0.03 mg L for DOC and nitrate, respectively. Previous studies, both in this catchment and elsewhere, have demonstrated these instruments show close agreement with reference samples analysed in the laboratory and produce stable measurements during long-term deployments (Rode et al., 2016; Blaen et al., 2017). In addition, soil porewater samples (n = 6) were collected from shallow piezometers adjacent to the stream channel throughout the study period and analysed for -N and DOC in the laboratory following standard methods as detailed in Blaen et al. (2017).
In addition to the stream monitoring stations, 102 towers, each ~25 m high, have been established in the woodland immediately adjacent to Wood Brook, to support a Free-Air Carbon Enrichment (FACE) facility (BIFoR FACE; Hart et al., 2020). On one of these towers, ~100 m from the study reach (Figure 1), LI-190R (LI-COR, NE, USA) photosynthetically active radiation (PAR) sensors were installed at 10 m (below the main oak canopy and above the hazel coppice canopy) and at 25 m (just above oak canopy) height. PAR measurements were acquired at 15 s resolution and 1 min average values were recorded to a CR1000 datalogger to provide a relative comparison of light availability above and below the canopy.
Data Analysis
Storm Event Hydrograph Delineation
Storm events were delineated from the discharge time series using the R package hydromad. A three pass recursive digital filter with a constant of 0.96 was used to separate the baseflow and event flow components of the hydrograph (Nathan and McMahon, 1990). Storm events were defined initially as periods when total stream discharge exceeded the baseflow component by 5 L s−1. Previous studies have shown that storm events can induce large changes in solute concentrations over a short time period (Blaen et al., 2017). Therefore, each event was extended by 2 h at the beginning and 12 h at the end to ensure that these potential changes were well-characterised within each event time window.
Nutrient Uptake
Paired nutrient sensor data were used to calculate within-reach mass balance for -N and DOC following the approach outlined by Kunz et al. (2017). For each hourly time step (t), the change in solute mass flux was calculated between the upstream (US) and downstream (DS) stations. Travel time (τ) between the stations was calculated as a function of discharge at the downstream station (Q) derived from conservative solute tracer tests conducted in 2016 and 2017 over a range of flow conditions (see Supplementary Figure 4). Lateral (QL) discharge to the stream reach was calculated as the mean instantaneous difference between upstream and downstream discharge, with associated lateral solute concentrations as determined by median values from riparian porewater samples (-N = 0.01 mg L−1, DOC = 21.97 mg L−1). We note that that it is impossible to account for all potential heterogeneity in the nutrient composition of inflows to the reach, particularly as these are likely to vary during storm events. Net changes in loads were divided by the constant benthic surface area (w x L) of the study reach to calculate hourly mass balance (UT) in units of g -N m−2 d−1 and g DOC m−2 d−1 following Equation (1):
where Sol is the concentration of solute of interest at each time step (i.e., g -N L−1 or g DOC L−1). Positive values of UT indicate net release of the target nutrient from the study reach along the study reach (i.e., nutrient enrichment of the water column), while negative values reflect net uptake (i.e., nutrient removal from the water column). It should be noted that we use uptake as a catch-all term to describe the removal of nutrients by biological or physical processes. Due to strong diel variability in discharge at the study site (baseflow median diel variability = 16.9%) we were unable to reliably calculate stream metabolism as all current models for the single station approach assume steady state conditions (Payn et al., 2017).
Identification of Seasonal Drivers of Nutrient Uptake
To identify the key seasonal drivers of net nutrient uptake and release we adopted a regression modelling framework similar to that outlined in Blaen et al. (2017) using a suite of variables considered likely to provide explanatory and predictive capacity for changes in net nutrient uptake (Table 1). Additional variables were calculated to characterise antecedent flow conditions, based on the premise that past disturbances associated with high flow events could have lasting effects on instream biological communities (Poff et al., 1997; Uehlinger et al., 2003). Analysis was undertaken using daily mean data with high flow periods omitted (i.e., analysis was limited to baseflow conditions) because it is very unlikely that the dominant drivers of uptake dynamics during storm events would be the same as those under baseflow conditions. Prior to regression analysis, the explanatory dataset was screened for collinearity (Supplementary Figure 5) and variables with correlation coefficients >0.7 or variance inflation factors >3 were removed (Zuur et al., 2010). To improve the interpretability of regression coefficients, all predictor variables were standardised (z-scores) to ensure that beta coefficients could be interpreted as effect sizes (Schielzeth, 2010). For both N and C uptake, we created a global regression model which included all predictor variables outlined in Table 1 as fixed effects (e.g., those retained after the initial screening and deemed to be first order controls on uptake rates). All possible subset models of the global model were fitted using ordinary least squares regression and ranked based on AICc values (Akaike information criterion corrected for small sample size). When a best model (Akaike weight, wi, of top model >0.9) was not identified, model averaging was conducted. Model-averaged regression coefficients were calculated for all explanatory variables retained in the model set and averages calculated then weighted by wi (Burnham and Anderson, 2003). As it is likely that the key drivers of nutrient uptake and release will vary seasonally, we also ran the modelling procedure outlined above for spring, summer and autumn independently. For each model, residuals were inspected for normality and homogeneity of variance; no violations of assumptions were detected.
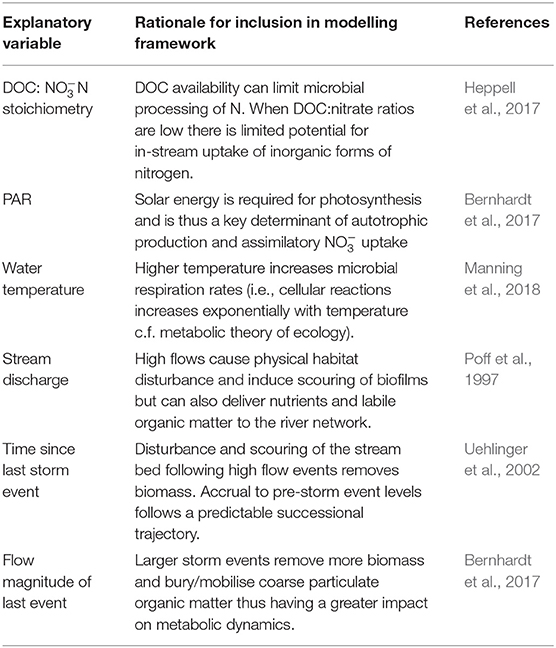
Table 1. Explanatory variables retained for the final model selection process with rationale for their inclusion.
Effects of Storms on Nutrient Uptake Dynamics
Storm events are often characterised by rapid downstream transport of water and solutes with limited opportunities for instream processing (Raymond et al., 2016), particularly in low order streams and during high magnitude storm events (Wollheim et al., 2017, 2018). However, much less is understood of the longer post-event effects of storms on nutrient mass balance dynamics. Therefore, we focused on periods immediately following each event once stream discharge had returned to baseflow conditions, which we assumed would provide more informative insights into the effects of storms on nutrient mass balance than focusing on dynamics during storm events. One storm event period was selected for each season (i.e., spring, summer, autumn) to examine short-term (sub-daily) effects of storm events on net nutrient uptake rates. Storm event periods were selected to provide a representative example of hydrological conditions for each season, based on observations made during this study and also from the previous year as reported by Blaen et al. (2017). Details on each event period are presented in Supplementary Figure 6. To minimise the lasting influence of previous storms on our interpretation of the results, we ensured that each selected event was preceded by baseflow conditions for >5 days. Three-hour mean values of -N and DOC mass balance were calculated around set time points post-event (i.e., after the end of each storm event window). These values were compared to those for the same times of day preceding each event to assess whether storm events induced consistent short-term changes in net nutrient uptake/release dynamics (i.e., suppression or enhancement of uptake).
Results
Temporal Variability in Stream Discharge and Environmental Variables
The median stream discharge over the 11 month monitoring period was 8.6 L s−1 (Table 2). Streamflow was highest in early 2017, declined through summer months, and then increased slightly again in autumn (Figure 2). A total of 44 storm events were delineated from the hydrograph. These were distributed relatively evenly over the monitoring period, with the largest flow events observed in winter and early spring. Low amplitude diel cycles in streamflow were observed under baseflow conditions (e.g., July 2017), but were not apparent under event flow conditions (Figure 2). Diel flow variation under baseflow conditions (median 16.9%) was substantially lower than during storm flow periods (34.5%).
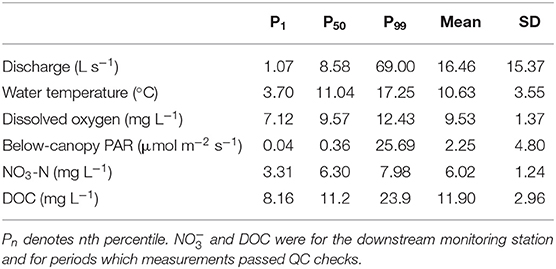
Table 2. Summary statistics for nutrients and their explanatory variables across the entire monitoring period.
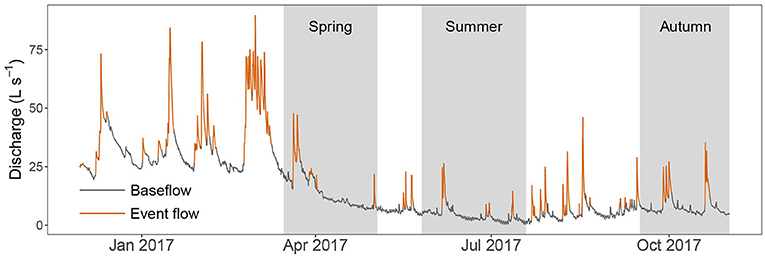
Figure 2. Discharge (hourly time step) of the study stream throughout the monitoring period. Baseflow and event flows are denoted by grey and orange lines, respectively. Grey bars show periods when nutrient sensors were deployed.
Water temperature and DO both exhibited strong seasonal and diel patterns (Figures 3A–C). On a seasonal basis, water temperature was lowest in winter and highest in summer, while DO followed a less pronounced inverse pattern. At the diel scale, water temperature typically peaked in mid-afternoon (1500 h local time), while the highest mean PAR and DO values occurred at 1200 and 1230 h, respectively. The magnitude of the diel variability in DO was consistent for most of the monitoring period, although a marked increase in diel range was observed for ~6 weeks between late March and early May (Figures 3B,C). Rapid changes in discharge (i.e., storm events) had little influence on water temperature, but were associated with short-term (hours to days) reductions in DO concentration and a dampening of the diel DO signal.
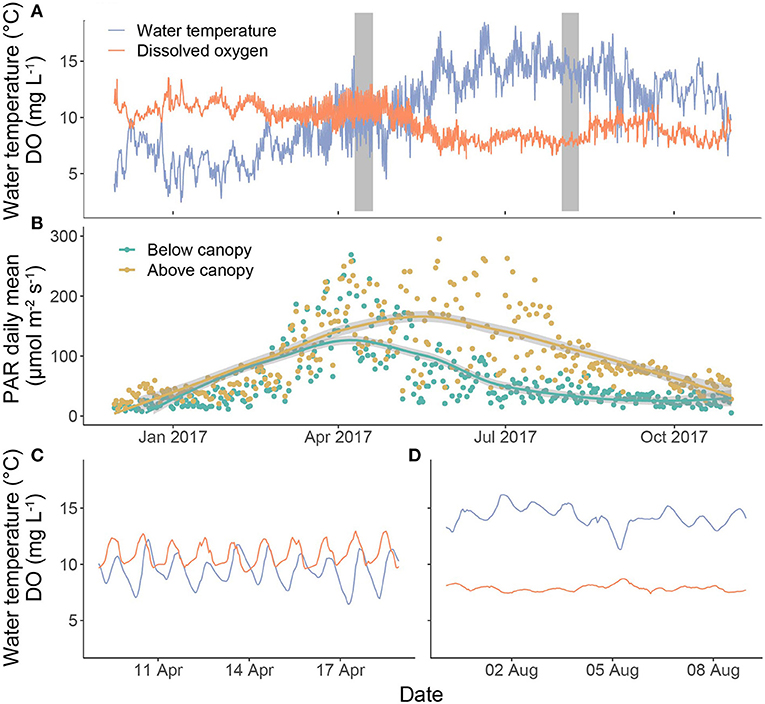
Figure 3. Time series of (A) hourly water temperature and dissolved oxygen (DO) across the study period, (B) daily means of photosynthetically active radiation (PAR) above and below the canopy. Fitted lines are LOESS smoothers (span = 0.8). Grey bars in (A) highlight the periods selected as examples of spring (C) and summer (D) diel patterns in DO and water temperature.
Daily PAR values below the canopy were lowest in winter, peaked in early spring with leaf-out of the main oak canopy, declined until late summer (August) and then remained low for the rest of the monitoring period (Figure 3D). In contrast, daily PAR values above the canopy followed a similar trend during winter and spring, but then continued to rise to a peak in June, before declining throughout late summer and autumn.
Temporal Variability in Nutrient Uptake Dynamics
Across the whole monitoring period, mean -N concentrations at the upstream and downstream stations were 6.2 ± 1.2 and 6.0 ± 1.2 mg L−1, respectively, and followed similar temporal trends at both stations. -N concentrations were highest in spring and declined through the monitoring period (Figure 4). On a seasonal basis, -N concentrations were higher at the upstream station compared to the downstream station in summer (median values 6.3 and 6.2 mg -N L−1, respectively) and autumn (median values 5.1 and 4.4 mg -N L−1, respectively), but not in spring (median values 7.2 and 7.2 mg -N L−1, respectively). Diel fluctuations in -N concentrations were relatively weak and changes in concentrations were not associated with changes in discharge (see Supplementary Figure 7). Storm events induced rapid changes in -N concentrations, with the majority of storms associated with a short-term decrease in -N concentration followed typically by a recovery to pre-event concentrations within 1–3 days.
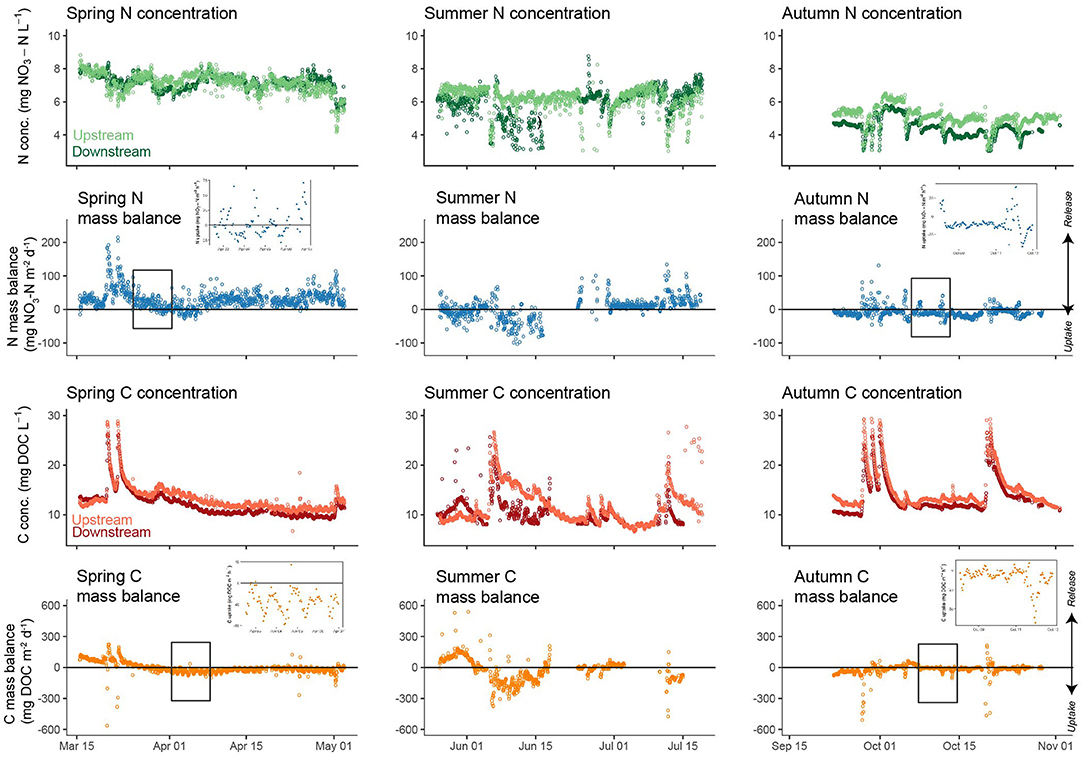
Figure 4. Hourly -N and DOC concentration and mass balance dynamics in spring, summer, and autumn. Inset graphs provide detailed views of diel dynamics. Values of nutrient mass balance <0 indicate net removal from the water column.
The mass balance for -N during spring was mostly positive (mean = +8.2%), indicating in stream release of -N along the study reach (Figure 4; Table 3). During summer net release of -N was lower than in spring (+0.6%) and shifted to net uptake across the reach during autumn (−2.6%). Storm events induced increases in release of -N during all seasons relative to baseflow conditions, albeit with considerable variability (Figure 5). Some evidence of diel fluctuations in -N uptake was observed in spring (Figures 4, 6), with increased uptake apparent in the late afternoon, although this was not as pronounced as for DOC.
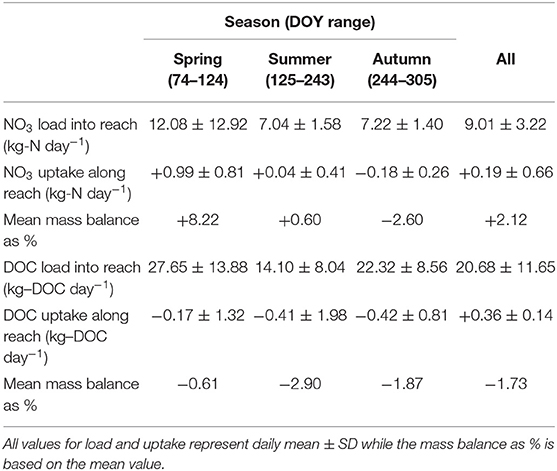
Table 3. Seasonal patterns in daily NO3-N and DOC load to the study reach and removal/release rates along the reach.
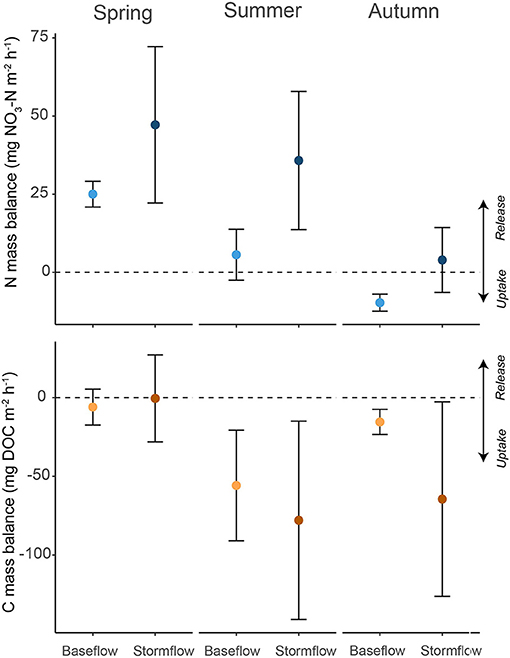
Figure 5. Seasonal mean (±95% CI) measurements of daily mean mass balance for -N and DOC. Data are separated by season and flow condition (i.e., baseflow and event flow).
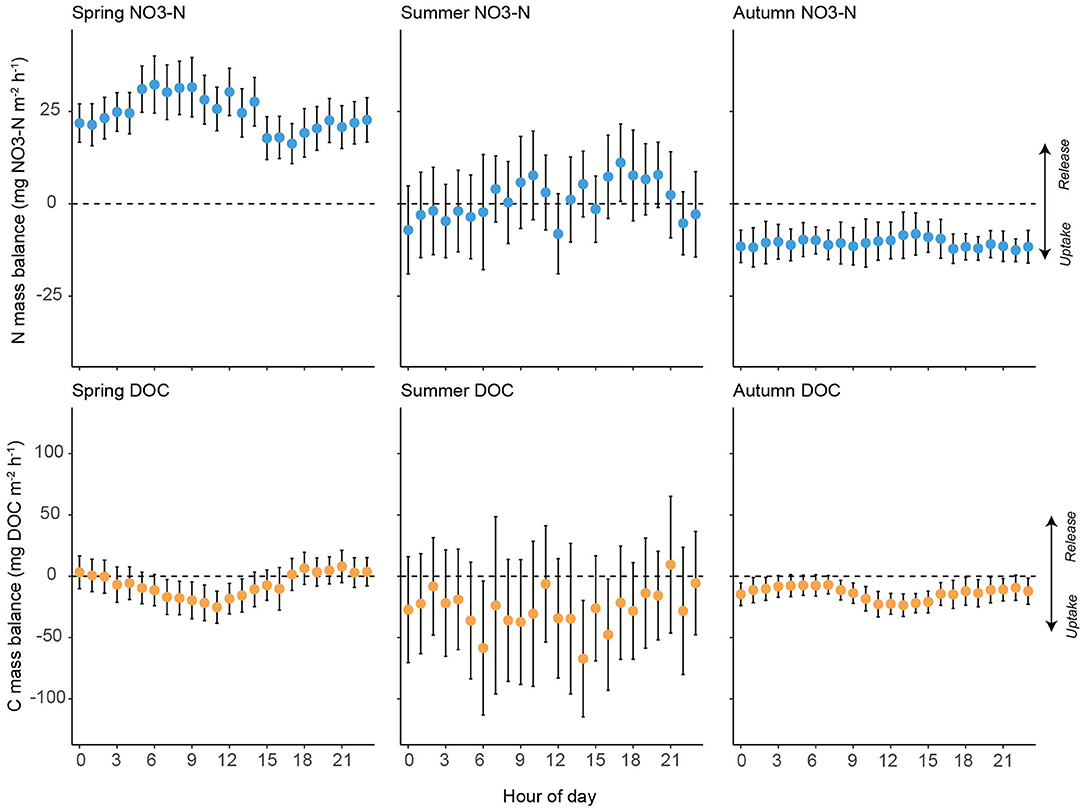
Figure 6. Hourly mean (± 95% CI) measurements for -N and DOC mass balance during spring (n = 900 for -N and 903 for DOC), summer (n = 692 for -N and 618 for DOC) and autumn (n = 659 for -N and 658 for DOC).
Mean DOC concentrations at the upstream and downstream stations were 13.3 and 11.9 ± 3.0 mg DOC L−1, respectively, over the monitoring period. As with -N, DOC concentrations showed similar temporal dynamics between stations. DOC concentrations were highest in spring and autumn, with the lowest concentrations observed in summer (Figure 4). DOC concentrations were higher at the upstream station relative to the downstream station during spring (median values 12.49 and 11.00 mg DOC L−1, respectively), summer (median values 10.5 and 10.3 mg DOC L−1, respectively), and autumn (median values 13.2 and 12.0 mg DOC L−1, respectively). In contrast to -N, DOC concentration dynamics showed clear diel patterns under baseflow conditions at both the upstream and downstream sites (Figure 4). DOC concentration dynamics mirrored stream discharge, with the highest concentrations observed during large storm events, although on a diel basis discharge typically peaked 2 h ahead of DOC (see Supplementary Figure 7). Mass balance for DOC was negative for most of the monitoring period, with the exception of one period at the beginning of spring and another at the beginning of summer (Figure 4; Table 3). Storm events increased variability in DOC uptake, but did not lead to a consistent increase or decrease across seasons (Figure 5). Diel variability in mass balance was observed during spring for baseflow conditions, with the highest uptake rates occurring at ~1100 h and the lowest at ~1800 h (Figures 4, 6). In contrast, no diel pattern was evident during summer and much of autumn.
The DOC:nitrate ratio recorded at the down-stream monitoring site was lowest in spring and highest in autumn (Figure 7A). There was generally a positive relationship between discharge and the DOC:nitrate ratio (Figure 7B) that was most pronounced during spring (β = 0.04 ± 0.005, R2 = 0.48, p < 0.01), with no significant relationship apparent in autumn. A weak, albeit significant, relationship (β = 0.058 ± 0.009; R2 = 0.18, p < 0.001) was found between -N uptake and DOC uptake under baseflow conditions. However, this relationship varied by season (Figure 8), with -N uptake and DOC uptake negatively related in spring (β = −0.14 ± 0.011) and positively related in summer (β = 0.16 ± 0.02). In autumn, net -N uptake and DOC uptake rates became less coupled a weaker negative relationship apparent (β = −0.12 ± 0.019).
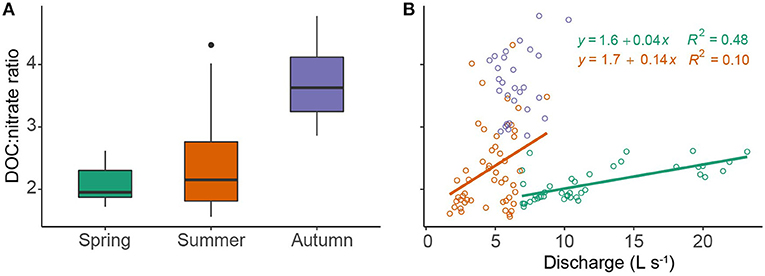
Figure 7. (A) Seasonal variability in the DOC:nitrate molar ratio and (B) relationship between the DOC:nitrate molar ratio and discharge. Lines of best fit were fitted using ordinary least squares regression. Colour codes for seasons are the same in both panels with lines representing significant (P < 0.05) fitted values based on ordinary least squares regression.
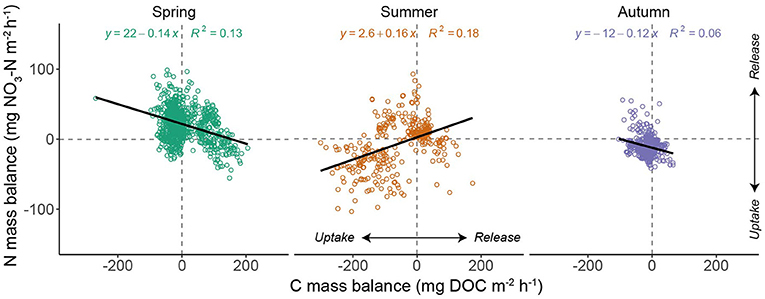
Figure 8. Scatterplot of -N and DOC mass balance by season. Values of nutrient uptake <0 indicate net removal from the water column. The thick black lines indicates the season-specific linear regression fit.
Drivers of Nutrient Uptake Rates
Across the whole monitoring period, -N uptake dynamics were predicted by a relatively small subset of the variables (top model; weight = 0.38; adjusted R2 = 0.73; Table 4), with mean daily DOC:nitrate ratio (standardised β = 0.64), water temperature (−0.18) and discharge (−0.17) the most important variables. The relationship between DOC:nitrate ratio and N uptake presented a clear break point (3.3 ± 0.15 SE) which was identified using segmented regression (Davies test P < 0.001; Supplementary Figure 8). For DOC uptake the relationship with the predictor variables was weaker (top model; weight = 0.33; adjusted R2 = 0.12), but PAR (0.31), mean daily discharge (−0.35), and magnitude of previous storm event (0.31) were the most important variables (Table 4). Clear seasonal variability in the drivers of N uptake were apparent (Figure 9; Table 4) and a strong correlation with DOC:nitrate ratio was apparent in spring and summer, but was reduced in autumn. Higher discharge was associated with higher (lower) uptake rates in summer (autumn) but the inverse was true for water temperature (Figure 9, Table 4). For DOC uptake discharge and storm events appeared to be the main controls across all seasons, with PAR only important in spring (Table 4).
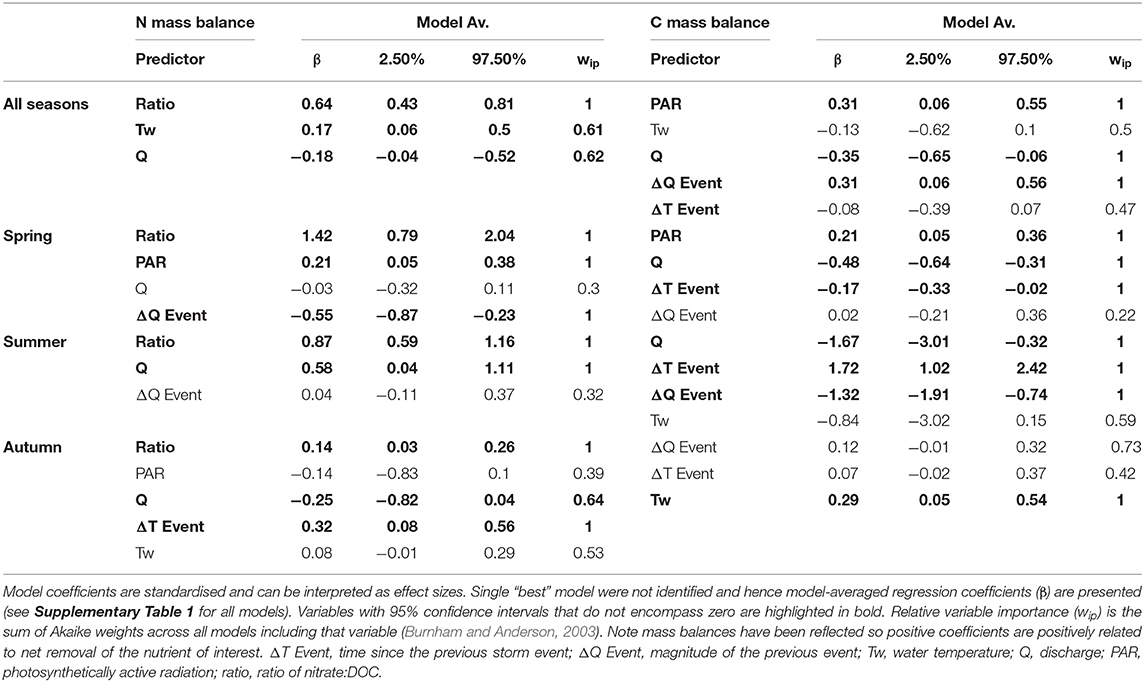
Table 4. Results of the model selection process for daily mean mass balance data.
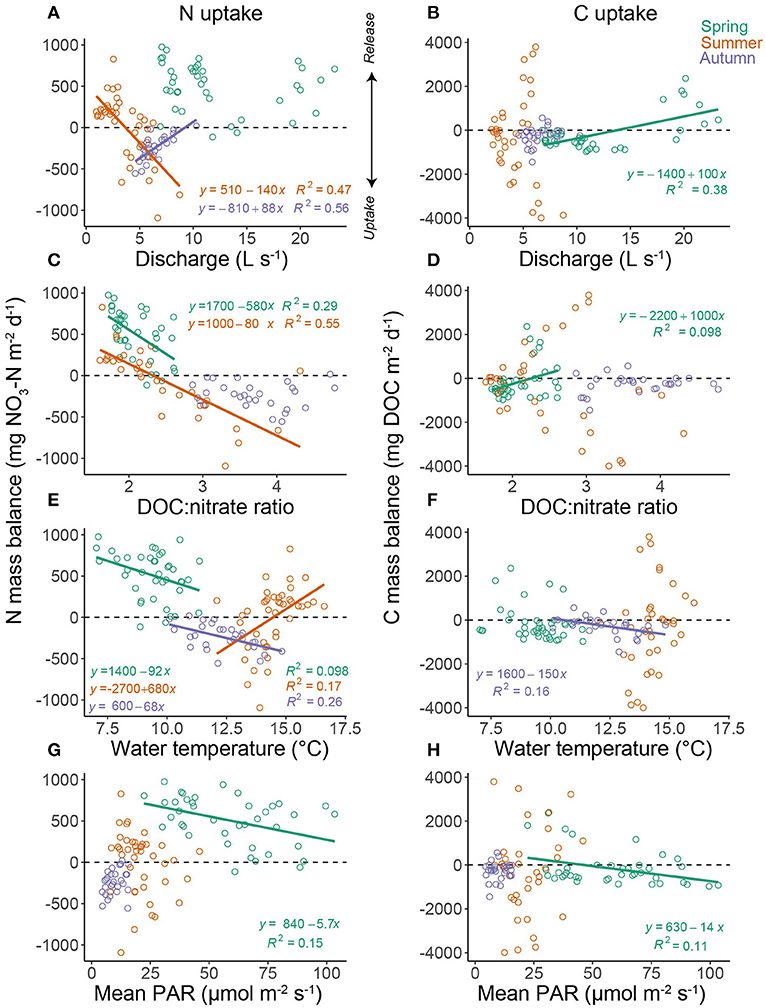
Figure 9. The relationship between daily -N mass balance and mean daily (A) discharge, (C) DOC : nitrate molar ratio, (E) water temperature, and (G) photosynthetic active radiation. The right column displays relationships between daily DOC mass balance and mean daily (B) discharge, (D) DOC : nitrate molar ratio, (F) water temperature, and (H) photosynthetic active radiation. Colour denotes season (i.e., spring, summer, and autumn) with lines representing significant (P < 0.05) fitted values based on ordinary least squares regression.
Short-Term Impacts of Storm Events on Nutrient Uptake Rates
Patterns of hourly -N or DOC net uptake rates immediately following storm events showed few consistent changes relative to pre-event conditions (Figure 10). Storms in spring and autumn did not appear to induce major short-term changes in nutrient rates, with the exception of -N uptake in spring that was noticeably higher than pre-event conditions. In contrast to spring and autumn events, summer post-event net uptake rates of both -N and DOC were markedly higher with strong reductions in nitrate between upstream and downstream compared to pre-event conditions.
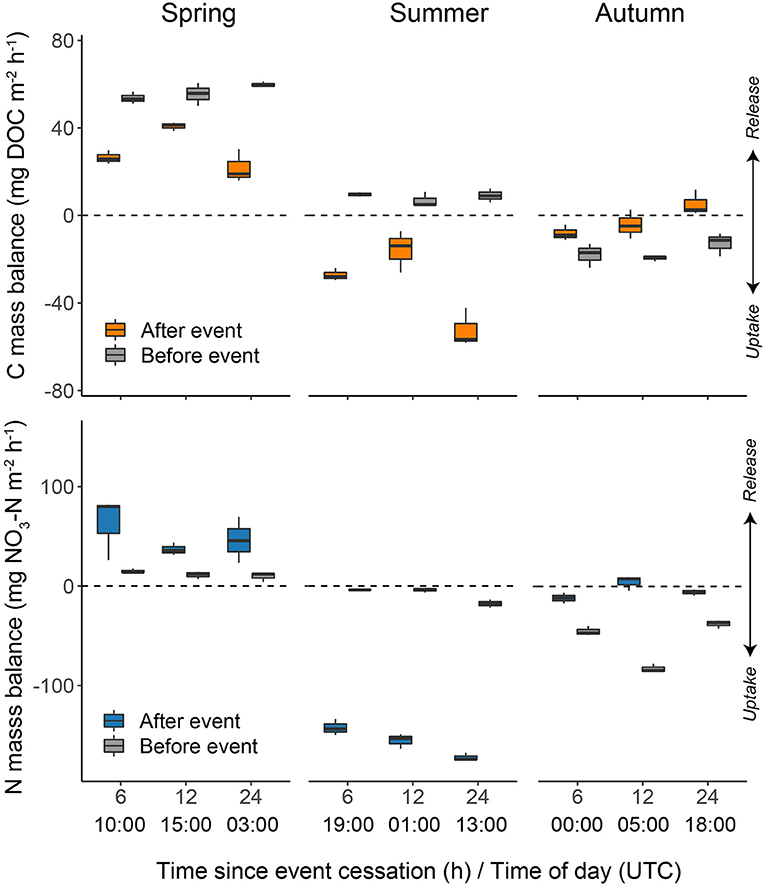
Figure 10. Boxplots of -N and DOC mass balance at 6, 12, and 24 h post selected storm events in spring, summer, and autumn. Post-event uptake rates are normalised to pre-event rates. Pre-event rates at the same time of day are shown for comparison. Note for each time point the mean of ±1 h is calculated; for example the 1300 h value is the mean of 1200 h, 1300 h, and 1400 h. The bold line of the boxplot indicates the median with the lower and upper hinges representing the first and third quartiles of the data, respectively. The smallest (largest) value is indicated by the lower (upper) whisker, however, the whiskers do not extend past 1.5 times the inter-quartile range.
Discussion
In this study, we used high-frequency measurements from in situ sensors to provide continuous quantitative estimates of whole-stream net nutrient uptake in a headwater forest-agricultural stream. Our results provide new perspectives on complex nitrogen and carbon dynamics over multiple temporal scales and enable identification of links to plausible environmental processes that underpin these patterns.
Temporal Dynamics of Net Nutrient Uptake
The median mass balance for -N was positive (136 mg m−2 day−1), with the study reach acting as a net source for 60% of the monitoring period. This was most probably due to high N loading from the surrounding landscape (i.e., agricultural legacy) that led to saturation of whole-stream -N uptake capacity and the export of surplus -N downstream (Bernot and Dodds, 2005; Sylvester-Bradley and Kindred, 2009). However, it is worth noting that in some cases DOM mineralization can result in ammonification and subsequent denitrification (Shogren et al., 2019). At times when mass balance was negative and removal of -N occurred (i.e., early summer and autumn), the observed rates of between 0 and 1000 mg m−2 day−1 were similar to, and often higher than, rates observed in other headwater streams in agricultural catchments in temperate areas of the world. For example, Webster et al. (2003) reported a mean gross -N uptake rate of 111 mg m−2 day−1 (range: 0–7299 mg m−2 day−1) across 11 headwater streams in N. America, while in a meta-analysis of instream nutrient retention, Ensign and Doyle (2006) reported a mean -N uptake rate of 170 mg m−2 day−1 across 29 s-order streams. The general pattern we observed of increasing -N uptake from spring to autumn is consistent with other studies (Jarvie et al., 2018; Reisinger et al., 2019) and was also identified by Comer-Warner et al. (2020) in isotope study of the sediments of Wood Brook. Hence, we suggest heterotrophic denitrification may have become an increasingly dominant pathway for removal during autumn in our shaded study system. Also, a study by Yue et al. (2020) highlights how coupled isotope and high frequency monitoring is a particularly useful technique for unpicking N sources and pathways. Recent studies from river reaches with less riparian shading have recorded greater uptake rates across spring—autumn monitoring campaigns, with peaks of >2000 mg m−2 day−1 and study reaches acting as net sinks for -N (Reisinger et al., 2019; Preiner et al., 2020). This highlights the importance of assimilatory uptake for regulating -N fluxes particularly during spring and summer (Jarvie et al., 2018), a period when shading was high in our system and net export of -N was apparent.
Our study reach was a net sink for DOC (median uptake = −258 mg m−2 day−1) with removal of DOC from the water column apparent for 75% of the study days. We suggest this was due to the shaded nature of the site (i.e., strong heterotrophic demand for DOC) and leaf fall inputs from riparian trees acting as a source through much of the year. It is worth noting that less research has been conducted into instream DOC uptake relative to -N uptake (Mineau et al., 2016). Most previous work in headwater streams has highlighted the strong control of DOC composition on uptake rates, yet this has been based on experimental injections of organic carbon (Bernhardt and McDowell, 2008; Fellman et al., 2009). Studies measuring uptake using mass balance approaches have highlighted moderate uptake in headwater systems with rates comparable to that observed in our study (e.g., −380 mg m−2 day−1; Wollheim et al., 2015) or less (e.g., ~0 mg m−2 day−1; Lupon et al., 2020) than observed in this study. However, our results provide further empirical data to support previous hypotheses that low order river corridors can represent important sites of DOC turnover at the landscape scale (Bertuzzo et al., 2017), particularly compared to more downstream reaches (Huntington et al., 2019). Our results showed that the association between N and C uptake is subject to high day-to-day variation and could be driven by variability in DOC composition (Lupon et al., 2020). However, at seasonal scales coupling between N and C was observed, particularly during summer, thus underlining the utility of long-term, high frequency datasets for unpicking river ecosystem functioning.
No clear diel patterns in -N mass balance were observed (cf. Kunz et al., 2017). Previous studies have reported strong diel variation in -N uptake rates (Heffernan and Cohen, 2010), although most have been conducted in systems with high assimilatory demand for -N by primary producers, which are governed by diel changes in light intensity. Therefore, if heterotrophic uptake processes (e.g., denitrification) are dominant in this system, it is conceivable that rates of net -N uptake are more time-invariant than in other streams dominated by autotrophic processes. In contrast to -N, distinct diel cycles in net DOC uptake were observed during late spring, although these were much less pronounced at other times of the year. As peak DOC uptake typically occurred around midday, one plausible explanation for these patterns is that diel changes in light intensity increased photodegradation of DOC in spring when the canopy was still relatively open. Photodegradation can account for a significant fraction of DOC removal from surface waters. For example, Worrall et al. (2015) reported removal rates up to 0.1 mg C L−1 h−1 for the River Dee, UK. In upland river systems where riparian shading is limited, and DOC concentration can be elevated due to highly organic soils, photodegradation can account for ~60% of losses in the water column (Moody and Worrall, 2016). This light induced uptake/loss occur through a number of processes including: (1) direct photo-oxidation/aggregation of DOC, (2) an increase in DOC bioavailability for microbial uptake (Lu et al., 2013; Moody and Worrall, 2017), and (3) priming effects associated with stimulation of autochthonous carbon production (Guenet et al., 2010). Conversely, daily cycles in DOC uptake may have been driven by diel variation in discharge with source waters containing different concentrations of DOC. The relatively strong positive relationship between discharge and DOC indicates DOC changes were not driven by a dilution effect. Moreover, during several periods the study reach acted as a net sink of DOC during the day and a net source at night, indicating that single time point uptake experiments could lead to erroneous interpretations of instream uptake processes, particularly if diel variability is not adequately characterised.
Environmental Drivers of Uptake Rates
For this forested headwater reach, we found stronger relationships with the variables hypothesised to be the key drivers of nutrient uptake for NO3-N, relative to DOC. Nutrient stoichiometry was the best predictor of N mass balance and reflects that, under high DOC concentrations, demand for inorganic nitrogen increases, thus driving uptake rates (Taylor and Townsend, 2010). While this relationship has been previously highlighted on the basis of discrete uptake experiments based with field additions (Wymore et al., 2016), our study is the first to explore links across the growing season (e.g., spring—autumn). Interestingly, we observed a weakening of the relationship between DOC:nitrate ratio and N uptake in autumn when the ratio with highest. A break point in the relationship was identified at a ratio of ~3.3 (Supplementary Figure 8), which corresponds to the point at which nitrogen assimilation is no longer carbon limited (Taylor and Townsend, 2010). PAR was only related to nutrient uptake in spring suggesting assimilatory processes may have only operated as a mechanism for nutrient removal before seasonal riparian shading reduced instream primary production (Fellows et al., 2006). However, our results do not allow us to explicitly assess the mechanisms of the nitrogen cycle driving uptake. During summer, discharge also became an important predictor of N uptake reflecting the transport limitation of DOC during this time. It is likely uptake was stimulated by the flushing of fresh DOC into the channel (coupling of C and N uptake; Figure 8) from surrounding riparian soils, which also altered C:N stoichiometry (Heppell et al., 2017). This process of solute transport during higher flows is probably also coupled with an increased potential for biochemical reactions in new or “young” water storage zones within the riverbed (Ward et al., 2019). The molar ratio of DOC:nitrate did not appear to limit N uptake during autumn, rather discharge (negative correlation) and time since previous storm event, our proxy for habitat disturbance (positive correlation), were the main drivers. This suggests a shift from stoichiometric controls, as DOC availability is not limiting, to physical controls in autumn.
DOC uptake in this study was associated with PAR (positive), discharge (negative), and magnitude of previous event (positive). The relationship with PAR is interesting as this could represent DOC uptake due to light availability stimulating metabolism (Demars et al., 2020) or conversely could be related to increased solar radiation reaching the stream and greater potential for photodegradation of DOC (Moody and Worrall, 2017). Further work is required to explicitly test this however the elevated delta DO during early spring (Figures 3A,C) suggests the former mechanism is more likely. The role of hydro-climatology in controlling DOC uptake was also apparent with higher flows associated with reduced rates of uptake. This could be a function of DOC source shifting as ambient DOC composition (i.e., humic vs. protein compounds) can influence uptake (Lupon et al., 2020). Microbial communities respond most strongly to flushing in streams with low ambient humic DOC (Catalán et al., 2018), which was not the case for our study system. Despite the negative relationship with discharge, the magnitude of the previous storm event appeared to stimulate uptake and could reflect the potential for storms to restructure microbial communities through mobilisation and transport of new microbial species with potential implications for community functioning (Kan, 2018). Interestingly, there was no relationship between DOC uptake and the DOC: ratio suggesting nitrate never limited DOC uptake. This is in contrast to recent studies which have found negative relationship between DOC uptake and increasing DOC: nitrate ratios (Catalán et al., 2018), albeit across a range an order of magnitude greater than observed in this study. Hence, the result we observed is likely due to the agricultural legacy of the catchment and relatively high availability of N.
Short-Term Impacts of Storm Events on Nutrient Uptake Rates
Seasonal and diel patterns in nutrient mass balance were modified by stochastic storm events throughout the monitoring period. Uptake and release rates of both -N and DOC during storm events exhibited higher variability than during baseflow conditions, although no consistent increase or decrease in uptake during storm events was evident. This higher variability is likely to be explained by rapid changes in both -N and DOC concentrations associated with storm events, as observed in both this study and previous research (Blaen et al., 2017; Vaughan et al., 2017). In addition, increased flow velocities and turbidity levels through the study reach during storm events reduced the time available for instream nutrient processing and diminished light intensity in the water column (Kraus et al., 2017).
High flows associated with storm events can cause substantial disturbance to instream habitat conditions and lead to major changes in aquatic ecosystem structure and function (Poff et al., 1997; Milner et al., 2013). In particular, previous studies have observed storms to suppress rates of instream metabolism (both ecosystem respiration and gross primary production) in many systems across urban, forested and alpine environments (Uehlinger et al., 2003; Beaulieu et al., 2013; Rode et al., 2016; Reisinger et al., 2017). Given that stream metabolism is often coupled with nutrient uptake (e.g., Hall and Tank, 2003), it has been hypothesised that storm-driven reductions in metabolic activity would have corresponding negative impacts on rates of instream nutrient uptake (Walsh et al., 2005; Wenger et al., 2009). In this study, we observed little evidence to support this hypothesis: post-event mass balances for -N and DOC did not differ consistently from pre-event during spring and autumn. This may indicate that aquatic microorganisms in this system are adapted to be highly resistant to disturbances associated with high flows, and supports previous studies that have suggested instream communities dominated by heterotrophs are less susceptible to storm-related disturbances than those dominated by autotrophs (Uehlinger et al., 2002; Roberts et al., 2007). In summer, post-event net uptake rates were higher than those prior to the event, which may be attributable to potential stimulation of heterotrophic activity by the input of nitrogen and labile organic carbon from source areas within the catchment that became activated during storm events (Roberts et al., 2007; Beaulieu et al., 2013; Blaen et al., 2017). The limited number of storms that occurred during the monitoring period precluded a more systematic analysis of short-term responses of nutrient uptake rates to storm events. For example, a larger number of cases would facilitate insights into the effects of flood magnitude on nutrient uptake rates (Reisinger et al., 2017; Bernhardt et al., 2018). Similarly, capturing nutrient dynamics during larger winter storms, or coupling measurements with isotope sampling (cf. Yue et al., 2020) would lead to a better understanding of community responses to disturbance over an annual or inter-annual context. Thus, we suggest the application of high-frequency nutrient sensors will prove a valuable approach to gain detailed understanding of these processes in future.
Conclusions and Implications
Using paired high-frequency nutrient sensors enabled us to capture seasonal, diel and event-based carbon and nitrogen net uptake dynamics that would not be achievable using conventional methods. Our results facilitated new insights into stream ecosystem processes and identified important environmental drivers of variability in nutrient uptake rates, notably nutrient stoichiometry and physical disturbance. Given predictions for warmer conditions and with more extreme precipitation events in many parts of the world in the near future (Kendon et al., 2014; Mann et al., 2017), these findings have implications for the development of predictive stream water quality models that take into account instream biogeochemical processes. Furthermore, the use of high-frequency water quality and hydrology data allowed for the characterisation of the short-term impacts of storm events on net nutrient uptake and release rates. Our results provide evidence suggesting that aquatic communities can be resilient to storm event disturbances in the short term (hours).
In our study, we focused on a headwater catchment with a history of agricultural activity, typical of those found across many parts of Europe and North America (Withers et al., 2014; Van Meter et al., 2016). Our observations indicated that the mass of both -N and DOC removed from the water column by uptake processes was small and represented <3% of that exported downstream. This is not entirely unexpected, because we quantified nutrient mass balance over a 1000 m stream reach only, rather than throughout the entire upstream catchment with a network length of ~5000 m. Nonetheless, even after extrapolating our results across the network, this would indicate that nutrient uptake processes in this catchment have little impact on the quality of water exported to downstream reaches. Our study was limited to a single catchment; however, if these results hold for similar catchments, we suggest that water quality managers should be cautious in relying on natural processes to mitigate the effects of anthropogenic nutrient enrichment in headwater catchments as these may be ineffective in achieving meaningful reductions in nutrient loads.
Our results serve not only to highlight the importance of small headwater catchments—the Aqua Incognita (cf. Bishop et al., 2008)—for determining downstream water quality signatures, but also to provide new understanding of how changes in environmental conditions over different temporal dimensions can alter these water quality patterns. Given that the methods used in this paper are transferable to other stream ecosystems, future applications across a range of environments, stream orders, and hydroclimatological conditions will further our understanding of variability and interactions in nutrient uptake and release dynamics. Moreover, the combined use of multiple sensors offers the potential for new insights into biogeochemical cycling. For example, although this study considered only -N, sensors are available to measure other N species such as and (Blaen et al., 2016). Similarly, sensors for measuring DOC quality as opposed to just quantity are now available, with potential to fingerprint different DOM sources (Khamis et al., 2020). Deployed together, these have the scope to improve our knowledge of instream N and C transport, cycling and transformation dynamics substantially. New insights into aquatic nutrient transport and transformation revealed through the increased availability of high-frequency data from in situ sensors will play a key role in the development of effective management strategies for stream ecosystems in the future.
Data Availability Statement
The raw data supporting the conclusions of this article will be made available by the authors, without undue reservation.
Author Contributions
PB: conceptualisation, investigation, formal analysis, and writing—original draught preparation. KK: conceptualisation, formal analysis, and writing—original draught preparation. DH and AM: writing—reviewing and editing and funding acquisition. SC-W: investigation and writing—reviewing and editing. SK: conceptualisation, writing—reviewing and editing, and funding acquisition. All authors contributed to the article and approved the submitted version.
Funding
Funding to support this research was provided by Leverhulme Trust (IN-2013-042: International Hyporheic Zone Network: Where rivers, groundwater, and disciplines meet) and the UK Natural Environment Research Council (NERC NE/L003872/1).
Conflict of Interest
The authors declare that the research was conducted in the absence of any commercial or financial relationships that could be construed as a potential conflict of interest.
Acknowledgments
The authors would like to acknowledge support from the University of Birmingham, the Birmingham Institute of Forest Research, and the JABBS Foundation. We gratefully acknowledge Luis dos Santos Geirinhas and Rick Thomas for assistance with the PAR measurements and the BIFoR FACE technical team for assistance with instrument deployment and maintenance.
Supplementary Material
The Supplementary Material for this article can be found online at: https://www.frontiersin.org/articles/10.3389/frwa.2021.668924/full#supplementary-material
References
Battin, T. J., Kaplan, L. A., Findlay, S., Hopkinson, C. S., Marti, E., Packman, A. I., et al. (2008). Biophysical controls on organic carbon fluxes in fluvial networks. Nat. Geosci. 1, 95–100. doi: 10.1038/ngeo101
Beaulieu, J. J., Arango, C. P., Balz, D. A., and Shuster, W. D. (2013). Continuous monitoring reveals multiple controls on ecosystem metabolism in a suburban stream. Freshw. Biol. 58, 918–937. doi: 10.1111/fwb.12097
Bernhardt, E. S., Blaszczak, J. R., Ficken, C. D., and Fork, M. L. (2017). Control points in ecosystems: moving beyond the hot spot hot moment concept. Ecosystems 20, 665–682. doi: 10.1007/s10021-016-0103-y
Bernhardt, E. S., Heffernan, J. B., Grimm, N. B., Stanley, E. H., Harvey, J. W., Arroita, M., et al. (2018). The metabolic regimes of flowing waters. Limnol. Oceanogr. 63, S99–S118. doi: 10.1002/lno.10726
Bernhardt, E. S., and McDowell, W. H. (2008). Twenty years apart: Comparisons of DOM uptake during leaf leachate releases to Hubbard Brook Valley streams in 1979 versus 2000. J. Geophys. Res. 113:429. doi: 10.1029/2007JG000618
Bernot, M. J., and Dodds, W. K. (2005). Nitrogen retention, removal, and saturation in lotic ecosystems. Ecosystems 8, 442–453. doi: 10.1007/s10021-003-0143-y
Bertuzzo, E., Helton, A. M., Hall, R. O. Jr, and Battin, T. J. (2017). Scaling of dissolved organic carbon removal in river networks. Adv. Water Resour. 110, 136–146. doi: 10.1016/j.advwatres.2017.10.009
Beusen, A. H. W., Bouwman, A. F., Van Beek, L. P. H., Mogollón, J. M., and Middelburg, J. J. (2016). Global riverine N and P transport to ocean increased during the 20th century despite increased retention along the aquatic continuum. Biogeosciences 13:2441. doi: 10.5194/bg-13-2441-2016
Bishop, K., Buffam, I., Erlandsson, M., Fölster, J., Laudon, H., Seibert, J., et al. (2008). Aqua Incognita: the unknown headwaters. Hydrol. Process. 22, 1239–1242. doi: 10.1002/hyp.7049
Blaen, P., Khamis, K., Lloyd, C., Bradley, C., and Krause, S. (2016). Real-time monitoring of nutrients and dissolved organic matter in rivers: adaptive monitoring strategies, technological challenges, and future directions. Sci. Total Environ. 569–570, 647–660. doi: 10.1016/j.scitotenv.2016.06.116
Blaen, P., Khamis, K., Lloyd, C., Comer-Warner, S., Ciocca, F., Thomas, R. M., et al. (2017). High-frequency monitoring of catchment nutrient exports reveals highly variable storm event responses and dynamic source zone activation. J. Geophys. Res. Biogeosci. 122, 2265–2281. doi: 10.1002/2017JG003904
Bowes, M. J., Smith, J. T., and Neal, C. (2009). The value of high-resolution nutrient monitoring: a case study of the River Frome, Dorset, UK. J. Hydrol. 378, 82–96. doi: 10.1016/j.jhydrol.2009.09.015
Burnham, K. P., and Anderson, D. R. (2003). Model Selection and Multimodel Inference: A Practical Information-Theoretic Approach. Berlin: Springer Science and Business Media.
Catalán, N., Casas-Ruiz, J. P., Arce, M. I., Abril, M., Bravo, A. G., del Campo, R., et al. (2018). Behind the scenes: mechanisms regulating climatic patterns of dissolved organic carbon uptake in headwater streams. Glob. Biogeochem. Cycles 32, 1528–1541. doi: 10.1029/2018GB005919
Comer-Warner, S. A., Gooddy, D. C., Ullah, S., Glover, L., Kettridge, N., Wexler, S. K., et al. (2020). Seasonal variability of sediment controls of nitrogen cycling in an agricultural stream. Biogeochemistry 148, 31–48. doi: 10.1007/s10533-020-00644-z
Cory, R. M., Ward, C. P., Crump, B. C., and Kling, G. W. (2014). Sunlight controls water column processing of carbon in arctic fresh waters. Science 345, 925–928. doi: 10.1126/science.1253119
Covino, T. P., McGlynn, B. L., and McNamara, R. A. (2010). Tracer Additions for Spiraling Curve Characterization (TASCC): quantifying stream nutrient uptake kinetics from ambient to saturation: Nutrient uptake kinetics from ambient to saturation. Limnol. Oceanogr. Methods 8, 484–498. doi: 10.4319/lom.2010.8.484
Demars, B. O. L., Friberg, N., and Thornton, B. (2020). Pulse of dissolved organic matter alters reciprocal carbon subsidies between autotrophs and bacteria in stream food webs. Ecol. Monogr. 90:51. doi: 10.1002/ecm.1399
Ensign, S. H., and Doyle, M. W. (2006). Nutrient spiraling in streams and river networks. J. Geophys. Res. Biogeosci. 111:G04009. doi: 10.1029/2005JG000114
Fellman, J. B., Hood, E., Edwards, R. T., and Jones, J. B. (2009). Uptake of allochthonous dissolved organic matter from soil and salmon in coastal temperate rainforest streams. Ecosystems 12, 747–759. doi: 10.1007/s10021-009-9254-4
Fellows, C. S., Valett, H. M., Dahm, C. N., Mulholland, P. J., and Thomas, S. A. (2006). Coupling nutrient uptake and energy flow in headwater streams. Ecosystems 9, 788–804. doi: 10.1007/s10021-006-0005-5
Goyenola, G., Graeber, D., Meerhoff, M., and Jeppesen, E. (2020). Influence of farming intensity and climate on lowland stream nitrogen. Water 12:1021. doi: 10.3390/w12041021
Guenet, B., Danger, M., Abbadie, L., and Lacroix, G. (2010). Priming effect: bridging the gap between terrestrial and aquatic ecology. Ecology 91, 2850–2861. doi: 10.1890/09-1968.1
Hall, R. Jr, and Tank, J. L. (2003). Ecosystem metabolism controls nitrogen uptake in streams in Grand Teton National Park, Wyoming. Limnol. Oceanogr. 48, 1120–1128. doi: 10.4319/lo.2003.48.3.1120
Hart, K. M., Curioni, G., Blaen, P., Harper, N. J., Miles, P., Lewin, K. F., et al. (2020). Characteristics of free air carbon dioxide enrichment of a northern temperate mature forest. Glob. Change Biol. 26, 1023–1037. doi: 10.1111/gcb.14786
He, B., Kanae, S., Oki, T., Hirabayashi, Y., Yamashiki, Y., and Takara, K. (2011). Assessment of global nitrogen pollution in rivers using an integrated biogeochemical modeling framework. Water Res. 45, 2573–2586. doi: 10.1016/j.watres.2011.02.011
Heathwaite, A. L. (2010). Multiple stressors on water availability at global to catchment scales: understanding human impact on nutrient cycles to protect water quality and water availability in the long term. Freshw. Biol. 55, 241–257. doi: 10.1111/j.1365-2427.2009.02368.x
Heffernan, J. B., and Cohen, M. J. (2010). Direct and indirect coupling of primary production and diel nitrate dynamics in a subtropical spring-fed river. Limnol. Oceanogr. 55, 677–688. doi: 10.4319/lo.2010.55.2.0677
Helton, A. M., Ardón, M., and Bernhardt, E. S. (2015). Thermodynamic constraints on the utility of ecological stoichiometry for explaining global biogeochemical patterns. Ecol. Lett. 18, 1049–1056. doi: 10.1111/ele.12487
Helton, A. M., Hall, R. O. Jr, and Bertuzzo, E. (2018). How network structure can affect nitrogen removal by streams. Freshw. Biol. 63, 128–140. doi: 10.1111/fwb.12990
Heppell, C. M., Binley, A., Trimmer, M., Darch, T., Jones, A., Malone, E., et al. (2017). Hydrological controls on DOC: nitrate resource stoichiometry in a lowland, agricultural catchment, southern UK. Hydrol. Earth Syst. Sci. 21, 4785–4802. doi: 10.5194/hess-21-4785-2017
Hood, E., Battin, T. J., Fellman, J., O'Neel, S., and Spencer, R. G. M. (2015). Storage and release of organic carbon from glaciers and ice sheets. Nat. Geosci. 8, 91–96. doi: 10.1038/ngeo2331
Hudson, R., and Fraser, J. (2005). The mass balance (or dry injection) method. Streamline Watershed Management Bulletin 9, 6–12.
Huntington, T. G., Roesler, C. S., and Aiken, G. R. (2019). Evidence for conservative transport of dissolved organic carbon in major river basins in the Gulf of Maine Watershed. J. Hydrol. 573, 755–767. doi: 10.1016/j.jhydrol.2019.03.076
Jarvie, H. P., Sharpley, A. N., Kresse, T., Hays, P. D., Williams, R. J., King, S. M., et al. (2018). Coupling high-frequency stream metabolism and nutrient monitoring to explore biogeochemical controls on downstream nitrate delivery. Environ. Sci. Technol. 52, 13708–13717. doi: 10.1021/acs.est.8b03074
Jones, T. G., Evans, C. D., Jones, D. L., Hill, P. W., and Freeman, C. (2016). Transformations in DOC along a source to sea continuum; impacts of photo-degradation, biological processes, and mixing. Aquat. Sci. 78, 433–446. doi: 10.1007/s00027-015-0461-0
Kan, J. (2018). Storm events restructured bacterial community and their biogeochemical potentials. J. Geophys. Res. Biogeosci. 123, 2257–2269. doi: 10.1029/2017JG004289
Kendon, E. J., Roberts, N. M., Fowler, H. J., Roberts, M. J., Chan, S. C., and Senior, C. A. (2014). Heavier summer downpours with climate change revealed by weather forecast resolution model. Nat. Clim. Change 4, 570–576. doi: 10.1038/nclimate2258
Khamis, K., Bradley, C., and Hannah, D. M. (2018). Understanding dissolved organic matter dynamics in urban catchments: insights from in situ fluorescence sensor technology. Wiley Interdiscip. Rev. Water 5:e1259. doi: 10.1002/wat2.1259
Khamis, K., Bradley, C., and Hannah, D. M. (2020). High frequency fluorescence monitoring reveals new insights into organic matter dynamics of an urban river, Birmingham, UK. Sci. Total Environ. 710:135668. doi: 10.1016/j.scitotenv.2019.135668
Kraus, T. E. C., O'Donnell, K., Downing, B. D., Burau, J. R., and Bergamaschi, B. A. (2017). Using paired in situ high frequency nitrate measurements to better understand controls on nitrate concentrations and estimate nitrification rates in a wastewater-impacted river. Water Resour. Res. 53, 8423–8442. doi: 10.1002/2017WR020670
Krause, S., Lewandowski, J., Dahm, C. N., and Tockner, K. (2015). Frontiers in real-time ecohydrology–a paradigm shift in understanding complex environmental systems. Ecohydrology 8, 529–537. doi: 10.1002/eco.1646
Kunz, J. V., Hensley, R., Brase, L., Borchardt, D., and Rode, M. (2017). High frequency measurements of reach scale nitrogen uptake in a fourth order river with contrasting hydromorphology and variable water chemistry (W eiße E lster, G ermany). Water Resour. Res. 53, 328–343. doi: 10.1002/2016WR019355
Lu, Y., Bauer, J. E., Canuel, E. A., Yamashita, Y., Chambers, R. M., and Jaffé, R. (2013). Photochemical and microbial alteration of dissolved organic matter in temperate headwater streams associated with different land use. J. Geophys. Res. Biogeosci. 118, 566–580. doi: 10.1002/jgrg.20048
Lupon, A., Catalán, N., Martí, E., and Bernal, S. (2020). Influence of dissolved organic matter sources on in-stream net dissolved organic carbon uptake in a mediterranean stream. Water 12:1722. doi: 10.3390/w12061722
Mann, M. E., Rahmstorf, S., Kornhuber, K., Steinman, B. A., Miller, S. K., and Coumou, D. (2017). Influence of anthropogenic climate change on planetary wave resonance and extreme weather events. Sci. Rep. 7:45242. doi: 10.1038/srep46822
Manning, D. W. P., Rosemond, A. D., Gulis, V., Benstead, J. P., and Kominoski, J. S. (2018). Nutrients and temperature additively increase stream microbial respiration. Glob. Chang. Biol. 24, e233–e247. doi: 10.1111/gcb.13906
Milner, A. M., Robertson, A. L., McDermott, M. J., Klaar, M. J., and Brown, L. E. (2013). Major flood disturbance alters river ecosystem evolution. Nat. Clim. Change 3:137. doi: 10.1038/nclimate1665
Mineau, M. M., Wollheim, W. M., Buffam, I., Findlay, S. E. G., Hall, R. O., Hotchkiss, E. R., et al. (2016). Dissolved organic carbon uptake in streams: a review and assessment of reach-scale measurements. J. Geophys. Res. Biogeosci. 121, 2019–2029. doi: 10.1002/2015JG003204
Moody, C. S., and Worrall, F. (2016). Sub-daily rates of degradation of fluvial carbon from a peat headwater stream. Aquat. Sci. 78, 419–431. doi: 10.1007/s00027-015-0456-x
Moody, C. S., and Worrall, F. (2017). Modelling rates of DOC degradation using DOM composition and hydroclimatic variables. J. Geophys. Res. Biogeosci. 122, 1175–1191. doi: 10.1002/2016JG003493
Mulholland, P. J., Helton, A. M., Poole, G. C., Hall, R. O., Hamilton, S. K., Peterson, B. J., et al. (2008). Stream denitrification across biomes and its response to anthropogenic nitrate loading. Nature 452:202. doi: 10.1038/nature06686
Nathan, R. J., and McMahon, T. A. (1990). Evaluation of automated techniques for base flow and recession analyses. Water Resour. Res. 26, 1465–1473. doi: 10.1029/WR026i007p01465
Payn, R. A., Hall, R. O. Jr, Kennedy, T. A., Poole, G. C., and Marshall, L. A. (2017). A coupled metabolic-hydraulic model and calibration scheme for estimating whole-river metabolism during dynamic flow conditions. Limnol. Oceanogr. Methods 15, 847–866. doi: 10.1002/lom3.10204
Peterson, B. J., Wollheim, W. M., Mulholland, P. J., Webster, J. R., Meyer, J. L., Tank, J. L., et al. (2001). Control of nitrogen export from watersheds by headwater streams. Science 292, 86–90. doi: 10.1126/science.1056874
Poff, N. L., Allan, J. D., Bain, M. B., Karr, J. R., Prestegaard, K. L., Richter, B. D., et al. (1997). The natural flow regime. Bioscience 47, 769–784. doi: 10.2307/1313099
Preiner, S., Dai, Y., Pucher, M., Reitsema, R. E., Schoelynck, J., Meire, P., et al. (2020). Effects of macrophytes on ecosystem metabolism and net nutrient uptake in a groundwater fed lowland river. Sci. Total Environ. 721:137620. doi: 10.1016/j.scitotenv.2020.137620
Raymond, P. A., Hartmann, J., Lauerwald, R., Sobek, S., McDonald, C., Hoover, M., et al. (2013). Global carbon dioxide emissions from inland waters. Nature 503, 355–359. doi: 10.1038/nature12760
Raymond, P. A., Saiers, J. E., and Sobczak, W. V. (2016). Hydrological and biogeochemical controls on watershed dissolved organic matter transport: pulse-shunt concept. Ecology 97, 5–16. doi: 10.1890/14-1684.1
Reisinger, A. J., Doody, T. R., Groffman, P. M., Kaushal, S. S., and Rosi, E. J. (2019). Seeing the light: urban stream restoration affects stream metabolism and nitrate uptake via changes in canopy cover. Ecol. Appl. 29:e01941. doi: 10.1002/eap.1941
Reisinger, A. J., Rosi, E. J., Bechtold, H. A., Doody, T. R., Kaushal, S. S., and Groffman, P. M. (2017). Recovery and resilience of urban stream metabolism following Superstorm Sandy and other floods. Ecosphere 8:e01776. doi: 10.1002/ecs2.1776
Roberts, B. J., Mulholland, P. J., and Hill, W. R. (2007). Multiple scales of temporal variability in ecosystem metabolism rates: results from 2 years of continuous monitoring in a forested headwater stream. Ecosystems 10, 588–606. doi: 10.1007/s10021-007-9059-2
Rode, M., Halbedel née Angelstein, S., Anis, M. R., Borchardt, D., and Weitere, M. (2016). Continuous in-stream assimilatory nitrate uptake from high-frequency sensor measurements. Environ. Sci. Technol. 50, 5685–5694. doi: 10.1021/acs.est.6b00943
Ruhala, S. S., and Zarnetske, J. P. (2017). Using in-situ optical sensors to study dissolved organic carbon dynamics of streams and watersheds: a review. Sci. Total Environ. 575, 713–723. doi: 10.1016/j.scitotenv.2016.09.113
Schielzeth, H. (2010). Simple means to improve the interpretability of regression coefficients. Methods Ecol. Evol. 1, 103–113. doi: 10.1111/j.2041-210X.2010.00012.x
Seybold, E., and McGlynn, B. (2018). Hydrologic and biogeochemical drivers of dissolved organic carbon and nitrate uptake in a headwater stream network. Biogeochemistry 138, 23–48. doi: 10.1007/s10533-018-0426-1
Shogren, A. J., Zarnetske, J. P., Abbott, B. W., Iannucci, F., and Bowden, W. B. (2020). We cannot shrug off the shoulder seasons: addressing knowledge and data gaps in an Arctic headwater. Environ. Res. Lett. 15:104027. doi: 10.1088/1748-9326/ab9d3c
Shogren, A. J., Zarnetske, J. P., Abbott, B. W., Iannucci, F., Frei, R. J., Griffin, N. A., et al. (2019). Revealing biogeochemical signatures of Arctic landscapes with river chemistry. Sci. Rep. 9:12894. doi: 10.1038/s41598-019-49296-6
Sylvester-Bradley, R., and Kindred, D. R. (2009). Analysing nitrogen responses of cereals to prioritize routes to the improvement of nitrogen use efficiency. J. Exp. Bot. 60, 1939–1951. doi: 10.1093/jxb/erp116
Tank, J. L., Martí, E., Riis, T., von Schiller, D., Reisinger, A. J., Dodds, W. K., et al. (2018). Partitioning assimilatory nitrogen uptake in streams: an analysis of stable isotope tracer additions across continents. Ecol. Monogr. 88, 120–138. doi: 10.1002/ecm.1280
Taylor, P. G., and Townsend, A. R. (2010). Stoichiometric control of organic carbon–nitrate relationships from soils to the sea. Nature 464, 1178–1181. doi: 10.1038/nature08985
Uehlinger, U., Kawecka, B., and Robinson, C. T. (2003). Effects of experimental floods on periphyton and stream metabolism below a high dam in the Swiss Alps (River Spöl). Aquat. Sci. 65, 199–209. doi: 10.1007/s00027-003-0664-7
Uehlinger, U., Naegeli, M., and Fisher, S. G. (2002). A heterotrophic desert stream? the role of sediment stability. West. N. Am. Nat. 62, 466–473.
Van Meter, K. J., Basu, N. B., Veenstra, J. J., and Burras, C. L. (2016). The nitrogen legacy: emerging evidence of nitrogen accumulation in anthropogenic landscapes. Environ. Res. Lett. 11:035014. doi: 10.1088/1748-9326/11/3/035014
Vaughan, M. C. H., Bowden, W. B., Shanley, J. B., Vermilyea, A., Sleeper, R., Gold, A. J., et al. (2017). High-frequency dissolved organic carbon and nitrate measurements reveal differences in storm hysteresis and loading in relation to land cover and seasonality. Water Resour. Res. 53, 5345–5363. doi: 10.1002/2017WR020491
Walsh, C. J., Roy, A. H., Feminella, J. W., Cottingham, P. D., Groffman, P. M., and Morgan, R. P. (2005). The urban stream syndrome: current knowledge and the search for a cure. J. North Am. Benthol. Soc. 24, 706–723. doi: 10.1899/04-028.1
Ward, A. S., Kurz, M. J., Schmadel, N. M., Knapp, J. L. A., Blaen, P. J., Harman, C. J., et al. (2019). Solute transport and transformation in an intermittent, headwater mountain stream with diurnal discharge fluctuations. Water 11:2208. doi: 10.3390/w11112208
Webster, J. R., Mulholland, P. J., and Tank, J. L. (2003). Factors affecting ammonium uptake in streams–an inter-biome perspective. Freshw. Biol. 48, 1329–1352. doi: 10.1046/j.1365-2427.2003.01094.x
Wenger, S. J., Roy, A. H., Jackson, C. R., Bernhardt, E. S., Carter, T. L., Filoso, S., et al. (2009). Twenty-six key research questions in urban stream ecology: an assessment of the state of the science. J. North Am. Benthol. Soc. 28, 1080–1098. doi: 10.1899/08-186.1
Withers, P. J. A., Neal, C., Jarvie, H. P., and Doody, D. G. (2014). Agriculture and eutrophication: where do we go from here? Sustain. Sci. Pract. Policy 6, 5853–5875. doi: 10.3390/su6095853
Wollheim, W. M., Bernal, S., Burns, D. A., Czuba, J. A., Driscoll, C. T., Hansen, A. T., et al. (2018). River network saturation concept: factors influencing the balance of biogeochemical supply and demand of river networks. Biogeochemistry 141, 503–521. doi: 10.1007/s10533-018-0488-0
Wollheim, W. M., Mulukutla, G. K., Cook, C., and Carey, R. O. (2017). Aquatic nitrate retention at river network scales across flow conditions determined using nested in situ sensors: network scale nitrate retention. Water Resour. Res. 53, 9740–9756. doi: 10.1002/2017WR020644
Wollheim, W. M., Stewart, R. J., Aiken, G. R., Butler, K. D., Morse, N. B., and Salisbury, J. (2015). Removal of terrestrial DOC in aquatic ecosystems of a temperate river network. Geophys. Res. Lett. 42, 6671–6679. doi: 10.1002/2015GL064647
Worrall, F., Howden, N. J. K., and Burt, T. P. (2015). Understanding the diurnal cycle in fluvial dissolved organic carbon–The interplay of in-stream residence time, day length, and organic matter turnover. J. Hydrol. 523, 830–838. doi: 10.1016/j.jhydrol.2015.01.075
Wymore, A. S., Coble, A. A., Rodríguez-Cardona, B., and McDowell, W. H. (2016). Nitrate uptake across biomes and the influence of elemental stoichiometry: a new look at LINX II. Glob. Biogeochem. Cycles 30, 1183–1191. doi: 10.1002/2016GB005468
Yue, F.-J., Li, S.-L., Waldron, S., Wang, Z.-J., Oliver, D. M., Chen, X., et al. (2020). Rainfall and conduit drainage combine to accelerate nitrate loss from a karst agroecosystem: Insights from stable isotope tracing and high-frequency nitrate sensing. Water Res. 186:116388. doi: 10.1016/j.watres.2020.116388
Keywords: nutrient dynamics, optical sensors, storm events, nutrient uptake, biogeochemical processes
Citation: Khamis K, Blaen PJ, Comer-Warner S, Hannah DM, MacKenzie AR and Krause S (2021) High-Frequency Monitoring Reveals Multiple Frequencies of Nitrogen and Carbon Mass Balance Dynamics in a Headwater Stream. Front. Water 3:668924. doi: 10.3389/frwa.2021.668924
Received: 17 February 2021; Accepted: 21 April 2021;
Published: 20 May 2021.
Edited by:
Núria Catalán, United States Geological Survey (USGS), United StatesReviewed by:
Si-Liang Li, Tianjin University, ChinaJoseph Guillaume, Australian National University, Australia
Copyright © 2021 Khamis, Blaen, Comer-Warner, Hannah, MacKenzie and Krause. This is an open-access article distributed under the terms of the Creative Commons Attribution License (CC BY). The use, distribution or reproduction in other forums is permitted, provided the original author(s) and the copyright owner(s) are credited and that the original publication in this journal is cited, in accordance with accepted academic practice. No use, distribution or reproduction is permitted which does not comply with these terms.
*Correspondence: Kieran Khamis, ay5raGFtaXNAYmhhbS5hYy51aw==
†These authors have contributed equally to this work