 Maja Rücker1,2*
 Apostolos Georgiadis3Ryan T. Armstrong4Holger Ott5Niels Brussee3Hilbert van der Linde3
 Ludwig Simon6Frieder Enzmann6
 Michael Kersten6
 Steffen Berg3,2,7*
- 1Department of Mechanical Engineering, Technical University Eindhoven, Eindhoven, Netherlands
- 2Department of Chemical Engineering, Imperial College London, London, United Kingdom
- 3Shell Global Solutions International B.V., Amsterdam, Netherlands
- 4School of Minerals and Energy Resources Engineering, University of New South Wales, Sydney, NSW, Australia
- 5Department Petroleum Engineering, Montanuniversität Leoben, Leoben, Austria
- 6Hydrogeochemistry, Geosciences Institute, Johannes-Gutenberg University, Mainz, Germany
- 7Department of Earth Sciences and Engineering, Imperial College London, London, United Kingdom
Core flooding experiments to determine multiphase flow in properties of rock such as relative permeability can show significant fluctuations in terms of pressure, saturation, and electrical conductivity. That is typically not considered in the Darcy scale interpretation but treated as noise. However, in recent years, flow regimes that exhibit spatio-temporal variations in pore scale occupancy related to fluid phase pressure changes have been identified. They are associated with topological changes in the fluid configurations caused by pore-scale instabilities such as snap-off. The common understanding of Darcy-scale flow regimes is that pore-scale phenomena and their signature should have averaged out at the scale of representative elementary volumes (REV) and above. In this work, it is demonstrated that pressure fluctuations observed in centimeter-scale experiments commonly considered Darcy-scale at fractional flow conditions, where wetting and non-wetting phases are co-injected into porous rock at small (<10−6) capillary numbers are ultimately caused by pore-scale processes, but there is also a Darcy-scale fractional flow theory aspect. We compare fluctuations in fractional flow experiments conducted on samples of few centimeters size with respective experiments and in-situ micro-CT imaging at pore-scale resolution using synchrotron-based X-ray computed micro-tomography. On that basis we can establish a systematic causality from pore to Darcy scale. At the pore scale, dynamic imaging allows to directly observe the associated breakup and coalescence processes of non-wetting phase clusters, which follow “trajectories” in a “phase diagram” defined by fractional flow and capillary number and can be used to categorize flow regimes. Connected pathway flow would be represented by a fixed point, whereas processes such as ganglion dynamics follow trajectories but are still overall capillary-dominated. That suggests that the origin of the pressure fluctuations observed in centimeter-sized fractional flow experiments are capillary effects. The energy scale of the pressure fluctuations corresponds to 105-106 times the thermal energy scale. This means the fluctuations are non-thermal. At the centimeter scale, there are non-monotonic and even oscillatory solutions permissible by the fractional flow theory, which allow the fluctuations to be visible and—depending on exact conditions—significant at centimeter scale, within the viscous limit of classical (Darcy scale) fractional flow theory. That also means that the phenomenon involves both capillary aspects from the pore or cluster scale and viscous aspects of fractional flow and occurs right at the transition, where the physical description concept changes from pore to Darcy scale.
Introduction
Multiphase flow in porous media is an integral part in many aspects of every-day life and plays a critical role in some of the most important processes and technologies from agriculture to energy. Examples range from the hydrology in the Vadose zone where the water table rises and falls and water and air occupy the pore space in soil, contaminant hydrology, hydrocarbon recovery, hydrogen storage, and carbon capture and sequestration (CCS) (Bui et al., 2018). Multiphase transport is also a rate-limiting step in gas diffusion layers in electrocatalytic devices such as fuel cells (Simon et al., 2017), electrolysis, and more novel concepts, where CO2 is converted into base chemicals (Kondratenko et al., 2013).
In most applications, multiphase transport is described with the 2-phase Darcy equations, which are a continuum mechanic concept for relating transport, i.e., average phase fluxes to average pressure gradients applicable at the “Darcy scale.” They are phenomenological extensions of Darcy's law from single to multiphase flow. One of the consequences of operating with a phenomenological transport equation is that it contains parameters, such as relative permeability, which cannot be predicted within the framework of the 2-phase Darcy equations. Since relative permeability is specific to the porous medium and its chemical interaction with the fluids present manifesting in characteristic wetting behavior of the system (Abdallah et al., 2007), they have to be determined for each situation individually. Common methods to experimentally determine relative permeability are core flooding experiments, which are typically conducted on porous media samples of few centimeters in size. For instance, in the petroleum industry, cylindrical rock samples from drilled cores are used, which are limited in size by the diameter of the core and are typically between 2.54 and 5.00 cm in length and diameter, which is commonly assumed to represent Darcy scale. The steady-state method is one of the most trusted methods as it provides a wide accessible saturation range and in combination with numerical simulation (Kokkedee et al., 1996; Masalmeh et al., 2014; Sorop et al., 2015) allows the correct treatment of experimental artifacts, such the capillary end-effect (Huang and Honarpour, 1998). In steady-state experiments, the two immiscible fluids phases, e.g., water or brine and oil or gas are co-injected at stepwise varied fractions of wetting phase flux over total flux, termed fractional flow fw. At each fractional flow step, fluids are co-injected until a “steady-state” has been reached, which is defined by saturation, pressure-drop, and electrical resistivity becoming time-independent, i.e., , where is the space and time-averaged saturation. Relative permeability is then determined from the time-averaged pressure-drop and time-averaged saturation.
However, many of these fractional flow experiments show notable fluctuations (Datta et al., 2014a,b; Masalmeh et al., 2014; Reynolds and Krevor, 2015; Rücker et al., 2015a; Sorop et al., 2015; Gao et al., 2017, 2019, 2020; Lin Q. et al., 2018; Alcorn et al., 2019; Clennell et al., 2019; Lin et al., 2019a; Spurin et al., 2019; Wang and Masalmeh, 2019; Menke et al., 2021), for instance in pressure drop but also saturation. In some cases, the magnitude of these fluctuations is comparable or even larger than the average values of the respective property, e.g., pressure drop, between the previous or following fractional flow. Historically, such fluctuation have been considered as indicative for failed experiments and often led to dismissal of the experiment. That is potentially the reason why despite extensive literature on steady-state relative permeability in only relatively few cases the raw data is shown. Even in the cases where pressure drop as a function of time is shown, it is often not clear whether this data is filtered or smoothed, operating under the assumption that the fluctuations are caused by noise.
Also, pressure fluctuations are more prominent for water-wet rock and much less visible for intermediate or mixed-wet cases (Jung et al., 2016; Lin Q. et al., 2018; Lin et al., 2019a), where the magnitude of capillary pressure is much less or even near zero (Lin et al., 2019a). Experiments conducted on twin samples of the same rock to exclude all other factors show noticeable fluctuations in the water-wet case (Lin Q. et al., 2018) but much less in the intermediate-wet case (Lin et al., 2019a), which has been achieved by aging with crude oil. In the intermediate-wet case, capillary pressure is near zero, because the mean curvature is near zero, which has been established from imaging the liquid-liquid interfaces by micro-CT. But that does not mean the interfaces are flat, but rather form bi-continuous interfaces that allow both aqueous and oil phases to be continuous at the same time, i.e., fractional flow does not cause displacement events, which is the primary reason why pressure fluctuations are less. Wettability heterogeneity may also impact the magnitude of fluctuations due to the associated energy dissipation (Murison et al., 2014). Also, fluctuations are stronger for a gas-liquid system and more often reported explicitly (Alkan and Müller, 2008; Reynolds and Krevor, 2015; Xu et al., 2015; Spurin et al., 2020), which suggests that viscosity ratio may be an important factor, which has been also reported in (Spurin et al., 2019).
Pore scale experiments (DiCarlo et al., 2003; Moebius and Or, 2012; Berg et al., 2013, 2014; Armstrong et al., 2014a; Reynolds et al., 2017; Lin Q. et al., 2018; Lin et al., 2019a) and numerical simulations (Lenormand et al., 1983; Raeini et al., 2014; Armstrong et al., 2015; Guédon et al., 2017; Alpak et al., 2019; Berg C. F. et al., 2020; Winkler et al., 2020) also exhibit fluctuations in pressure and saturation (Ramstad and Hansen, 2006; Pak et al., 2015), which are caused by pore scale displacement events, such as Haines jumps and coalescence (Rücker et al., 2015b), where the non-wetting phase replaces the wetting phase and snap-off and piston-like displacement (Lenormand et al., 1983; Dixit et al., 1998), where the wetting phase replaces the non-wetting phase. These events lead to interruption and rearrangement of the connected pathways the respective phases flow through (Tuller and Or, 2001) and are described by a rigorous theoretical framework of pore-scale thermodynamics (Morrow, 1970). Depending on flow rate and other conditions (Avraam and Payatakes, 1995a; Lenormand and Touboul, 1998), there are different regimes that can cause fluctuations in pressure and saturation that have been systematically investigated in Avraam and Payatakes (1995a); Tsakiroglou (2019). The main regimes identified were connected pathway flow, ganglion dynamics and drop traffic. While sequences of oil-filling and water filling events of different nature cause ganglion dynamics (Rücker et al., 2015b) already at capillary numbers below Ca < 10−6, effects such as ganglion dynamics, where such events occur repeatedly at the same location (Lenormand et al., 1983; Datta et al., 2014a,b; Gao et al., 2017, 2019, 2020; Spurin et al., 2019), are often observed close to the critical capillary number for capillary de-saturation (Berg and Cense, 2009) and likely caused by viscous mobilization and associated breakup, which can in the extreme case lead to “drop traffic” (Avraam and Payatakes, 1995a,b). Note that in the porous media literature, the term “intermittency” is frequently used instead of ganglion dynamics. However, outside the porous media community, this term is commonly associated with turbulent flow, which could lead to misconceptions as in porous media, and this behavior is often observed already in the capillary dominated regime. Periodic pressure fluctuations can also be caused by snap-off of non-wetting phase bubbles at the outlet although this is a mechanism observed more in spontaneous imbibition (Unsal et al., 2007a,b; Unsal et al., 2009; Bartels et al., 2019). While the exact pore scale mechanism can differ, the pressure signature is typically caused by capillary effects in a capillary-dominated regime (Singh et al., 2019). A recent pore scale simulation study that shows such fluctuations caused by pore-scale displacement events introduced the term “athermal” to characterize the energy scale of these fluctuations (Winkler et al., 2020).
The referenced literature suggests that these non-thermal fluctuations are a relatively universal phenomenon occurring in a very wide range of rock types and are observable on different scales. The key step that has been missing so far is a direct link between pore-scale fluctuations and Darcy scale behavior, which is the focus of this paper. This link between fluctuations observed in core flooding experiments at a length scale of several centimeters and their origin from pore scale displacement events is important because from both a very fundamental perspective and also for practical reasons. It is important to understand whether fluctuations are caused by pore scale displacement events, because such events are always to some extent irreversible and associated with the dissipation of energy (Morrow, 1970; Seth and Morrow, 2007; Berg et al., 2013). The big question is whether this energy dissipation by pore scale events is correctly captured when using time-averaged pressure and saturation data. At this moment, we do not fully understand the consequence of the averaging in case that fluctuations are not just noise but indeed caused by pore scale displacement events. Also, for the interpretation of such experiments by inverse modeling to determine the relative permeability (Berg S. et al., 2020), for a correct assessment of the associated uncertainty, it is important to understand whether fluctuations are noise or have another cause, e.g., a physical mechanism.
In this work we address this question of the link between fluctuations and pore-scale displacement events by analyzing the magnitude and statistics of Darcy scale “steady-state” fractional flow experiments for different rocks and fluid/fluid/solid wetting and comparison with pore-scale fractional flow experiments with synchrotron beamline-based fast x-ray computed tomography. We will discuss the reason why fluctuations involve hundreds or more pores. From a pore scale perspective alone, this would not be very obvious, because fluctuations are mainly associated with individual pore scale displacement events and larger fluctuations are interpreted from the pore scale perspective as ganglion dynamics. The dominance of fluctuations involving hundreds to thousands of individual pores becomes understandable as in the transition to the Darcy scale fluctuations can only persist if a permissible (Darcy-scale) fractional flow solution exists, for which we will present supporting evidence. That emphasizes the need to presenting both the pore scale and the Darcy scale perspective on the same phenomenon. Each experiment has significant complexity, which cannot be fully covered in this work, which focuses very much on the link between pore and Darcy scale. Therefore, we largely rely on thoroughly conducted experiments on each scale using dedicated experimental setups that are designed to rule out instrumental artifacts, i.e., avoid back pressure controllers and other potential source of fluctuations other than the ones caused by the multiphase flow in porous media. We make use of the best experimental data that are unfortunately not conducted on exactly the same sample. We use Fontainebleau sandstone for Darcy scale experiments and sintered glass of comparable pore size at the pore scale. The phenomena found in the sandstone sample and the sintered glass are comparable, which is also established through consistency with other studies in the literature, which suggest that phenomena are actually generic and observed in many different rock types. The experiments we present here have the highest level of confidence to rule out such artifacts, which is why we gave priority over fully consistent samples. Ultimately, the pressure signature but also associated fluctuations in connectivity (McClure et al., 2016) (which in the Darcy scale experiments is represented by electrical resistivity) (Liu Z. et al., 2018) provides the connection between Darcy scale fluctuations and pore scale displacement events.
Methods and Materials
Two different set-ups were used in this study to relate pore-scale mechanisms with Darcy-scale responses. The different set-ups, sample preparation and analysis are described below.
Rocks and Fluids
For the Darcy scale experiments, a cylindrical Fontainebleau sandstone sample with a diameter of d = 2.54 cm and a length of L = 4.45 cm was used. Fontainebleau sandstone is a fine-grained, well-sorted cretaceous sandstone outcropping in South France, well-known for its regular grain framework, the almost mono-mineral composition up to 99.5% quartz and for the absence of clay in it (Jacquin, 1964; Al Saadi et al., 2017). The rock sample had a porosity of ϕ = 0.13 and a permeability of Kabs = 5.32 ×10⁻¹³ m2 (539 mD). This permeability is particularly well-suited for special core analysis (SCAL) steady-state flow experiments, because it falls in the middle of the operating envelope of the setup, which has a maximum accessible permeability of about 2–3 Darcy. Before the experiment the rock sample was cleaned in a chloroform-methanol azeotrope in a Soxhlett extractor to complete water wetness. The sample was not aged with crude oil and only inert fluids were used, which means that the rock remained strongly water wet.
In a second series of Darcy scale experiments addressing the effect of wettability through variation of fluids, 3 cylindrical rock samples of Bentheimer sandstone rock (Lin et al., 2019a,b) with 5 cm length and 3.8 cm diameter were used. The porosity ranged between 0.246 and 0.248 and the permeability between 2,577 and 2,642 mD. The samples were cleaned with by Soxhlett extraction and then saturated with brine for permeability measurements. The three rock samples were then de-saturated with 3 crude oils (basic properties are listed in Table 1 and analysis results of total acid number (TAN), total basic nitrogen (TBN) and SARA are listed in Table 2) and subsequently aged (Lin et al., 2019b) for 40 days. Based on an extensive analysis of the crude oils, the potential for wettability alteration is highest for crude 3, somewhat less for crude 2 and least for crude 1, i.e., it is expected that for crude 1 the Bentheimer rock remains more water wet, whereas for crude 3, the rock is expected to become more intermediate wet.
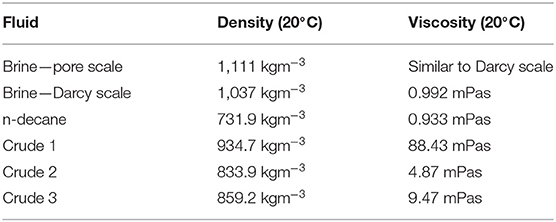
Table 1. Fluid properties in pore-scale and Darcy-scale SCAL experiments.
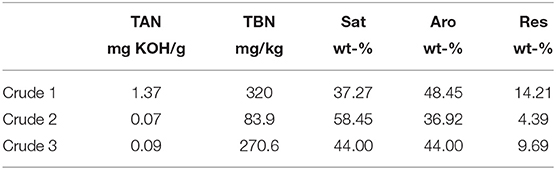
Table 2. Analysis of the 3 crude oils in terms of total acid number (TAN), total basic nitrogen (TBN), and the SARA analysis in terms of saturates (Sat), aromats (Aro), and resins (Res).
For the micro-CT (pore-scale) flow experiments, a sintered glass model purchased from Robuglass (Berg et al., 2014) was chosen because of its large pores that are particularly well-suited for imaging pore scale fluid distributions, i.e., much more suitable than the very narrow pores of Fontainebleau sandstone. The sample had a diameter of Ø = 4 mm and a length of L = 2 cm. The porosity determined from a segmented micro-CT image was ϕ = 0.36. The permeability of Kabs = 1.38 ×10⁻¹¹ m2 (14 D) was obtained from numerical flow simulation with the Navier-Stokes solver from GeoDICT (Math2Market) (Berg and van Wunnik, 2017). This permeability is too high for the SCAL steady-state experimental setup (the associated pressure drops are too small for the range of the pressure transducers). The sample is naturally (from the sintering process) clean and strongly water wet.
The fluids used in both experiments was n-decane and brine doped for contrast with 14.3% CsCl in the pore-scale experiment and 5% in the Darcy scale experiment. Density ρ and viscosity μ of the fluids are listed in Table 1. The interfacial tension was around 40 mN/m. Decane and brine don't form any emulsions, which might hypothetically also cause pressure fluctuations (Cobos et al., 2009; Yu et al., 2019).
“Darcy Scale” Fractional Flow Experiments
The Darcy scale experiments were conducted in an experimental setup, which is routinely used for measuring relative permeability with the so-called “steady-state” method, where water and oil phases are co-injected at fractional flow:
where qα are the fluxes and λα = kr, α/μα the mobility of phase α, with the relative permeability kr, α and viscosity μα (α = w for wetting phase and α = n for the non-wetting phase). The co-injection at fw is realized by two dual-piston Quizzix pumps (Chandler, Metek) that operate with zero-dead volume switching valves for smooth and pulse-free continuous flow (Vindum Engineering). Fluids are re-circulated (after separation) without any back-pressure controller that could cause artifacts such as pressure oscillations. The core is enclosed in an X-ray transparent Hassler-type core holder made from carbon fiber epoxy composite that allows in-situ saturation monitoring by a self-built X-ray transmission system that measures saturation at 22 positions along the core (Cense et al., 2014). During the experiment, the pressures drop dPw is monitored at a 1 min time interval and saturation Sw and resistivity at a time interval of 8 min 30 s. The conceptual overview of the setup is displayed in Figure 1A.
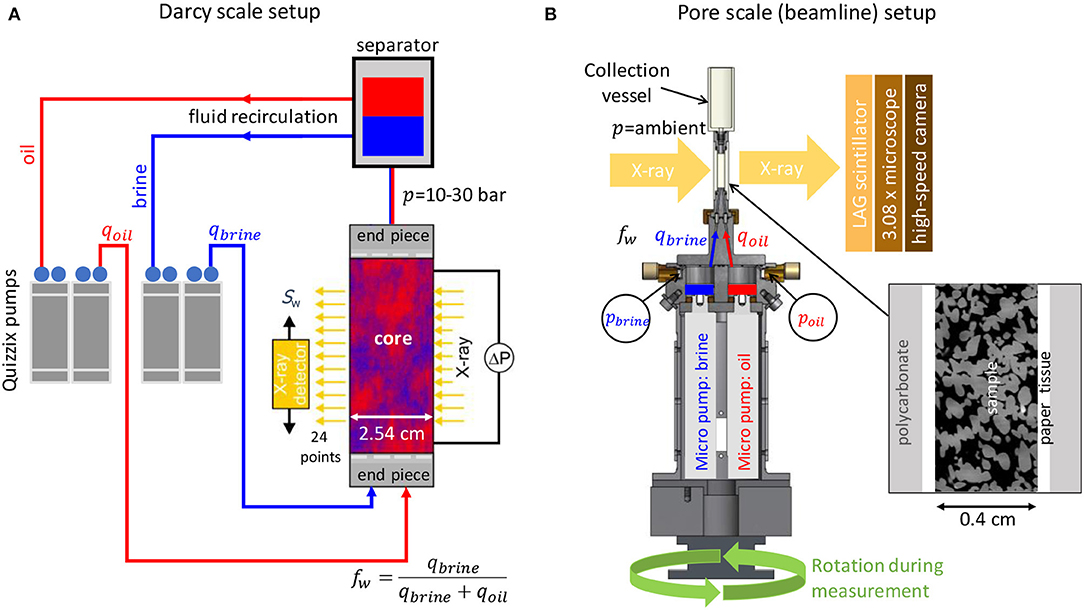
Figure 1. Experimental setups for the Darcy-scale fractional flow “SCAL” experiments (A) and pore scale “beamline” experiments (B). In the Darcy-scale experiments oil and brine are co-injected at varying flow rates and fractional flow fw with 2 dual-piston Quizzix pumps that operate with zero-dead volume switching valves for smooth and pulse-free continuous flow. Fluids are re-circulated (after separation) without any back-pressure controller. Saturation is measured in-situ during the experiment using a linear X-ray scanner. The micro-CT setup (B) uses a core holder with 2 integrated micro-pumps (Berg et al., 2013) for water and oil co-injection at specified fractional flow fw. At the outlet side the fluids are collected at ambient pressure, i.e., no back-pressure control system is used. The porous sample is wrapped with paper (for a hydrophilic boundary condition) and heat-shrunk into a poly-carbonate cylinder. The setup is self-contained as it is rotating during the micro-CT scans, i.e., no external flow lines are used. Power is supplied via slip rings and the pressure sensor readings are transmitted with a wireless system.
At the inlet, the oil and water supplied by 1/16 inch tubing are first dispersed by a set of diffusor plates with two rings of concentric circular grooves followed by a metal mesh (both at same cross section as the core) before entering the core. A similar end piece construction is used at the outlet.
Starting with primary drainage, the fractional flow fw was systematically changed from 100% brine (fw = 1) to 100% oil (fw = 0), followed by 1st imbibition cycle, where the fractional flow fw was systematically changed from 100% oil (fw = 0) to 100% brine (fw = 1) in 10 saturation steps each. The total injection rate of qw+qo was thereby kept constantly at 3 ml/min. That corresponds to a capillary number of Ca = 10−5, which is still smaller than the onset of capillary de-saturation in imbibition and 1–2 orders below the onset of capillary de-saturation in drainage (Berg and Cense, 2009) but also high enough to suppress any capillary end-effect (Huang and Honarpour, 1998).
At each saturation step fw, the saturation and phase pressures were recorded when, based on a constant pressure with a variation of the respective average being <1%, steady state was reached. The pressure readings were obtained with differential pressure transducers (Rosemount, type 3051 with an accuracy of ±0.15%) (Kokkedee et al., 1996). In addition, conductivity and saturation profiles at 30 positions along the rock sample were measured. The saturation profiles were obtained by X-ray transmission measurements calibrated to both 100% brine and oil saturation. The X-ray transmission is measured using a home-built linear X-ray scanner with a conventional X-ray tube and semiconductor-based detector, which makes individual point measurements (after an 8 min 30 s average to achieve sufficient signal-to-noise ratio). For details on the equipment, sample preparation, measurement procedures and analysis were published in previous studies (Kokkedee et al., 1996; Berg et al., 2016; Berg S. et al., 2020). For the particular case of the strongly water-wet Fontainebleau sandstone sample, the saturation profiles along the sample Sw(x) (not shown) are flat as expected for a homogeneous sample and there is no noticeable capillary end-effect. The absence of saturation gradients allows us to directly compute the relative permeability-saturation relationships using the two-phase extension of Darcy's law for the phase fluxes
where kr, α is the relative permeability of phase α, K is the absolute permeability of the porous medium, μα is the viscosity and Δpα the pressure of phase α over sample length L.
Resistivity is measured by a 4-point impedance measurement technique using (blackened platinum) electrodes embedded into the end pieces of the core holder.
Micro-CT Beamline Experiments (PS)
The experiments were performed in 2012 at the TOMCAT beamline of the Swiss-Light Source Synchrotron at the Paul-Scherrer Institute, Villigen, Switzerland. The flow cell was specially designed for fractional flow experiments with two remotely controlled micro piston pumps (based on linear motors from Physics Instruments with a modified gear box for low-rate injection) enabling pulse-free continuous, low rate injection while performing 3D imaging (Berg et al., 2013; Rücker et al., 2015a). The pumps are built-into the core holder itself, which rotates continuously during the fast tomography in order to avoid any displacements caused by bending of flow lines. Flow lines of 0.8 mm diameter directly enter the bottom of the core, which has—because of lack of space—no extra diffusor plate. Since we only monitor the middle section of the core, the first section of the core acts as diffusor. The pressure of water and oil phases at injection side was monitored with 2 pressure sensors (Keller 2 MI), which transmitted the pressure data in real-time using a wireless method enabling a constant data acquisition in the field of view during the experiment. The conceptual overview of the setup is displayed in Figure 1B.
One full 3D image with a voxel size of 2.2 μm was recorded in 1 min. The reconstructed micro-CT images were further processed and segmented with the software package Avizo (ThermoFisher). Details on the flow cell, sample preparation, the experimental settings and image processing were described previously (Armstrong et al., 2014a; Rücker et al., 2015a). Further analysis was conducted with MatLab (MathWorks).
Even though at a resolution of 2.2 μm process such as film flow are not resolved anymore, such sub-resolution physics is effectively captured through the effective displacement events leading to filling of pores or changes in non-wetting phase connectivity, which is captured at this resolution.
The flow sequence included 3 fractional flow steps fw (fw = 0.8, fw = 0.5 and fw = 0.2), where at each fw the total injection rate qtot = qw+qo was increased step-wise from 3 μl/min to 30 μl/min and 300 μl/min. The associated capillary numbers, which will be shown later in more detail in Figure 13, are in the capillary-dominated regime below the critical onset for viscous mobilization (Oughanem et al., 2015).
The permeability of the segmented pore space (in the imaged field of view) Kabs was computed by using a Stokes flow simulation conducted with GeoDICT (Math2Market). In addition, for selected time sequences of 2-phase flow experiments, the permeability of water Kw and oil phases Ko was computed in a similar fashion. The respective connected pathway relative permeability for water kr, w and oil kr, o was then obtained by dividing by the absolute permeability, i.e., kr, w/o = Kw, o/Kabs.
Results and Discussion
One of the main findings of the Darcy scale experiment is that the raw data contains fluctuations which—while varying in amplitude significantly from experiment to experiment—have often a systematic trend with fractional flow showing often maximum amplitudes at intermediate fractional flows.
In section Fluctuations in “Darcy scale” Fractional Flow Experiments, a detailed analysis of the noise structure in Darcy-scale steady-state core flooding experiments is presented. The focus is less the resulting relative permeability, which is also shown for completeness, but rather the raw data itself. We make a clear distinction between instrumental noise with Gaussian distribution (noise as a random process would result in a Gaussian probability distribution, fully described by its mean and standard deviation) and fluctuations with much larger amplitude than the instrumental noise for which we can largely rule out any instrumental artifacts. In section Dependency of the Fluctuations on Wettability the effect of wettability on the observed pressure fluctuation is discussed.
Finally, in section Energy Scale of Fluctuations, the energy scale of the large fluctuations observed in the Darcy scale flow experiments is analyzed and identified as a capillary energy scale, which is orders of magnitude larger than the thermal energies, i.e., fluctuations are non-thermal and of pore-scale origin. In section Time Scale of Fluctuations the time scale of the fluctuations is put into perspective with other characteristic times scales encountered in multiphase flow.
In sections Pressure and Saturation Fluctuations in Micro-CT fractional Flow Experiments, Pore Scale: Breakup and Coalescence Processes–Ganglion Dynamics, Identification of Pore Scale Flow Regimes by Collective Cluster Dynamics and the Pressure/Saturation Signature of Ganglion Dynamics the results from the synchrotron-beamline based micro-CT flow experiments are presented. The pore scale events presented in section Pressure and Saturation Fluctuations in Micro-CT Fractional Flow Experiments have similar amplitude as the significant fluctuations observed in the Darcy scale experiments in section Fluctuations in “Darcy scale” Fractional Flow Experiments. The pore-scale event observed under fractional flow conditions show transitions between two discrete states, which provides a further analogy to the oscillatory fluctuations shown in section Fluctuations in “Darcy scale” Fractional Flow Experiments. This is another piece of evidence that the significant fluctuations observed in SCAL experiments are de-facto caused by pore scale events. Using the insight of the in-situ 3D imaging, in section Pore Scale: Breakup and Coalescence Processes - Ganglion Dynamics the underlying fundamental pore-scale mechanism of breakup and coalescence that constitute ganglion dynamics and cause such events are discussed. In section Identification of Pore Scale Flow Regimes by Collective Cluster Dynamics and the Pressure/Saturation Signature of Ganglion Dynamics the effective flow regimes are characterized on the basis of saturation and macroscopic capillary number. The pore scale events discussed in section Pressure and Saturation Fluctuations in Micro-CT Fractional Flow Experiments suggest that ganglion dynamics events are initiated by an imbibition cycle followed by a drainage cycle.
Fluctuations in “Darcy Scale” Fractional Flow Experiments
Differentiation of Capillary Fluctuations From Gaussian Noise
Fractional flow experiments, often also referred as the steady-state method, are routinely used to determine relative permeability from cylindrical rock samples. Two immiscible fluids, such as oil and water are co-injected at fractional flow fw (Equation 1) following a sequence of fractional flow steps that starts at fw = 1 (only brine) to fw = 0 (only oil) for a drainage experiment and vice versa for imbibition. In Figure 2 the raw data of the experiment, i.e., the pressure drop Δp, saturation Sw, and electrical conductivity are plotted for a drainage experiment in the Fontainebleau sandstone sample.
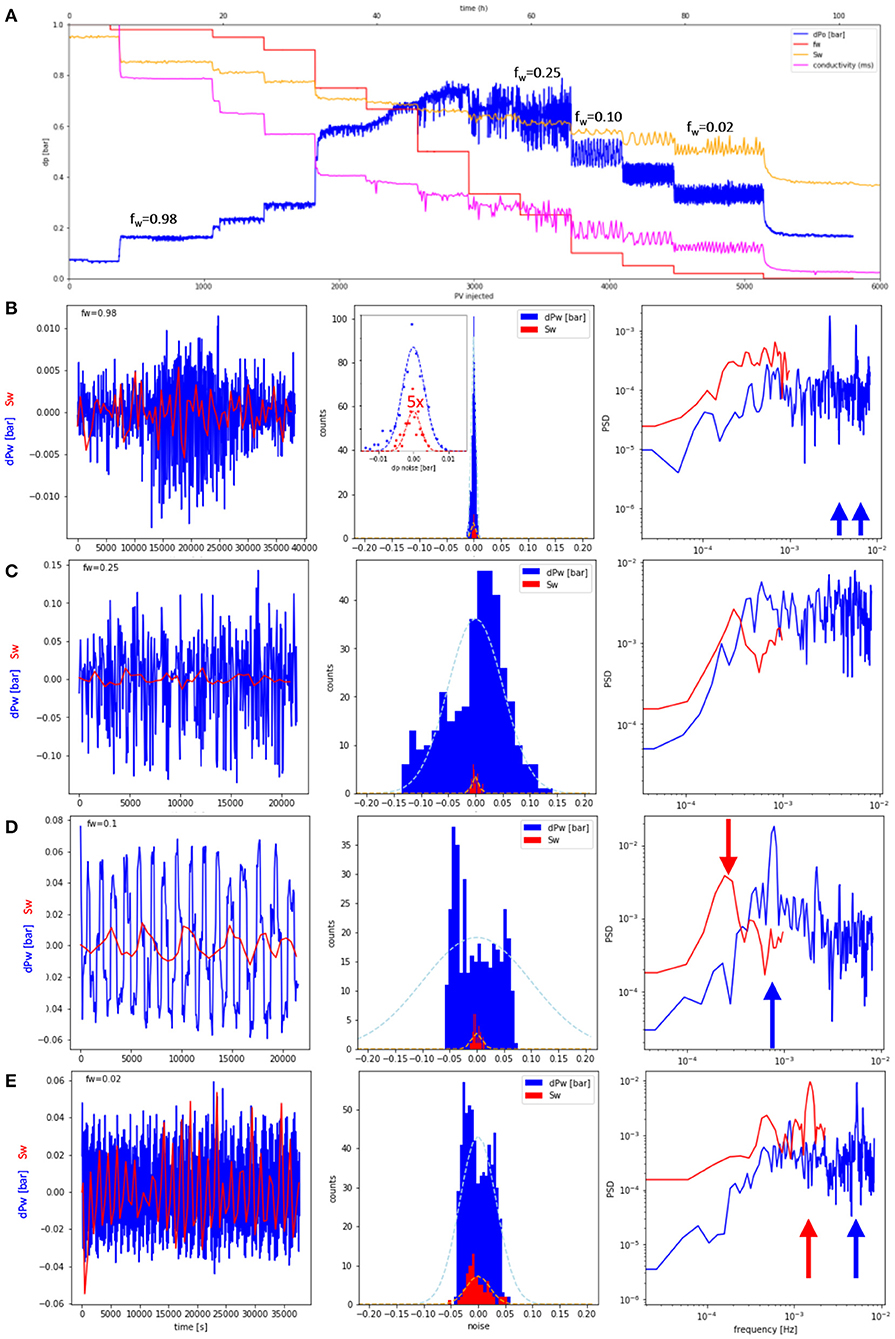
Figure 2. Water pressure drop dPw, water saturation Sw and electrical conductivity during a SCAL fractional flow experiment to determine relative permeability on a centimeter-sized Fontainebleau sandstone sample. Overview of the water pressure drop for all fractional flows fw (A) and fluctuations (with base line subtracted) for selected fractional flow vs. time for pressure (blue) and saturation (red), fluctuation histogram and associated power law spectrum (B–E). While the fractional flows fw ≥ 0.75, the fluctuation histogram follows a Gaussian shape (dotted light blue line in the middle in B–E) suggesting instrumental noise as cause. At 0.67 ≥ fw ≥ 0.02, the noise amplitude is significantly larger than instrumental noise and the histogram is clearly non-Gaussian and in most cases also non-symmetric and even bi-modal (D,E) suggesting other causes than instrumental noise. For some fractional flows, e.g., fw = 0.1 the pressure fluctuations are almost perfectly periodic (D) with an oscillation period of t ≈ 21 min, which is also reflected in a peak in the Fourier spectrum (marked with a blue arrow). Similarly, for Sw also perfectly periodic behavior can be observed, although at different frequencies (marked with red arrow), which could be potentially caused by the different sampling rates of dP (1 min intervals) and Sw (8 min 30 s intervals).
Figure 2A shows an overview of the whole experiment, where fw, pressure drop dPw, saturation Sw, and resistivity are plotted for a constant flow rate drainage experiment as a function of injected pore volumes (bottom axis) and time (top axis). Pressure drop dPw, saturation Sw, and resistivity show fluctuations that are very small for high fractional flows but increase for intermediate fractional flows significantly. For a more detailed view and analysis for each fractional flow, the fluctuations were isolated by subtracting the base line (using a moving average window). In the left panel of Figures 2B–E for 4 selected fractional flows, the isolated fluctuations for pressure drop dPw and saturation Sw are displayed.
In the middle panel of Figures 2B–E, the fluctuation histogram is shown. For fractional flows fw ≥ 0.75 (which is not a hard cut-off but rather based on the observations in the fractional flow sequence that has been established over several years as standard protocol), the histogram is symmetric and in good approximation of Gaussian shape, see also Figure 3, where the respective histograms for pressure and saturation fluctuations are fitted with a Gaussian. That indeed suggests instrumental noise as cause for the fluctuations. However, for 0.67 ≥ fw ≥ 0.02 the fluctuation histogram is clearly non-Gaussian as the middle panel of Figures 2C–E show (a Gaussian fit is added for visual comparison as dotted line). The histogram is not symmetric and for fw = 0.1 and fw = 0.02 has even a bimodal distribution (middle panel of Figures 2D,E). Pressure fluctuations range up to δdPw = ±0.15 bar and saturation fluctuations up to δSw = ±0.05, i.e., ±5 percent points.
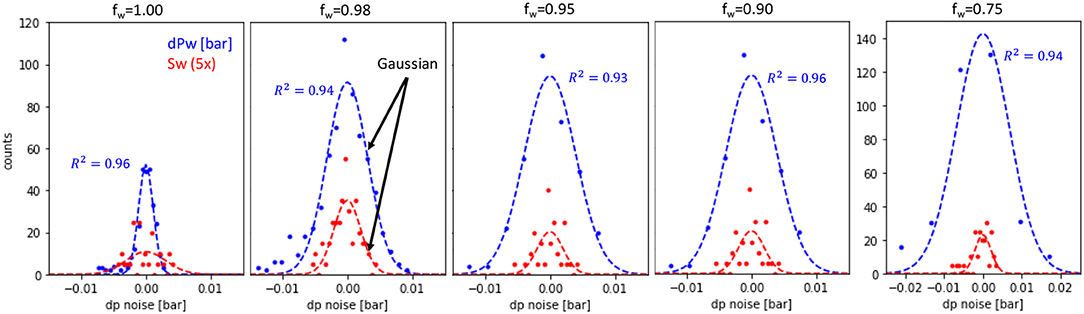
Figure 3. Pressure drop dp and saturation Sw fluctuation (Sw fluctuations were magnified by factor 5 for better visibility) from Figure 2 for fractional flows 1.0 ≥ fw ≥ 0.75 showing an almost perfectly Gaussian behavior (dotted lines represent a Gaussian fit to the respective data). For dp the correlation coefficient R2 is 0.94–0.96. For Sw the correlation coefficient ranges between 0.41 and 0.69, which is likely because of the lower signal-to-noise of the Sw data.
For these cases, the fluctuations are highly periodic, which is also reflected in the peak in the Fourier transform of the fluctuation time signal in the right panel of Figure 2. The fluctuation spectra for saturation (and electrical conductivity data in Figure 2A) differ from the pressure fluctuations, which could be a consequence of the different sampling rates. The pressure is sampled at 1 min time intervals, which means that fluctuations at a 2 min time interval are resolved. Saturation and resistivity are only monitored at an 8 min 30 s time interval. Faster fluctuations are not explicitly resolved.
When performing time averages of the detected signal, a smoothening operation commonly applied during the analysis of multiphase flow experiments in porous media, the fluctuations, which are initially clearly non-Gaussian and even bi-modal as in Figure 2E, become increasingly symmetric as shown in Figure 4. Here, a rolling average over a window of 2, 4 and 16 individual data points was used. After sufficient averaging, the histogram (Figure 4B) becomes perfectly Gaussian (which is a consequence of the central limit theorem) and the information this signal may have originally contained get lost, which has implications for the interpretation of the energy dissipation (McClure et al., 2020a,b).
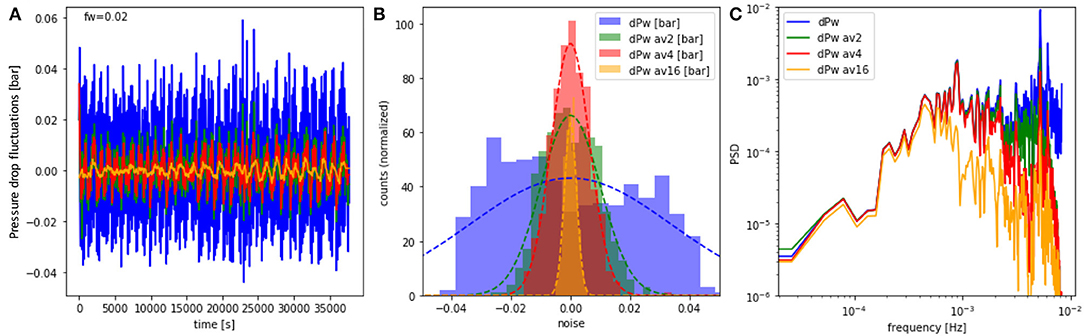
Figure 4. Pressure fluctuations for fw = 0.02 from Figure 2E, and rolling-averages over a window of 2, 4, and 16 data points (A). While the histogram for the original data (blue) set is bi-modal and clearly distinct from a Gaussian (dotted line), the histograms of the averages become increasingly symmetric and can be fitted very well with Gaussians (B). The Fourier spectrum (C) shows that smaller frequencies remain unaffected up to the frequency associated with the timer period of the averaging window.
For fw < 0.67, the pressure fluctuations δΔp are much larger than what would be expected from the behavior of the pure noise from instrumentation, which has been established based on amplitude and Gaussian shape of the histogram in Figure 3. The pure instrumental noise can be established from fw = 1.0, which corresponds to the injection of 100% brine into a fully brine-saturated rock without any oil, representing single-phase flow conditions. Nevertheless, the instrumental noise of the pressure transducer is proportional to the magnitude of the pressure. With δΔp∝Δp we can extrapolate a noise trend from the first 6 fw, which is illustrated by the dotted line in Figure 5A. In Figure 5B a similar approach was applied to saturation Sw (Cense et al., 2014). This way the fluctuations can be separated from the noise. Fluctuations falling into the noise regime (below the dotted lines in Figures 5A,B) can be either instrument noise or pore-scale events. But for the events with standard deviation significantly above that line, instrumentation noise can be ruled out entirely.
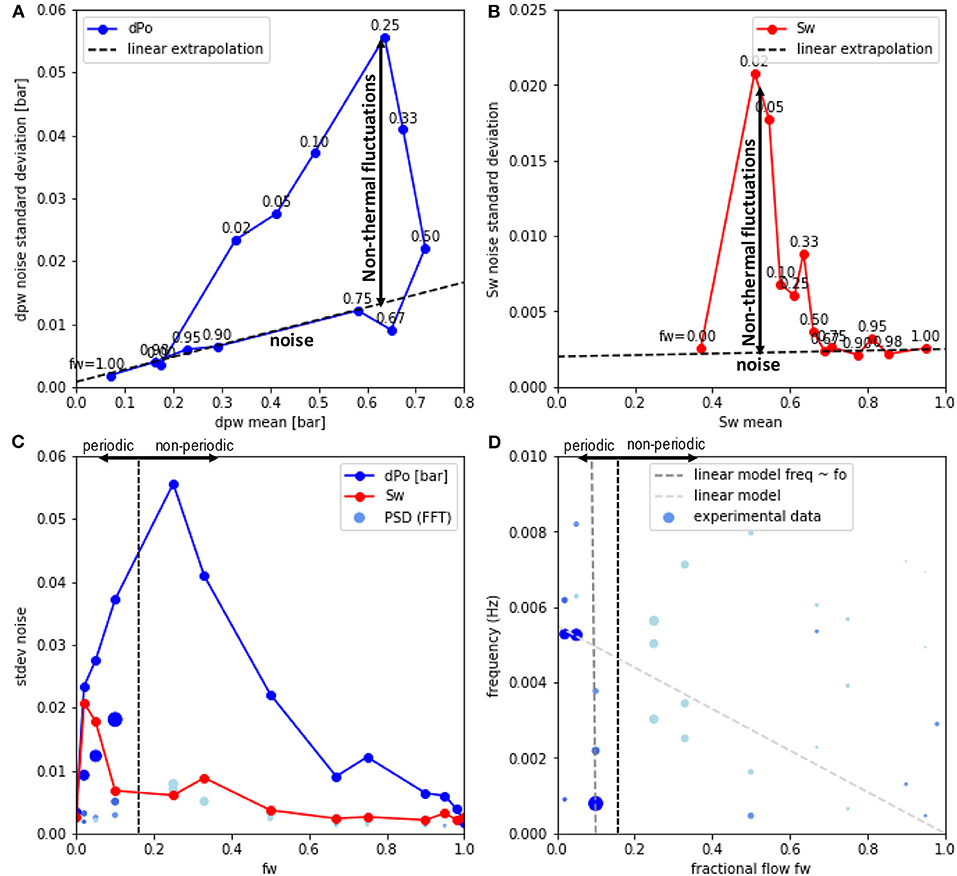
Figure 5. Separating the non-thermal fluctuations from instrumental noise: Standard deviation of the noise for pressure drop (A) and saturation (B) for each fw plateau (added as label for each point) in Figure 2A as a function of the respective mean values for each fw plateau. For the pressure drop Δp (A), for fw ≥ 0.67 an approximately linear increase is observed meaning that the pressure fluctuations are proportional to the mean pressure (dotted red line). But at fw < 0.67 the fluctuations are up to more than 3 times the value above the noise. The saturation (B) follows a somewhat similar behavior in the sense that the fluctuations can be much larger than noise. But there is no direct proportionality between pressure and saturation fluctuations. The maximum in fluctuations is observed also for different fw (C). The periodic fraction of the fluctuations characterized by the PSD of the FFT from Figures 2B–E (dot size represents peak amplitude and color its prominence) shows a somewhat similar trend with fw.Based on the magnitude of the periodic fraction one can divide the fluctuations into a periodic and non-periodic dominated regime. However, the frequency of the dominant peaks in the Fourier spectrum do not show any obvious systematic, e.g., linear dependency on fractional flow (D).
Differentiation of Capillary Fluctuations From Experimental Artifacts
As Figures 2–5 illustrate the strong pressure fluctuations do not occur for all fractional flows but primarily for fractional flows 0.5 < fw ≤ 0.02 as shown in Figure 5C, where the presumably both fluid phases are mobile and ganglion dynamics (Rücker et al., 2015b) is possible.
In order to characterize the periodic aspect of the fluctuations, the three largest peaks in the Fourier spectrum are displayed in Figures 5C,D. Note that in order to separate dominant peaks with significant amplitude from insignificant peaks the dot size represents peak amplitude and color its prominence (ratio of peak amplitude to that of the next peak). The same representation is used in Figures 5C,D. Based on the magnitude of the periodic fraction one can divide the fluctuations into a periodic and non-periodic dominated regime as indicated in Figures 5C,D. While Figure 5C suggests that fw is a control parameter for the magnitude of fluctuations in general, i.e., including periodic and non-periodic ones and also the magnitude of the periodic oscillations (PSD) initially scales with fw, the frequency of the dominant peaks do not scale with fw as shown in Figure 5D.
As already established in section Differentiation of Capillary Fluctuations From Gaussian Noise, the significant fluctuations occurring at intermediate fractional flows are not caused by instrumental noise. We can also largely rule out other artifacts from the experimental setup. These would manifest in a scaling of the periodicity with fo, which is not observed. Also, common effects known from traditional experimental setups for fractional flow, can be ruled out due to the design chosen in the outlined work.
In traditional set-ups one likely cause of fluctuations is the back-pressure control system. Membrane-based back-pressure regulators may oscillate when two immiscible fluid phases pass through simultaneously, or pumps with a servo control system for back-pressure control could potentially cause oscillations as well. However, in this particular setup the fluids were internally circulated, and no back-pressure control system was used, see Figure 1A. The two Quizzix feed pumps do use a servo control system for maintaining a constant flow rate. But that servo control system is only reacting on feedback of the pump piston movement, which is independent of the flow dynamics within the rock sample. Furthermore, if this set-up would induce fluctuations, then these would be visible at all fractional flows including fw = 1.0 and fw = 0.0. But, at these fractional flows no oscillations were observed.
The frequency of the dominant Fourier peaks does not show any obvious systematic, e.g., linear dependency on oil fractional flow fo = 1−fw. If—hypothetically speaking—the periodic oscillations were an instrumental artifact one would expect a dependency with the rate of oil injection, i.e., qo = fo · qtot at constant qtot. Doubling fo would then double the oscillation frequency. That was not observed. The dark-gray dotted line in Figure 5D representing such scaling with fo = 1−fw made to pass (by choice of a suitable offset) the dominant peak in the Fourier spectrum at fw = 0.1 (Figure 2D) does not pass the dominant peaks at fw = 0.05 and fw = 0.02 (Figure 2E). A more general linear model (light gray dotted line) does not describe the data either. It may pass through some of the dominant peaks but miss other dominant peaks of the Fourier spectrum. That clearly rules out any instrumental artifacts related to the regulation of oil fractional flow, or also injection instabilities into the rock, as they would all be expected to scale with oil injection rate, i.e., fo.
Analysis of Capillary Fluctuations at the Darcy-Scale
In order to gain deeper insight into the cause for the oscillations, which have also been observed in several independent pore scale experiments (Spurin et al., 2020; Menke et al., 2021), in Figure 6 we show the saturation profiles for fw = 0.1, which has the longest oscillation period and the sampling rate of saturation would be sufficient to resolve both pressure and saturation. A closeup of the pressure data from Figure 2D for the same time interval of saturation profiles is shown in Figure 6A. While the pressure data goes through 5 oscillations, the saturation shows only 2 full oscillations. The respective saturation profiles for the same time interval are shown in Figure 6B. For clarity, the saturation profiles have been vertically shifted. The wave structure is better visible in the space-time contour plot shown in Figure 6C.
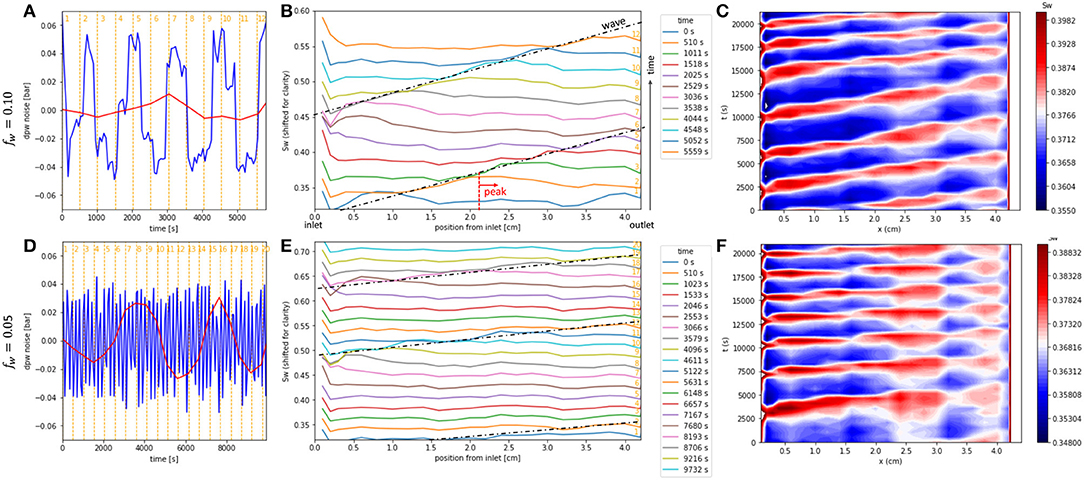
Figure 6. Pressure and saturation fluctuations for fw = 0.10 (limited range, 0–5700 s from Figure 2D) (A) and fw = 0.05 (D) showing pressure data in blue and saturation data (sampled at much lower frequency) in red. Respective saturation profiles (B,E, which have been vertically shifted for clarity) exhibit a water saturation peak, which moves from inlet to outlet at constant velocity, forming a traveling wave, which repeats one the peak reaches the outlet. The wave structure in (B,E) has been emphasized by adding the dashed black lines. The wave structure is better visible in the space-time contour plots in (C,F). For fw = 0.10 the wave velocity is vSw = 0.75 mm/min and for fw = 0.05 the wave velocity is between 1.7 and 2.1 mm/min.
The saturation profiles show a peak that travels from inlet to outlet at constant velocity. The dashed black lines in Figure 6B represent the wave, which is better visible in the space-time plot in Figure 6C. Even though Figure 6C may appear at first glance as a standing wave, a water saturation peak (red) moving horizontally from left to right at different times t (vertical coordinate). The fact that in the space-time plot in Figure 6C diagonal structures at constant angle and constant spacing are found suggests that the water saturation peak moves at constant velocity, which ultimately reveals a traveling wave structure, which through its repetitive pattern is emphasized in the space-time representation. A similar behavior is observed for fw = 0.05 shown in Figures 6D–F.
In the experiment the behavior was reproducible. In total, 3 drainage and 3 imbibition cycles were performed. The experiment started with the 1st drainage cycle arriving at connate water saturation of ~4%. It was followed by the 1st imbibition cycle arriving at a residual oil saturation of ~48%, which is typical for a strongly water-wet rock sample such as the non-aged Fontainebleau sandstone. Then the rock was cleaned in-situ by flushing with iso-propanol without removing the sample. Then the 2nd drainage and 2nd imbibition cycle were performed, followed by in-situ cleaning and finally conducting the 3rd drainage and 3rd imbibition cycle. The respective relative permeability computed from the raw data (such as the 1st drainage cycle from Figure 2) are displayed in Figure 7. For all 3 cycles the relative permeability data overlaps indicating excellent repeatability of the experiment. We observe overall larger noise amplitudes in the drainage cycles than for the imbibition cycles (not shown), which suggests that hysteresis may play a role.
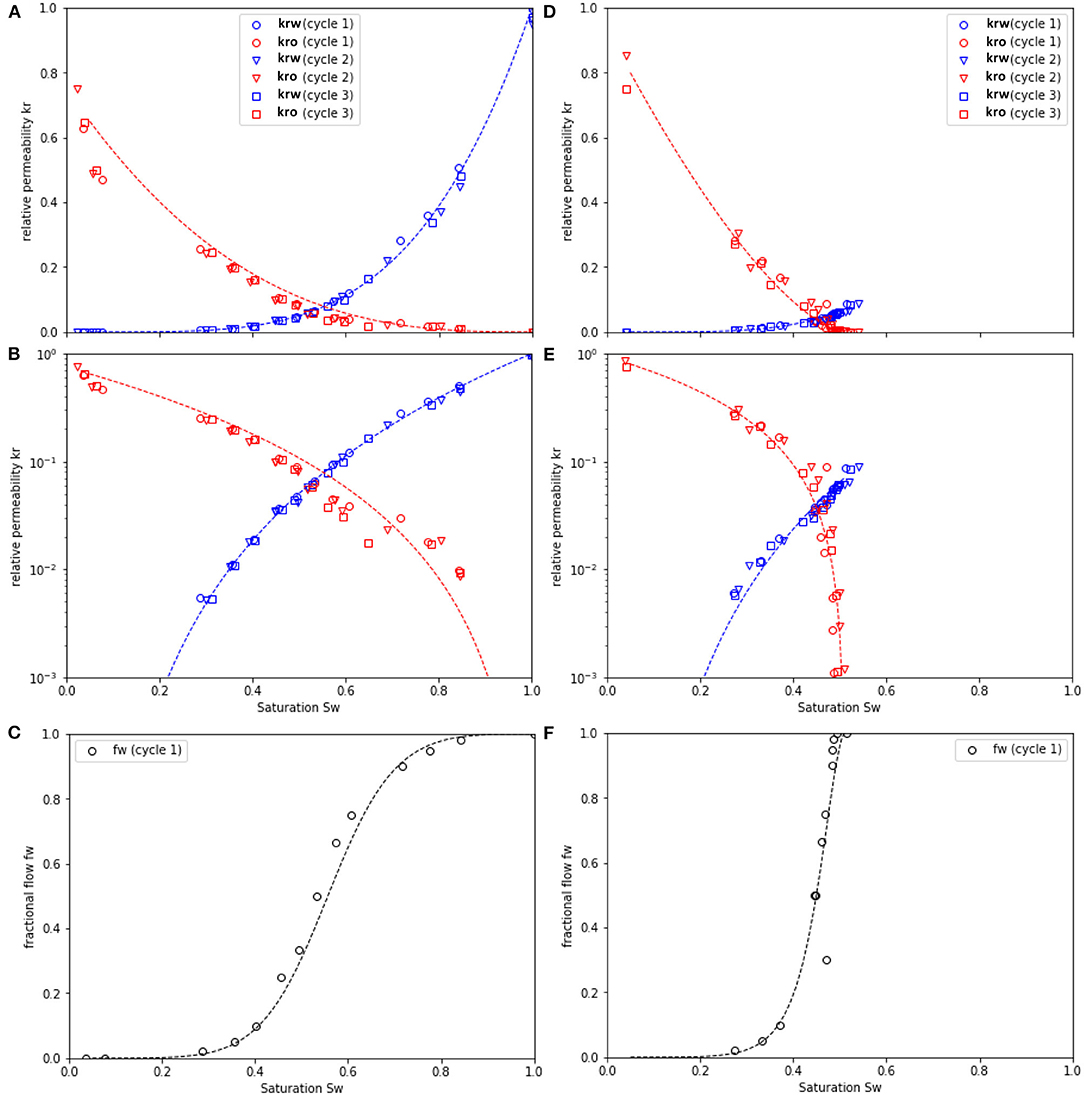
Figure 7. Relative permeability for water (blue) and oil (red) for the SCAL experiment with the strongly water-wet Fontainebleau sandstone sample for the 1st, 2nd, and 3rd cycles for drainage (A–C) and imbibition (D–F). Each cycle consisted of drainage, followed by imbibition, and sub-sequent in-situ cleaning of the sample with iso-propanol inside the setup without unmounting/remounting the sample. There is excellent repeatability between individual experiments. The dotted lines show a Corey fit of the data. The fractional flow functions fw(Sw) for the first drainage and imbibition cycle are shown in (C,F), respectively.
By comparing the speed of the traveling wave from the experiment with the prediction of fractional flow theory we can test whether the wave propagation is a simple fractional flow phenomenon. According to fractional flow theory, vD = xD/tD = dfw/dSw, which is shown as an inset in Figure 8B. xD = x/L is the dimension distance (L is the length of the core) and tD = PVinjected/PV the dimensionless time (PV=pore volume). For fw = 0.10 the wave velocity in the experiment is v = 0.76 mm/min, which corresponds to a dimensionless velocity vD = 0.46. For fw = 0.05 the wave velocity v is between 1.7 and 2.1 mm/min, which corresponds to dimensionless velocity vD = 2.1−2.6.
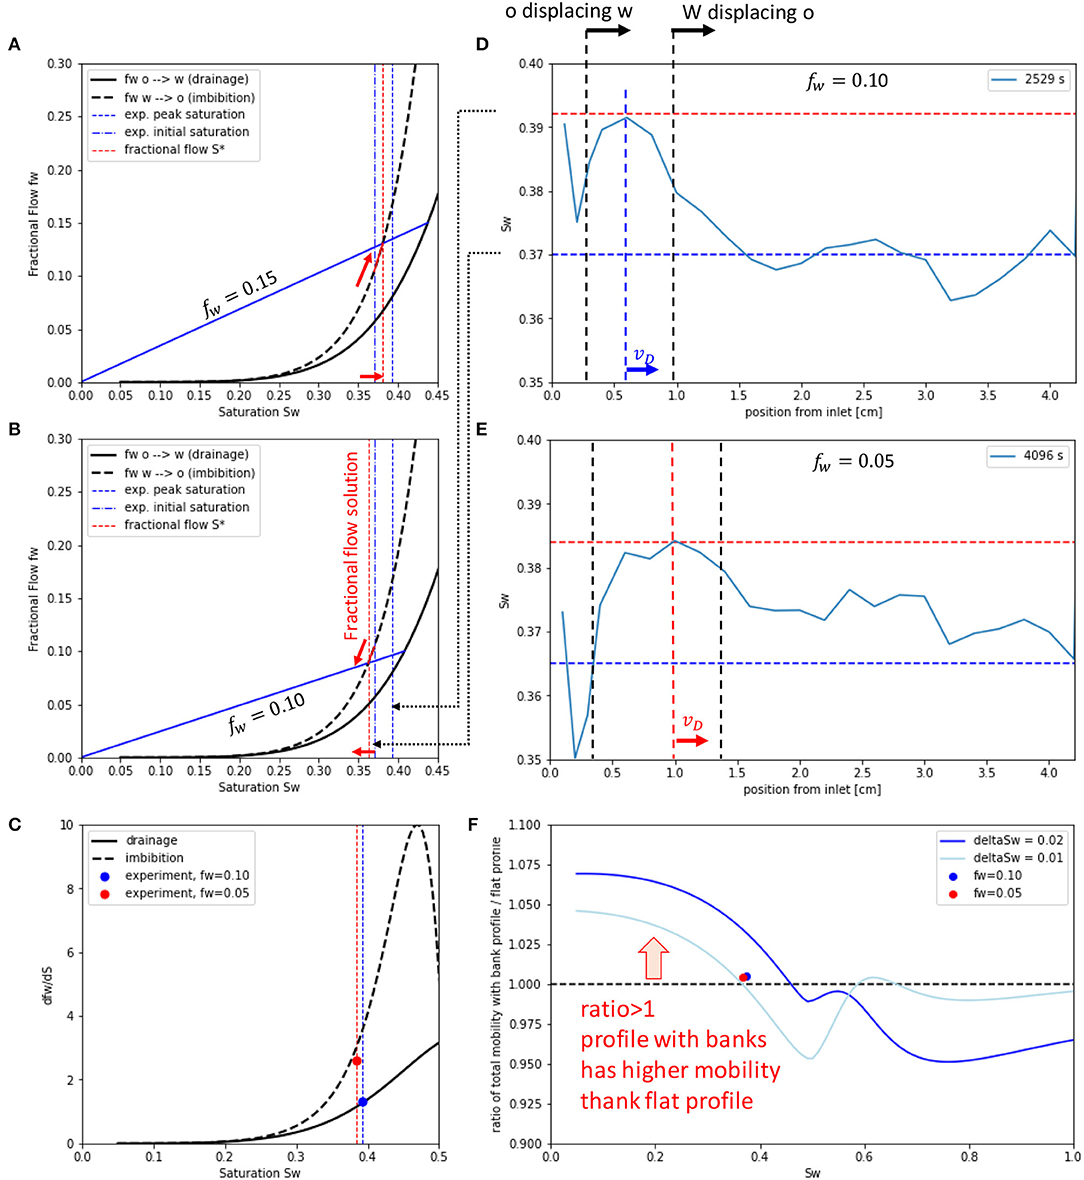
Figure 8. Fractional flow fw(Sw) (A,B) and the derivative vD = dfw/dSw (C) for fw = 0.15 (A) and fw = 0.10 (B) for the saturation interval corresponding to the top and bottom of the peak of the saturation waves (D,E). Representative examples of the wave profile are shown for fw = 0.10 (D) and fw = 0.05 (E). The wave for each fractional flow consists of a water peak moving from inlet to outlet, which has water displacing oil at the front and oil displacing water at the back. The respective fractional flow constructions are shown in (B), where the flow line is constructed from the intersection of the drainage fractional flow curve at respective fw step. The fractional flow solution is the intersection between the blue line with the imbibition fractional flow curve (Lake, 1984). Note that depending on the exact value of the initial saturations (D,E) there is an inflection point above which the water saturation from the fractional flow solution increases compared to the initial saturation (A), while below it decreases (B). That would imply a change from oil pushing a water bank (drainage) at to water pushing an oil bank (imbibition) for . That could explain why the experimentally observed wave velocities follow the prediction from fractional flow theory vD = dfw/dSw for drainage at higher fractional flows and the imbibition line for smaller fractional flows. That transition is within the experimental uncertainty between fw = 0.10 and fw = 0.05. A saturation profile with moving banks has an overall higher total mobility than a flat saturation profile for the saturation range Sw, c < Sw ≤ 0.4−0.5 (F). The two experiments at fw = 0.10 and fw = 0.05 are added as points, where for the computation of mobility, respective bank saturations and lengths have been taken from (D) and (E), respectively.
In Figure 8B, we show the fractional flow curves for the saturation range of interest, and in Figure 8C, the respective vD = dfw/dSw. For fw = 0.05, the experimentally measured vD is more compatible with the imbibition curve, whereas for fw = 0.10 the wave velocity is more compatible with the drainage curve. At first glance that appears somewhat inconsistent. However, when taking a closer look at the fractional flow construction involving two fractional flow curves, which is analogous to a moving an oil bank known, e.g., from polymer flooding (Lake, 1984), we notice a somewhat subtle detail, which is an inflection point around above which the water saturation of the bank (wave peak) increases compared with the initial saturation Sw, i for the respective flow. An example is shown in Figure 8A for fw = 0.15. If we consider the experimental uncertainties in terms of saturation measurements and instead of using dotted blue lines in Figures 8D,E as initial saturations but the lowest saturation observed, it is very well possible that in the experiment the inflection point is at . That would imply that for fw = 0.10 we have indeed a water bank pushed by oil (which is drainage) and for fw = 0.05 we would have an oil peak pushed by water (imbibition). From the experiment, it is difficult to distinguish between the two situations based on saturation profiles because the phenomenon is repetitive, and it is not fully clear, which phase is displacing and which phase is displaced. Within the experimental uncertainties, it is very well possible that the fw = 0.10 experiment is above , whereas the fw = 0.05 experiment is below the inflection point . That would explain why the experimentally observed wave velocities follow the prediction from fractional flow theory vD = dfw/dSw for drainage at fw = 0.10 and imbibition for the fw = 0.05 shown in Figure 8C.
The correct modeling of the traveling water peak involves hysteresis in the relative permeability-saturation functions. For the situation encountered in the experiment, the relative permeability would actually reflect a scanning curve, which needs to be considered in respective analysis (Plohr et al., 2001). Such traveling waves with non-monotonic saturation profiles are known to form under specific conditions for instance for infiltration of water into dry soil (Schneider et al., 2018; Kmec et al., 2019; Mitra et al., 2020) and can be theoretically described with a range of models ranging from generalized Darcy-scale formalisms with dynamic capillary pressure (Schneider et al., 2018) to hybrid models combining Darcy physics and pore scale aspects (Kmec et al., 2019). Mitra et al. (2020) provides a mathematical model, where for specific choices of parameters, the solution forms spirals in the Sw−pc space. The hysteresis model by Plohr et al. (2001) demonstrates that for specific choices of parameter values “loop”, i.e., recurring solutions can be found, which implies stable orbits in phase space (Strogatz, 1994). These consist of a sequence of water and oil bank, where the respective final saturation and fractional flow serves as an initial condition for the next wave sequence. In that way, the sequence becomes recurring. Although Corli and Fan (2018) raise questions around non-uniqueness, the principle does provide a reasonable working hypothesis about the origin of the periodic waves observed in the experiments.
Whether periodic wave structures are observed depends on the initial condition Sw, i for each fractional flow fw, the fractional flow fw and the underlying relative permeability functions, and potentially also the domain size L. It cannot be excluded that the large but non-periodic oscillations in Figure 2C are in the end related to the same fractional flow effect, but cannot form a closed loop (Plohr et al., 2001). More generally, phenomena at the Darcy scale are only visible if a permissible fractional flow solution exists, otherwise they would be dampened and a periodic trigger from e.g., initial or boundary conditions would decay.
Physical Interpretation of the Wave Characteristics of the Observed Fluctuations
While mathematically the solutions are permissible by fractional flow theory, the question is now why from a physical perspective a bank solution would form. A solution with moving banks would be plausible if, for the same total pressure drop, more total flux was transported than for a flat saturation profile. Whether that is the case can be assessed by computing total mobility for a flat saturation profile and compare it with the respective total mobility for the situation with moving banks. For the flat saturation profile the total mobility of water and oil phases, weighted with the respective fractional flow
using drainage relative permeability (because overall it is a drainage experiment). Note that the definition in Equation (3) is different from standard fractional flow theory and in that sense represents a pseudo-mobility. The weighting with the respective fractional flow is done in order to estimate the total flux based on the contributions of drainage and imbibition waves from segregated flow. For the situation with a moving bank, we assume based on the experimental observation that the saturation profile is composed of one water and one oil bank and compute the total mobility each bank separately. In absence of a rigorous fractional flow solution, which would first require a very detailed treatment for hysteresis, we simply estimate the top and bottom saturations by adding a typical saturation fluctuation amplitude of δSw = ±0.1 or δSw = ±0.2. For the water bank we use imbibition relative permeability and for the oil bank drainage relative permeability. We then weight the contribution of water and oil bank by their respective length in the saturation profile, i.e., the water bank is about 10–20% in terms length of the total saturation profile lw = 0.1−0.2 (see Figures 6C,F), i.e., . In order to assess whether the bank solution has higher mobility we divide λbanks/λflat, which is plotted in Figure 8F. We see that depending on the magnitude of δSw the bank solution has a higher mobility for saturations below Sw < 0.4−0.5, corresponding to approximately fw < 0.4, which is also the range in which the large fluctuations in pressure and saturation are observed (see Figure 5C). Note that the fractional flow picture does not capture the effects of capillarity, which can improve the microscopic sweep (Khorshidian et al., 2021).
The remaining question is what actually triggers the fluctuations in general and waves in particular. In the following sections, we will establish from pore scale fractional flow experiments conducted in a similar steady-state manner as the core flooding experiments in Figures 2–5 that periodic variations of pressure and saturation already occur on the oil-cluster scale and ultimately caused by pore scale displacement events (Berg et al., 2013, 2014; Spurin et al., 2020; Menke et al., 2021). The pressure and connectivity signature and 3D imaging of respective pore scale fluid distributions observed in the fractional flow micro-CT experiment suggest that pore scale displacement events are the underlying cause of fluctuations that are still visible in experiments commonly assumed at Darcy scale. They also likely provide the trigger for the waves from Figures 6C,F.
Dependency of the Fluctuations on Wettability
In order to investigate the dependency on rock wettability, a systematic study was conducted using twin samples of Bentheimer outcrop rock taken from the same block and selected for homogeneity and similar properties in terms of porosity and permeability. The rock was then de-saturated and aged with 3 different crude oils (“crude 1,” “crude 2,” “crude 3”) with properties listed in Tables 1, 2. In Figure 9 the raw data of the respective steady-state imbibition experiments (analogous to Figure 2A) are shown.
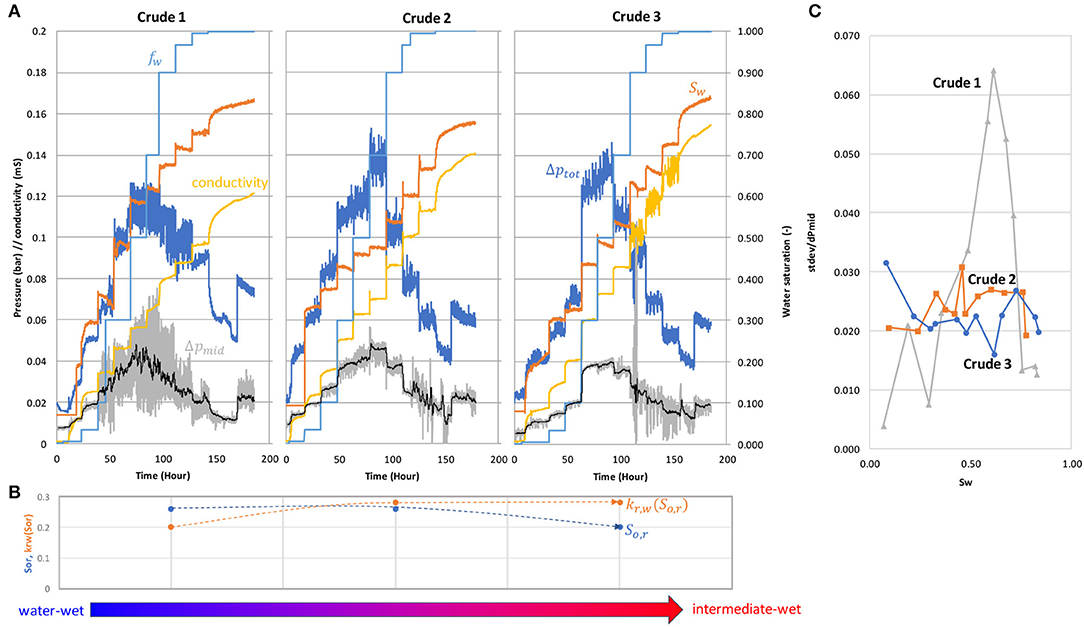
Figure 9. Dependency of the fluctuations on the wetting state of the rock. Pressure fluctuations are largest for the Bentheimer rock sample aged with crude 1 and become much smaller for Bentheimer samples aged with crude 2 and 3 (A). The trends for residual oil saturation So, r and water endpoint relative permeability kr, w(So, r) suggest that the wettability for the sample aged with crude 1 is more water-wet, whereas samples aged with crude 2 and crude 3 become increasingly intermediate-wet (B). The standard deviation of the pressure fluctuations normalized by the mean pressure for each fractional flow fw is largest for crude 1 (which is the most water-wet case) and becomes significantly less for crude 2 and 3 (C).
The pressure fluctuations are largest for the sample aged with crude 1 and become much smaller for Bentheimer samples aged with crude 2 and 3 (Figure 9A). Based on the trends of residual oil saturation So, r and water endpoint relative permeability kr, w(So, r) shown in Figure 9B the sample aged with crude 1 is the most water-wet case, whereas crude 2 and 3 become increasingly intermediate-wet. This confirms the experience in the SCAL community that significant fluctuations are mainly observed for water-wet cases.
When normalizing the standard deviations of the pressure fluctuations by the mean pressure along the lines of the learnings from Figure 5 we find that over-proportionally-large pressure fluctuations are only observed for the crude 1 case, i.e., the most water-wet sample. However, the trend toward crude 2 and 3 cases and respective wetting states seems highly non-linear and also not entirely consistent. For instance, in the crude 3 case we do observe fluctuations in electrical conductivity, which suggests that in intermediate cases fluctuations at the pore scale could still be present but due to the much smaller capillary pressure (Lin et al., 2019a) show a much smaller signature in the pressure but still are subject to ganglion dynamics. This is in line with pore-scale studies, in which fluid redistributions were still happening in mixed-wet scenarios, though much slower pace compared to water-wet situations (Rücker et al., 2019). At intermediate wetting states, the connectivity of the brine phase, which controls the electrical conductivity (Liu Z. et al., 2018), is perhaps also more sensitive to ganglion dynamics, because water-films may be overall less connected.
Energy Scale of Fluctuations
Figures 2–5 suggest that the pressure fluctuations not related to instrumental noise have amplitudes between 40 and 150 mbar and a standard deviation up to 55 mbar. Based on that magnitude we can identify the energy scale of the fluctuations.
We begin with a number of model calculations for typical pore body and throat sizes in sandstone rock of d = 25 μm diameter for pore throats and d = 60 μm for pore bodies (Berg et al., 2013). Assuming furthermore an interfacial tension of σ = 25 mN/m for a typical crude oil-brine system (water-decane with highest purity n-decane would be ≈ 50 mN/m but polar components in crude oil can reduce interfacial tension below 1 mN/m, therefore 25 mN/m is a good average value) we can estimate capillary pressure
(with contact angle θ ≈ 0° for a water-wet system and radius r = d/2) for a water-wet system as pc = 0.017 bar for pore bodies and pc = 0.04 bar for pore throats, which are also typical values for the pressure fluctuations in the steady-state experiment in Figures 2–5 (the maximum fluctuations can be a factor 3–4 larger but for most fw the range is very similar) (Berg C. F. et al., 2020). This suggests that the pressure fluctuations are likely caused by events on the capillary energy scale, which are typically pore scale events. Therefore, pore scale displacement events related to capillary instabilities (Singh et al., 2017, 2019; Primkulov et al., 2019) are the most likely cause for the significant fluctuations.
The associated pressure-volume work of displacing the wetting-phase by non-wetting phase fluid (Morrow, 1970).
In a pore body (ΔV ≈ 1.1 · 10−13m3 for a spherical pore) is 4.5 · 10−10 J and for a pore throat (ΔV ≈ 1.2 · 10−14m3) 4.9 · 10−11 J. This can be expressed in terms of thermal energy units kBT, where is the Boltzmann constant and T = 300K (≈26.7°C) the temperature arriving at and for pore bodies and throats, respectively, which is also summarized in Table 3. Since the associated energy of the pressure fluctuations is many orders of magnitude larger than kBT these fluctuations can be classified as non-thermal (Winkler et al., 2020).
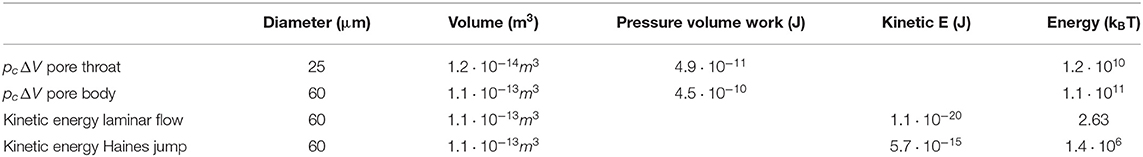
Table 3. Pressure-volume work (pcΔV) for model scenarios of immiscible displacement and kinetic energy for 1 ft/day flow in units of Joule (J) and thermal energy (kBT).
To put this into perspective, we can also estimate the kinetic energy that is associated with laminar single-phase flow at a typical injection rate 1 foot/day, which is typical for a water flood in oil reservoirs far away from the well bore, which translates for a porosity ϕ = 0.25 into a linear flow velocity of v = 1.4 · 10−5 ms−1 (Berg and van Wunnik, 2017).
The kinetic energy
is for an aqueous phase fluid with density ρ = 1000 kg m−3 around , which is roughly on the thermal energy scale.
The linear flow velocity during a Haines jump, which can be computed numerically with a phase-field type of method and validated with experimental data, is around v = 1.0 · 10−2 ms−1 (Armstrong et al., 2015). That translates into a kinetic energy of , which is again several orders of magnitude larger than the thermal energy scale.
Note that for pressure-volume work and kinetic energy of pore-scale displacement events there is always a range, which depends on the non-local nature of the Haines jumps, pore size, wetting conditions etc. The important point to make here is that the kinetic energy is orders of magnitude larger than the thermal energy scale, which is consistent with the classification as non-thermal fluctuations. Since the energy scale of these fluctuations is many orders of magnitude above the thermal energy scale, increasing temperature cannot trigger pore scale displacement events (unless phase changes or disintegration of material occur).
We observe pressure fluctuation amplitudes in the range of capillary pressure representative, typical pore throats of sandstone rock and indicative of pore scale displacement events as origin (Figures 2–5). However, the magnitude of the saturation change in relation to the volume of an individual pore suggests that many individual pores are involved in the phenomenon. The pore volume of the Fontainebleau rock sample is , whereas the pore volume of a single pore of d = 60 μm diameter is , which means that a saturation change of 5% needs to involve thousands of individual pores. The associated energy scale can be estimated as pc · Vpore, tot · δdSw with pc ≈ δdPw = 0.15 bar resulting in 0.043 J or , which is significantly larger than the energy scale of displacements involving individual pores.
That means that multiple individual pores are involved in these fluctuations. From a pore-scale perspective this is not too surprising as experiments have already shown that displacement events are not necessarily always isolated but can be cooperative causing avalanche-like cascading sequences of individual displacements adding up to an overall significant event, that involves many pores and lasts over a time period of between 0.5 and 2 s (Armstrong et al., 2014a). What is new is that the fluctuations measured at the Darcy-scale are periodic, which means that the respective pore-scale displacement events would also need to be repetitive under fractional flow conditions. In order to address that question, in the following sections time sequences of 3D imaging are presented, which give further insight into the pore-scale origin of the fluctuations.
Time Scale of Fluctuations
When comparing experiments of different scales, both, the magnitude of time and length differences need to be considered. The time series and frequency analysis of the pressure fluctuations shown in Figures 2, 4C, 5D suggest a frequency range of fluctuations between 10−3−10−2 Hz corresponding to a time period of T = 1/f = 1−20 minutes, which also reflects the dominant peaks in Figure 5D. The time scale of the saturation fluctuations is between 5 and 60 min, which is also about the time scale of the traveling waves from Figure 6.
In Figure 10, we put the time scale of pressure and saturation fluctuations and traveling waves into perspective with characteristic time scales encountered in multiphase flow in porous media. Displacement events in individual pores such as Haines jumps and snap-off are on the time scale around 1 ms (Armstrong et al., 2015). Cascading displacement events involving multiple pores show a relaxation time scale around one second (Armstrong et al., 2014a). The time scale of pressure fluctuations observed in this work, in particular the periodic oscillations in Figures 2–4, are on the order of 1–20 min, which is also the time scale of periodic pressure fluctuations reported in recent studies (Spurin et al., 2020; Menke et al., 2021) see also the supporting information of (Spurin et al., 2020). The time scale of the saturation fluctuations is 30–60 min, which is similar as the characteristic time of traveling waves from Figure 6, which is still faster than the slow relaxation behavior observed in (Schlüter et al., 2017).
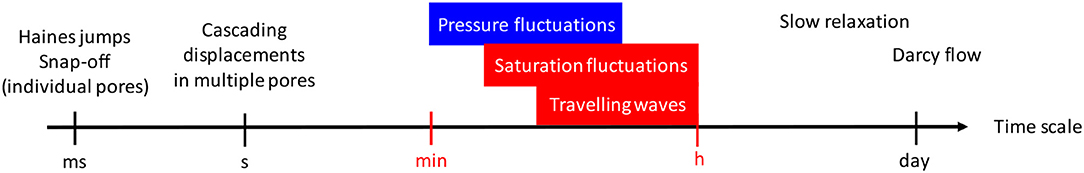
Figure 10. Time scale of the fluctuations observed in this work (red) put into perspective with other characteristic times scales encountered in porous media. Displacement events in individual pores such as Haines jumps and snap-off are on the time scale around 1 ms (Armstrong et al., 2015). Cascading displacement events involving multiple pores show a relaxation time scale around one second (Armstrong et al., 2014a). The time scale of pressure fluctuations observed in this work and related studies (Spurin et al., 2020; Menke et al., 2021) are on the order of 1–20 min and the saturation fluctuations and traveling saturation waves from Figure 6 are on the order of 30–60 min. That is still faster than the slow relaxation behavior observed in Schlüter et al. (2017). Darcy flow, e.g., at typical field rates of 1 ft/day over a characteristic length scale such as a capillary dispersion zone of 3–5 centimeters length occurs at 7–10 h.
Figure 10 suggests that in terms of time scale the pressure and saturation fluctuations observed in the SCAL experiments are a phenomenon ranging right between pore scale and Darcy scale flow physics (Khorshidian et al., 2021). Imaging at the Darcy length scale may not give further insights into the underlying mechanisms and pore scale imaging is required. Based on Figure 10, we can expect a time scale of the order of minutes, which means that imaging at the time scale of few seconds will be sufficient to resolve the phenomenon.
Pressure and Saturation Fluctuations in Micro-CT Fractional Flow Experiments
In the steady-state micro-CT flow experiment conducted at a much smaller sample (4 mm diameter, 2 cm length) also fluctuations in pressure and saturation are observed as shown in the example in Figure 11. These events are re-occurring between periods of meta-stable and predominantly connected pathway flow (Rücker et al., 2015b). Associated changes in pressure in Figure 11A and saturation in Figure 11B have similar magnitude as the fluctuation amplitudes in the SCAL steady-state experiment conducted at a much larger sample shown in Figures 2–5. The pressure fluctuation event in Figure 11 of 10–20 mbar amplitude is similar to the fluctuation amplitude in Figure 2C. The monitored fluctuations at the pore-scale are significantly larger than instrumental noise and are not caused by instrumental artifacts, which is evident from the larger scale analysis, the chosen experimental set-up as well as the additional information revealed by the imaging of the interior of the rock during flow (Figure 11).
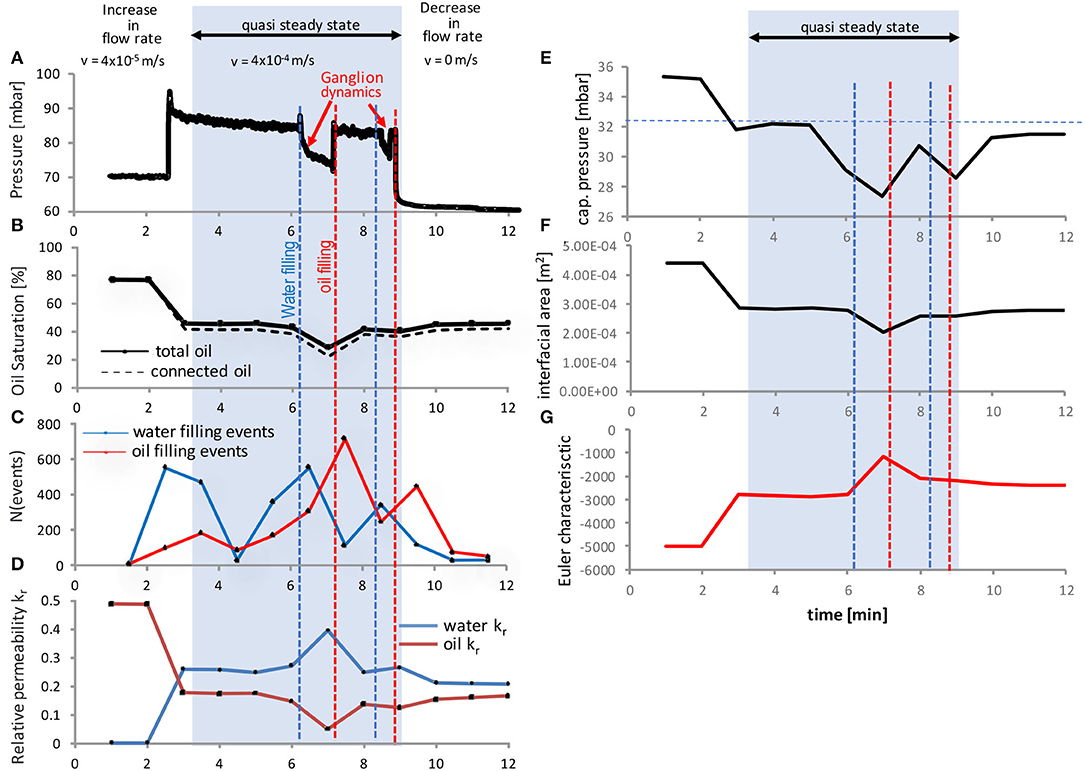
Figure 11. Pressure drop (A), water saturation (B), event statistics (C) connected pathway relative permeability kr of connected water and oil phases (D), capillary pressure pc obtained from the mean curvature (E), interfacial area, (F) and the Euler characteristic for the oil phase (G) for the experiment at fw = 0.5 and v = 4 · 10−4 m/s. The fluctuation events with a clear pressure and saturation signature are caused by a sequence of water and oil filling events. They are causing changes in the connectivity of water and oil phases as visible in the connected pathway relative permeability, which was computed by Stokes flow simulations of the imaged water and oil phases in relation to the (analogous computed) permeability of the respective pore space. The capillary pressure largely follows the saturation and connectivity behavior, which all typically lag behind water or oil filing events, respectively. Note that capillary pressure shows a clear signature also for the 2nd filling event, which is much less visible in saturation, interfacial area (Joekar-Niasar and Hassanizadeh, 2011) and Euler characteristic (Herring et al., 2013).
Note that—as discussed in section Energy Scale of Fluctuations—pressure fluctuations are mainly caused by capillary effects. Therefore, even though the micro-CT sample has a significantly larger permeability, but pore throat size distribution is actually similar to that of sandstone rock of comparable porosity and permeability as in the SCAL experiments (see Figure 1 in Berg et al., 2014), the magnitude of pressure fluctuations is similar.
These observed fluctuations and associated pore-scale events are related to change in fluid connectivity as the Euler characteristic (Herring et al., 2013), a mathematical measure for connectivity displayed in Figure 11G, and the connected pathway relative permeability computed from the fluid phases imaged by micro-CT displayed in Figure 11D shows. Even though the sample is significantly smaller than in the SCAL experiment, the associated saturation change is much bigger than the volume of individual pores, which implies that these events involve multiple individual pores. The event statistics, which was obtained by comparing 3D images of water and oil phases of subsequent time steps (Rücker et al., 2015b) displayed in Figure 11C show that the events observed in pressure and saturation consist of hundreds of individual pore level displacements.
That is consistent with cooperative displacements of advancing fluids fronts (Jung et al., 2016; Singh et al., 2017; Primkulov et al., 2019) and the observation in Armstrong et al. (2014a) with avalanche-like cascades of individual pore filling events operating overall at the cluster scale. The repetitive sequence of oil and water filling events are indicative of waves passing through the field of view, although the domain size in micro-CT experiments does not permit to resolve the spatial extent of the wave but rather see repetitive behavior in the average Sw. The event statistics in Figure 11C shows that the macroscopically-visible events start with sequences of water filling events, which are then followed by sequences of capillary-driven oil filling events, which may provide the trigger for the Darcy scale observations, where traveling waves of water saturation peaks were observed (Figure 6B) and permissible by fractional flow solutions (Figure 8), which operate in the viscous limit. This draws a direct connection between Darcy-scale observable flow regimes (which have to be permissible by fractional flow solution, otherwise they would be damped and decay) and cooperative pore-scale displacement behavior. It furthermore suggests that analogous to ganglion dynamics (Rücker et al., 2015b) the dynamics is initiated by snap-off which is a capillary instability, where capillary energy is converted into kinetic energy, which can then drive event cascades. The pore-scale fluid configuration eventually reverts back to the original situation in terms of saturation, pressure drop and connectivity of each phase as suggested by Figures 11A,B,D. There is a range of possible reasons from the bubble instability (Unsal et al., 2007a,b; Unsal et al., 2009), which can in principle also occur in large pores inside of rock, relaxation time scales (Armstrong et al., 2014a) being longer than the re-supply of injected liquid at fractional flow fw, questions about the energy efficiency of connected pathways (Spurin et al., 2021) and inertial effects during displacement events causing ganglion dynamics (Rücker et al., 2015b), which can all explain why established flow paths can become unstable and disconnection processes are followed by re-connection processes. The capillary pressure determined from the liquid-liquid curvature (see, e.g., Lin et al., 2019b) shown in Figure 11D largely follows the saturation and connectivity behavior, which typically lag behind water or oil filing events, respectively. The magnitude of the capillary pressure changes is about 10 mbar, which is significant and suggests that capillarity is involved in the process. The system can reduce its capillary energy by water filling events, but because of the flux and fractional flow boundary conditions, oil-filling events temporarily increase the capillary energy again. This suggests that the condition is not only viscous-unstable as the fractional flow assessment suggests, but also capillary unstable, based on the competition between minimizing potential energy (where capillary energy is a significant fraction) and fractional flow boundary conditions. Note that pore filling events in Figure 11C are computed from difference images, which is the reason why they may appear somewhat earlier than the capillary pressure response in Figure 11E, which are computed from only one image.
The question is now how we can use 3D pore scale imaging to understand more about the origin of these repeating events with cascading pore-level event structure.
Pore Scale: Breakup and Coalescence Processes—Ganglion Dynamics
In order to characterize the processes at the pore scale, we first establish a general insight into the evolution of oil clusters under fractional flow conditions, which is more complex than the ganglion dynamics during imbibition alone (Rücker et al., 2015b), because both wetting and non-wetting phases are permanently co-injected. One of the questions is how that co-injection at fractional flow fw is translating into the flow at pore scale, i.e., what the associated flow regimes are.
At the pore scale the fractional flow can be divided into time periods of connected pathway flow and time intervals with topological changes in the fluid configuration. These can be decomposed into a more imbibition-dominated regime with breakup of oil clusters by sequences of snap-off and piston-like displacement processes as shown in Figure 12A, and a more drainage-dominated regime with oil cluster growth by Haines-jumps and coalescence as shown in Figure 12B. Note that as clusters breakup /shrink or grow, also their length changes, which impacts the cluster-based capillary number (Hilfer and Oren, 1996; Armstrong et al., 2014b).
where Lcluster is the length of the respective oil cluster, μw the wetting phase viscosity, vw the wetting phase Darcy velocity, σow the wetting/non-wetting phase interfacial tension and θ the contact angle, and pc the capillary pressure at breakthrough.
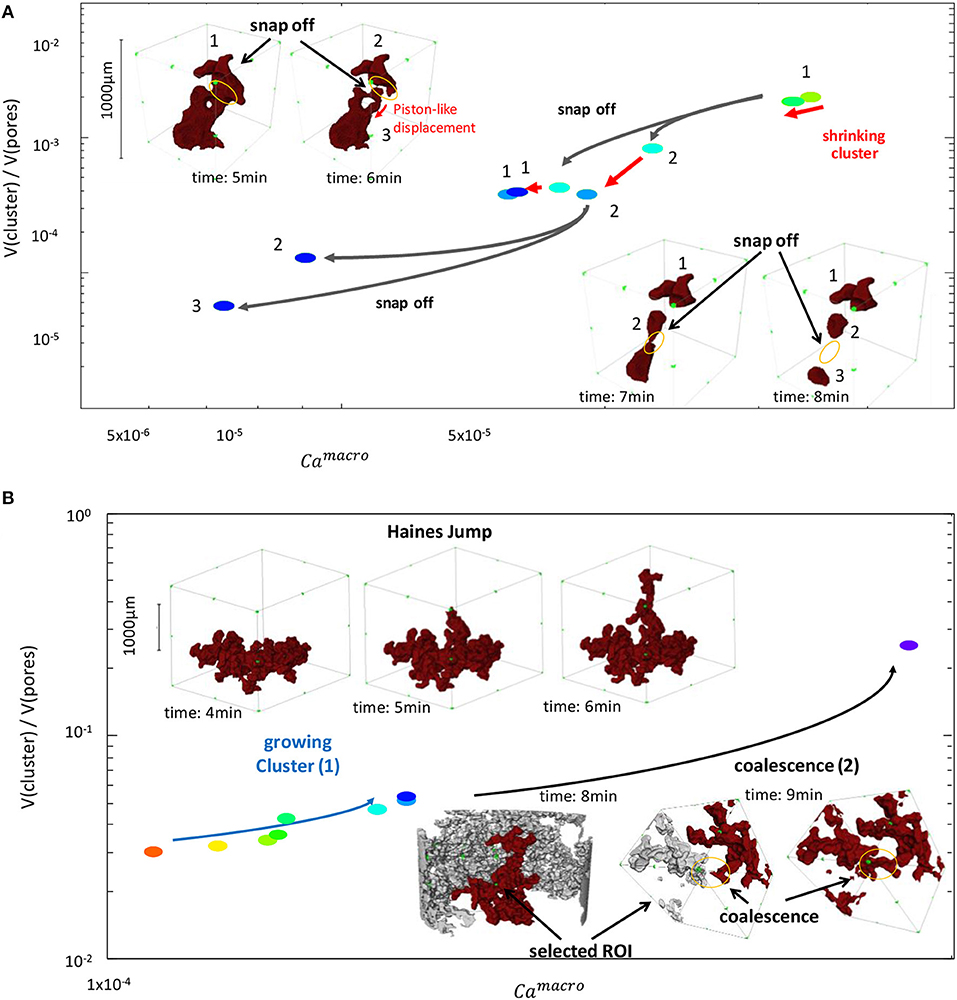
Figure 12. Breakup of oil clusters (A) and coalescence (B) processes at the pore scale. Breakup occurs often by simultaneous snap-off processes in a cluster thereby preserving topological loop structures (see insets in A). Clusters can also grow by coalescence, which is overall more a frontal propagation, whereby connectivity is maintained, and formation of loops is largely avoided. Both breakup and coalescence events impact cluster volume, i.e., saturation and cluster length, i.e., the macroscopic capillary number, which is proportional to the viscous pressure drop over the cluster length.
In that way, for each oil cluster an individual capillary number can be assigned, which is proportional to the cluster length Lcluster and increases or decrease according to how the cluster grows by coalescence or shrinks by breakup.
Figure 12 is based on actual data from the micro-CT flow experiment conduced in the sintered glass sample. Conceptually similar behavior is expected also in other porous media but may change in terms of quantity, because of e.g., different scaling of permeability over capillary pressure.
Note that these examples characterize local flow regimes. These local regimes can also dominate the macroscopic flow regime in a macroscopic drainage or imbibition experiment, but they can also co-exist, or alternate in time, in fractional flow.
Identification of Pore Scale Flow Regimes by Collective Cluster Dynamics and the Pressure/Saturation Signature of Ganglion Dynamics
The micro-CT flow experiments involved three different fractional flows fw = 0.8, 0.5, 0.2 and three different injection rates of qtot= 3, 30, 300 μl/min. Using the largest from the imaged cluster size distribution from Rücker et al. (2015a) these flow rates are then translated into the maximum cluster-based capillary number (Equation 7). The overview of all experiments is shown in Figure 13A in the fractional flow-macroscopic capillary number space.
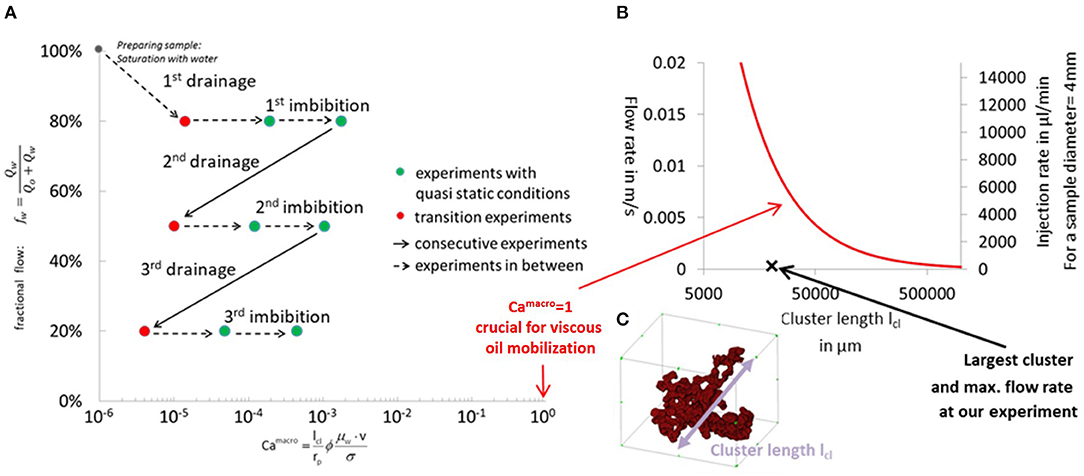
Figure 13. Fractional flows fw (0.8, 0.5, and 0.2) and cluster-based capillary number Cacluster from Equation (7) for the micro-CT flow experiments conducted at flow rates of 3, 30, and 300 μl/min (A). For all flow rates and fractional flows Cacluster ≪ 1, which means that the flow regime is capillary dominated. The bounding line for Camacro = 1, which is the transition to the viscous-dominated regime is plotted as red line in (B) in the flow velocity (left axis) and injection rate (right axis) vs. cluster length (C) space. Also, the largest cluster falls below this line even at the highest flow rate, which means that the flow regime is capillary dominated.
All measurements obtained fall significantly below the Camacro = 1 bounding line, which is the transition to the viscous-dominated regime as shown in Figure 13B. This means that in every respect the flow regime is capillary dominated below the onset for viscous mobilization (Oughanem et al., 2015).
Nevertheless, at specific saturations and higher flow rates we observe ganglion dynamic behavior as shown in Figure 11. In Figure 14 we show the respective pore scale fluid distributions. In Figure 14A shows an example for a connected pathway flow period without any significant fluctuations. In Figure 14B shows the pore scale fluid distributions for the fluctuating event from Figure 11.
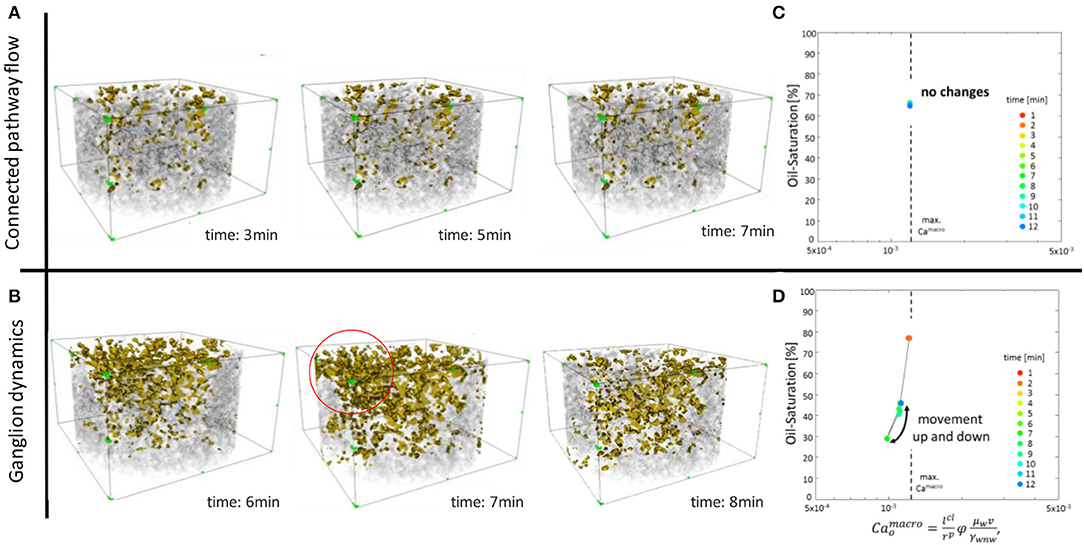
Figure 14. Pressure drop and saturation from Figure 11 show long time periods without any change but also time periods with discrete events. Based on the associated dynamics at the pore scale, respective pore scale flow regimes can be categorized into predominantly connected pathway (A) and ganglion dynamics (B). A “phase diagram” can be developed in analogy to Figure 12 but now for the whole field of view instead of individual clusters only, where connected pathway flow is characterized by a fixed point (C) and ganglion dynamics as trajectories (D) in the saturation-macroscopic capillary number space.
Figures 14C,D are an extension of the concepts from Figure 12 but now for the whole oil saturation in the imaged field of view and not only individual clusters, the capillary number is calculated using the a volume weighted average cluster length. The connected pathway flow regime is characterized by a single point in Figure 14C, whereas the fluctuating regime is characterized by a trajectory in Figure 14D. Based on that observation, the saturation-macroscopic capillary number space displayed in Figures 14C,D can be understood as “phase diagram”, where connected pathway flow is characterized by a fixed point and ganglion dynamics as trajectories.
The ganglion dynamic events from Figure 11 are characterized by a diagonal movement between two discrete states in the saturation-capillary number space as shown in Figure 14C. This repeated switch between two states is very similar as the pressure and saturation fluctuations between an maximum and a minimum saturation level, and a maximum and minimum pressure drop, observed in Darcy-scale SCAL experiments in Figures 2–5. From the change in saturation but also the associated 3D visualization of the respective pore scale fluid distribution shown in Figure 14B it is clear that such ganglion dynamics events involve cooperative displacement in a large number of individual pores.
Summary and Conclusion
In this work we establish that significant fluctuations in pressure and saturation well visible in multiphase flow experiments on centimeter-sized samples are not instrumental noise (or artifacts) but caused by cooperative pore scale displacement events. There is consistent evidence ranging from special core analysis (SCAL) core floods on samples few centimeter length and diameter and micro-CT flow experiments on few mm sized samples. Fluctuations are observed in several independent SCAL studies, show non-Gaussian statistics. Displacement events imaged by beamline based micro-CT flow experiments have similar characteristics in terms of amplitude and saturation change as the SCAL experiments.
Until now, the common view has been that porous media, e.g., rock samples of few centimeter in size are above the REV scale and therefore, pore-scale events should have averaged out. It is, however, not too surprising that pore-scale events do not average out at sample sizes of few centimeters since non-wetting phase cluster sizes can reach into the several mm to few centimeter range (Georgiadis et al., 2013; Armstrong et al., 2014b) and that the pressure signature of respective ganglion dynamics (Rücker et al., 2015b) remains visible. In order to average out, if at all, sample sizes that could enclose several free non-wetting phase clusters would be required.
By focusing on the specific case of steady-state experiments where wetting and non-wetting phases are co-injected at varying fractional flow, we can exclude transient effects. Even though in many cases of such fractional flow experiments, after injection of hundreds of pore volumes, pressure and saturation eventually stabilize, there are many other reported cases, where significant fluctuations in pressure and saturation persist in a wide range of different rock types, experimental conditions and scales investigated, which suggests that the phenomenon is somewhat universal and applicable to a wide range of rock types (Datta et al., 2014a,b; Masalmeh et al., 2014; Reynolds and Krevor, 2015; Sorop et al., 2015; Gao et al., 2017, 2019, 2020; Lin Q. et al., 2018; Alcorn et al., 2019; Clennell et al., 2019; Lin et al., 2019a; Spurin et al., 2019; Wang and Masalmeh, 2019). Based on capillary number and pore-scale mechanisms involved the cause of the fluctuations is of capillary nature. The magnitude of the fluctuations depends strongly on the wetting state and may be noticed only in more water-wet cases, which does not necessarily mean that ganglion dynamics is absent in mixed-wet cases (Rücker et al., 2019). It is still uncertain whether bi-continuous oil-water configurations and associated connected pathway flow regimes can be established for specific pore space morphologies and the spatial wettability distributions (Lin et al., 2019a).
In the analyzed experiments, the amplitude of the pressure fluctuations is at a capillary energy scale, which suggests that pore-scale events are the most likely cause. The volume associated with the saturation fluctuations are many orders of magnitude larger than individual pores suggesting that the pore-scale displacement events are cooperative and involve many pores, which is also reflected in the hundreds of individual pore scale displacements observed in the changes of the pore scale fluid distributions imaged in the micro-CT flow experiments.
The root cause for fluctuations are discontinuities associated with pore scale displacement events. However, the involvement of hundreds to thousands of individual pores stretches the limits of what is explainable at pore scale just by cooperative displacements of advancing fluids fronts (Jung et al., 2016; Singh et al., 2017; Primkulov et al., 2019) and avalanche-like cascades of individual pore filling events (Armstrong et al., 2014a). Cooperative displacements with locally either more imbibition and drainage dominated behavior with associated breakup and coalescence processes is ultimately reminiscent of what we would describe as ganglion dynamics (Rücker et al., 2015b) although the necessity for ganglion dynamics has not been fully comprehended. Associated flow regimes can be identified in the capillary number—saturation space where during breakup and coalescence, oil clusters follow specific trajectories. In the transition to the Darcy scale, e.g., when averaged over all oil clusters to characterize the average macroscopic behavior, connected pathway flow without significant saturation changes is a fixed point and ganglion dynamics form trajectories. The observation of fluctuating flow where saturation, pressure drop, and fluid connectivity change repetitively between two different states is somewhat reminiscent of ganglion dynamics, which operates on a capillary energy scale many orders of magnitude above thermal fluctuations suggesting that these fluctuations are non-thermal.
Ganglion dynamics events can indeed involve many individual pores. However, a more statistical distribution would be expected, where filling events with hundreds to thousands of individual pores would be relatively rare, because the event size distribution follows a power law (Berg et al., 2014). Therefore, from the pore scale perspective alone it is not clear why these large events would become the dominant feature, in a sometimes perfectly repetitive oscillatory manner.
The Darcy scale experiments provide the missing piece of the puzzle. At the centimeter scale oscillatory regimes with traveling waves are observed. The characteristic feature is a saturation peak traveling at constant velocity from inlet to outlet. Once the outlet is reached, a saturation peak emerges at the inlet repeating the cycle. Such waves are compatible with fractional flow principles (based on Darcy scale physics) and can be explained by a “loop” fractional flow solution (Plohr et al., 2001). Darcy scale phenomena are only observable over larger length and time scales due to permissibility by fractional flow solutions (otherwise they would be damped and decay exponentially), meaning that they enter a viscous-dominated flow regime. The trigger mechanism for such waves, however, are provided by capillary-driven ganglion dynamics events observed on the cluster scale. In a respective micro-CT flow experiments imaged by fast X-ray computed micro-tomography such recurring events were observed, which are initiated by an increase in water-filling events. That is reminiscent to the ganglion dynamics observed in imbibition at low capillary numbers (Rücker et al., 2015b), where ganglion movement is only initiated after a sequence of snap-offs disconnecting an oil cluster, which then becomes mobile through a sequence of disconnection and coalescence processes, at a capillary energy scale, which upon snap-off is converted into kinetic energy. This may provide the trigger for Darcy-scale “loop” solutions, which consist of a moving water bank followed by an oil bank in a periodic “loop” between bounding drainage and imbibition fractional flow curves, potentially forming closed orbits in the phase space (Strogatz, 1994).
A possible physical explanation for the occurrence of fluctuations are indeed the underlying traveling waves which can transport more flux than a homogeneous saturation profile. In other words, the Darcy scale solution becomes unstable against fluctuations, because in this way, at the same pressure drop, more flux is transported, i.e., energy dissipation is minimized.
The phenomenon of the clearly visible fluctuations in core flooding experiments at the centimeter length scale involve both capillary driven dynamics at the cluster scale with pore scale origin, and aspects of fractional flow solutions in the viscous limit. In other words, these phenomena are bridging between pore and Darcy scale physics, and the complexity arises from the fact that between the two scales the physical description concept changes.
There are now several potential implications, ranging from the question on the rate of energy dissipation associated with the fluctuations (McClure et al., 2020a,b) to non-uniqueness of the “loop” fractional flow solutions of the periodic oscillations (Plohr et al., 2001; Corli and Fan, 2018) and implications for the relative permeability-saturation functions obtained from such experiments. Ultimately, we have to also ask ourselves from a practical application perspective how we can use the details of fluctuations and traveling waves revealed in this much more dedicated analysis to enrich the interpretation of the experiment, acknowledging that by averaging the information would be largely lost. For instance, fluctuations could be used as a wettability indicator. These questions are good starting points for future work on the subject.
Data Availability Statement
The raw data supporting the conclusions of this article will be made available by the authors, without undue reservation.
Author Contributions
SB, MR, AG, RA, HO, FE, and MK conceptualized the research. SB, AG, HO, MR, FE, and MK planned the research. AG, MR, SB, RA, HO, NB, HvdL, and LS performed the research. MR and SB performed the data analysis and wrote the manuscript. All authors contributed to the article and approved the submitted version.
Conflict of Interest
AG, NB, HvdL, and SB were employed by the company Shell Global Solutions International B.V.
The remaining authors declare that the research was conducted in the absence of any commercial or financial relationships that could be construed as a potential conflict of interest.
Acknowledgments
We would like to acknowledge Kevin Mader and Marco Stampanoni (Tomcat beamline at the Swiss Light Source of Paul Scherrer Institute, Villigen, Switzerland). We thank Alex Schwing and Rob Neiteler for the design of the flow set-up and instrumentation, Ab Coorn, Fons Marcelis for sample selection and preparation and Sebastiaan Pieterse for assisting with the steady-state relative permeability measurements. We thank Sander de With for helpful discussions and assisting with the single-phase flow simulations with GeoDICT and OpenFOAM. We gratefully acknowledge Shell Global Solutions International B.V. for permission to publish this work. Catherine Spurin is acknowledged for helpful discussions pointing out the importance of putting the time scale of the fluctuations into perspective of the wider range of characteristic time scales and making us aware of more relevant literature supporting our findings. Diederik van Batenburg, Harm Dijk, John van Wunnik, and Jasper de Reus are acknowledged for helpful discussion concerning the fractional flow analysis. μCT was performed on the TOMCAT beamline at the Swiss Light Source, Paul Scherrer Institute, Villigen, Switzerland. We are grateful to Kevin Mader at Swiss Light Source, whose outstanding efforts have made these experiments possible.
References
Abdallah, W., Buckley, J., Carnegie, A., Edwards, J., Herold, B., Fordham, E., et al. (2007). Fundamentals of wettability. Oilfield Rev. 44–61. Available online at: https://www.slb.com/-/media/files/oilfield-review/p44-61-english
Al Saadi, F., Wolf, K., and Kruijsdijk, C. V. (2017). Characterization of Fontainebleau sandstone: quartz overgrowth and its impact on pore-throat framework. J. Petrol. Environ. Biotechnol. 7, 1–12. doi: 10.4172/2157-7463.1000328
Alcorn, Z. P., Fredriksen, S. B., Sharma, M., Føyen, T., Wergeland, C., Ferno, M. A., et al. (2019). “Core-scale sensitivity study of CO2 foam injection strategies for mobility control, enhanced oil recovery and CO2 storage,” in International Symposium of the Society of Core Analysts (Pau). doi: 10.1051/e3sconf/202014602002
Alkan, H., and Müller, W. (2008). Approaches for modelling gas flow in clay formations as repository systems. Phys. Chem. Earth 33, S260–S268. doi: 10.1016/j.pce.2008.10.037
Alpak, F. O., Zacharoudiou, I., Berg, S., Dietderich, J., and Saxena, N. (2019). Direct simulation of pore-scale two-phase visco-capillary flow on large digital rock images using a phase-field lattice boltzmann method on general-purpose graphics processing units. Comput. Geosci. 23, 849–880. doi: 10.1007/s10596-019-9818-0
Armstrong, R. T., Evseev, N., Koroteev, D., and Berg, S. (2015). Modeling the velocity field during Haines jumps in porous media. Adv. Water Resour. 77, 57–68. doi: 10.1016/j.advwatres.2015.01.008
Armstrong, R. T., Georgiadis, A., Ott, H., Klemin, D., and Berg, S. (2014b). Pore-scale mobilization of non-wetting phase ganglia and critical capillary number for onset of macroscopic capillary desaturation. Geophys. Res. Lett. 41, 1–6. doi: 10.1002/2013GL058075
Armstrong, R. T., Ott, H., Georgiadis, A., Rücker, M., Schwing, A., and Berg, S. (2014a). Subsecond pore-scale displacement processes and relaxation dynamics in multiphase flow. Water Resour. Res. 50, 9162–9176. doi: 10.1002/2014WR015858
Avraam, D. G., and Payatakes, A. C. (1995a). Flow regimes and relative permeabilities during steady-state two-phase flow in porous media. J. Fluid Mech. 293, 207–236. doi: 10.1017/S0022112095001698
Avraam, D. G., and Payatakes, A. C. (1995b). Generalized relative permeability coefficients during steady-state two-phase flow in porous media, and correlation with the flow mechanisms. Transport Porous Media 20, 135–168. doi: 10.1007/978-94-017-2372-5_6
Bartels, W.-B., Rücker, M., Boone, M., Bultreys, T., Mahani, H., Berg, S., et al. (2019). Imaging spontaneous imbibition in full Darcy-scale samples at pore-scale resolution by fast X-ray tomography. Water Resour. Res. 55, 7072–7085. doi: 10.1029/2018WR024541
Berg, C. F., Slotte, P. A., and Khanamiri, H. H. (2020). Geometrically derived efficiency of slow immiscible displacement in porous media. Phys. Rev. E 102:033113. doi: 10.1103/PhysRevE.102.033113
Berg, S., Armstrong, R. T., Ott, H., Georgiadis, A., Klapp, S. A., Schwing, A., et al. (2014). Multiphase flow in porous rock imaged under dynamic flow conditions with fast X-ray computed microtomography. Petrophysics 55, 304–312. Available online at: https://onepetro.org/petrophysics/article-abstract/55/04/304/171378/Multiphase-Flow-in-Porous-Rock-Imaged-Under?redirectedFrom=fulltext
Berg, S., and Cense, A. W. (2009). “The viscous-capillary paradox in 2-phase flow in porous media,” in International Symposium of the Society of Core Analysts held in Noordwijk.
Berg, S., Ott, H., Klapp, S. A., Schwing, A., Neiteler, R., Brussee, N., et al. (2013). Real-time 3D imaging of Haines jumps in porous media flow. Proc. Natl. Acad. Sci. U.S.A. 110, 3755–3759. doi: 10.1073/pnas.1221373110
Berg, S., Rücker, M., Ott, H., Georgiadis, A., Van der Linde, H., Enzmann, F., et al. (2016). Connected pathway relative permeability from pore-scale imaging of imbibition. Adv. Water Resour. 90, 24–35. doi: 10.1016/j.advwatres.2016.01.010
Berg, S., Unsal, E., and Dijk, H. (2020). Non-uniqueness and uncertainty quantification of relative permeability measurements by inverse modelling. Comput. Geotech. 132:103964. doi: 10.1016/j.compgeo.2020.103964
Berg, S., and van Wunnik, J. (2017). Shear rate determination from pore scale flow fields. Transport Porous Media 117, 229–246. doi: 10.1007/s11242-017-0830-3
Bui, M., Adjiman, C. S., Bardow, A., Anthony, E. J., Boston, A., Brown, S., et al. (2018). Carbon Capture and Storage (CCS): the way forward. Energy Environ. Sci. 11, 1062–1176. doi: 10.1039/C7EE02342A
Cense, A. W., van der Linde, H. A., Brussee, N., Beljaars, J., and Schwing, A. (2014). “How reliable is in-situ saturation monitoring (ISSM) using X-Ray?,” International Symposium of the Society of Core Analysts (Avignon).
Clennell, M. B., White, C., Giwelli, A., Myers, M., Esteban, L., Cullingford, M., et al. (2019). “Improved method for complete gas-brine imbibition relative permeability curves,” in International Symposium of the Society of Core Analysts (Pau).
Cobos, S., Carvalho, M. S., and Alvarado, V. (2009). Flow of oil-water emulsions through a constricted capillary. Int. J. Multiphase Flow 35, 507–515. doi: 10.1016/j.ijmultiphaseflow.2009.02.018
Corli, A., and Fan, H. (2018). Two-phase flow in porous media with hysteresis. J. Differe. Equations 265, 1156–1190. doi: 10.1016/j.jde.2018.03.021
Datta, S. S., Dupin, J.-B., and Weitz, D. A. (2014a). Fluid breakup during simultaneous two-phase flow through a three-dimensional porous medium. Phys. Fluids 26:62004. doi: 10.1063/1.4884955
Datta, S. S., Ramakrishnan, T. S., and Weitz, D. A. (2014b). Mobilization of a trapped non-wetting fluid from a three-dimensional porous medium. Phys. Fluids 26:22002. doi: 10.1063/1.4866641
DiCarlo, D. A., Cidoncha, J. I. G., and Hickey, C. (2003). Acoustic measurements of pore scale displacements. Geophys. Res. Lett. 30:1901. doi: 10.1029/2003GL017811
Dixit, A. B., McDougall, S. R., and Sorbie, K. S. (1998). A pore-level investigation of relative permeability hysteresis in water-wet systems. SPE J. 3, 115–123. doi: 10.2118/37233-PA
Gao, Y., Lin, Q., Bijeljic, B., and Blunt, M. J. (2017). X-ray microtomography of intermittency in multiphase flow at steady state using a differential imaging method. Water Resour. Res. 51, 10274–10292. doi: 10.1002/2017WR021736
Gao, Y., Lin, Q., Bijeljic, B., and Blunt, M. J. (2020). Pore-scale dynamics and the multiphase Darcy law. Phys. Rev. Fluids 5:013801. doi: 10.1103/PhysRevFluids.5.013801
Gao, Y., Raeini, A. Q., Blunt, M. J., and Bijeljic, B. (2019). Pore occupancy, relative permeability and flow intermittency measurements using X-ray micro-tomography in a complex carbonate. Adv. Water Resour. 129, 56–69. doi: 10.1016/j.advwatres.2019.04.007
Georgiadis, A., Berg, S., Maitland, G., Makurat, A., and Ott, H. (2013). Pore-Scale micro-CT imaging: non-wetting phase cluster size distribution during drainage and imbibition. Phys. Rev. E 88:033002. doi: 10.1103/PhysRevE.88.033002
Guédon, G. R., Hyman, J. D., Inzoli, F., Riva, M., and Guadagnini, A. (2017). Influence of capillary end effects on steady-state relative permeability estimates from direct pore-scale simulations. Phy. Fluids 29:123104. doi: 10.1063/1.5009075
Herring, A. L., Harper, E. J., Andersson, L., Sheppard, A., Bay, B. K., and Wildenschild, D. (2013). Effect of fluid topology on residual nonwetting phase trapping: Implications for geologic CO2 sequestration. Adv. Water Resour. 62, 47–58. doi: 10.1016/j.advwatres.2013.09.015
Hilfer, R., and Oren, P. E. (1996). Dimensional analysis of pore scale and field scale immiscible displacement. Transport Porous Media 22, 53–72. doi: 10.1007/BF00974311
Huang, D. D., and Honarpour, M. M. (1998). Capillary end effects in coreflood calculations. J. Petrol. Sci. Eng. 19, 103–117. doi: 10.1016/S0920-4105(97)00040-5
Jacquin, C. (1964). Correlations between the permeability and the geometric characteristics of the Fontainebleau gres. Rev. Inst. Fr. Pet. 19, 921–937.
Joekar-Niasar, V., and Hassanizadeh, S. M. (2011). Specific interfacial area: the missing state variable in two-phase flow equation. Water Resour. Res. 47:W05513. doi: 10.1029/2010WR009291
Jung, M., Brinkmann, M., Seemann, R., Hiller, T., Sanchez de La Lama, M., and Herminghaus, S. (2016). Wettability controls slow immiscible displacement through local interfacial instabilities. Phys. Rev. Fluids 1:074202. doi: 10.1103/PhysRevFluids.1.074202
Khorshidian, H., Afshari, S., Bagherzadeh, H., and Hejazi, S. H. (2021). The effect of flow swing on waterflood under oil-wet conditions: a pore-level study. Transp Porous Med. 137, 109–130. doi: 10.1007/s11242-021-01549-7
Kmec, J., Fürst, T., Vodak, R., and Sir, M. (2019). A semi-continuum model of saturation overshoot in one dimensional unsaturated porous media flow. Sci. Rep. 9:8390. doi: 10.1038/s41598-019-44831-x
Kokkedee, J. A., Boom, W., Frens, A. M., and Maas, J. G. (1996). “Improved special core analysis: scope for a reduced residual oil saturation,” in Proceedings of Society of Core Analysis Conference Paper SCA-9601, 1–13.
Kondratenko, E. V., Mul, G., Baltrusaitis, J., Larrazabal, G. O., and Perez-Ramirez, J. (2013). Status and perspectives of CO2 conversion into fuels and chemicals by catalytic, photocatalytic and electrocatalytic processes. Energy Environ. Sci. 6, 3112–3135. doi: 10.1039/c3ee41272e
Lenormand, R., and Touboul, E. (1998). Numerical models and experiments on immiscible displacements in porous media. J. Fluid Mech. 189, 165–187. doi: 10.1017/S0022112088000953
Lenormand, R., Zarcone, C., and Sarr, A. (1983). Mechanisms of the displacement of one fluid by another in a network of capillary ducts. J. Fluid Mech. 135, 337–353. doi: 10.1017/S0022112083003110
Lin, Q., Bijeljic, B., Berg, S., Pini, R., Blunt, M. J., and Krevor, S. (2019a). Minimal surfaces in porous media: Pore-scale imaging of multiphase flow in an altered-wettability Bentheimer Sandstone. Phys. Rev. E 99:063105. doi: 10.1103/PhysRevE.99.063105
Lin, Q., Bijeljic, B., Krevor, S. C., Blunt, M. J., Rücker, M., Berg, S., et al. (2019b). A new waterflood initialization protocol for pore-scale multiphase flow experiments. Petrophysics 60, 264–272. doi: 10.30632/PJV60N2-2019a4
Lin, Q., Bijeljic, B., Pini, R., Blunt, M. J., and Krevor, S. (2018). Imaging and measurement of pore-scale interfacial curvature to determine capillary pressure simultaneously with relative permeability. Water Resour. Res. 54, 7046–7060. doi: 10.1029/2018WR023214
Liu, Z., McClure, J. E., and Armstrong, R. T. (2018). Influence of wettability on phase connectivity and electrical resistivity. Phys. Rev. E 98:043102. doi: 10.1103/PhysRevE.98.043102
Masalmeh, S. K., Sorop, T. G., Suijkerbuijk, B. M. J. M., Vermolen, E. C. M., Douma, S., van der Linde, H. A., et al. (2014). “Low salinity flooding: experimental evaluation and numerical interpretation,” in IPTC 17558, Presented at the International Petroleum Technology Conference (Doha). doi: 10.3997/2214-4609-pdb.395.IPTC-17558-MS
McClure, J. E., Berg, S., and Armstrong, R. T. (2020a). Capillary fluctuations and energy dynamics for flow in porous media. arXiv. arXiv:2012.09206.
McClure, J. E., Berg, S., and Armstrong, R. T. (2020b). Capillary fluctuations in non-equilibrium systems. arXiv. arXiv:2012.09139.
McClure, J. E., Berrill, M. A., Gray, W. G., and Miller, C. T. (2016). Influence of phase connectivity on the relationship among capillary pressure, fluid saturation, and interfacial area in two-phase porous medium systems. Phys. Rev. E 94:033102. doi: 10.1103/PhysRevE.94.033102
Menke, H. P., Gao, Y., Linden, S., and Andrew, M. G. (2021). Using nano-XRM and high-contrast imaging to inform micro-porosity permeability during Stokes-Brinkman single and two-phase flow simulations on micro-CT images. Earth ArXiv [preprint]. doi: 10.31223/osf.io/ubg6p
Mitra, K., Köppl, T., Pop, I. S., van Duijn, C. J., and Helmig, R. (2020). Fronts in two-phase porous media flow problems: The effects of hysteresis and dynamic capillarity. Stud. Appl. Mathematics 144, 449–492. doi: 10.1111/sapm.12304
Moebius F. Or D. (2012). Interfacial jumps and pressure bursts during fluid displacement in interacting regular capillaries. J. Colloid Interface Sci. 377, 406–415. doi: 10.1016/j.jcis.2012.03.070
Morrow, N. R. (1970). Physics and thermodynamics of capillary action in porous media. Ind. Eng. Chem. 63, 32–56. doi: 10.1021/ie50726a006
Murison, J., Semin, B., Baret, J.-C., Herminghaus, S., Schröter, M., and Brinkmann, M. (2014). Wetting heterogeneities in porous media control flow dissipation. Phys. Rev. Appl. 2:034002. doi: 10.1103/PhysRevApplied.2.034002
Oughanem, R., Youssef, S., Bauer, D., Peysson, Y., Maire, E., and Vizika, O. (2015). A multi-scale investigation of pore structure impact on the mobilization of trapped oil by surfactant injection. Transport Porous Media 109, 673–692. doi: 10.1007/s11242-015-0542-5
Pak, T., Butler, I. B., Geiger, S., Van Dijke, M. I. J., and Sorbie, K. S. (2015). Droplet fragmentation: 3D imaging of a previously unidentified pore-scale process during multiphase flow in porous media. Proc. Natl Acad. Sci. U.S.A. 112, 1947–1952. doi: 10.1073/pnas.1420202112
Plohr, B., Marchesin, D., Bedrikovetsky, P., and Krause, P. (2001). Modeling hysteresis in porous media flow via relaxation. Comput. Geosci. 5, 225–256. doi: 10.1023/A:1013759420009
Primkulov, B. K., Pahlavan, A. A., Fu, X., Zhao, B., MacMinn, C. W., and Juanes, R. (2019). Signatures of fluid-fluid displacement in porous media: wettability, patterns and pressures. J. Fluid Mech. 875:R4. doi: 10.1017/jfm.2019.554
Raeini, A. Q., Blunt, M. J., and Bijeljic, B. (2014). Direct simulations of two-phase flow on micro-CT images of porous media and upscaling of pore-scale forces. Adv. Water Resour. 74, 116–126. doi: 10.1016/j.advwatres.2014.08.012
Ramstad, T., and Hansen, A. (2006). Cluster evolution in steady-state two-phase flow in porous media. Phys. Rev. E 73:026306. doi: 10.1103/PhysRevE.73.026306
Reynolds, C. A., and Krevor, S. (2015). Characterizing flow behavior for gas injection; relative permeability of CO2-brine and N2-water in heterogeneous rocks. Water Resour. Res. 51, 9464–9489. doi: 10.1002/2015WR018046
Reynolds, C. A., Menke, H., Andrew, M., Blunt, M. J., and Krevor, S. (2017). Dynamic fluid connectivity during steady-state multiphase flow in a sandstone. Proc. Natl. Acad. Sci. U.S.A. 114, 8187–8192. doi: 10.1073/pnas.1702834114
Rücker, M., Bartels, W.-B., Singh, K., Brussee, N., Coorn, A., van der Linde, H., et al. (2019). The effect of mixed wettability on pore scale flow regimes based on a flooding experiment in ketton limestone. Geophys. Res. Lett. 46, 3225–3234. doi: 10.1029/2018GL081784
Rücker, M., Berg, S., Armstrong, R. T., Georgiadis, A., Ott, H., Schwing, A., et al. (2015b). From connected pathway flow to ganglion dynamics. Geophys. Res. Lett. 42, 3888–3894. doi: 10.1002/2015GL064007
Rücker, M., Berg, S., Armstrong, R. T., Georgiadis, A., Ott, H., Simon, L., et al. (2015a). “The fate of oil clusters during fractional flow: trajectories in the saturation-capillary number space,” International Symposium of the Society of Core Analysts held in St. John's Newfoundland and Labrador.
Schlüter, S., Berg, S., Li, T., Vogel, H.-J., and Wildenschild, D. (2017). Time scales of relaxation dynamics during transient conditions in two-phase flow. Water Resour. Res. 53, 7839–7853. doi: 10.1002/2016WR019815
Schneider, M., Köppl, T., Helmig, R., Steinle, R., and Hilfer, R. (2018). Stable propagation of saturation overshoots for two-phase flow in porous media. Transport Porous Media 121, 621–641. doi: 10.1007/s11242-017-0977-y
Seth, S., and Morrow, N. R. (2007). Efficiency of the conversion of work of drainage to surface energy for sandstone and carbonate. SPE Res. Eval. Eng. 10, 338–347. doi: 10.2118/102490-PA
Simon, C., Hasche, F., and Gasteiger, H. A. (2017). Influence of the gas diffusion layer compression on the oxygen transport in PEM fuel cells at high water saturation levels. J. Electrochem. Soc. 164, F591–F599. doi: 10.1149/2.0691706jes
Singh, K., Jung, M., Brinkmann, M., and Seemann, R. (2019). Capillary-dominated fluid displacement in porous media. Ann. Rev. Fluid Mech. 51, 429–449. doi: 10.1146/annurev-fluid-010518-040342
Singh, K., Scholl, H., Brinkmann, M., Di Michiel, M., Scheel, M., Herminghaus, S., et al. (2017). The role of local instabilities in fluid invasion into permeable media. Sci. Rep. 7:444. doi: 10.1038/s41598-017-00191-y
Sorop, T. G., Masalmeh, S. K., Suijkerbuijk, B. M. J. M., van der Linde, H. A., Mahani, H., Brussee, N. J., et al. (2015). “Relative permeability measurements to quantify the low salinity flooding effect at field scale,” in Abu Dhabi International Petroleum Exhibition and Conference (Abu Dhabi). doi: 10.2118/177856-MS
Spurin, C., Bultreys, T., Bijeljic, B., Blunt, M. J., and Krevor, S. (2019). Intermittent fluid connectivity during two-phase flow in a heterogeneous carbonate rock. Phys. Rev. E 100:043103. doi: 10.1103/PhysRevE.100.043103
Spurin, C., Bultreys, T., Rücker, M., Garfi, G., Schlepütz, C. M., Novak, V., et al. (2020). Real-time imaging reveals distinct pore scale dynamics during transient and equilibrium subsurface multiphase flow. Water Resour. Res. 56:e2020WR028287. doi: 10.1029/2020WR028287
Spurin, C., Bultreys, T., Rücker, M., Garfi, G., Schlepütz, C. M., Novak, V., et al. (2021). The development of intermittent multiphase fluid flow pathways through a porous rock. Adv. Water Resour. 150:103868. doi: 10.1016/j.advwatres.2021.103868
Tsakiroglou, C. D. (2019). The correlation of the steady-state gas/water relative permeabilities of porous media with gas and water capillary numbers. Oil Gas Sci. Technol. 74:45. doi: 10.2516/ogst/2019017
Tuller M. Or D. (2001). Hydraulic conductivity of variably saturated porous media: Film and corner flow in angular pore space. Water Resour. Res. 37, 1257–1276. doi: 10.1029/2000WR900328
Unsal, E., Mason, G., Morrow, N. R., and Ruth, D. W. (2007a). Co-current and counter-current imbibition in independent tubes of non-axisymmetric geometry. J. Colloid Interface Sci. 306, 105–117. doi: 10.1016/j.jcis.2006.10.042
Unsal, E., Mason, G., Morrow, N. R., and Ruth, D. W. (2009). Bubble snap-off and capillary-back pressure during counter-current spontaneous imbibition into model pores. Langmuir 25, 3387–3395. doi: 10.1021/la803568a
Unsal, E., Mason, G., Ruth, D. W., and Morrow, N. R. (2007b). Co-and counter-current spontaneous imbibition into groups of capillary tubes with lateral connections permitting cross-flow. J. Colloid Interface Sci. 315, 200–209. doi: 10.1016/j.jcis.2007.06.070
Wang, Y., and Masalmeh, S. K. (2019). Obtaining High Quality SCAL data: combining different measurement techniques, saturation monitoring, numerical interpretation and continuous monitoring of experimental data. E3S Web Conf. 89:02007. doi: 10.1051/e3sconf/20198902007
Winkler, M., Gjennestad, M. A., Bedeaux, D., Kjelstrup, S., Cabriolu, R., Hansen, A., et al. (2020). Onsager-symmetry obeyed in athermal mesoscopic systems: two-phase flow in porous media. Front. Phys. 8:60. doi: 10.3389/fphy.2020.00060
Xu, L., Ye, W. M., Ye, B., Chen, B., Chen, Y. G., and Cui, Y. J. (2015). Investigation on gas migration in saturated materials with low permeability. Eng. Geol. 197, 94–102. doi: 10.1016/j.enggeo.2015.08.019
Keywords: multiphase, pore scale, fractional flow analysis, fluctuations, displacement
Citation: Rücker M, Georgiadis A, Armstrong RT, Ott H, Brussee N, van der Linde H, Simon L, Enzmann F, Kersten M and Berg S (2021) The Origin of Non-thermal Fluctuations in Multiphase Flow in Porous Media. Front. Water 3:671399. doi: 10.3389/frwa.2021.671399
Received: 23 February 2021; Accepted: 22 April 2021;
Published: 01 June 2021.
Edited by:
Charlotte Garing, University of Georgia, United StatesCopyright © 2021 Rücker, Georgiadis, Armstrong, Ott, Brussee, van der Linde, Simon, Enzmann, Kersten and Berg. This is an open-access article distributed under the terms of the Creative Commons Attribution License (CC BY). The use, distribution or reproduction in other forums is permitted, provided the original author(s) and the copyright owner(s) are credited and that the original publication in this journal is cited, in accordance with accepted academic practice. No use, distribution or reproduction is permitted which does not comply with these terms.
*Correspondence: Maja Rücker, bS5ydWNrZXJAdHVlLm5s; Steffen Berg, c3RlZmZlbi5iZXJnQHNoZWxsLmNvbQ==