 Raphaël Payet-Burin1,2*
 Mikkel Kromann2
 Silvio Pereira-Cardenal2Kenneth Marc Strzepek3
 Peter Bauer-Gottwein1
- 1DTU Environment, Technical University of Denmark, Kongens Lyngby, Denmark
- 2COWI A/S, Kongens Lyngby, Denmark
- 3Joint Program on the Science and Policy of Global Change, Massachusetts Institute of Technology, Cambridge, MA, United States
Water, energy, and agricultural infrastructure investments have important inter-relations fulfilling potentially competing objectives. When shaping investment plans, decision makers need to evaluate those interactions and the associated uncertainties. We compare planning infrastructure under uncertainty with an integrated water-energy-food nexus framework and with sector-centered (silo) frameworks. We use WHAT-IF, an open-source hydroeconomic decision support tool with a holistic representation of the power and agriculture sectors. The tool is applied to an illustrative synthetic case and to a complex planning problem in the Zambezi River Basin involving reservoirs, hydropower, irrigation, transmission lines and power plant investments. In the synthetic case, the nexus framework selects investments that generate more synergies across sectors. In sector-centered frameworks, the value of investments that impact multiple sectors (like hydropower, bioenergy, and desalinization) are under- or overestimated. Furthermore, the nexus framework identifies risks related to uncertainties that are not linked to the investments respective sectors. In the Zambezi river case, we find that most investments are mainly sensitive to parameters related to their respective sectors, and that financial parameters like discount rate, capital costs or carbon taxes are driving the feasibility of investments. However, trade-offs between water for irrigation and water for hydropower are important; ignoring trade-offs in silo frameworks increases the irrigation expansion that is perceived as beneficial by 22% compared to a nexus framework that considers irrigation and hydropower jointly. Planning in a nexus framework is expected to be particularly important when projects and uncertainties can considerably affect the current equilibrium.
Introduction
About half of the Sustainable Development Goals (UN General Assembly, 2015) are directly linked to water, energy, food, land, and ecosystem resources and might have competing objectives. As defined by the Bonn 2011 conference, a “nexus approach” is needed in order to “enhance water, energy, and food security by increasing efficiency, reducing trade-offs, building synergies and improving governance across sectors (Hoff, 2011).” For example, Nerini et al. (2019) find that climate action (SDG 13) can reinforce all 17 SDGs but also generate trade-offs with 12 other objectives. The “water-energy-food nexus” has been explored in multiple studies: Khan et al. (2017) review the water-energy nexus, Hamidov and Helming (2020) focus on the link to agriculture, while Bazilian et al. (2011), Miralles-Wilhelm (2016), McCarl et al. (2017), and Johnson et al. (2019) review modeling and research challenges. Those interrelations also connect different spatial and temporal scales: power is exchanged over large power pools, crops are traded across the entire globe, rivers flow through multiple countries, and CO2 emissions affect global climate for centuries. Thus, it is important for decision-makers and infrastructure planners to understand the interrelations between their objectives, available resources, and potential solutions.
Furthermore, evolving socio-techno-economic context and uncertain future climate further complicate investment planning. Decision making under uncertainty has been in focus in the water sector since climate change has been identified as a major challenge. Robust Decision Making (RDM) seeks to find solutions that perform acceptably under a wide range of potential futures (Lempert et al., 2003; Lempert and Groves, 2010; Kasprzyk et al., 2013; Ray and Brown, 2015; Ray et al., 2019), while adaptive planning (Fletcher et al., 2019; Herman et al., 2020) explores how the flexibility of measures can increase their robustness and which indicators might be useful to trigger adaptation. These methods are relevant to any decision making process linking complex human-natural systems (Moallemi et al., 2020).
For decision makers planning water-related infrastructure, three families of models are available:
• Water resource models (e.g., WEAP—Yates et al., 2005; CALVIN—Dogan et al., 2018; Pywr—Tomlinson et al., 2020; PySedSim—Wild et al., 2021) that represent water constraints at a fine spatial and temporal scale, and usually provide advanced methods for considering uncertainties. However, the power and agriculture sectors are represented as exogenous water demands, ignoring potentially important feedback effects.
• Global scale integrated assessment models that connect the land, water and energy resources (e.g., GCAM—Calvin et al., 2019), consider trade at the global level, but lack the spatial resolution to guide decision makers in infrastructure planning. Water constraints are usually formulated at the national or river basin scale and consider average availability, ignoring inter-annual variability. Uncertainties are often considered by exploring the five shared socio-economic pathways (Riahi et al., 2017) or sampling across their assumptions (e.g., Lamontagne et al., 2018).
• A new family of nexus models (e.g., WHAT-IF—Payet-Burin et al., 2019; NEST—Bakhshianlamouki et al., 2020; Sridharan et al., 2020; Vinca et al., 2020) fill the gap between the two first categories, as they represent interactions between the water, energy, and food sectors at finer spatial and temporal scales. Uncertainties are usually addressed using sensitivity analysis techniques or scenario analysis based on the shared socio-economic pathways.
Hence there is a gap between water resource models that consider uncertainties to identify robust solutions but ignore nexus interrelations, and nexus models that consider multi- resources interrelations but are restricted to basic uncertainty analysis techniques. The goal of this work is to use a water-energy-food nexus model (Payet-Burin et al., 2019) in a robust decision making framework to explore:
• What are the benefits of performing infrastructure planning in a “nexus” framework (considering the water, energy, and food sectors jointly) vs. in “silo” frameworks (considering sectors separately)?
• Does the joint evaluation of intersectoral investments lead to higher synergies and less tradeoffs between the selected investments?
• Does the nexus framework identify risks that are otherwise not perceived in a silo framework?
To address these research objectives, we implement a robust decision making workflow in WHAT-IF (Payet-Burin et al., 2019), a hydroeconomic decision support tool with a holistic representation of the water, power and agriculture systems.
The paper is organized around two study cases: a simple synthetic case and a complex planning problem in the Zambezi River Basin. We compare planning infrastructure adopting “silo” frameworks (considering sectors separately), vs. adopting a “nexus” framework (considering the water, energy, and food sectors jointly). The study cases are organized as follows (Figure 1): (a) the base scenario, investments, and uncertainties are defined; (b) the nexus and silo frameworks used to select investments are defined, (c) the robustness of investments is evaluated for the different frameworks leading to different investment plans. Finally, (d) the robustness of the investment plans is evaluated, and (e) the different methods are compared: how does the framework affect the evaluation of an investment's robustness and the choice of investments. Section Methodology describes the WHAT-IF model, and sections Synthetic Case and Zambezi case its applications to the two study cases.
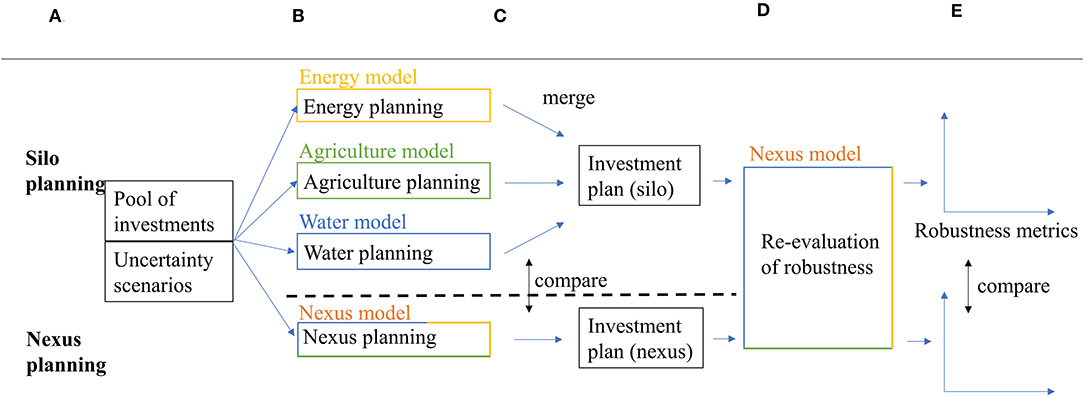
Figure 1. Study Design. The study compares a nexus (integrated) planning vs. a silo (sector-centered) planning and the impact on selected investments and their perceived robustness. (A) Define uncertainty and investments, (B) define models, (C) evaluate robustness and select investments, (D) robustness re-evaluation, (E) compare methods.
Methodology
The WHAT-IF Tool
WHAT-IF (Payet-Burin et al., 2019) is a hydro-economic decision support tool for water infrastructure investment planning, linking, in a holistic framework, a representation of the water, energy and agriculture systems (Figure 2). Resource management and infrastructure operation (e.g., storage, production, transfer) are decision variables, optimized to maximize total economic surplus while respecting physical and institutional constraints. In this version, using a single objective function for the entire planning horizon, the model assumes “perfect foresight” and “perfect cooperation.” In Payet-Burin et al. (2020), the “perfect foresight” assumption is found to have a small impact compared to uncertainties linked to climate and socio-economic change when evaluating the performance of hydropower and irrigation projects in the Zambezi.
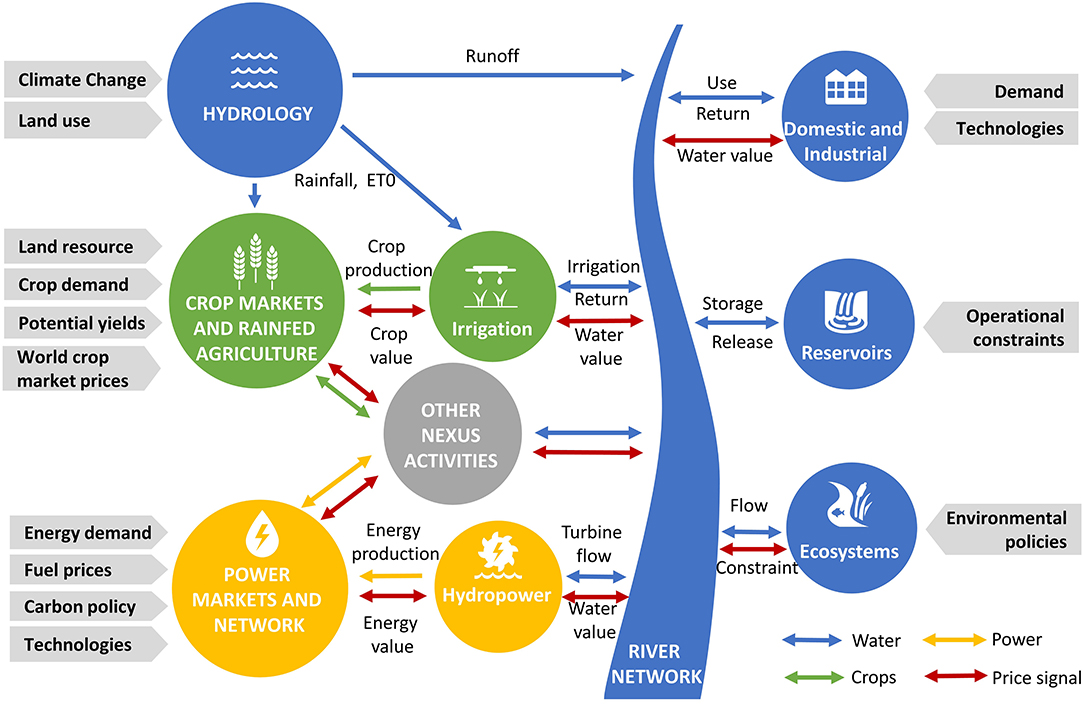
Figure 2. Representation of the main interrelations in the water-energy-food nexus in WHAT-IF. All flows are solved holistically by maximizing total consumer and producer surplus for the water, power, and crop commodities.
In addition to the model description as in Payet-Burin et al. (2019), a general activity module represents any other process that consumes and/or produces one or several commodities (land, water, power, and crops) connecting sub-basins, crop markets, power markets and agriculture land. Examples of such processes are desalinization (consumes energy and produces water), livestock (consumes land, water and crops and produces another food commodity), food processing (consumes energy, water and crops and produces another commodity), and bioenergy (consumes crops or crop residues and produces energy).
The model is open-source, written in Python using the pyomo library (Hart et al., 2017). In this study, the optimization framework is solved with the CPLEX solver (IBM, 2017). Latest model development are available in a git repository (https://github.com/RaphaelPB/WHAT-IF) where a tutorial based on the synthetic case is provided.
Investment Selection in the WHAT-IF Model
An investment selection module was added to WHAT-IF. Investments are characterized by capacity, capital costs, operation costs, construction time, and lifetime. Investment decisions are represented as binary or continuous decision variables in the optimization framework. Investment decisions can be taken in every investment phase (e.g., 5 years). At the end of the planning horizon, the value of the remaining lifetime of the invested infrastructure is subtracted from the capital costs, assuming a constant annual depreciation. This implementation corresponds to an internal with/without cost-benefit analysis within the optimization framework selecting investments among potential candidates.
The following equations are added to the model described in Payet-Burin et al. (2019):
Objective function to maximize:
where φ0y is the original objective function considering consumer and producer surplus for all commodities (WSB represents the water supply benefits, WSC the water supply costs, CSB the crop supply benefits, CSC the crop supply costs, CPC the crop production costs, ESB the energy supply benefit, ETC the energy transmission costs, and EPC the energy production costs which are the sum of the energy operational costs, fuel consumption and CO2 emission costs) for year y, d is the discount rate and y0 the first year of the simulation. IC, the capital investment costs are expressed as follow:
where Iy, i is the investment decision (1 at time of investment, 0 otherwise) for investment i at year y, ci the capital costs of investment i, ICyf represents the remaining value of infrastructure investments at the last year of simulation yf, ct is the construction time of the investment, and lt is the lifetime of the investment.
Optional constraints in the model include: (1) total investments are limited by an investment budget, (2) an investment can only be selected after a specific other investment is selected, (3) an investment has to be selected jointly with other investment(s), (4) investments are forced to occur in a specific year.
Synthetic Case
The purpose of the synthetic case is to: (1) illustrate some effects of interrelations in the nexus when planning under uncertainty, (2) provide a set-up example for the WHAT-IF model. The synthetic case is simplistic but is based on interrelations that are observed in real-world applications. The detailed description and implementation of the case in the model, which also serves as a tutorial for the WHAT-IF model, is available in a git repository (https://github.com/RaphaelPB/WHAT-IF).
Base Scenario
The synthetic case is summarized in Figure 3. The population has water, energy, and food demands. In the base scenario, water demand is satisfied by upstream water withdrawals. Energy demand (here only electricity) is supplied by a hydropower turbine on the river and a thermal power plant. Energy demand is seasonal and is higher during the last 6 months of the year. Food demand (here a single crop) is supplied by an irrigated field downstream of the hydropower dam. Ecosystems in the delta have specific water requirements. We consider four years of hydrological conditions, alternating between wetter and dryer years, while other parameters remain the same. The flow in the river is seasonal, while it is larger than the water supply and irrigation demand, the seasonal trend and inter-annual variation lead to scarcity during the dry season of dry years. Energy curtailments occur during dry years as hydropower production is low. Similarly crop production and prices fluctuate when yields are low as irrigation demand is curtailed because of water shortages.
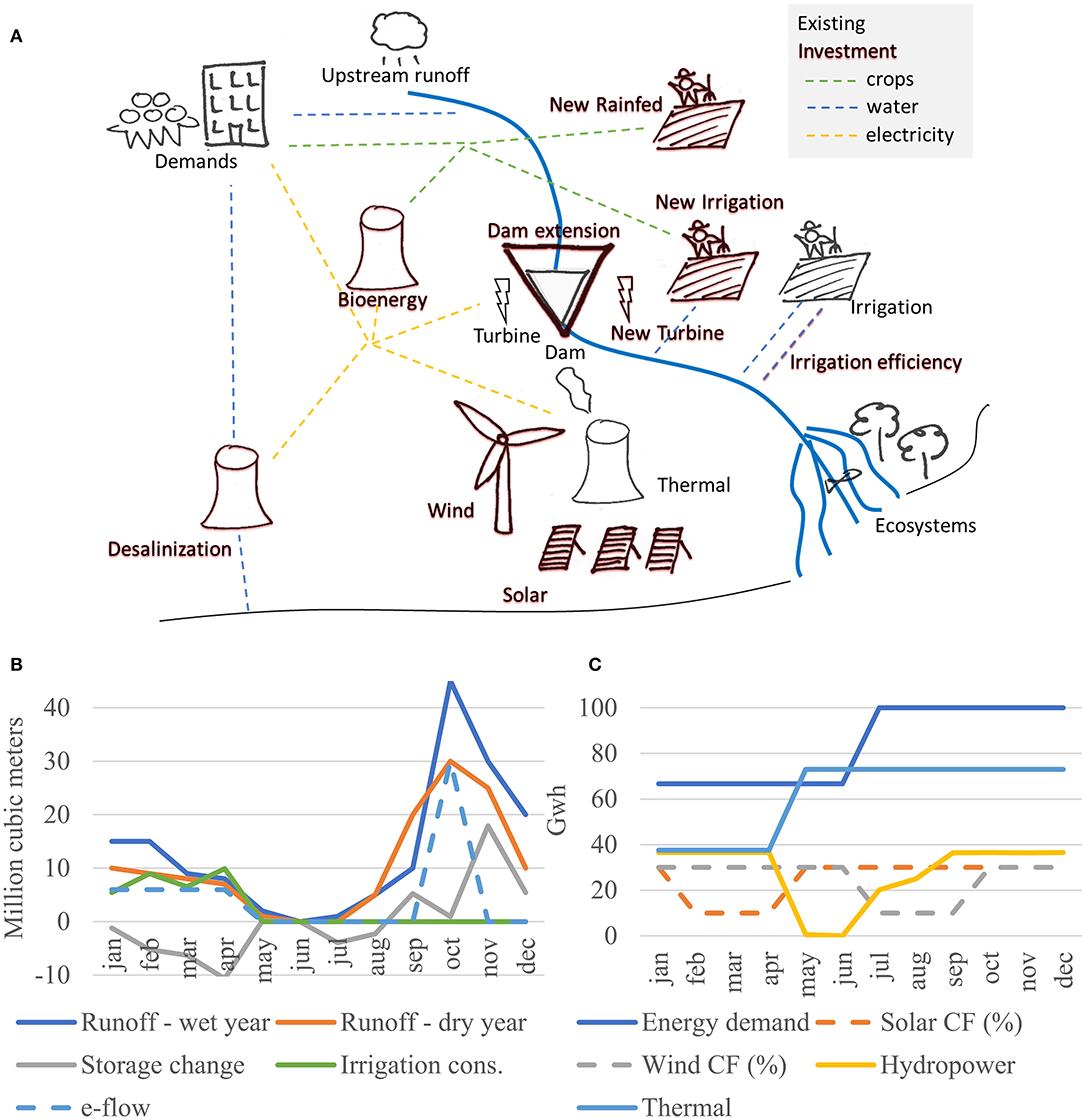
Figure 3. Spatial and temporal representation of the synthetic case. CF stands for capacity factor of solar and wind power (share of capacity available in practice). Irrigation consumption, storage change, hydropower and thermal production are not parameters but outcomes of the modeling framework. (A) Spatial set up, (B) temporal dimension—water, (C) temporal dimension—energy.
Potential Investments
Potential investments are represented in dark red in Figure 3A. Desalinization is considered as an alternative to surface water supply, it is however energy intensive (here we consider neither the source of the salt water nor environmental constraints linked to the effluents). New power plants are considered: solar panels and wind turbines, which have different seasonal variation: solar has a lower availability when irrigation is high, while wind has a lower availability during the low flow season (Figure 3C). Additionally, a new hydropower turbine could be added to the dam, and/or the dam's size could be increased; those are two separate investments. A bioenergy facility is considered, which consumes crops (not residues) and produces electricity. Finally, three investments are considered to improve the agricultural sector: (1) developing irrigation downstream of the dam, (2) developing rainfed agriculture with improved moisture management, and (3) improving the irrigation efficiency (reducing water losses) of existing irrigated agriculture. All investments can be combined, and none are mutually exclusive. Investments in hydropower, reservoirs, bioenergy, desalinization are assumed to be binary (all or nothing), while investments in irrigation, rainfed, irrigation efficiency, solar or wind power can be scaled to any fraction of the considered project (costs are assumed to be proportional to the project size). Here we do not consider budget constraints, discount rate, nor the timing of investments, but these features are available in the model.
Scenarios
We consider 6 uncertain exogenous parameters: environmental flow requirements, climate change (runoff and precipitation), yields, crop demand, carbon tax, and electricity demand. All uncertainties are represented by three possible value for each parameter: −30%, base case, and +30%. Those represent 36 = 729 scenarios, in this simplistic example case we evaluate all possible combinations.
Frameworks
We consider four frameworks reflecting different perspectives about the planning problem: the Nexus framework is the integrated planning approach considering all sectors and potential investments jointly; while the Water, Energy, and Food frameworks (silo approaches) only consider their respective sector and investments. The silo frameworks are defined as follows.
Silo Water
• Considered investments: dam extension, new hydropower turbine, and desalinization.
• Agriculture is a water user with an exogenous demand (not dependent on precipitation).
• Value of water to agriculture is determined using the residual method as the value of produced crops minus production costs divided by the consumptive irrigation use in the baseline scenario without investments.
• Value of hydropower production and costs of energy consumption for desalinization are equal to the observed power price in the baseline scenario without investments.
• The rest of the energy and food system, as well as investment opportunities in these sectors are ignored in this framework.
Silo Food
• Considered investments: enhanced irrigation efficiency, new rainfed agricultural area, and new irrigation area.
• The hydrology and consumptive water use (domestic) are considered, however the non-consumptive water uses of hydropower and ecosystems are ignored.
• The energy system, as well as investment opportunities in the energy and water sectors are ignored.
Silo Energy
• Considered investments: solar, wind, and bioenergy.
• Hydropower is represented by an average capacity factor, based on production in the baseline scenario without investments.
• Crop consumption by bioenergy is represented by a fixed crop price based on the baseline scenario without investments.
• The water system, the rest of the food system, as well as investment opportunities in these sectors are ignored.
When evaluating scenarios in the silo frameworks, some uncertainties of exogenous model parameters do not directly affect the frameworks (e.g., climate change in the energy framework has no impact as the water resource is ignored). To make the example more realistic, alternative assumptions are taken. In the silo energy framework: (1) uncertainty of runoff is replaced by uncertainty of hydropower production, (2) uncertainty of crop demand is replaced by uncertainty of crop price. In the silo water framework, (1) uncertainty of energy demand is replaced by uncertainty of energy price, (2) uncertainty of crop demand is replaced by uncertainty of irrigation water demand. All uncertainties use the same variation from −30% to +30%.
Results of Baseline Scenario Investments
We apply the WHAT-IF investment selection module to the baseline scenario with the nexus and silo frameworks. In the nexus framework the investments are selected jointly considering the interrelations between the different systems. In the silo frameworks, investments are selected separately considering the water, energy, and food sectors. We observe significant differences between the nexus and silo investment plans (Table 1).
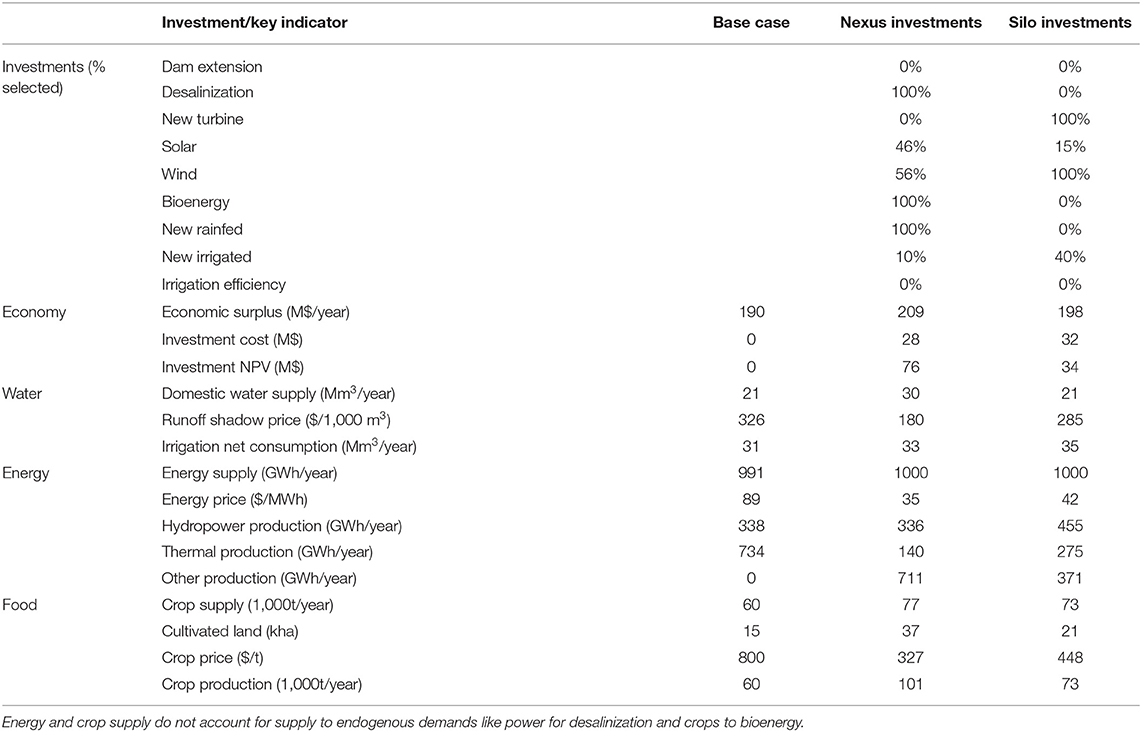
Table 1. Investment selection for the baseline scenario with the nexus and silo framework and impact on key indicators of the water-energy-nexus.
The turbine development is perceived as profitable in the silo water framework as the price of electricity is high (Table 1). For the same reason the desalinization is not considered as it is too expensive with the current electricity price. In the nexus framework, new investments in the power system like solar and bioenergy reduce the electricity price and thus provide the opportunity to invest in a desalinization plant; at the same time, the value of building a new hydropower turbine is reduced.
A similar effect is observed for the bioenergy plant: with the current crop price, it is not profitable to invest in the bioenergy plant (Table 1). Thus, in the silo energy framework, bioenergy is not perceived as a beneficial investment. In the nexus framework, the possibility of increasing the crop production through more cultivated area and water efficiency improvement in irrigation, turn the bioenergy plant into a beneficial investment.
Seasonality also plays an important role in the interrelations between the sectors. Within the energy silo approach, wind power is perceived as more profitable than solar, as it has lower investment costs (Table 1). However, wind production is low when there is no irrigation demand (Figure 3C), so compensating the wind power seasonal variation with hydropower releases leads to additional trade-offs with irrigation. Solar power in turn, has a low production when irrigation demand is high, so it matches hydropower production from water releases that also serve irrigation. In the silo energy framework, hydropower is considered with an average capacity factor and trade-offs with irrigation are not perceived which leads to the investment in wind power, while in the nexus framework solar power is preferred because its seasonality creates synergies with the seasonality of irrigation water demand.
The food silo framework does not consider trade-offs between irrigation and hydropower production, so it seems more profitable to invest in irrigated agriculture. In contrast, the nexus framework invests in improved rainfed agriculture to reduce trade-offs with hydropower. Similarly, the benefits of improving irrigation efficiency are better perceived in the nexus framework as it generates synergies with other water users.
Scenario Exploration
We perform investment selection for the ensemble of uncertainty scenarios. For each scenario, the optimization framework finds the optimal set of investments that maximize φ, the discounted net benefits across all commodities using both nexus and silo planning. We then use various robustness metrics to quantify the benefits of each investment option across scenarios under each planning approach. Metrics including the NPV of individual investments require with-without analysis in which each investment option is either added to the optimal set if it was not selected or removed from it if it was selected. The difference in total economic benefits between these two model runs represents the NPV of that investment option (which may be negative). From this analysis and the original optimization, we compute the following robustness metrics: (1) Percent of scenarios in which the investment option is selected in the optimization, (2) average NPV of the investment option across scenarios based on the with-without analysis, (3) NPV of the investment option that is exceeded in 66% of scenarios, and magnitude of investment in that option that is exceeded in (4) 66% and (5) 50% of scenarios. For investments that can be scaled, the NPV reported is for the full investment. Thus, the NPV-metric is not fully relevant as a partial investment might be more beneficial, hence the metric showing the share selected in a given percentile of scenarios is more relevant. We perform the analysis with the nexus and silo frameworks and show the investment performance indicators (Table 2).

Table 2. Performance indicators for investments for different frameworks and robustness metrics.
There is an important difference in the calculated robustness of investments for the silo and nexus frameworks (Table 2), similar effects to the base case are observed: the silo framework leads to the development of hydropower, irrigation and wind energy, while the nexus framework leads to more rainfed, irrigation efficiency, desalinization, bioenergy and solar power (relative to the silo framework).
There is also a variation among the robustness metrics: a more risk averse metric (e.g., share selected in 66% of scenarios vs. 50% of scenarios) leads to less investments. Figure 4 shows the empirical distribution function of the NPV of individual optimal investments in each scenario for the nexus and silo frameworks. For binary investments, the metric “Selected in 66% of scenarios” corresponds to the NPV curve crossing the vertical black line before the horizontal line. This provides a more detailed information on the risk-profile of each individual investment. For example, desalinization in the nexus framework, is found to have a negative or low NPV in a large share of scenarios but has a high NPV in the remaining ones.
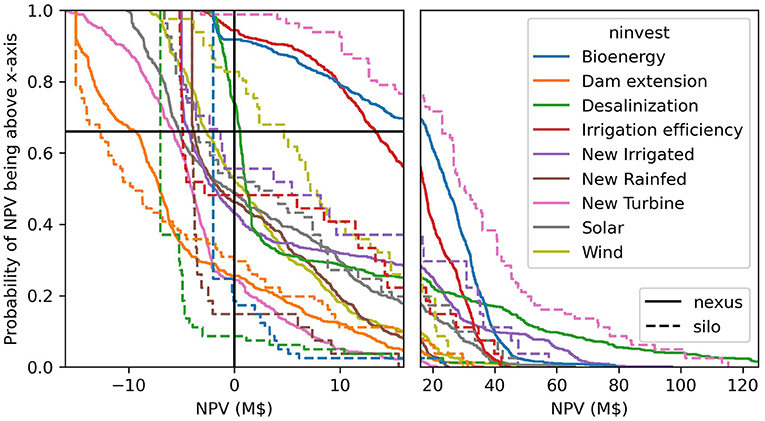
Figure 4. Investment NPV empirical distribution function with optimal investments in each scenario for the nexus analysis (solid lines) and the silo analysis (dashed lines). The crossing point with the vertical black line represents the share of scenarios with a positive NPV, the crossing point with the horizontal black line represents the NPV reached in 66% of scenarios. The x-axis is not the same scale in the left and right panels to better visualize results around NPV = 0.
An important dimension of the scenario analysis is not only to select alternatives but also to understand the weaknesses or risk factors of investments. We evaluate the sensitivity of investment decisions to uncertain parameters for the silo and nexus frameworks (Figure 5). In both silo and nexus frameworks, investments are sensitive to parameters within their respective sectors (e.g., energy investments are sensitive to energy demand, agriculture investments are sensitive to crop demand). We observe nexus effects when investments show sensitivity to parameters that are not linked to their respective sectors. For example, in the nexus framework desalinization is sensitive to a carbon tax (as energy becomes more expensive, making desalinization less profitable), solar and wind power investments are sensitive to an environmental flow policy (as it reduces hydropower production and thus increases potential for alternative power production), and the dam extension is sensitive to yields (low yields lead to higher crop prices leading to more irrigation and thus justify the dam extension). In the silo frameworks, these cross-sectoral sensitivities cannot be observed. Nexus interrelations can also be represented exogenously: for the silo energy framework, uncertainty in runoff is translated in uncertainty in hydropower production, which leads solar and wind investments to be sensitive to runoff (/hydropower production). However, this approach requires accurately representing the impact of runoff change on hydropower production and ignores other co-impacts. Here, the sensitivity of wind and solar investments to runoff is higher for the nexus framework because low runoff (and precipitation) also lead to lower agricultural production and thus less bioenergy production (Figure 5).
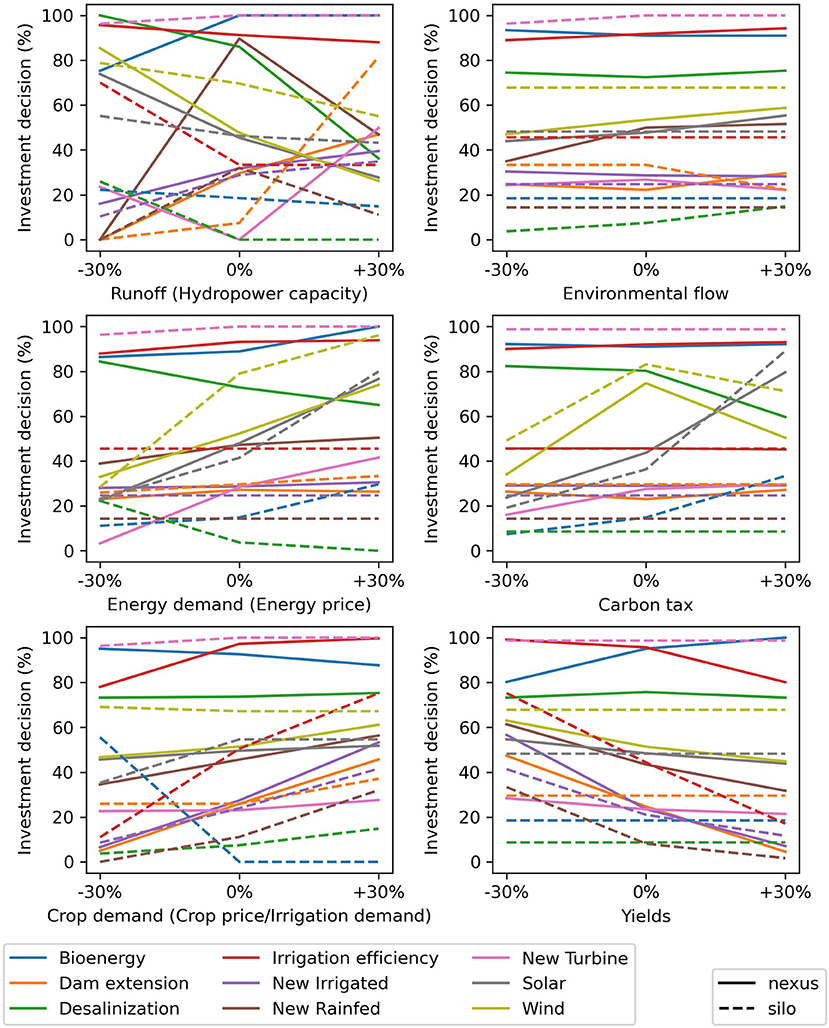
Figure 5. Sensitivity of investment average selection rate performance indicator to uncertain parameters. The y-axis shows the percentage of scenarios where a specific investment is selected (and the average selected share for investments that can be scaled), the x-axis shows the variation in an uncertain parameter (−30%, baseline scenario, +30%). The parameters between brackets specify how the uncertainty parameter was translated for the silo frameworks as specified in the case presentation. Lecture: under the current carbon tax (x = 0% in middle-right panel), the desalinization investment (green) is found beneficial (NPV > 0) in 80 and 10% of the scenarios for the nexus, and silo frameworks, respectively. In the scenarios where the carbon tax is increased by 30% (x = +30%), desalinization is found beneficial in only 60% of the scenarios for the nexus framework.
Investments might be particularly sensitive to the combination of multiple uncertain factors. We observe that the dam extension is sensitive to runoff and yields, wind investment is sensitive to runoff and crop demands and rainfed investment is sensitive to environmental flows and energy demand. In the silo framework one of the parameters is often ignored, leading the investments to be perceived as less sensitive to uncertainties. Additional results illustrating this are available in the Supplementary Material.
The investments' performances are also sensitive to other investments. For the nexus analysis, we show the perceived individual investment NPV profile (Figure 6), for: (1) optimal investments within each scenario (solid line), and (2) ignoring all other investments (dashed lines). We observe that considering investments individually significantly affects their value: bioenergy and desalinization are much less valuable when ignoring other investments (as these investments rely on new power generation and agricultural production), while hydropower development is found more beneficial (as it does not have to compete with alternative power investments). This is similar to the silo planning effect—except that in this case the decision process is only blind to other investments. This effect is expected to be important when other investments might considerably affect the current equilibrium, which is the case in this example.
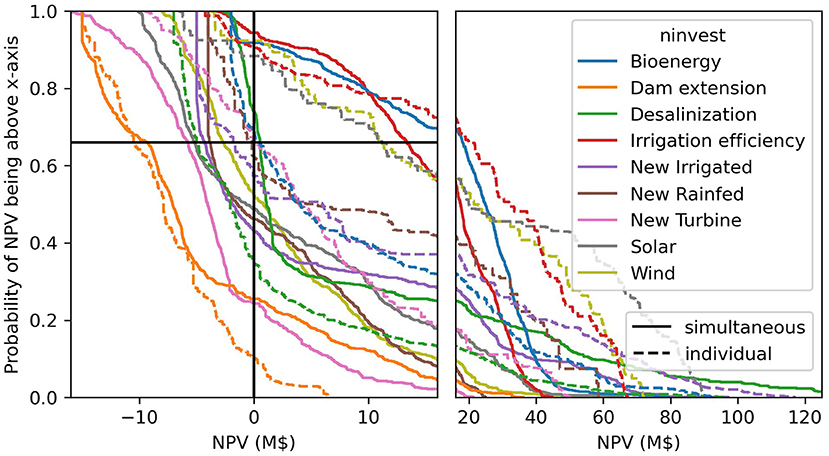
Figure 6. Investment NPV empirical distribution function with and without other investments. The NPV of each investment is calculated through with-without analysis for each scenario considering (1) optimal investments within each scenario (solid line), and (2) ignoring all other investments (dashed lines).
Re-analysis of Investment Plans
In a practical planning problem, the results of the previous steps would be presented to stakeholders and decision-makers, who would refine their objectives, potential solutions, and visions of potential futures. In addition, impacts and objectives that are outside of the modeling framework would be considered. Then, a few alternative investment plans would be designed and evaluated.
Here we assume investment plans are established by using directly two robustness metrics presented in Table 2: (1) investments are selected in at least 66% of the scenarios, (2) investments are selected in at least 50% of the scenarios. We thus consider four plans: Nexus 66%, Nexus 50%, Silo 66%, and Silo 50% that correspond to the nexus and silo frameworks for the robustness metrics (1) and (2).
We re-evaluate the investment plans through the range of uncertainty scenarios. In both cases the investments plans are re-evaluated with the nexus framework, which is assumed to be the framework most representative of reality. As expected, investment plans selected using the nexus framework perform considerably better than the investment plans selected with the silo frameworks (Figure 7). We also find that the plans that are less risk averse perform better in 98% of scenarios.
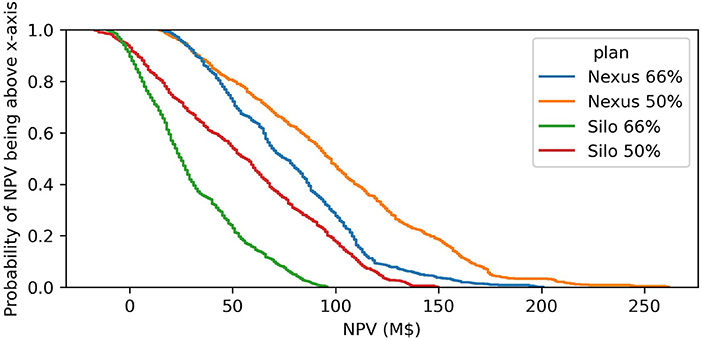
Figure 7. Investment plans NPV empirical distribution function for Silo and Nexus plans. The NPV of investments plans is calculated through with-without analysis in each scenario.
Zambezi Case
The purpose of the Zambezi study case is to demonstrate the framework on a real case that involves multiple investment types with complex interrelations at variable spatial and temporal scales.
Zambezi Water-Energy-Food Nexus
The Zambezi River Basin study case and dataset are from Payet-Burin et al. (2019). Runoff and precipitation time series cover 40 years over 26 sub-catchments with an average runoff of 127 109 m3/year. Three main reservoirs (Itezhi-Tezhi, Kariba, and Cahora Bassa) have an active storage capacity of 127 109 m3 and are the main consumptive water user through evaporation losses (about 10 109 m3). Environmental flow constraints are represented at the level of the main wetlands (Kafue flats, Baroste plain, and Mana pools) and the Zambezi delta. Cultivated area is from World Bank (2010), agricultural water demand is based on FAO 56, crop yields are based on FAO 33 yield water response function. Crop demand, price, elasticity, trade, and projections are based on (FAO, 2018) and (IFPRI, 2017). Thermal power is represented as aggregated production units per country. A power market per country is represented, including South Africa, with corresponding power demands. The power transmission network is represented with a transport model considering aggregated transmission lines between countries. For this study, no stakeholder engagement was performed but the investment plans and scenarios rely on the “Multi-Sector Investment Opportunities Analysis—Basin Development Scenarios” (World Bank, 2010) and the “Strategic Plan for the Zambezi watercourse 2018–2040” (ZAMCOM, 2019) studies. Scenarios and projects were defined and developed jointly with stakeholders in these studies.
In Payet-Burin et al. (2019) the model is used to assess the impacts of the hydropower and irrigation development plans in the Zambezi River Basin through with-without analyses considering uncertainties in future climate, socio-economic development and policies. The difference with this study, is that here: (1) investments are evaluated individually and included in the objective function, (2) investments from the power sector are included, (3) uncertainties are evaluated using a Monte-Carlo analysis, (4) nexus and silo frameworks are compared.
Potential Investments
The investments considered are irrigation development, reservoirs, and hydropower plants from World Bank (2010); power transmission lines, coal, gas, wind and solar power plants from IRENA (2013). Six reservoir projects might add up to 6,200 Mm3 of storage capacity, 13 hydropower projects 6,400 MW of power capacity, these investments represent 12.4 billion dollars. Irrigation investments represent 450 kha (currently 240 kha are irrigated), for a cost of 3.7 billion dollars. Eight transmission projects can add up to 8,000 MW of international transmission capacity in the South African Power Pool, almost doubling the current capacity for transmission at a cost of 2.1 billion dollars (IRENA, 2013). Power plant investments are not represented at the scale of particular projects, but using generic investments (IRENA, 2013; Taliotis et al., 2016). In the model, investments are selected every 5 years, hydropower, reservoirs, and transmission lines are represented as binary investments (all or nothing), while irrigation and power plants can be scaled to the optimal amount. Irrigation investments are limited to the investment plan in World Bank (2010) but can be renewed every 5 years, while lifetime is assumed to be 20 years. Irrigation investments are assumed to replace rainfed area, thus investments costs are the cost of equipping rainfed areas. Wind and Solar power availability are based on Wright et al. (2017) and Knorr et al. (2016); wind power is assumed to be only available in coastal countries, gas power plants in countries that have gas resources.
In total, those represent 92 different potential investments, for a total capital cost of 20.7 billion dollars. The full list of investments with their individual capital costs, operating costs, lifetime, and construction time is available in the Supplementary Material.
Uncertainty Scenarios
For the planning horizon 2020–2050 we consider key parameter projections (demands, yields, capital costs, climate change, rainfed area) from Payet-Burin et al. (2019), as well as uncertainties for 8 parameters:
• we consider 18 climate change projections (Cervigni et al., 2015) that could impact mean runoff by −54 to +35%,
• we consider 3 levels of environmental flow policies, releasing an artificial flood of 4,500, 7,000 or 10,000 m3/s in February (World Bank, 2010)
• crop demand is expected to grow by 60% from 2010 to 2030 (IFPRI, 2017; FAO, 2018), we consider two alternative scenarios in which the growth occurs 20% slower or 20% faster
• yields are expected to grow by 40% from 2010 to 2030 (OECD, 2017), we consider two alternative scenarios in which the growth occurs 20% or 40% slower
• energy demand is expected to grow by 87% from 2010 to 2030 (SAPP, 2015), we consider two alternative scenarios in which the growth occurs 20% slower or 20% faster
• we consider no carbon tax, a 25 $/t-CO2 tax as in IRENA (2013), or a 50 $/t-CO2 tax
• capital costs of renewable energies are expected to decrease [IRENA (2013): solar PV from 2000 $/kW in 2010 to 1000 $/kW in 2030], we consider two alternative scenarios in which the decrease occurs 30% slower or 30% faster.
• we consider discount rates from 8 to 12%.
All uncertainties considered here are parametric uncertainties, except the discount rate which is an objective uncertainty, see Dobson et al. (2019) for other types of uncertainty considerations.
Frameworks
We consider three frameworks reflecting different perspectives about the planning problem: the nexus framework is the integrated planning approach considering all systems and potential investments jointly; while the Water-Energy and Water-Food silo frameworks do not consider all sectors and investments. The Water-Energy framework considers investments related to reservoirs, hydropower, transmission lines, thermal and renewable power and ignores the food system, including irrigation water abstraction. The Water-Food framework considers irrigation development investments and ignores the energy system, reservoirs are considered, but not hydropower production. For both silo frameworks, the water system and environmental flows are considered.
Results of Scenario Exploration
We perform a Monte-Carlo analysis by sampling randomly 300 scenarios, which are a combination of the described uncertainties, and we compare the outcomes for the silo and nexus frameworks.
The silo frameworks lead to significantly more investments in irrigated agriculture (+22%), slightly more investments in hydropower capacity (+7%), and less thermal capacity (−5%) than the nexus framework (Table 3). As irrigated agriculture and hydropower compete for the same water resource, considering them jointly leads to less investments as the resource constraint becomes binding. In particular, irrigation investments in the upper and lower Kafue are perceived as beneficial only in the silo framework (Figure 8). The water in Kafue is particularly valuable as several hydropower plants depend solely on it (Ithezi thezi, Kafue Gorge Upper, Kafue Gorge lower), others depend partially on it (Cahora Bassa and Mphanda Nkuwa), and environmental flow requirements force releases in the Kafue Flats.
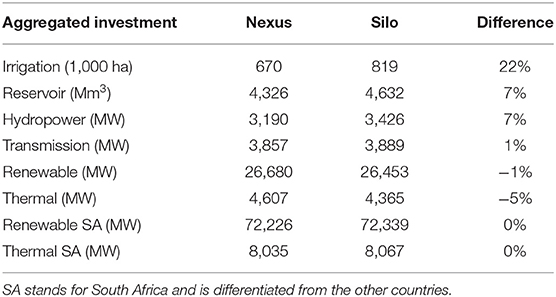
Table 3. Average investment capacity per investment type for the silo and nexus frameworks.
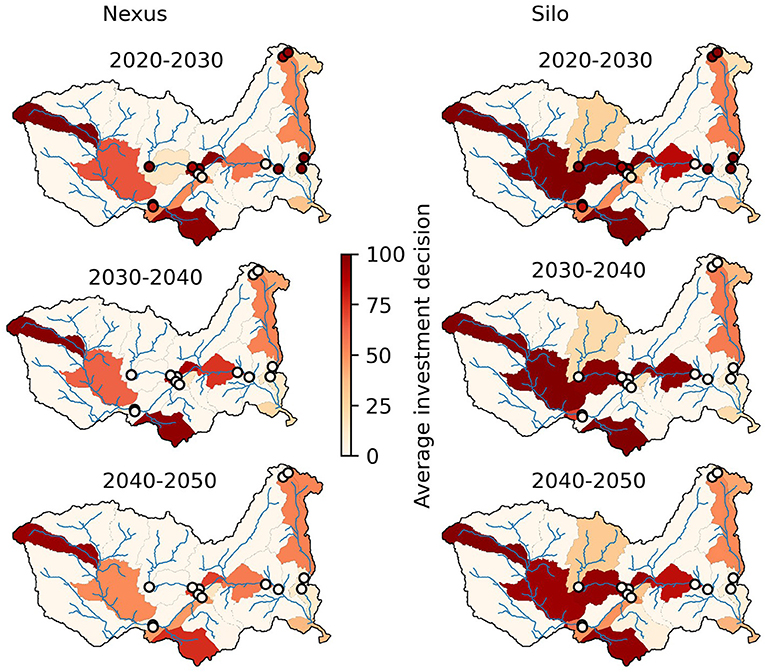
Figure 8. Investments in irrigation and hydropower for the nexus and silo frameworks. Dots represent hydropower plants, catchments represent irrigation. The average investment decisions represent the percentage of scenarios where hydropower investments are found beneficial (NPV > 0), and the average invested percentage in irrigation expansion for irrigation investments as described in World Bank (2010).
The investment sequence (Figure 9) shows it is optimal to invest in hydropower, reservoir, and transmission capacity as early as possible. Thermal power investments are found to decrease progressively with time while renewable energy investments increase; this is because we assume the progressive deployment of a carbon tax in some scenarios. In general, power investments are higher in the early phases, because currently power demand is not fully satisfied, and power curtailments are frequent in various countries.
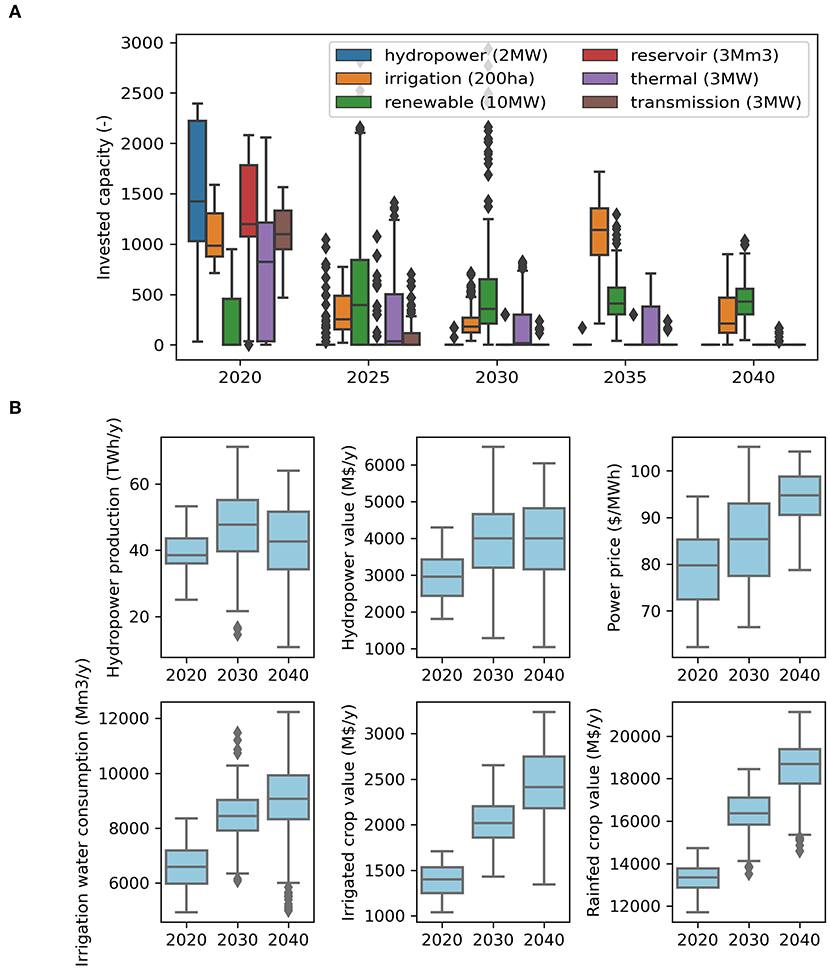
Figure 9. Investment sequence (A) and evolution of key indicators (B) in the Zambezi River Basin for the nexus framework. Boxplots show the variability among scenarios. The box represents the quartiles Q1–Q3, the bar represents the median (Q2), the top whisker the highest datapoint within Q3 + 1.5*(Q3–Q1) and dots are values beyond this.
Early investments in hydropower plants should lead to higher hydropower production in the 2030 decade, however production is likely to decline in the 2040 decade (Figure 9). This decline can be attributed to climate change and consequent reduction in runoff. For hydropower plants, the decreasing production should be partially compensated by increasing power prices (from 80 in 2020 to 95 $/MWh in 2040). There is an important variability among scenarios which increases with time: average hydropower production varies with a factor 2 among the best and worst scenarios in 2020, but with a factor 6 in the 2040 decade. Irrigation consumptive water use should continue to increase in the river basin, but a strong variability exists among scenarios: in the 2040 decade, irrigation consumption is evaluated between 6,000 and 12,000 Mm3 per year. The main production of crops is ensured by rainfed crops, and their total market value is about 7 times higher than irrigated crops.
We find that investments are mainly sensitive to parameters of their respective sectors (Figure 10): hydropower, reservoir, and irrigation investments are sensitive to climate change (/runoff and precipitation), irrigation investments are sensitive to crop yields, and power investments are very sensitive to carbon taxes. The perceived sensitivity profile is similar for the nexus and silo frameworks, except that irrigation and hydropower investments are higher in the silo frameworks. This shows that the agriculture and energy systems are relatively decoupled in terms of uncertainty analysis. However, hydropower investments are sensitive to the parameters of the energy system: energy demand, carbon tax, and capital costs of renewable energies. The discount rate is found to be a driving factor for all investments. Only thermal investments are favored by an increasing discount rate. This is because thermal investments have lower capital costs followed by high operational costs (use of fuel), while renewable energies have high capital costs followed by low operational costs and are thus penalized by a higher discount rate.
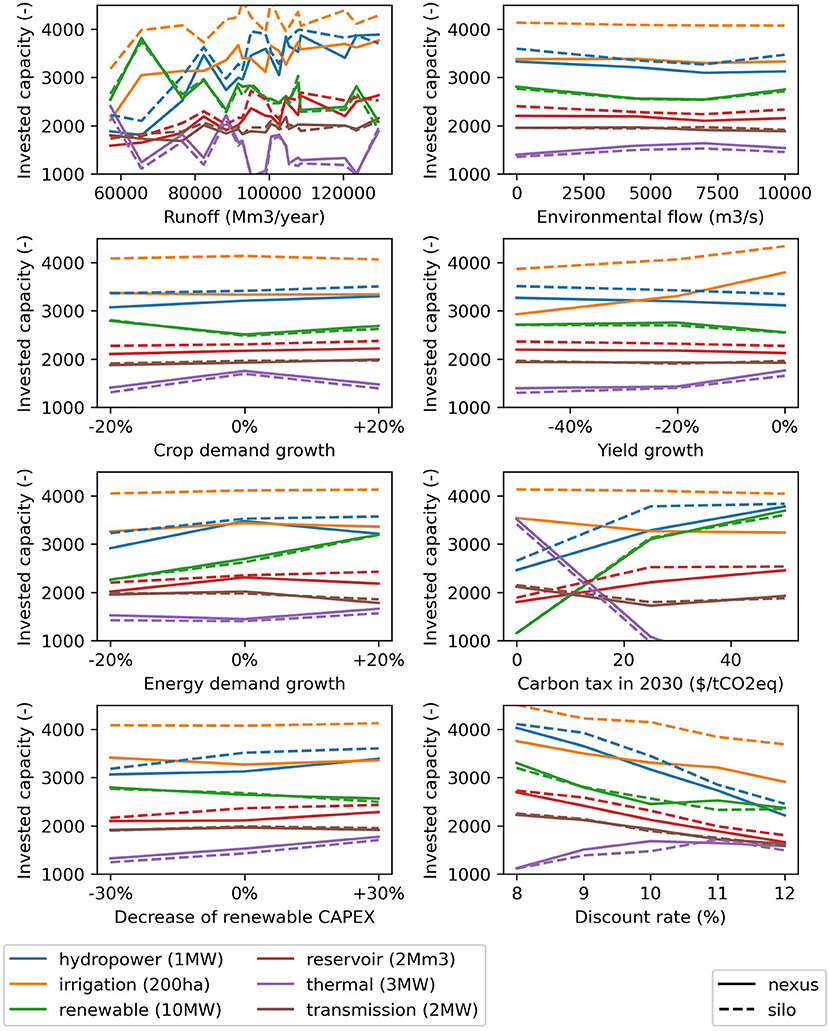
Figure 10. Sensitivity of average invested capacity to uncertain parameters. The y-axis shows the aggregated capacity per type of selected investments, the x-axis shows the variation in an uncertain parameter.
Ansar et al. (2014) and Awojobi and Jenkins (2015) show that the costs of large hydropower projects are systematically underestimated as 75% of evaluated hydropower project suffered cost-overrun, while the average regional cost overrun in Africa is found around 30%. We perform an additional analysis adding an uncertainty factor on the capital costs of reservoir-hydropower projects that is randomly selected (between 0.8 and 1.5) independently for each project, while using the same Monte Carlo scenarios as for the previous analysis to re-optimize investments. We find that the Mphanda Nkuwa and Kholombidzo (hydropower) dams are found beneficial even with large cost over-runs, however the Kafue Gorge Low, Rumakali, and particularly the Batoka Gorge dams are sensitive to cost over-runs (Figure 11). Other risks highlighted by Ansar et al. (2014) are important changes in currency exchange rates, which might affect all investments that rely on imports, as well as inflation. This might be relevant here, for example Zimbabwe had an inflation rate of 255% in 2019.
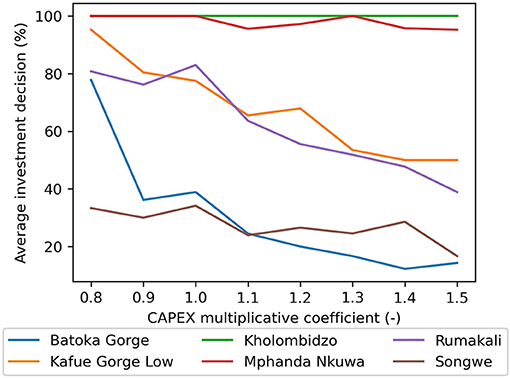
Figure 11. Sensitivity analysis of the main hydropower dams to capital investments costs.
Re-analysis of Investments Plans
Based on the previous results, in a stakeholder dialogue process, a few alternative investment plans could be formulated, taking into account the robustness evaluation, as well as other technical or political considerations. In particular, investments might have different impacts on livelihood, especially for the poorest. Overlooking this in a practical case, might lead to an exclusive focus on resource efficiency while neglecting important equity aspects (Allouche et al., 2015). Here we formulate a silo and a nexus plan by using an arithmetic criterion: investments are selected if they are found optimal (which means a positive NPV here) in more than 50% of the scenarios. For investments that can be scaled the average invested capacity is selected.
The “nexus” and “silo” investment plans are similar; the main difference is the amount of irrigated area. On average, the silo plan also showed a higher selection of hydropower projects (+7%), however when applying the robustness selection criteria, the nexus and silo framework select the same hydropower projects. We re-analyze the Monte-Carlo scenarios by implementing the selected investment plans.
Little difference can be observed between the methodologies with respect to the NPV resulting from the re-analysis of the investment plan (Figure 12). The main difference is that the NPV of irrigation investments is lower in the silo framework, as some irrigation projects were selected while ignoring the use of water for hydropower production.
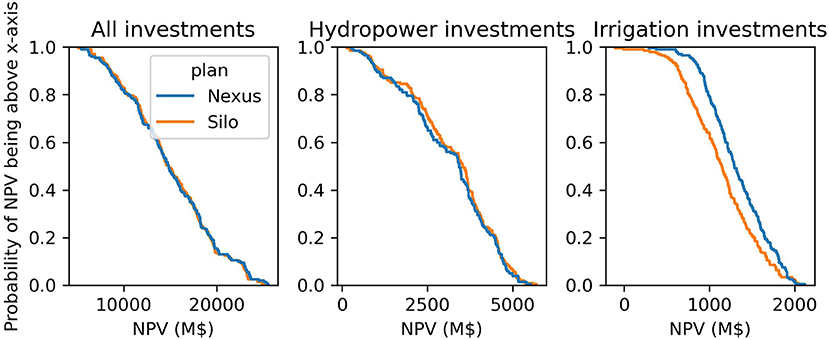
Figure 12. Investment plan reanalysis. Hydropower investments contain hydropower reservoirs.
Conclusion
We investigated the benefits of planning infrastructure under uncertainty in a nexus compared to a sector-centered (silo) perspective. We developed an investment selection module for the open-source WHAT-IF hydroeconomic model by integrating investment decisions in the economic objective function. The framework was demonstrated in two study cases.
In the synthetic case, the silo frameworks lead to the selection of investments that generate more trade-offs, while the nexus framework selects investments to maximize synergies across sectors. For example, the nexus framework leads to co-investments in renewable energy and desalinization, irrigation efficiency measures generating co-benefits to other water users, and power investments that fit the seasonality of hydropower resources and demand. Several investments are found sensitive to uncertainties not related to their respective sectors: in the nexus framework desalinization is sensitive to a carbon tax, solar and wind power investments are sensitive to an environmental flow policy, and the dam extension is sensitive to yields. This shows that cross-sectoral linkages and uncertainties are related. This can be explained by the fact that investments and uncertainties lead to important changes in the supply/demand equilibrium (and thus prices) of commodities in the water, energy, and agricultural sectors. The synthetic case is simplistic on purpose to expose some effects observed in real world applications.
Other studies highlight different types of effects. Vinca et al. (2021) show that planning investments in a nexus framework can facilitate cooperation between countries in the Indus Basin. Cooperation could reduce investment needs in the water, energy, and agriculture sectors by 20%, but is not profitable to all countries in all sectors. However, across the sectors, cooperation is found beneficial for all countries. Khan et al. (2020) find that improving the efficiency of beef production in Uruguay would lead to shift pasture land to crop land, significantly increasing water withdrawals. Sridharan et al. (2020) find that a policy reducing the use of biomass in Uganda would lead to increase fossil fuel production, transferring a large part of the saved greenhouse gas emissions to the electric sector, increasing electricity prices and leading farmers to shift from irrigated to rainfed agriculture.
In the Zambezi River Basin case, there is a clear trade-off between water for irrigation and for hydropower. Ignoring this trade-off in the silo frameworks leads to 22% additional investments in irrigation that are not perceived as beneficial when adopting a nexus framework. However, since irrigation is a minor share of total crop production, the competition for water with hydropower affects mainly the irrigation sector and not the entire agricultural sector. Furthermore, agriculture for bioenergy is not developed in the Zambezi, and irrigation is minor user of electricity. Thus, there is only a weak coupling between the agricultural and energy sectors and most investments are mainly sensitive to parameters of their respective sectors. Climate change has significant impacts on irrigation and hydropower investments, about twice as much hydropower and irrigation development is found beneficial in the best-case compared to the worst-case climate projection. Financial parameters such as discount rate, capital costs or carbon taxes drive the feasibility of most investments.
Jointly representing the water, energy, and agricultural sectors better characterizes the resource use. For example, representing irrigation and hydropower within the energy and agricultural sectors enables characterizing: when the water is needed, where it is needed, how much is needed, and how valuable it is. Thus, planning in a nexus framework is expected to be particularly important when projects and uncertainties can considerably affect the current equilibrium and result in feed-back effects across sectors. For example, irrigation can stabilize variability in crop supply linked to climate variability, hydropower plants can stabilize intermittency constraints or seasonal variation in the power sector. That is often the case when one resource (e.g., water, land) is important to several sectors and a level of scarcity exists. However, the level of scarcity of a resource depends on the temporal and spatial scales considered, the quality of the resource, future trends with their associated uncertainty, and on environmental considerations (e.g., water or land for ecosystems).
Finally, jointly modeling the water, energy, and agricultural sectors enables considering a larger range of solutions that may simultaneously achieve the goals pursued in different sectors (e.g., enhanced rainfed agriculture can be an alternative to developing irrigation), while evaluating the negative consequences on other sectors (e.g., impact of irrigation on water available for other uses). Thus, when planning water, energy, and agriculture investments, we recommend to systematically investigate the interactions between the different sectors to determine the required level of integration in the planning process.
Data Availability Statement
Publicly available datasets were analyzed in this study. The datasets and the model used for this study can be found in the WHAT-IF git repository https://github.com/RaphaelPB/WHAT-IF.
Author Contributions
PB-G, SP-C, MK, and KS contributed to conception and design of the study. RP-B performed the model simulations and wrote the manuscript. All authors contributed to manuscript revision, read, and approved the submitted version.
Funding
This work was supported by Innovation Fund Denmark (grant no. 7038-00015B), COWIFonden (grant no. C-137.02), and COWI A/S funded the industrial PhD project in which this research was carried out.
Conflict of Interest
During their contribution to this manuscript, SP-C, RP-B, and MK were employed by COWI A/S, and KS was employed by Industrial Economics, Incorporated (IEc). The mentioned employments did not interfere with the present manuscript.
The remaining author declares that the research was conducted in the absence of any commercial or financial relationships that could be construed as a potential conflict of interest.
Acknowledgments
The authors would like to thank Charles Fant for providing the climate change projections in the Zambezi River Basin. We would also like to thank the two reviewers which improved the manuscript through their review.
Supplementary Material
The Supplementary Material for this article can be found online at: https://www.frontiersin.org/articles/10.3389/frwa.2021.672382/full#supplementary-material
References
Allouche, J., Middleton, C., and Gyawali, D. (2015). Technical veil, hidden politics: interrogating the power linkages behind the nexus. Water Altern. 8, 610–626.
Ansar, A., Flyvbjerg, B., Budzier, A., and Lunn, D. (2014). Should we build more large dams? The actual costs of hydropower megaproject development. Energy Policy 69, 43–56. doi: 10.1016/j.enpol.2013.10.069
Awojobi, O., and Jenkins, G. P. (2015). Were the hydro dams financed by the World Bank from 1976 to 2005 worthwhile? Energy Policy 86, 222–232. doi: 10.1016/j.enpol.2015.06.040
Bakhshianlamouki, E., Masia, S., Karimi, P., van der Zaag, P., and Sušnik, J. (2020). A system dynamics model to quantify the impacts of restoration measures on the water-energy-food nexus in the Urmia lake Basin, Iran. Sci. Total Environ. 708:134874. doi: 10.1016/j.scitotenv.2019.134874
Bazilian, M., Rogner, H., Howells, M., Hermann, S., Arent, D., Gielen, D., et al. (2011). Considering the energy, water and food nexus: towards an integrated modelling approach. Energy Policy 39, 7896–7906. doi: 10.1016/j.enpol.2011.09.039
Calvin, K., Patel, P., Clarke, L., Asrar, G., Bond-Lamberty, B., Yiyun Cui, R., et al. (2019). GCAM v5.1: representing the linkages between energy, water, land, climate, and economic systems. Geosci. Model Dev. 12, 677–698. doi: 10.5194/gmd-12-677-2019
Cervigni, R., Liden, R., Neumann, J. E., and Strzepek, K. M. (2015). Enhancing the Climate Resilience of Africa's Infrastructure: The Power and Water Sectors. doi: 10.1596/978-1-4648-0466-3 Available online at: https://openknowledge.worldbank.org/handle/10986/21875. (accessed May 5, 2021).
Dobson, B., Wagener, T., and Pianosi, F. (2019). How important are model structural and contextual uncertainties when estimating the optimized performance of water resource systems? Water Resour. Res. 55, 2170–2193. doi: 10.1029/2018WR024249
Dogan, M. S., Fefer, M. A., Herman, J. D., Hart, Q. J., Merz, J. R., Medellín-Azuara, J., et al. (2018). An open-source Python implementation of California's hydroeconomic optimization model. Environ. Model. Softw. 108, 8–13. doi: 10.1016/j.envsoft.2018.07.002
FAO (2018). FAOSTAT. Available online at: http://www.fao.org/faostat/en/#data/QC (accessed July 27, 2018).
Fletcher, S., Lickley, M., and Strzepek, K. (2019). Learning about climate change uncertainty enables flexible water infrastructure planning. Nat. Commun. 10, 1–11. doi: 10.1038/s41467-019-09677-x
Hamidov, A., and Helming, K. (2020). Sustainability considerations in water – energy – food nexus research in irrigated agriculture. Sustainability 12:6274. doi: 10.3390/su12156274
Hart, W. E., Laird, C. D., Watson, J.-P., Woodruff, D. L., Hackebeil, G. A., Nicholson, B. L., et al. (2017). Pyomo — Optimization Modeling in Python. New York, NY: Springer International Publishing. doi: 10.1007/978-3-319-58821-6
Herman, J. D., Quinn, J. D., Steinschneider, S., Giuliani, M., and Fletcher, S. (2020). Climate adaptation as a control problem: review and perspectives on dynamic water resources planning under uncertainty. Water Resour. Res. 56:e24389. doi: 10.1029/2019WR025502
Hoff, H. (2011). Understanding the Nexus. Background Paper for the Bonn 2011 Conference: The Water, Energy and Food Security Nexus, Stockholm, Sweden. Available online at: https://mediamanager.sei.org/documents/Publications/SEI-Paper-Hoff-UnderstandingTheNexus-2011.pdf (accessed May 5, 2021).
IBM (2017). IBM ILOG CPLEX Optimization Studio: CPLEX 12.7 User's Manual, 562. Available online at: https://www.ibm.com/support/knowledgecenter/SSSA5P_12.7.1/ilog.odms.studio.help/Optimization_Studio/topics/COS_home.html (accessed May 5, 2021).
IFPRI (2017). IMPACT Projections of Demand for Agricultural Products: Extended Country-level Results for 2017 GFPR Annex IMPACT Trend 1.
IRENA (2013). Southern African Power Pool: Planning and Prospects for Renewable Energy, 1–91. Available online at: https://www.irena.org/-/media/Files/IRENA/Agency/Publication/2013/SAPP.pdf
Johnson, N., Burek, P., Byers, E., Falchetta, G., Flörke, M., Fujimori, S., et al. (2019). Integrated solutions for thewater-energy-land nexus: are global models rising to the challenge? Water 11, 1–32. doi: 10.3390/w11112223
Kasprzyk, J. R., Nataraj, S., Reed, P. M., and Lempert, R. J. (2013). Many objective robust decision making for complex environmental systems undergoing change. Environ. Model. Softw. 42, 55–71. doi: 10.1016/j.envsoft.2012.12.007
Khan, Z., Linares, P., and García-González, J. (2017). Integrating water and energy models for policy driven applications. A review of contemporary work and recommendations for future developments. Renew. Sust. Energy Rev. 67, 1123–1138. doi: 10.1016/j.rser.2016.08.043
Khan, Z., Wild, T. B., Silva Carrazzone, M. E., Gaudioso, R., Mascari, M. P., Bianchi, F., et al. (2020). Integrated energy-water-land nexus planning to guide national policy: an example from Uruguay. Environ. Res. Lett. 15:094014. doi: 10.1088/1748-9326/ab9389
Knorr, K., Zimmermann, B., Bofinger, S., and Gerlach, A.-K. (2016). Wind and Solar PV Resource Aggregation Study for South Africa. Fraunhofer IWES, RFP No. 542-23-02-2015, 1–66. Available online at: https://www.csir.co.za/sites/default/files/Documents/Wind%20and%20Solar%20PV%20Resource%20Aggregation%20Study%20for%20South%20Africa_Final%20report.pdf
Lamontagne, J. R., Reed, P. M., Link, R., Calvin, K. V., Clarke, L. E., and Edmonds, J. A. (2018). Large ensemble analytic framework for consequence-driven discovery of climate change scenarios. Earth's Future 6, 488–504. doi: 10.1002/2017EF000701
Lempert, R., Popper, S., and Bankes, S. (2003). Shaping the Next One Hundred Years: New Methods for Quantitative, Long-Term Policy Analysis. Santa Monica, CA: RAND. doi: 10.7249/MR1626
Lempert, R. J., and Groves, D. G. (2010). Identifying and evaluating robust adaptive policy responses to climate change for water management agencies in the American west. Technol. Forecast. Soc. Change 77, 960–974. doi: 10.1016/j.techfore.2010.04.007
McCarl, B. A., Yang, Y., Schwabe, K., Engel, B. A., Mondal, A. H., Ringler, C., et al. (2017). Model use in WEF Nexus analysis: a review of issues. Curr. Sust. Energy Rep. 4, 144–152. doi: 10.1007/s40518-017-0078-0
Miralles-Wilhelm, F. (2016). Development and application of integrative modeling tools in support of food-energy-water nexus planning—a research agenda. J. Environ. Stud. Sci. 6, 3–10. doi: 10.1007/s13412-016-0361-1
Moallemi, E. A., Zare, F., Reed, P. M., Elsawah, S., Ryan, M. J., and Bryan, B. A. (2020). Structuring and evaluating decision support processes to enhance the robustness of complex human–natural systems. Environ. Model. Softw. 123:104551. doi: 10.1016/j.envsoft.2019.104551
Nerini, F. F., Sovacool, B., Hughes, N., Cozzi, L., Cosgrave, E., Howells, M., et al. (2019). Connecting climate action with other sustainable development goals. Nat. Sust. 2, 674–680. doi: 10.1038/s41893-019-0334-y
OECD FAO. (2017). OECD-FAO Agricultural Outlook 2017-2026. Available online at: https://stats.oecd.org/index.aspx?queryid=76858 (accessed December 13, 2018). doi: 10.1787/agr_outlook-2017-en
Payet-Burin, R., Kromann, M., Pereira-Cardenal, S., Strzepek, K. M., and Bauer-Gottwein, P. (2019). WHAT-IF: an open-source decision support tool for water infrastructure investment planning within the water-energy-food-climate nexus. Hydrol. Earth Syst. Sci. 23, 4129–4152. doi: 10.5194/hess-23-4129-2019
Payet-Burin, R., Kromman, M., Pereira-Cardenal, S., Strzepek, K. M., and Bauer-Gottwein, P. (2020). The impact of assuming perfect foresight for investment analysis in water resources systems. ESSOAR, 20. doi: 10.1002/essoar.10504115.1
Ray, P. A., and Brown, C. M. (2015). Confronting Climate Uncertainty in Water Resources Planning and Project Design The Decision Tree Framework. Washington, DC: International Bank for Reconstruction and Development/The World Bank
Ray, P. A., Taner, M. Ü., Schlef, K. E., Wi, S., Khan, H. F., Freeman, S. S. G., et al. (2019). Growth of the decision tree: advances in bottom-up climate change risk management. J. Am. Water Resour. Assoc. 55, 920–937. doi: 10.1111/1752-1688.12701
Riahi, K., van Vuuren, D. P., Kriegler, E., Edmonds, J., O'Neill, B. C., Fujimori, S., et al. (2017). The shared socioeconomic pathways and their energy, land use, and greenhouse gas emissions implications: an overview. Global Environ. Change 42, 153–168. doi: 10.1016/j.gloenvcha.2016.05.009
SAPP (2015). South African Power Pool, Annual Report 2015, Harare, Zimbabwe. Available online at: http://www.sapp.co.zw/annual-reports (accessed May 5, 2021).
Sridharan, V., Shivakumar, A., Niet, T., Ramos, E. P., and Howells, M. (2020). Land, energy and water resource management and its impact on GHG emissions, electricity supply and food production- Insights from a Ugandan case study. Environ. Res. Commun. 2:085003. doi: 10.1088/2515-7620/abaf38
Taliotis, C., Shivakumar, A., Ramos, E., Howells, M., Mentis, D., Sridharan, V., et al. (2016). An indicative analysis of investment opportunities in the African electricity supply sector—using TEMBA (The Electricity Model Base for Africa). Energy Sust. Dev. 31, 50–66. doi: 10.1016/j.esd.2015.12.001
Tomlinson, J. E., Arnott, J. H., and Harou, J. J. (2020). A water resource simulator in Python. Environ. Model. Softw. 126:104635. doi: 10.1016/j.envsoft.2020.104635
UN General Assembly (2015). Transforming our world: the 2030 Agenda for Sustainable Development. Available online at: https://sdgs.un.org/2030agenda
Vinca, A., Parkinson, S., Byers, E., Burek, P., Khan, Z., Krey, V., et al. (2020). The NExus Solutions Tool (NEST) v1.0 : an open platform for optimizing multi-scale energy – water – land system transformations. Geosci. Model Dev. 13, 1095–1121. doi: 10.5194/gmd-13-1095-2020
Vinca, A., Parkinson, S., Riahi, K., Byers, E., and Siddiqi, A. (2021). Trans-boundary cooperation key to sustainable development in the Indus Basin. Nat. Sust. 4, 331–339. doi: 10.1038/s41893-020-00654-7
Wild, T. B., Birnbaum, A. N., Reed, P. M., and Loucks, D. P. (2021). An open source reservoir and sediment simulation framework for identifying and evaluating siting, design, and operation alternatives. Environ. Model. Softw. 136:104947. doi: 10.1016/j.envsoft.2020.104947
Wright, J., Bischo-Niemz, T., Calitz, J., Mushwana, C., Van Heerden, R., and Senatla, M. (2017). Formal comments on the Integrated Resource Plan (IRP).
Yates, D., Sieber, J., Purkey, D., and Huber-Lee, A. (2005). WEAP21—a demand-, priority-, and preference-driven water planning model. Part 1: Model characteristics. Water Int. 30, 487–500. doi: 10.1080/02508060508691893
ZAMCOM (2019). Strategic Plan for the Zambezi watercourse 2018-2040. Harare, Zimbabwe. Available at: www.zambezicommission.org (accessed May 5, 2021).
Keywords: water-energy-food nexus, planning, infrastructure, uncertainty, robust decision making, hydroeconomic, decision support, WHAT-IF
Citation: Payet-Burin R, Kromann M, Pereira-Cardenal S, Strzepek KM and Bauer-Gottwein P (2021) Nexus vs. Silo Investment Planning Under Uncertainty. Front. Water 3:672382. doi: 10.3389/frwa.2021.672382
Received: 25 February 2021; Accepted: 22 April 2021;
Published: 21 May 2021.
Edited by:
Amaury Tilmant, Laval University, CanadaReviewed by:
Benjamin F. Zaitchik, Johns Hopkins University, United StatesJulianne Quinn, University of Virginia, United States
Copyright © 2021 Payet-Burin, Kromann, Pereira-Cardenal, Strzepek and Bauer-Gottwein. This is an open-access article distributed under the terms of the Creative Commons Attribution License (CC BY). The use, distribution or reproduction in other forums is permitted, provided the original author(s) and the copyright owner(s) are credited and that the original publication in this journal is cited, in accordance with accepted academic practice. No use, distribution or reproduction is permitted which does not comply with these terms.
*Correspondence: Raphaël Payet-Burin, cmFweUBjb3dpLmNvbQ==