 Rosanna A. Lane
 Alison L. Kay
- UK Centre for Ecology & Hydrology, Wallingford, United Kingdom
Climate change could intensify hydrological extremes, changing not just the magnitude but also the timing of flood and drought events. Understanding these potential future changes to hydrological extremes at the national level is critical to guide policy decisions and ensure adequate adaptation measures are put in place. Here, climate change impact on the magnitude and timing of extreme flows is modelled across Great Britain (GB), using an ensemble of climate data from the latest UK Climate Projections product (UKCP18) and a national grid-based hydrological model. All ensemble members show large reductions in low flows, of around −90 to −25% for 10-year return period low flows by 2050–2080. The direction of change for high flows is uncertain, but increases in 10-year return period high flows of over 9% are possible across most of the country. Simultaneous worsening of both extremes (i.e., a reduction in low flows combined with an increase in high flows) are projected in the west. Changes to flow timing are also projected; with mostly earlier annual maximum flows across Scotland, later annual maximum flows across England and Wales, and later low flows across GB. However, these changes are generally not statistically significant due to the high interannual variability of annual maximum/minimum flow timing. These results highlight the need for adaptation strategies that can cope with a wide range of future changes in hydrological extremes, and consider changes in the timing as well as magnitude.
Introduction
Climate change is expected to intensify the hydrological cycle, potentially leading to increased flood and drought risk in the future (Huntington, 2006; Trenberth, 2011; Lavers et al., 2015). For the UK, climate model projections indicate a move towards hotter, drier summers and warmer, wetter winters (Met Office, 2019), although there are considerable differences in temperature/precipitation projections between models. This changed climate could impact many aspects of river flows, including the magnitude of hydrological extremes and their timing within the year. In order to build resilience and adapt to future changes, it is important that decision-makers have credible and up-to-date projections of changes to hydrological regimes and an indication of the uncertainty surrounding these. Long-term projections are especially needed to inform multi-million pound investments in water infrastructure (such as reservoirs and flood defence schemes), which can take decades to implement and be expected to last for up to a century or more (Watts, 2010).
Current research generally suggests low flows and droughts are likely to increase in severity across Great Britain (GB) and especially in the south (Vidal and Wade, 2009; Guillod et al., 2018; Rudd et al., 2019), although there are contradicting studies which suggest long-duration meteorological droughts are likely to become less frequent for northern England or Scotland (Blenkinsop and Fowler, 2007; Vidal and Wade, 2009). Two recent studies have modelled future changes in low flows/droughts across GB using a national grid-based hydrological model. Rudd et al. (2019) found a mixed picture for changing drought intensity (maximum deficit), but increases in drought severity (mean deficit and duration) across all regions, with the largest increases in south-east England. Similarly, Kay et al. (2018) found reductions in 20-year return period low flows across GB in the region of −10 to −100%, which were generally larger in the south. These results support previous studies, showing overall increases in meteorological droughts (Vidal and Wade, 2009; Spinoni et al., 2018), river flow droughts (Feyen and Dankers, 2009; Prudhomme et al., 2014a,b), and decreases in low flows (Fowler and Kilsby, 2007; Charlton and Arnell, 2014) across GB or western Europe. Despite this evidence towards an increase in drought/low flow severity, there are still large uncertainties surrounding the magnitude of future change.
Trends in changing high flows and floods are less clear. Overall, research indicates that flooding is likely to increase across Britain, but this varies depending on catchment characteristics and spatial differences in climatic changes (Kay and Jones, 2012a; Charlton and Arnell, 2014; Bell et al., 2016; Reynard et al., 2017; Thober et al., 2018). In a Europe-wide study focused on major rivers, Dankers and Feyen (2009) compared eight future flow scenarios driven by two GCMs, two RCMs and two possible emission scenarios. They found that changes in 100-year flows across GB varied widely between scenarios, with some showing small changes in the region of +/– 5% and others showing large increases of over 40%. Of the eight scenarios, five or more predicted an increase in 100-year flows for the major river basins across GB, with some scenarios predicting decreasing flows in the north but no scenarios predicting decreasing flows in south England. This contrasts with the results of Kay (2006), who found decreasing flood peaks for catchments in the south and east of England perhaps resulting from increased summer and autumn soil moisture deficits, despite an increase in winter mean and extreme rainfall. Continued studies are therefore needed to provide evidence of potential changes to floods across GB.
Few studies analyse climate change impacts on both low flows and high flows using a consistent methodology, tending to focus on either floods, droughts or mean/seasonal flows. However, a combined approach can be advantageous. Where climate change leads to an increase in compound events (i.e., different extreme events such as droughts and floods occur in close proximity), this could exacerbate the impacts on society (Hao et al., 2018). To understand how the occurrence of compound events may change, it is important that changes to high and low flow extremes are analysed in a consistent way so that they are comparable. Two recent studies have evaluated changes to hydro-hazards for GB, identifying future “hotspots” where concurrent increases in flood and drought risk were projected (Collet et al., 2018; Visser-Quinn et al., 2019). Visser-Quinn et al. (2019) identified compound hydro-hazard hotspots for GB by analysing simulations from the EDgE project. This provided an indication of which regions were most likely to become hotspots, highlighting these areas for policy and decision makers as areas of high concern requiring focused additional study. However, the EDgE project applied GCMs and hydrological models across a European domain, and the simulations are therefore relatively course across GB (0.5° resolution GCMs, 5 km hydrological models) and so not suitable to support analysis in smaller catchments (Marx et al., 2018; Visser-Quinn et al., 2019). Hence there is a need for consistent evaluation of climate change impacts on high and low flow extremes using the most up-to-date and high resolution national models for GB.
Recent analysis of a large database of observed river discharge and water level observations across Europe shows clear patterns of a change in flood timing (Blöschl et al., 2017). For GB, Blöschl et al. (2017) find a broad north/south divide with trends of later flood peaks for northern England and Scotland and earlier flood peaks for south-west England, by up to 8 days per decade. They attribute later floods in northern GB to later winter storms, whilst earlier floods in the south-west are attributed to earlier soil moisture maxima. Few studies have modelled shifts in the timing of extremes nationally across GB into the future, yet understanding how the timing of extreme events may change is important. Societies and ecosystems have adapted to the average within-year timing of extremes, and therefore small shifts in extreme flow seasonality can result in considerable economic, societal and environmental consequences without suitable adaptation measures. For example, understanding of the timing of floods and droughts is important for reservoir operation and farming practises (Blöschl et al., 2017). Kay and Jones (2012a) and Kay and Crooks (2014) demonstrated how hydrological models could be used to explore changes in the timing of annual maximum flows for small samples of British catchments. It is essential that this work is extended, to understand how the timing of both high and low flow extremes could be impacted by future climate change.
The science surrounding hydrological climate impacts is continually improving, and it is important to update research as new data/techniques become available. Much of the literature on climate change impacts on extreme flows across GB is based on the UKCP09 climate projections (e.g., Bell et al., 2012, 2016; Kay and Jones, 2012b; Rahiz and New, 2013; Wade et al., 2013; Charlton and Arnell, 2014; Kay et al., 2014). A new UK Climate Projections product (UKCP18) has recently been released, as an update to UKCP09 (Lowe et al., 2019). Here the state-of-the-art UKCP18 climate projections are used as input to a national hydrological model, to answer the following research questions:
1. What are the potential impacts of climate change for low flow frequency and flood frequency across four large catchments in GB?
2. How might climate change impact the magnitude of 10-year return period high flows, low flows and compound hydro-hazards nationally across Great Britain?
3. What are the modelled changes in timing of annual maximum flows and 7-day annual minimum flows across GB, and are there any significant shifts in the timing of extreme flows?
Methods
Hydrological Modelling
A grid-based national hydrological model was used to explore how climatic changes influenced river flow. The Grid-to-Grid (G2G) model was originally developed to be coupled with regional climate model (RCM) data for hydrological climate change impact analyses, and has been widely applied to explore climate change impact on floods and droughts across GB (Bell et al., 2007, 2009, 2012; Kay et al., 2018; Rudd et al., 2019). The model runs nationally on a 1 km grid at a 15-min time-step, estimating flows for both gauged and ungauged locations, and is parameterised using digital datasets including soil maps rather than through catchment calibration (Bell et al., 2009). It includes a simple snow module, which converts precipitation into rainfall and snowmelt based on temperature (Bell et al., 2016). G2G is particularly suited to catchments with limited artificial influences, as it does not currently include human modifications to the flow regime such as abstractions/effluent returns, although the impact of urban/suburban land cover on surface runoff is included. The model has previously been shown to perform well for natural catchments across GB, both for high and low flows (Bell et al., 2009; Rudd et al., 2017).
The G2G model requires gridded inputs of precipitation and potential evapotranspiration (PET) at a 1 km daily resolution, as well as minimum and maximum daily temperatures to run the snow module (Bell et al., 2016). Here, three sets of model simulations were carried out with different driving data; (1) using observed data products over the 30-year period 1982–2011, (2) using climate data over the baseline period 1983-2012, and (3) using climate data over the future period 2051-2080 (see section Climate Model Data). The baseline simulations were initialised using a state initialisation file from an earlier observation-based run, followed by a ~2-year warm-up period. The small offset in dates between the observed and baseline climate periods was due to data availability. The observation-based model run is used to indicate the performance of the climate data as model input over the baseline period, and used the following nationally-available datasets:
1. UKCEH Gridded Estimates of Areal Rainfall (CEH-GEAR) daily gridded precipitation at 1 km resolution (Tanguy et al., 2014; Keller et al., 2015), divided equally over each model time-step throughout a day.
2. Meteorological Office Rainfall and Evaporation Calculation System (MORECS) monthly gridded estimates of PET for short grass (Hough and Jones, 1997). This was copied down from the 40 km grid to the 1 km grid (by simply assigning each 1 km grid cell the value of the 40 km grid cell within which it was contained), and divided equally over each model time-step within a month.
3. HadUK-Grid minimum and maximum air temperature at 1 km resolution (Hollis et al., 2019), which was interpolated over the day using a sine curve.
The G2G model runs over the GB domain, producing flow simulations for all major rivers (gauged and ungauged). Whilst flow data are produced for each 1 km model grid cell, this data is only analysed for “river pixels” defined as any non-tidal grid cell with a catchment area of at least 50 km2. To analyse future high/low flow changes in more detail, results are presented for four example catchments as well as looking at GB-wide changes. These example catchments were selected as they are relatively large (>3000 km2), and are distributed across GB (Figure 1). More information on these catchments is given in the Supplementary Material, and full catchment descriptions can be found in the UK Hydrometric Register (Marsh and Hannaford, 2008).
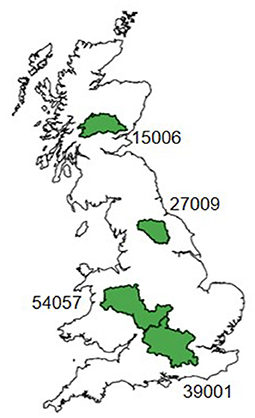
Figure 1. Location of example catchments: the Tay at Ballathie (15006), Ouse at Skelton (27009), Thames at Kingston (39001), and Severn at Haw Bridge (54057). See the Supplementary Material for a summary of catchment characteristics.
Climate Model Data
The UK Climate Projections (UKCP) produced by the UK Met Office provide state-of-the-art climate projections across the UK, to support climate change risk assessments and adaptation plans (Lowe et al., 2019). These include both probabilistic projections and a perturbed parameter ensemble of regional climate model (RCM) projections which are spatially and temporally coherent. Applications of distributed hydrological models usually require spatially coherent projections, and so many hydrological climate impact studies within the UK are based on the RCM-ensemble projections produced as part of the UKCP09 product (e.g., Bell et al., 2012, 2016; Kay and Jones, 2012a; Prudhomme et al., 2012; Rahiz and New, 2013; Wade et al., 2013). The newly released UKCP18 product updates these projections, with improvements including (1) increased RCM spatial resolution from 25 to 12 km, (2) improved representation of large-scale systems such as the winter North Atlantic Oscillation (NAO), and (3) higher resolution global climate model better representing synoptic-scale weather systems, mountains and coastlines (Murphy et al., 2018). There is therefore a need to provide updated hydrological impact studies using these new climate projections as the climate model improvements should lead to more reliable hydrological model simulations.
Here, precipitation, temperature and PET timeseries were derived from the 12-member perturbed parameter ensemble produced as part of UKCP18. This RCM data is given for the period 1980–2080, with all simulations based on the GC3.05 coupled ocean-atmosphere model using the RCP8.5 emission scenario (Murphy et al., 2018; Williams et al., 2018). Precipitation, minimum daily temperature, and maximum daily temperature were available as RCM-output variables. PET was derived from a range of RCM output variables using the same calculation as the MORECS PET product (Hough and Jones 1997), which is based on the Penman-Monteith scheme (Monteith, 1965) with monthly stomatal resistance (rs) values. The rs values were adjusted for the future time period to account for the closure of stomata under increased carbon dioxide concentrations (Rudd and Kay, 2016; Guillod et al., 2018).
The RCM-PPE generally shows increasing winter precipitation across GB by 2060–2080, with the central projection indicating increases up to around 30% (Murphy et al., 2018, Figure 4.8c). These increases in winter precipitation tend to be largest in the south, with a few ensemble members projecting decreasing winter precipitation for northern Scotland. Murphy et al. (2018) attribute these increases in winter precipitation to the increasing intensity of rainfall on wet-days, with the average increase in wet-day intensity found to be typically 10–40%. Conversely, summer precipitation is projected to decrease almost everywhere by an average of −18 to −41% across the country (Murphy et al., 2018, Figure 4.8d). This is combined with increasing intensity of hot summer days, with UK-average increases of +3.8 to +6.8°C (Murphy et al., 2018).
Climate model data often has significant biases in variables such as precipitation when compared to observations (Muerth et al., 2013; Smith et al., 2014). To reduce these biases before using the data for hydrological modelling, it is common to bias correct the data (Teutschbein and Seibert, 2012). A wide range of bias correction methods have been developed for this purpose, ranging from simple scaling to more intensive approaches (Teutschbein and Seibert, 2012; Addor and Seibert, 2014). Here, a relatively simple monthly-mean bias correction methodology was applied for precipitation (as in Kay, 2021), with the aim of reducing model bias throughout the year whilst not over-correcting the data, through the following steps. First, observation-based CEH-GEAR precipitation grids were averaged from 1 to 12 km for consistency with the RCM simulations. Second, change factor grids were calculated between the RCM simulated and observation-based precipitation over the period 1981–2010, producing separate grids for each month and RCM ensemble member. Third, the change factor grids were smoothed to prevent spatial discontinuities, by updating each grid cell using a weighted combination of the original grid-cell value and neighbouring values (as in Guillod et al., 2018). Finally, to produce bias-corrected precipitation estimates the 12 km RCM simulated precipitation time-series were multiplied by the bias correction factor grid for each month (i.e., all January precipitation was multiplied by the January bias correction grids, February precipitation by the February correction grid, etc.).
A limitation of the monthly-mean bias correction method is that it does not directly correct for any biases in the variance or extreme precipitation percentiles (Teutschbein and Seibert, 2012). However, extreme precipitation is particularly difficult to bias correct using any method, as observed data for extremes is limited and will be affected by the presence of natural variability over the observed record (Ehret et al., 2012; Maraun, 2012). Analysis of the flow duration curve and monthly flows showed that the bias corrected precipitation data successfully produced model flows which more closely matched those simulated using observed data (Kay, 2021), as shown in the Supplementary Material. No bias correction was carried out for PET or temperature.
Downscaling of climate model data is common in hydrological climate-impact studies, as hydrological models often require input data at a higher resolution than climate models provide. The 12 km bias-corrected RCM precipitation data were downscaled to 1 km using the Standard-period Average Annual Rainfall (SAAR). This involved re-distributing the precipitation for each 12 km grid cell across the interior 1 km grid cells using the ratio of the 1 km gridded SAAR to the SAAR across the 12 km grid box. Temperature data were downscaled to 1 km using a lapse rate based on elevation data. PET data were simply re-gridded to a 1 km resolution by assigning each 1 km grid cell the value of the 12 km grid cell within which it was contained.
Flow Frequency Analysis
To analyse changes to hydrological extremes, high flow/flood frequency curves and low flow frequency curves were fitted for the 30-year observed, baseline and future periods. These were calculated separately for each of the 12 RCM-ensemble driven simulations and the observation driven run. For the flood frequency curves, the annual maximum (AMAX) flows were first extracted from the daily flow data for each water year (1st October−30th September) within the 30-year period. Then, flood frequency curves were fitted to the 30 AMAX data points using a generalised logistic (GLO) distribution estimated using the method of L-moments (Hosking, 1996). The GLO distribution has been recommended as standard practise for flood frequency estimation in UK catchments (Robson and Reed, 1999; Kjeldsen et al., 2008). A similar approach was taken to fit low flow frequency curves. The 7-day annual minimum (AMIN) flows were first extracted from model simulations for each year (using December-November years to match RCM data), resulting in 30 AMIN data points for each river pixel. The 7-day AMIN flows were generated using the running mean of flows simulated over a moving 7-day window. A generalised extreme value (GEV) distribution was then applied to the 7-day AMIN data, using the method of L-moments, to fit low flow frequency curves (Hosking, 1996; Zaidman et al., 2002).
The use of a 30-year period is relatively short for fitting of flood/low flow frequency curves where a long data record is generally required, but is common for climate impact studies where time-series length is limited (e.g., Bell et al., 2012; Prudhomme et al., 2012; Rahiz and New, 2013; Charlton and Arnell, 2014). Here, 30 years was selected to balance (1) the need for a period which is sufficiently long to represent the average climate and (2) the need for distinct baseline and future periods within the available 100-year climate simulations. However, it is important that the fitted curves are not used to extrapolate to return periods much beyond the 30-year data period. Results are therefore only presented for return periods up to 25 years, with a focus on 10-year return period events which should be robustly estimated.
Using this methodology flood and low flow frequency curves were fitted to each simulated river pixel across GB. For the four example catchments, the change in frequency curves was calculated for all return periods using the percentage change between baseline and future flow frequency. When analysing changes over the GB domain, this was simplified to just look at percentage changes in the 10-year return period flows between baseline and future simulations.
Combined Hydro-Hazards
A simple methodology was applied to identify hydro-hazard hotspots; areas where both high and low flow extremes intensify due to climate change. For each river pixel, the percentage reduction in 10-year low flows and increase in 10-year peak flows was analysed. Areas where both high and low 10-year flow extremes intensified were assigned to one of three categories:
(i) Some increase in both hazards–increase in peak flows (>0%) and reduction in low flows (>0%)
(ii) Moderate increase in both hazards–increase in peak flows (>5%) and reduction in low flows (>50%)
(iii) Large increase in both hazards–increase in peak flows (>15%) and reduction in low flows (>70%).
These thresholds were chosen following a sensitivity analysis, aiming to find an acceptable number of river pixels for each category. These thresholds result in 59% of river pixels in the 'some increase in hazards' category, around a third (35%) of pixels in the 'moderate increase in hazards' category and the top 10% of pixels in the 'large increase in hazards' category.
Change in Timing
To investigate the change in timing of extreme flows, the day of the year when the AMAX and 7-day AMIN flows occurred was extracted from the modelled daily flow time series. The mean day of occurrence of extreme events was then evaluated using the circular mean, calculated individually for both the 30-year baseline and future periods. This enabled comparison of how the mean day of AMIN/AMAX flows changed between the baseline and future. To identify if changes to the baseline/future distribution of event days were significantly different, the Watson's Two-sample U2 test was applied (Mardia and Jupp, 2008). This test evaluates whether two groups of circular observations differ significantly from each other with an alpha value of 0.05.
Results
Climate Change Impact on Flow Frequency Curves
Flood and low flow frequency curves for the four example catchments, showing 1 to 25 year return period flows, are given in Figure 2. The multiple curves given over the baseline (blue) and future (red) periods are from the 12 different ensemble members, showing uncertainty between RCM simulations. A flow frequency curve is also given for the observation-driven run (dashed black line), to show the skill of the baseline simulations driven by climate data relative to observed data. This demonstrates that the modelling chain shows overall good performance, with the observation-driven flow frequency curve generally falling within the spread of the baseline ensemble members. However, the ensemble baseline results for the Tay at Ballathie are generally under-predicting flood frequency and over-predicting low flow frequency compared to the observation-based simulation.
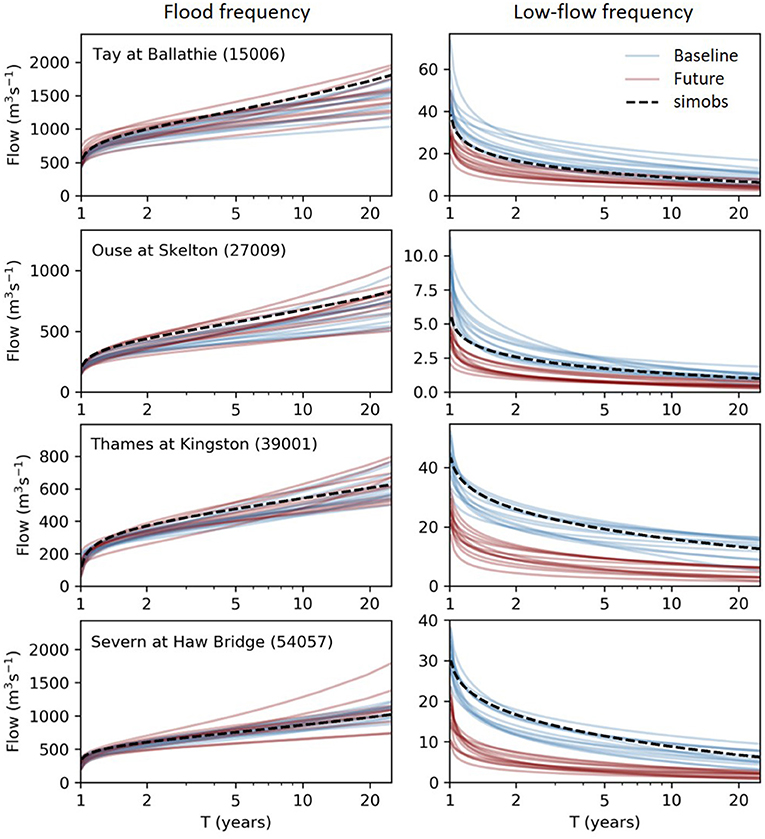
Figure 2. Flow frequency curves for example catchments, derived from annual maximum (left) and annual minimum (right) flows. Flow frequency curves are given for baseline (1983–2012) and future (2051–2080) periods using modelled flows driven by the 12 ensemble climate projections. A flow frequency curve has also been produced using modelled flows driven by observed data for each catchment, to indicate climate model data performance over the observed period.
A clear difference can be seen between the sets of baseline and future flow frequency curves for low flows, but there is no distinction for high flows (Figure 2). For low flows, there is a reduction in flows of all return periods between the baseline and future. This reduction in low flow magnitudes is consistent across all example catchments, and is evident despite the spread between RCM members. For high flows, baseline and future simulations from different ensemble members are of a similar magnitude, and it is therefore not possible to identify changes in flood frequency from these plots.
Figure 3 presents the change between baseline and future flow frequency curves for each ensemble member. The ensemble median is shown in black, with shading to show the second lowest to second highest value between the ensemble members. The highest and lowest ensemble members were omitted to focus on the most likely range, but results are given for all ensemble members in the Supplementary Material. For high flows, the ensemble median generally indicates no change or small changes of up to +/– 9% across the example catchments and return periods. However, the uncertainty ranges are high, particularly for the higher return period flows. Therefore, whilst median estimates show little change in the 20-year flood, changes of over 25% are possible for all example catchments, and changes of over 40% are within projections for the Ouse (27009). Climate impacts on low flows are more pronounced. Ensemble median results show low flow reductions of −40 to −70% across all catchments. Again, changes are most uncertain at high return periods, with large ranges (>45%) in the projected changes to 20-year return period flows. For the Ouse and Thames, one ensemble member predicted an increase in the 20-year return period low flows, which can be seen in additional figures given in the Supplementary Material. The differences in high and low flow changes between the example catchments will be due to both differing climatic changes and catchment characteristics. For example, Lane (2021) found that changes in high flows (Q1) across GB were a complex interplay between changes in heavy precipitation and changes in PET, and this relationship differed depending on catchment characteristics such as the runoff coefficient. Similarly, Kay et al. (2021b) suggested that both spatial differences in climatic change and variation in catchment properties were important in defining the catchment response to climate change, especially for high flows.
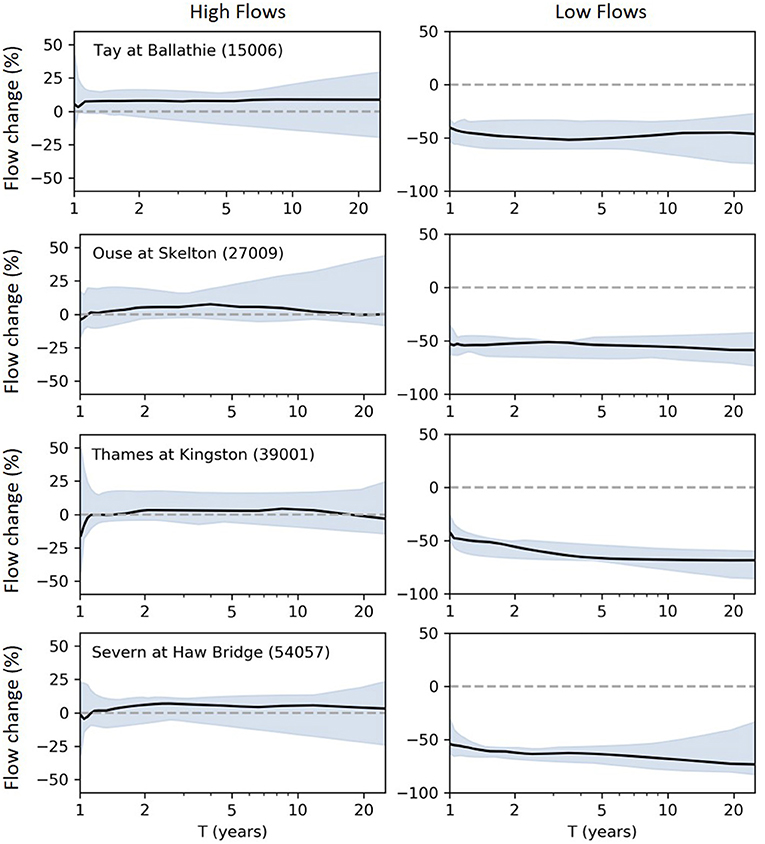
Figure 3. Change in flow frequency curves for high flows (left) and low flows (right) at the four example catchments. These show the percentage change between baseline and future flows for different return periods. The shaded area shows the second lowest to second highest change between the 12 ensemble members, whilst the solid line shows the median.
Extreme Flow Changes at the National Scale
Maps showing the percentage change in 10-year return period flows in each river pixel are given in Figure 4. These show the results when all ensemble members are combined; giving the second lowest, median and second highest modelled changes from the 12-member ensemble, as in Figure 3. Spatially consistent plots for each individual ensemble member are given in the Supplementary Material. The low flow maps in Figure 4 echo the results from the example catchments showing that 10-year return period low flows are projected to decrease in magnitude across nearly all rivers in GB. The average change in low flows across GB from the ensemble of projections is −66%, with the second lowest changes in the region of −91 to −61% across GB and the second highest changes in the region of −68 to −26% (10th−90th percentile of all river pixels across GB). The largest reductions in low flows are generally seen across southern England and Wales. For 10-year return period flood flows, the ensemble median results show small changes across GB, with most river pixels (80%) showing changes within −10% to +20%. However, increases in 10-year high flows of 9% and above are within the ensemble spread for 90% of river pixels across the country. Generally the largest increases in flood flows are projected along the west coast of GB, although the spatial pattern of change differs between ensemble members (see Supplementary Material).
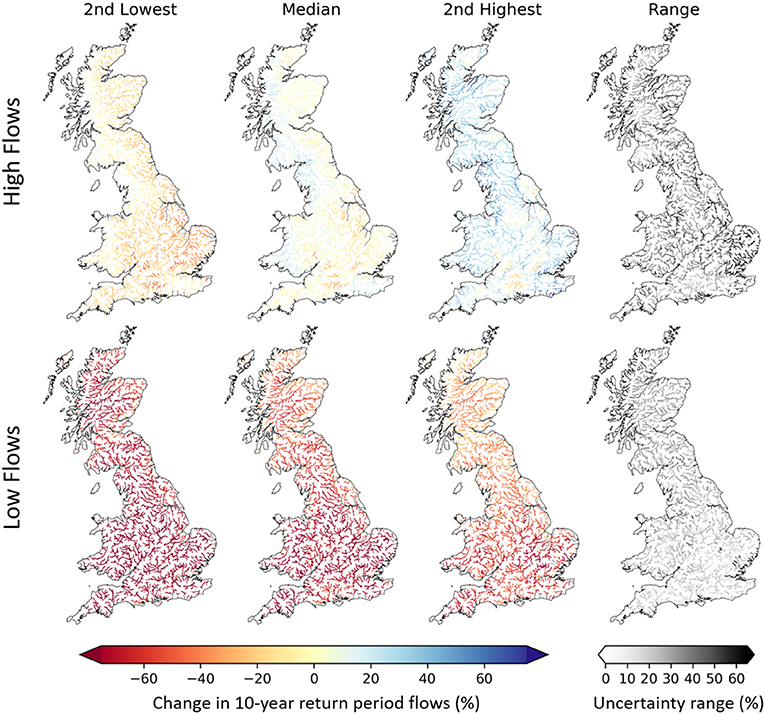
Figure 4. Percentage change in 10-year return period high (top row) and low (bottom row) flows. The left three plots summarise the projected changes from all 12 ensemble members, giving the second lowest, median, and second highest result for each river pixel. The right hand plot shows the ensemble spread as an indicator of projection uncertainty, calculated as the difference between the second lowest and second highest projection for each river pixel.
Maps showing the range between the second lowest to second highest changes in 10-year return period flows are also given in Figure 4. These indicate the areas with the largest uncertainties arising from the 12-member ensemble. Over most of GB (90% of river pixels) the range is over 19% for both high and low flows, with the largest uncertainties in south-east England and East Anglia in particular. Overall, there are larger uncertainties in the 10-year high flow projections than for the 10-year low flow projections.
Future Hot Spots for Hydro-Hazards
Figure 5 shows potential hydro-hazard hotspots, areas where both decreases in low flows and increases in flood flows are projected. The scatter plot presented in (a) compares changes in 10-year high and low flows across all ensemble members and for all river pixels, with plots for individual ensemble members given in the Supplementary Material. This demonstrates how data were sorted into the three categories of (i) some increase in both hazards, (ii) moderate increase in both hazards, and iii) large increase in both hydro-hazards. Plot (b) maps the number of ensemble members that fall into each hydro-hazard category, with dark blue colours highlighting areas where multiple ensemble members indicate an increase in compound hydro-hazards. For most rivers across GB, at least one ensemble member projects some increase in both hydro-hazards. The largest increases in compound hazards are seen along the west coast of GB and for south-east England. Southern Wales and south-west England stand out as hot-spots where there is the largest agreement between ensemble members that compound hydro-hazards may increase, and the largest increases are projected.
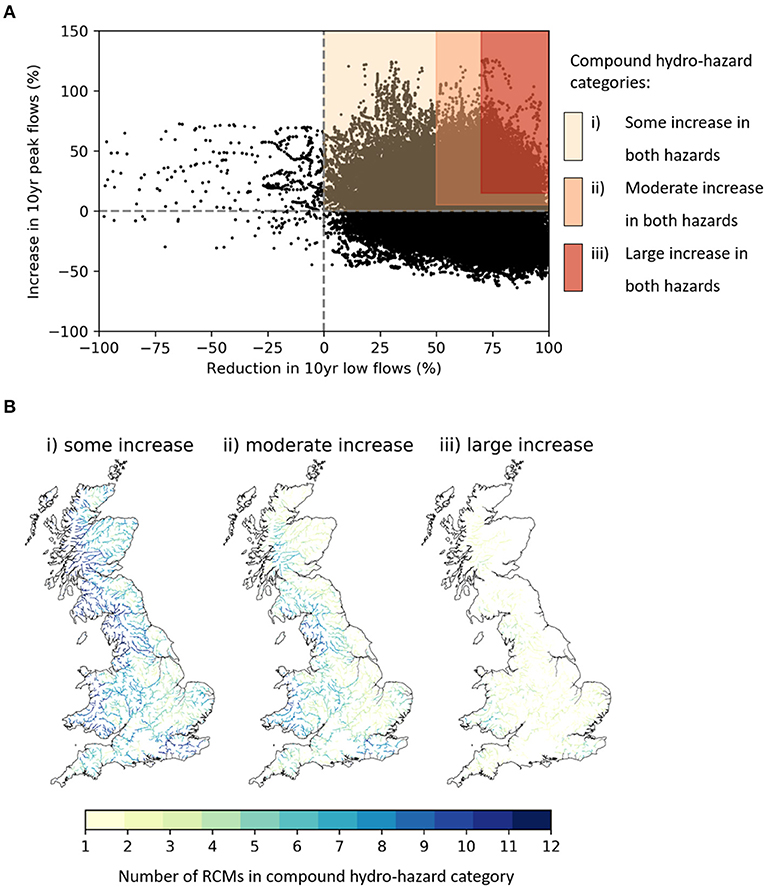
Figure 5. Projected increases in compound hydro-hazards, where both high and low flow events intensify. The changes to 10-year high and low flows for all non-tidal river pixels and all ensemble members are given in (A), which demonstrates the three categories used to define increases in compound hydro-hazards. Maps in (B) show the number of RCM ensemble members which have projected increases in each category.
Climate Impact on Timing of Extremes
Plots showing the timing of AMAX/AMIN flows are given in Figure 6 for the example catchments. These demonstrate the large inter-annual variability in AMAX/AMIN timing across GB. AMIN events generally occur between June and November with some variation in timing between catchments. AMAX events have a much wider spread, generally occurring October to May when soils are saturated. However, summer AMAX flows are also possible, and can be seen for all the example catchments except for the Tay at Ballathie.
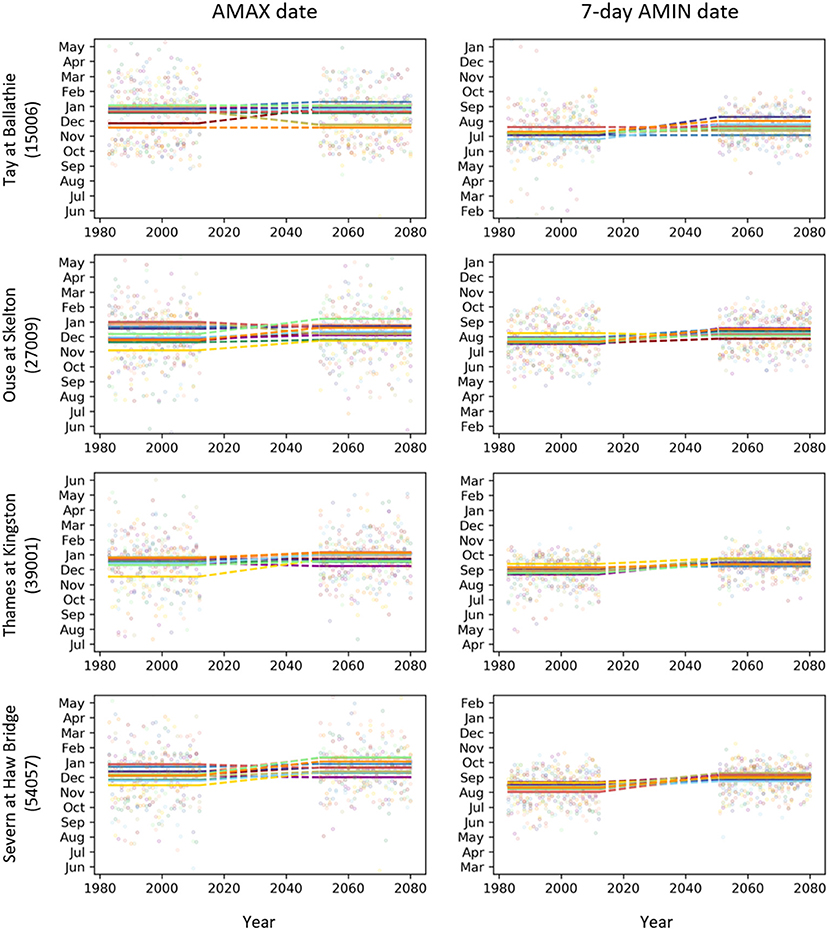
Figure 6. Timing of annual maximum flows (left) and 7-day annual minimum flows (right) for the four example catchments over the baseline and future periods. Colours represent the different ensemble members. Points show the timing of individual events, whilst lines show the average date of events over the full baseline/future periods.
The projected changes in the mean date of extreme flows are shown for all river pixels across GB in Figure 7, for AMAX (7a) and AMIN (7b) flows. Separate plots are given for each ensemble member, to show the similarities and differences between the simulations. Generally, projections show earlier AMAX flows in Scotland and Northern England (by up to around 25 days), and later AMAX flows in southern England (up to around 30 days) with a mixed picture over Wales. However, not all ensemble members agree; it can be seen that ensemble member 13 predicts later flows everywhere except for north-west Scotland, whilst ensemble member 02 predicts earlier flows. Changes to the timing of AMIN flows are more consistent, with generally later AMIN flows projected across GB. The greatest changes (of around 25 days later) are generally seen for the west coast and Wales, although the spatial pattern of change differs between the ensemble members.
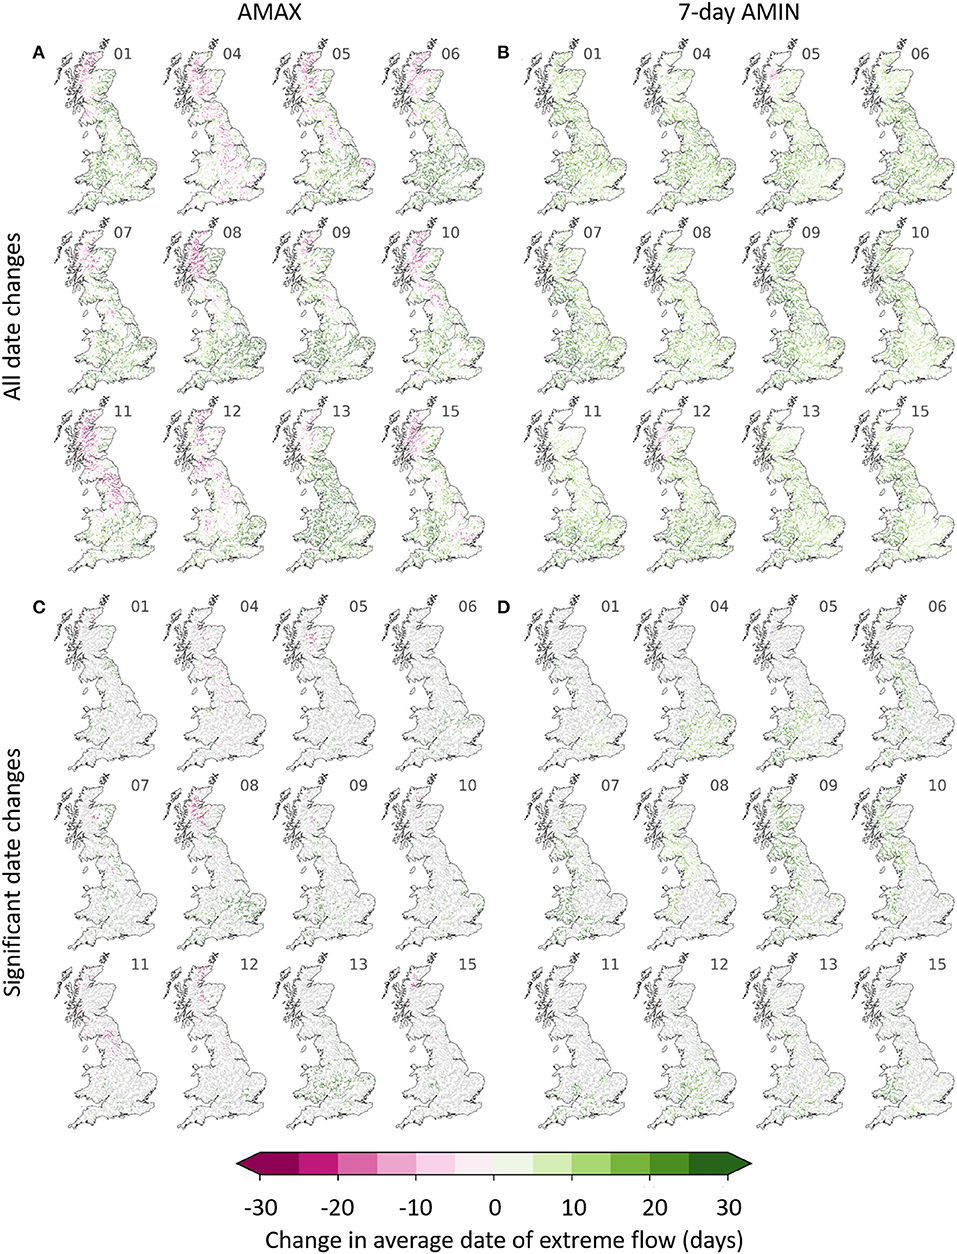
Figure 7. Change in timing of extreme flows between baseline and future time periods for all non-tidal river pixels. All calculated changes are given on the top row for annual maximum (A) and 7-day annual minimum (B) flow dates. The plots on the bottom row show significant changes only for annual maximum (C) and minimum (D) flows, with all insignificant changes coloured grey. Results are given separately for all 12 UKCP18 ensemble members, with the ensemble member numbers given to the top-right of each map. These numbers are consistent with the Met Office UKCP18 RCM numbering.
Given the large inter-annual variability in the date of AMAX and AMIN flows (Figure 6), not all of the changes to extreme flow timing are significant. Figures 7C,D show the change in the average date of AMAX/AMIN flows respectively, with any river pixels not showing significant changes (with an alpha value of 0.05) plotted in grey. Significant results emerge for different areas of the country between the ensemble members, but generally results show earlier AMAX flows in Scotland, later AMAX flows in England, and later AMIN flows in central and southern England and along the west coast of GB.
Discussion and Conclusions
There is an urgent need for information on the projected impact of climate change on hydrological extremes, to inform adaptation planning for future floods/droughts. This study provides an updated national picture of potential future changes to the magnitude and timing of hydrological extremes, using the latest UKCP18 climate projections for Great Britain. A national grid-based hydrological model was applied to analyse changes in flood peaks and 7-day duration low flows between baseline (1983–2012) and future (2051–2080) periods, with a focus on 10-year return period events.
The generally decreasing 10-year return period low flows and small increases to 10-year return period high flows found in this study are consistent with the underlying climate projections. The reduced summer precipitation and rising temperatures could be expected to result in decreasing low flows, while the increase in precipitation intensity and overall increase in winter precipitation could be expected to exacerbate flooding. However, increasing extreme rainfall and increasing floods may not be directly linked for many catchments, as river floods are also dependent on catchment properties (Sharma et al., 2018; Ledingham et al., 2019).
The small median changes projected for 10-year peak flows across GB (around 5% +/- 15%), with generally larger changes along the west coast, are broadly consistent with previous national analyses using UKCP09 (Charlton and Arnell, 2014; Bell et al., 2016), although direct comparisons are not possible due to differences in time-periods and high flow metrics studied. For example, Bell et al. (2016) also projected increasing flood peaks across GB (finding 20-year flood peaks to increase by ~30–40% by 2069–2099), with the range of results showing that both increases and decreases were possible for all regions. Charlton and Arnell (2014) focused on six study catchments in GB, with median results showing small increases (0–10%) in Q5 for most study catchments by the 2050s/2080s, but a large range in results also spanning both increases and decreases for all catchments. This indicates that the new UKCP18 product should not substantially change guidance on climate change allowances for flood risk beyond evidence based on UKCP09, as has been shown in recent studies comparing the UKCP09 and UKCP18 products (Kay et al., 2020, 2021a).
The large reductions in low flows projected across GB, especially in the south-west, are also consistent with previous studies which project decreased summer flows (Christierson et al., 2012; Prudhomme et al., 2012; Kay, 2021), reductions in low flows (Charlton and Arnell, 2014; Kay et al., 2018, 2021b) and more severe streamflow droughts (Feyen and Dankers, 2009; Rudd et al., 2019) across GB due to climate change. Kay et al. (2018) also found the largest reductions to low flows for the south of GB in an analysis of the weather@home climate projections, although this may not be surprising as they applied the same hydrological model. These reductions in low flows could have severe implications for the aquatic environment and agriculture, as well as future water supply. However, it is important to recognise that the use of percentage change could overstate changes where flow values are low, with small absolute changes resulting in large percentage reductions.
Analysing both high and low flow changes within a consistent framework allowed for the identification of hydro-hazard hot-spots, where both flood and drought hazard may intensify due to climate change. Our results indicate that increasing compound hydro-hazards are possible across most of GB, as is consistent with previous research (Visser-Quinn et al., 2019), but are most likely to increase for rivers in the west, and in southern Wales in particular. This is consistent with Collet et al. (2018) who found hydro-hazard hot-spots mainly along the western coast of GB in an analysis of the future flows hydrology dataset (Prudhomme et al., 2014a,b). However, Collet et al. (2018) also identified hydro-hazard hot-spots in eastern Scotland which are not apparent in our results.
Changes in the timing of hydrological extremes could have severe impacts alongside increasing magnitude, as societies are adapted to the within-year timing of events. The later AMIN flows, later AMAX flows across southern GB and earlier AMAX flows for Scotland projected in this study should therefore be considered in adaptation plans. However, changes to the date of extreme flows were small compared to the large natural variability in the timing of hydrological extremes across GB, which could help to explain why changes in the timing of extremes were not always significant. These modelled trends are not consistent with observations; in an analysis of river flood trends over the last five decades, Blöschl et al. (2017) find trends towards later floods in northern England and Scotland, and earlier floods in the south of GB.
Analyses of future hydrological changes are highly uncertain. Here, a perturbed-parameter RCM ensemble was included to demonstrate some of the climate modelling uncertainties, showing the large range in projected changes across GB. However, there are many uncertainties that were not included in this study, for example relating to (1) emissions scenario, (2) global climate model, (3) bias correction and downscaling methodology, (4) hydrological model structure, (5) hydrological model parameters, and (6) interactions between these uncertainty sources. Studies have shown that choice of climate model tends to be the largest source of uncertainty in hydrological climate change impact analyses (Wilby and Harris, 2006; Prudhomme and Davies, 2009; Arnell et al., 2021), especially when focussing on high flows (Kay et al., 2009; Bosshard et al., 2013; Vetter et al., 2017; De Niel et al., 2019). However, hydrological modelling uncertainties have been found to be large for some areas, particularly for low flows where the hydrological model structure can become the dominant source of uncertainty (Bosshard et al., 2013; De Niel et al., 2019). Therefore, the results presented here should be treated with caution, as only one hydrological model setup was applied and therefore the true uncertainty ranges could be much larger, especially for low flows changes. These large uncertainties highlight the value of adaptive management and a risk-based approach to adaptation (Wilby and Keenan, 2012; Reynard et al., 2017), to reduce future risks whilst considering the range of uncertainties.
Data Availability Statement
Data will be made available via the Environmental Information Data Centre (EIDC) before the end of 2021, but before then they are available from the authors upon reasonable request. The UKCP18 data is freely available from the CEDA Catalogue.
Author Contributions
AK and RL contributed to the project conceptualisation and design of the methodology. AK processed the climate data and carried out model simulations. RL carried out the data analysis, data visualisation, and wrote the manuscript with comments from AK. All authors contributed to the article and approved the submitted version.
Funding
This work was supported by the Natural Environment Research Council Award Number NE/R016429/1 as part of the UK-SCAPE programme delivering National Capability.
Conflict of Interest
The authors declare that the research was conducted in the absence of any commercial or financial relationships that could be construed as a potential conflict of interest.
Acknowledgments
Thanks to UKCEH colleagues Emma Robinson, for work on the estimation of PE from climate model data, and Vicky Bell for helpful comments on this manuscript.
Supplementary Material
The Supplementary Material for this article can be found online at: https://www.frontiersin.org/articles/10.3389/frwa.2021.684982/full#supplementary-material
References
Addor, N., and Seibert, J. (2014). Bias correction for hydrological impact studies–beyond the daily perspective. Hydrol. Process. 28, 4823–4828. doi: 10.1002/hyp.10238
Arnell, N. W., Kay, A. L., Freeman, A., Rudd, A. C., and Lowe, J. A. (2021). Changing climate risk in the UK: a multi-sectoral analysis using policy-relevant indicators. Clim. Risk Manag. 31:100265. doi: 10.1016/j.crm.2020.100265
Bell, V. A., Kay, A. L., Cole, S. J., Jones, R. G., Moore, R. J., and Reynard, N. S. (2012). How might climate change affect river flows across the Thames Basin? an area-wide analysis using the UKCP09 Regional Climate Model ensemble. J. Hydrol. 442–443, 89–104. doi: 10.1016/j.jhydrol.2012.04.001
Bell, V. A., Kay, A. L., Davies, H. N., and Jones, R. G. (2016). An assessment of the possible impacts of climate change on snow and peak river flows across Britain. Clim. Change 136, 539–553. doi: 10.1007/s10584-016-1637-x
Bell, V. A., Kay, A. L., Jones, R. G., and Moore, R. J. (2007). Use of a grid-based hydrological model and regional climate model outputs to assess changing flood risk. Int. J. Climatol. 27, 1657–1671. doi: 10.1002/joc.1539
Bell, V. A., Kay, A. L., Jones, R. G., Moore, R. J., and Reynard, N. S. (2009). Use of soil data in a grid-based hydrological model to estimate spatial variation in changing flood risk across the UK. J. Hydrol. 377, 335–350. doi: 10.1016/j.jhydrol.2009.08.031
Blenkinsop, S., and Fowler, H. J. (2007). Changes in European drought characteristics projected by the PRUDENCE regional climate models. Int. J. Climatol. 27, 1595–1610. doi: 10.1002/joc.1538
Blöschl, G., Hall, J., Parajka, J., Perdigão, R. A. P., Merz, B., Arheimer, B., et al. (2017). Changing climate shifts timing of European floods. Science 357, 588–590. doi: 10.1126/science.aan2506
Bosshard, T., Carambia, M., Goergen, K., Kotlarski, S., Krahe, P., Zappa, M., et al. (2013). Quantifying uncertainty sources in an ensemble of hydrological climate-impact projections. Water Resour. Res. 49, 1523–1536. doi: 10.1029/2011WR011533
Charlton, M. B., and Arnell, N. W. (2014). Assessing the impacts of climate change on river flows in England using the UKCP09 climate change projections. J. Hydrol. 519, 1723–1738. doi: 10.1016/j.jhydrol.2014.09.008
Christierson, B. V., Vidal, J.-P., and Wade, S. D. (2012). Using UKCP09 probabilistic climate information for UK water resource planning. J. Hydrol. 424–425, 48–67. doi: 10.1016/j.jhydrol.2011.12.020
Collet, L., Harrigan, S., Prudhomme, C., Formetta, G., and Beevers, L. (2018). Future hot-spots for hydro-hazards in Great Britain: a probabilistic assessment. Hydrol. Earth Syst. Sci. 22, 5387–5401. doi: 10.5194/hess-22-5387-2018
Dankers, R., and Feyen, L. (2009). Flood hazard in Europe in an ensemble of regional climate scenarios. J. Geophys. Res. Atmos. 114, 47–62. doi: 10.1029/2008JD011523
De Niel, J., Van Uytven, E., and Willems, P. (2019). Uncertainty analysis of climate change impact on river flow extremes based on a large multi-model ensemble. Water Resour. Manag. 33, 4319–4333. doi: 10.1007/s11269-019-02370-0
Ehret, U., Zehe, E., Wulfmeyer, V., Warrach-Sagi, K., and Liebert, J. (2012). HESS opinions “should we apply bias correction to global and regional climate model data?” Hydrol. Earth Syst. Sci. 16, 3391–3404. doi: 10.5194/hess-16-3391-2012
Feyen, L., and Dankers, R. (2009). Impact of global warming on streamflow drought in Europe. J. Geophys. Res. 114:D17116. doi: 10.1029/2008JD011438
Fowler, H. J., and Kilsby, C. G. (2007). Using regional climate model data to simulate historical and future river flows in northwest England. Clim. Change 80, 337–367. doi: 10.1007/s10584-006-9117-3
Guillod, B. P., Jones, R. G., Dadson, S. J., Coxon, G., Bussi, G., Freer, J., et al. (2018). A large set of potential past, present and future hydro-meteorological time series for the UK. Hydrol. Earth Syst. Sci. 22, 611–634. doi: 10.5194/hess-22-611-2018
Hao, Z., Singh, V., and Hao, F. (2018). Compound extremes in hydroclimatology: a review. Water 10:718. doi: 10.3390/w10060718
Hollis, D., McCarthy, M., Kendon, M., Legg, T., and Simpson, I. (2019). HadUK-Grid—a new UK dataset of gridded climate observations. Geosci. Data J. 6, 151–159. doi: 10.1002/gdj3.78
Hosking, J. R. M. (1996). Fortran routines for use with the method of L-moments. (Version 3.04). Available online at: http://lib.stat.cmu.edu/general/lmoments (accessed June 25, 2021).
Hough, M. N., and Jones, R. J. A. (1997). The United Kingdom Meteorological Office rainfall and evaporation calculation system: MORECS version 2.0-an overview. Hydrol. Earth Syst. Sci. 1, 227–239. doi: 10.5194/hess-1-227-1997
Huntington, T. G. (2006). Evidence for intensification of the global water cycle: review and synthesis. J. Hydrol. 319, 83–95. doi: 10.1016/j.jhydrol.2005.07.003
Kay, A. L. (2021). Simulation of river flow in Britain under climate change: baseline performance and future seasonal changes. Hydrol. Process. 35:14137. doi: 10.1002/hyp.14137
Kay, A. L., Bell, V. A., Guillod, B. P., Jones, R. G., and Rudd, A. C. (2018). National-scale analysis of low flow frequency: historical trends and potential future changes. Clim. Change 147, 585–599. doi: 10.1007/s10584-018-2145-y
Kay, A. L., and Crooks, S. M. (2014). An investigation of the effect of transient climate change on snowmelt, flood frequency, and timing in northern Britain. Int. J. Climatol. 34, 3368–3381. doi: 10.1002/joc.3913
Kay, A. L., Crooks, S. M., Davies, H. N., and Reynard, N. S. (2014). Probabilistic impacts of climate change on flood frequency using response surfaces II: Scotland. Reg. Environ. Change 14, 1243–1255. doi: 10.1007/s10113-013-0564-x
Kay, A. L., Davies, H. N., Bell, V. A., and Jones, R. G. (2009). Comparison of uncertainty sources for climate change impacts: flood frequency in England. Clim. Change 92, 41–63. doi: 10.1007/s10584-008-9471-4
Kay, A. L., Griffin, A., Rudd, A. C., Chapman, R. M., Bell, V. A., and Arnell, N. W. (2021a). Climate change effects on indicators of high and low river flow across Great Britain. Adv. Water Resour. 151:103909. doi: 10.1016/j.advwatres.2021.103909
Kay, A. L., and Jones, D. A. (2012a). Transient changes in flood frequency and timing in Britain under potential projections of climate change. Int. J. Climatol. 32, 489–502. doi: 10.1002/joc.2288
Kay, A. L., and Jones, R. G. (2012b). Comparison of the use of alternative UKCP09 products for modelling the impacts of climate change on flood frequency. Clim. Change 114, 211–230. doi: 10.1007/s10584-011-0395-z
Kay, A. L., Jones, R. G., and Reynard, N. S. (2006). RCM rainfall for UK flood frequency estimation. II. Climate change results. J. Hydrol. 318, 163–172.
Kay, A. L., Rudd, A. C., Fry, M., Nash, G., and Allen, S. (2021b). Climate change impacts on peak river flows: combining national-scale hydrological modelling and probabilistic projections. Clim. Risk Manag. 31:100263. doi: 10.1016/j.crm.2020.100263
Kay, A. L., Watts, G., Wells, S. C., and Allen, S. (2020). The impact of climate change on U. K. river flows: a preliminary comparison of two generations of probabilistic climate projections. Hydrol. Process. 34, 1081–1088. doi: 10.1002/hyp.13644
Keller, V. D. J. J., Tanguy, M., Prosdocimi, I., Terry, J. A., Hitt, O., Cole, S. J., et al. (2015). CEH-GEAR: 1 km resolution daily and monthly areal rainfall estimates for the UK for hydrological and other applications. Earth Syst. Sci. Data 7, 143–155. doi: 10.5194/essd-7-143-2015
Kjeldsen, T., Jones, D., Bayliss, A., Kjeldsen, T. R., Jones, D. A., and Bayliss, A. (2008). Improving the FEH Statistical Procedures for Flood Frequency Estimation. Bristol: Environment Agency.
Lane, R. A. (2021). National-Scale Hydrological Modelling of High Flows Across Great Britain: Multi-Model Structures, Regionalisation Approaches, and Climate Change Analysis With Uncertainty. Bristol: University of Bristol. Available online at: https://research-information.bris.ac.uk/en/studentTheses/national-scale-hydrological-modelling-of-high-flows-across-great-(accessed June 25, 2021).
Lavers, D. A., Ralph, F. M., Waliser, D. E., Gershunov, A., and Dettinger, M. D. (2015). Climate change intensification of horizontal water vapor transport in CMIP5. Geophys. Res. Lett. 42, 5617–5625. doi: 10.1002/2015GL064672
Ledingham, J., Archer, D., Lewis, E., Fowler, H., and Kilsby, C. (2019). Contrasting seasonality of storm rainfall and flood runoff in the UK and some implications for rainfall-runoff methods of flood estimation. Hydrol. Res. 50, 1309–1323. doi: 10.2166/nh.2019.040
Lowe, J. A., Bernie, D., Bett, P., Bricheno, L., Brown, S., Calvert, D., et al. (2019). UKCP18 Science Overview Report: Version 2.0. Available online at: https://www.metoffice.gov.uk/pub/data/weather/uk/ukcp18/science-reports/UKCP18-Overview-report.pdf (accessed June 25, 2021).
Maraun, D. (2012). Nonstationarities of regional climate model biases in European seasonal mean temperature and precipitation sums. Geophys. Res. Lett. 39, 1–5. doi: 10.1029/2012GL051210
Mardia, K. V., and Jupp, P. E. (2008). Directional statistics, in Directional Statistics (NJ: John Wiley and Sons, Ltd), 1713–1720.
Marsh, T. J., and Hannaford, J., (2008). UK Hydrometric Register. Hydrological data UK series. Bailrigg: UK Centre for Ecology and Hydrology. Available online at: https://nrfa.ceh.ac.uk/hydrometric-register (accessed June 25, 2021).
Marx, A., Kumar, R., Thober, S., Rakovec, O., Wanders, N., Zink, M., et al. (2018). Climate change alters low flows in Europe under global warming of 1.5, 2, and 3°C. Hydrol. Earth Syst. Sci. 22, 1017–1032. doi: 10.5194/hess-22-1017-2018
Met Office (2019). UK Climate Projections: Headline Findings. Available online at: https://www.metoffice.gov.uk/binaries/content/assets/metofficegovuk/pdf/research/ukcp/ukcp-headline-findings-v2.pdf (accessed June 25, 2021).
Muerth, M. J., Gauvin St-Denis, B., Ricard, S., Velázquez, J. A., Schmid, J., Minville, M., et al. (2013). On the need for bias correction in regional climate scenarios to assess climate change impacts on river runoff. Hydrol. Earth Syst. Sci. 17, 1189–1204. doi: 10.5194/hess-17-1189-2013
Murphy, J. M., Harris, G. R., Sexton, D. M. H., Kendon, E. J., Bett, P. E., Clark, R. T., et al. (2018). UKCP18 Land Projections: Science Report. In UKCP18 Land Projections: Science Report (Vol. 2018, Issue March 2019). Available online at: https://www.metoffice.gov.uk/pub/data/weather/uk/ukcp18/science-reports/UKCP18-Land-report.pdf (accessed June 25, 2021).
Prudhomme, C., and Davies, H. (2009). Assessing uncertainties in climate change impact analyses on the river flow regimes in the UK. Part 2: future climate. Clim. Change 93, 197–222. doi: 10.1007/s10584-008-9461-6
Prudhomme, C., Giuntoli, I., Robinson, E. L., Clark, D. B., Arnell, N. W., Dankers, R., et al. (2014a). Hydrological droughts in the 21st century, hotspots and uncertainties from a global multimodel ensemble experiment. Proc. Natl. Acad. Sci. U.S.A. 111, 3262–3267. doi: 10.1073/pnas.1222473110
Prudhomme, C., Jackson, C., Haxton, T., Crooks, S., Dadson, S., Morris, D., et al. (2014b). Future flows: a dataset of climate, river flow and groundwater levels for climate change impact studies in Great Britain, in IAHS-AISH Proceedings and Reports (Montpellier), 330–335.
Prudhomme, C., Young, A., Watts, G., Haxton, T., Crooks, S., Williamson, J., et al. (2012). The drying up of Britain? a national estimate of changes in seasonal river flows from 11 Regional Climate Model simulations. Hydrol. Process. 26, 1115–1118. doi: 10.1002/hyp.8434
Rahiz, M., and New, M. (2013). 21st century drought scenarios for the UK. Water Resour. Manag. 27, 1039–1061. doi: 10.1007/s11269-012-0183-1
Reynard, N. S., Kay, A. L., Anderson, M., Donovan, B., and Duckworth, C. (2017). The evolution of climate change guidance for fluvial flood risk management in England. Prog. Phys. Geogr. Earth Environ. 41, 222–237. doi: 10.1177/0309133317702566
Robson, A., and Reed, D. (1999). Statistical procedures for flood frequency estimation, in Flood Estimation Handjournal, Vol. 3 (Wallingford: Institute of Hydrology).
Rudd, A. C., Bell, V. A., and Kay, A. L. (2017). National-scale analysis of simulated hydrological droughts (1891–2015). J. Hydrol. 550, 368–385. doi: 10.1016/j.jhydrol.2017.05.018
Rudd, A. C., and Kay, A. L. (2016). Use of very high resolution climate model data for hydrological modelling: estimation of potential evaporation. Hydrol. Res. 47, 660–670. doi: 10.2166/nh.2015.028
Rudd, A. C., Kay, A. L., and Bell, V. A. (2019). National-scale analysis of future river flow and soil moisture droughts: potential changes in drought characteristics. Clim. Change 156, 323–340. doi: 10.1007/s10584-019-02528-0
Sharma, A., Wasko, C., and Lettenmaier, D. P. (2018). If precipitation extremes are increasing, why aren't floods? Water Resour. Res. 54, 8545–8551. doi: 10.1029/2018WR023749
Smith, A., Bates, P., Freer, J., and Wetterhall, F. (2014). Investigating the application of climate models in flood projection across the UK. Hydrol. Process. 28, 2810–2823. doi: 10.1002/hyp.9815
Spinoni, J., Vogt, J. V., Naumann, G., Barbosa, P., and Dosio, A. (2018). Will drought events become more frequent and severe in Europe? Int. J. Climatol. 38, 1718–1736. doi: 10.1002/joc.5291
Tanguy, M., Dixon, H., Prosdocimi, I., Morris, D., and Keller, V. D. J. (2014). Gridded Estimates of Daily and Monthly Areal Rainfall for the United Kingdom (1890-2012) [CEH-GEAR]. Lancaster: NERC Environmental Information Data Centre.
Teutschbein, C., and Seibert, J. (2012). Bias correction of regional climate model simulations for hydrological climate-change impact studies: Review and evaluation of different methods. J. Hydrol. 456–457, 12–29. doi: 10.1016/j.jhydrol.2012.05.052
Thober, S., Kumar, R., Wanders, N., Marx, A., Pan, M., Rakovec, O., et al. (2018). Multi-model ensemble projections of European river floods and high flows at 1.5, 2, and 3 degrees global warming. Environ. Res. Lett. 13:014003. doi: 10.1088/1748-9326/aa9e35
Trenberth, K. (2011). Changes in precipitation with climate change. Clim. Res. 47, 123–138. doi: 10.3354/cr00953
Vetter, T., Reinhardt, J., Flörke, M., van Griensven, A., Hattermann, F., Huang, S., et al. (2017). Evaluation of sources of uncertainty in projected hydrological changes under climate change in 12 large-scale river basins. Clim. Change 141, 419–433. doi: 10.1007/s10584-016-1794-y
Vidal, J.-P., and Wade, S. (2009). A multimodel assessment of future climatological droughts in the United Kingdom. Int. J. Climatol. 29, 2056–2071. doi: 10.1002/joc.1843
Visser-Quinn, A., Beevers, L., Collet, L., Formetta, G., Smith, K., Wanders, N., et al. (2019). Spatio-temporal analysis of compound hydro-hazard extremes across the UK. Adv. Water Resour. 130, 77–90. doi: 10.1016/j.advwatres.2019.05.019
Wade, S. D., Rance, J., and Reynard, N. (2013). The UK climate change risk assessment 2012: assessing the impacts on water resources to inform policy makers. Water Resour. Manag. 27, 1085–1109. doi: 10.1007/s11269-012-0205-z
Watts, G. (2010). Water for people: climate change and water availability, in Modelling the Impact of Climate Change on Water Resource, eds F. Fung, A. Lopez, and M. New (Oxford: Blackwell).
Wilby, R. L., and Harris, I. (2006). A framework for assessing uncertainties in climate change impacts: low-flow scenarios for the River Thames, UK. Water Resour. Res. 42, 1–10. doi: 10.1029/2005WR004065
Wilby, R. L., and Keenan, R. (2012). Adapting to flood risk under climate change. Prog. Phys. Geogr. 36, 348–378. doi: 10.1177/0309133312438908
Williams, K. D., Copsey, D., Blockley, E. W., Bodas-Salcedo, A., Calvert, D., Comer, R., et al. (2018). The met office global coupled model 3.0 and 3.1 (GC3.0 and GC3.1) configurations. J. Adv. Model. Earth Syst. 10, 357–380. doi: 10.1002/2017MS001115
Zaidman, M. D., Keller, V., and Young, A. R. (2002). Low Flow Frequency Analysis: Guidelines for Best Practice. RandD Technical Report W6-064/TR1. Available online at: https://assets.publishing.service.gov.uk/government/uploads/system/uploads/attachment_data/file/290341/sw6-064-tr1-e-e.pdf (accessed June 25, 2021).
Keywords: climate change, hydrology, flood, drought, river flow, UKCP18, hydro-hazards
Citation: Lane RA and Kay AL (2021) Climate Change Impact on the Magnitude and Timing of Hydrological Extremes Across Great Britain. Front. Water 3:684982. doi: 10.3389/frwa.2021.684982
Received: 24 March 2021; Accepted: 14 June 2021;
Published: 21 July 2021.
Edited by:
Lindsay Beevers, Heriot-Watt University, United KingdomReviewed by:
Sanjiv Kumar, Auburn University, United StatesK. Sreelash, National Centre for Earth Science Studies, India
Copyright © 2021 Lane and Kay. This is an open-access article distributed under the terms of the Creative Commons Attribution License (CC BY). The use, distribution or reproduction in other forums is permitted, provided the original author(s) and the copyright owner(s) are credited and that the original publication in this journal is cited, in accordance with accepted academic practice. No use, distribution or reproduction is permitted which does not comply with these terms.
*Correspondence: Rosanna A. Lane, cm9zbGFuQGNlaC5hYy51aw==