 Shuangcheng Jiang1
 Yihua Cai
 Ding Chen
 Zhong Pan
- 1Marine Environment and Aquatic Products Quality Inspection Center, Fisheries Research Institute of Fujian, Xiamen, China
- 2College of Ocean and Earth Sciences, Xiamen University, Xiamen, China
- 3Xiamen Fifth Middle School, Xiamen, China
- 4Third Institute of Oceanography, Ministry of Natural Resources, Xiamen, China
Upon tangential ultrafiltration and asymmetric flow field analyses, seawater nanoparticle size distribution and the associations with the total number of bacteria and plankton diversity were evaluated. Of the nanoparticles in the Jiulong River Estuary, 79% were from 1 to 6 nm (C1). C2 (6–20 nm) was correlated with dissolved organic carbon, while C2 and C3 (>20 nm) were associated with dissolved inorganic nitrogen, suggesting that C2 and C3 were impacted by biogenic elements. The total number of bacteria was correlated with C1 and C3. The correlations of Shannon's diversity index (H′) and C3, richness (d), and C1 suggested a link of particle size with phytoplankton biodiversity. Significant correlations of the H′ of zooplankton and C3, and of Pielou's evenness index (J) and C3, suggested C3 as a primary digestion product of zooplankton. The negative correlations of nano-organic carbon (NOC) with d and J suggested NOC as a carbon source for zooplankton. Biodiversity was associated with seawater nanoparticle size distribution. Biological activities regulated the nanoparticle size distribution, which impacted the estuarine nutrient cycling, in turn affecting the stability and balance of biodiversity. Correlation analysis of the size distribution of seawater nanoparticles and the plankton diversity index provided a potential tool for evaluating ecological effects.
Introduction
Nanoparticles are tiny particles of sizes 1–100 nm, with unique specific surface area, surface charges, redox activity, and bioavailability. Seawater nanoparticles exert increasingly significant impacts on the marine environment and pose potential harm to marine life and human health via transfer through the food chain, which has caused widespread concerns (Brumfiel, 2003; Service, 2004). Previously, 0.45- or 0.7-μm filters were often used to separate dissolved and insoluble matter in seawater (Wilding et al., 2005; Belzile and Guo, 2006). With the development of ultrafiltration technology in the 1990s (Guo et al., 1995; Benner et al., 1997), ultrafiltration membrane that can separate particles of 1 kDa in seawater promoted the research on colloidal matters. Currently, with advanced nano-characterization technologies, the flow field analysis technology has been applied for separating nanoparticles in natural water (Clark et al., 2008; Yang et al., 2013). The successful isolation of nanomaterials of different particle sizes opens a door for studying the biogeochemical behavior of nanoparticles in natural seawater. Studies have shown that the particle size distribution of natural seawater is closely related to biogeochemical processes, and the biological effect is an important factor regulating the particle size of organic marine matter (Hannides et al., 2013; Benner and Amon, 2015). As a primary producer, phytoplankton are the main contributors to marine particulate organic matter (POM) and dissolved organic matter (DOM) (Swan et al., 2011; Herndl and Reinthaler, 2013). The size of the released DOM is related to the phytoplankton community structure and aquatic environment (Baines and Pace, 1991). Microparticles from phytoplankton are converted to nano- or subnano-sized ones through degradation and digestion by heterotrophic bacteria and zooplankton (Ogawa et al., 2001; Hannides et al., 2013). Therefore, it is of great significance to explore the particle size, composition, and ecological effects of nanoparticles in natural seawater.
Jiulong River, the second largest river in Fujian Province of China, is an important water source for residential, industrial, and agricultural applications in southwestern Fujian Province (cities of Longyan, Zhangzhou, and Xiamen). Jiulong River and its surrounding watersheds are very rich in fishery resources, rendering an important area for aquacultural and fishery products. The Jiulong River estuary, representative of a subtropical estuary, provides an ideal site for exploring the potential relationships between the particle size/composition of natural nanomaterials and biodiversity (Jiang et al., 2019).
This study aimed to analyze the particle size and composition of nanoparticles in the seawater, the plankton biodiversity index, followed by assessment of the correlation between the nanomaterials with different particle sizes and the nutrients, e.g., carbon, nitrogen, and phosphorus. The correlation between seawater nanoparticle size and the total number of bacteria, the plankton biodiversity index, is evaluated using statistical analysis by SPSS. The results will improve understanding of the biogeochemical cycling process and the environmental impacts of natural nanoparticles.
Materials and Methods
Sampling
In January 2018 (dry season), seven sampling sites (Figure 1, J1–J7) were selected along the direction of Jiulong River into the sea (salinity = 0–30 ppt) according to the method of five-interval salinity gradient of two stations. The study area covers rivers, estuaries, and nearshore waters: J1, J2–J5, and J6–J7 represented the riverine, estuarine, and nearshore sites, respectively. During the wet season, rich water and surface runoff introduce more land-based nanomaterials into the estuary area, especially the input of small-sized terrigenous humus; however, it is beyond the scope of this present study.
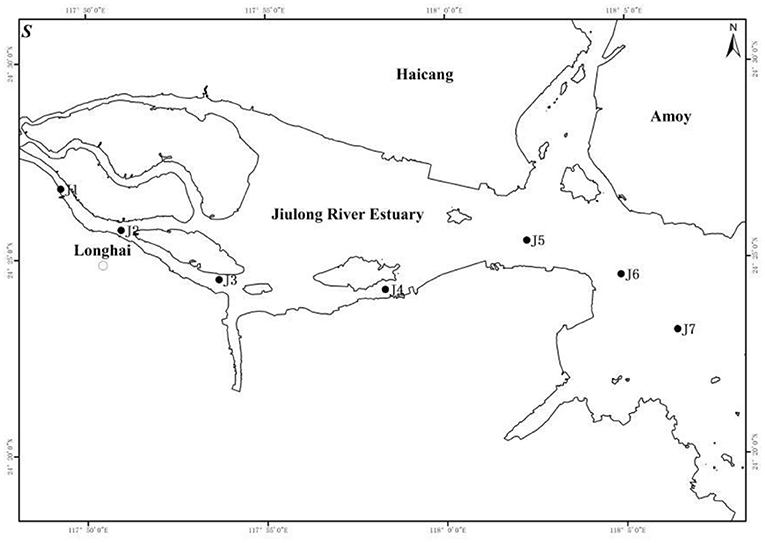
Figure 1. Sampling sites in Jiulong River estuary.
The zooplankton samples were collected using a type I plankton net vertical trawl, following which the samples were immediately fixed with formalin. The water samples for particle size spectrum, dissolved organic carbon (DOC), nutrients, heterotrophic bacteria, and phytoplankton were obtained with 8-L sunflower-shaped water collectors. Sample storage and transportation were performed under the specification of “GB17378.3-2007 Marine Monitoring Specification Part 3: Sample Collection, Storage and Transportation” (Xu et al., 2007).
Sample Analysis
DOC, inorganic nitrogen and phosphorus, and active silicate were analyzed based on the “Environmental Monitoring of Nearshore Waters”1. The ecological analysis and evaluation were performed following the “GB17378.7-2007 Marine Monitoring Standards: Ecological Investigation and Biological Monitoring of Offshore Pollution” (Ma et al., 2007). Nitrite (-N), nitrate (-N), ammonium (-N), active phosphate, and silicate were determined using a continuous flow analyzer (Skalar San++, Skalar Analytical B.V., Breda, the Netherlands). DOC was measured using total organic carbon (TOC) analyzer (TOC-VCPH analyzer, Shimadzu, Kyoto, Japan). Salinity was measured on site using a multiparameter analyzer (WTW Multi 3430, Weilheim, Germany). Dissolved inorganic nitrogen (DIN) is the sum of -N, -N, and -N.
The DOC samples were pre-filtered with a 0.70-μm glass fiber filter (Whatman GF/F). The pretreated samples were passed through a tangential flow ultrafiltration system (Figure 2) including a membrane module (1 kDa, 0.5 m2; Millipore Pellicon, Burlington, MA, USA) and a peristaltic pump (Cole-Parmer Masterflex, St. Neots, UK) for extracting nano-organic carbon (NOC). Thereafter, the pre-filtered liquid (CB), the retentate (CR), and the ultrafiltrate (CP) were collected for on-machine testing. NOC (Cn, in milligrams per liter) was calculated using Equations 1 and 2.
where CF is the concentration factor and VB and VR are the volumes (in milliliters) of the pre-filtered liquid and retentate, respectively.
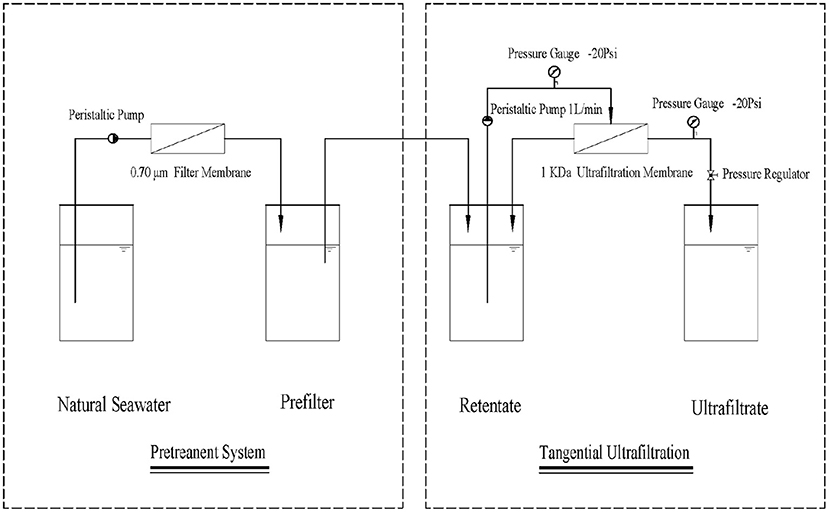
Figure 2. Scheme of the nano-organic carbon (NOC) extraction and separation process.
The particle size spectrum was measured using the asymmetric flow field method with an AF4 field flow meter (AF2000 MultiFlow FFF, Postnova, Landsberg am Lech, Germany) (Hong et al., 2005). We modified a few key technical parameters of the asymmetric flow field flow analyzer, as follows: polyethersulfone ultrafiltration membrane with a pore size of 1 kDa; channel membrane thickness, 350 μm; carrier liquid, 9‰ NaCl (similar to the electrolyte content of the sample); volume of the loop, 0.6 ml; and sample injection volume of 1.5 ml to ensure that there is no residual liquid in the loop. The flow rates in the pipe (Tip), focus flow (Focus), and vertical direction (Cross) were set to 0.5, 3.8, and 3.5 ml/min, respectively. The focus time and elution time were 10 and 20 min, respectively. During the elution, the tangential flow velocity was maintained constant. The selected wavelength of the UV–vis spectrophotometer was 254 nm.
Vitamin B12 (VB12, 1.3 kDa), lysozyme (14.4 kDa), cytochrome C (12.0 kDa), ovalbumin (45 kDa), and bovine serum albumin (BSA, 66.5 kDa), with known molecular weights, were mixed to prepare the standard solution. Then, the standard solution was measured using the field flow meter under the same conditions. The relationship between elution time and molecular weight is displayed in Supplementary Figure 1, showing a standard logarithmic curve between molecular weight and the peak retention time. Then, the peak time of the measured sample was substituted into the standard curve to obtain the relative molecular weight of each sample. Afterwards, the standard working curve was fitted in Equation (3).
where MW is the molecular weight (in kilodalton) and T is the elution time (in minutes); since the system elutes the sample from the 11th min, we take (T – 11). The integration area is the area between the 11th and the 51st min.
The samples from the Jiulong River estuary were measured with the method above, and the molecular weights of the samples were calculated using the linear regression equation of the working curve. The time was converted to hydrodynamic diameter using the conversion equation between the molecular weight and size (Equation 4).
where, based on the calculations from Equations (3) and (4), 11–16 min represents 1–6 nm, 16–34.8 min corresponds to 6–20 nm, and >34.8 min corresponds to >20 nm, and the particle size of the sample is calculated.
Diversity Index, Richness, Evenness, and Dominance
Richness (d)
Margalef's index was used as a measure of richness (Margalef, 2020).
where S is the total number of species and N is total number of individuals in the sample. ln represents the natural logarithm.
Shannon–Weiner Diversity Index (H′) (Shannon, 1948)
where H′ is the Shannon–Weiner diversity index, s is the total number of species in the samples, i represents the ith component of the specified species, and Pi is the proportion of the individual component of each species.
Evenness (J)
Pielou's evenness index (J) was used (Pielou, 1966).
where H′ is the Shannon–Wiener diversity index and S is the total number of species in the sample.
Dominance (D2)
where N1 and N2 are the numbers of individuals of the first and second dominant species in the samples, respectively. NT is the total number of individuals in the samples.
Data Processing
SPSS 20.0 was used for data analysis, assuming a linear relationship between the dependent variable and the independent variable. A linear regression model was used to fit the data of the dependent variables and the independent variables.
Results and Discussion
Size Distribution of Nanoparticles
Table 1 shows that the mean abundance of C1 ranged from 1.56 to 3.03, with an average of 2.46. The highest values appeared at J2 and J4, while the lowest value appeared in the seaward J7. The mean size of C2 spanned from 0.13 to 0.62, with a mean of 0.36. The high and low values appeared at J2 and J3, respectively. The mean size of C3 spanned from 0.062 to 0.57 nm, with an average size of 0.33. The highest and lowest values were 0.57 (J7) and 0.062 (J4), respectively. Single-factor analysis of variance (F = 3.04, p = 0.086) showed that there was no significant difference in the particle size between the surface and bottom layers of the Jiulong River estuary along the seaward direction. This may be due to the intensive water exchange between the surface and bottom layers upon the combined effects of runoff and tidal movement along the Jiulong River.
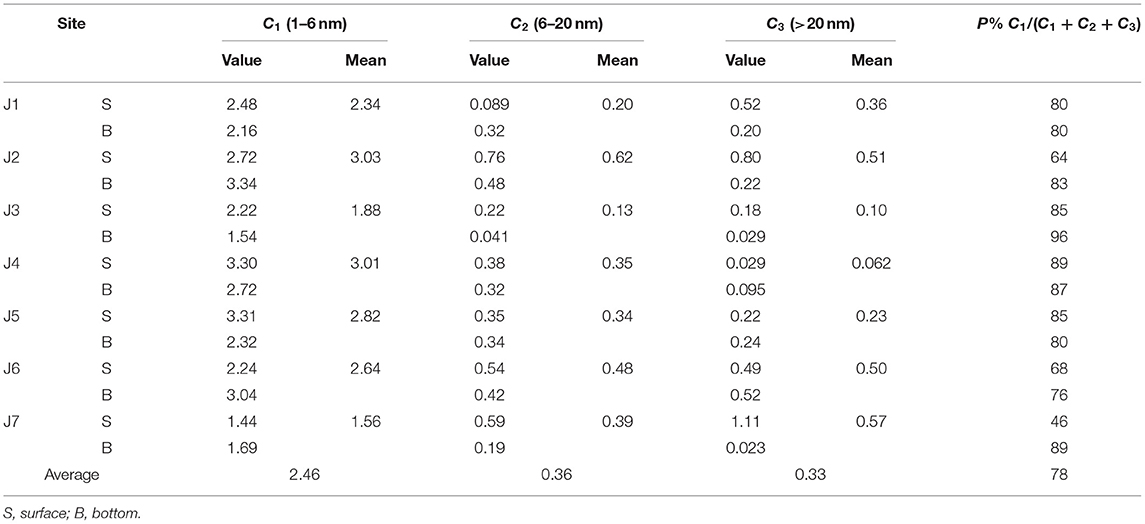
Table 1. Size composition of seawater nanoparticles.
Table 1 shows that C1 dominated the composition of nanoparticles, accounting for 78% of the total. The outflow time of nanoparticles (Figure 3) was mainly concentrated at 10–16 min, corresponding to the outflow interval of C1, which further verified that seawater nanomaterials were mainly composed of small-sized particles. This is consistent with an earlier study which showed that, in the Chukchi Sea, the colloidal materials were primarily dominated by small-sized particles (55.4%) (Lin et al., 2016). Stolpe et al. (2014) and Zhou et al. (2016) obtained similar findings in the Mississippi River and in small rivers in the Gulf of Mexico, which they attributed to the important contribution of small-sized terrestrial humus to river nanoparticles.

Figure 3. Discharge curves of the nanoparticle spectrum: top, surface layer; bottom, bottom water.
The spatial distributions of C1, C2, and C3 are shown in Figure 4. No clear distribution pattern of the three components was observed. There was no obvious trend along the Jiulong River into the sea, indicating minute nanoparticles inputs from terrestrial sources. The composition had a poor correlation with salinity. Overall, C1, C2, and C3 were all abundant in J2 at the estuary, but low contents appeared in J3. J7 contained a rather low content in C1, but high levels in C2 and C3.
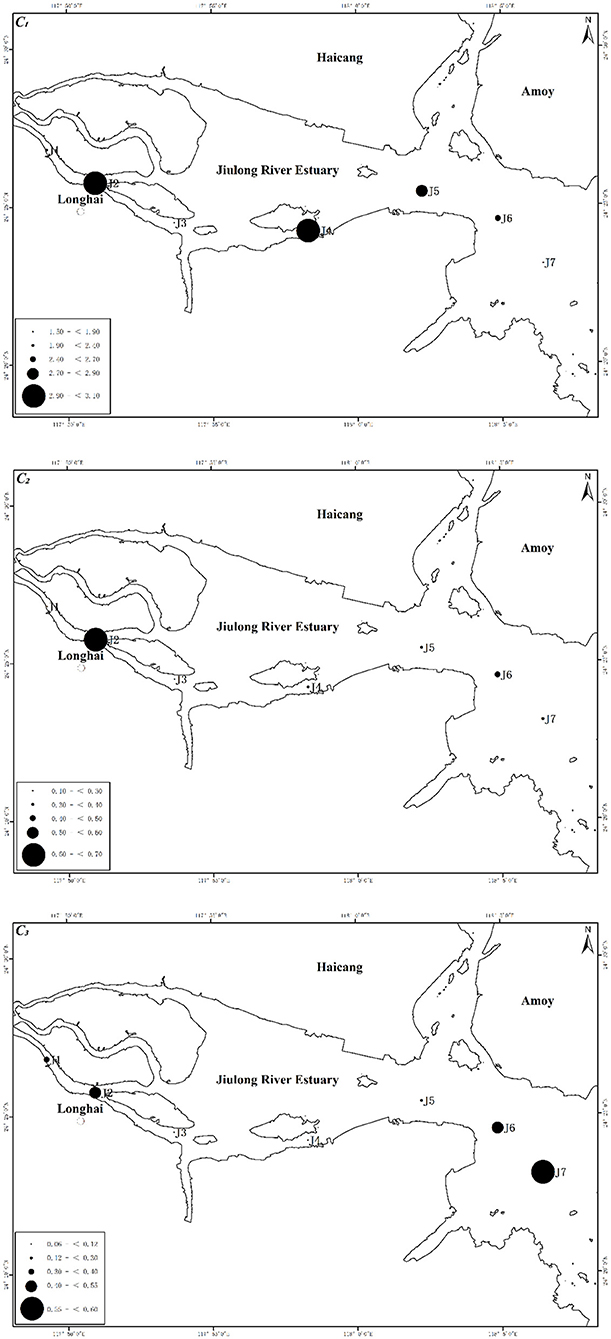
Figure 4. Distributions of C1 (top), C2 (center), and C3 (bottom) along the Jiulong River. The size of the black dot represents the concentration of the corresponding nanoparticles.
C1 was unaffected by the composition of nutrients, but the C2 component was inversely correlated with DOC (), suggesting the same origin of C2 and DOC. Multiple regression analysis of C2, C3, and nitrite, nitrate, and ammonium salt was performed with Equations 9 and 10, as follows:
The results showed that ammonium was proportional to the particle sizes of C2 and C3, whereas nitrite was the opposite. The particle size of the ultra-miniature phytoplankton (Pico) was 0.2–3 μm, which was slightly larger than that of C3 (<0.1 μm), suggesting that C3 may contain partially broken phytoplankton. Phytoplankton preferentially uptake ammonium, suggesting that the C3 component may contain phytoplankton.
Distribution of Heterotrophic Bacteria and Plankton Biodiversity Index
Distribution of Total Number of Heterotrophic Bacteria
In January 2018, the total number of bacteria in the surface water of the Jiulong River ranged from 9.3 × 10³ to 4.3 × 10⁴ colony forming unit (CFU)/ml, with an average value of 2.3 × 10⁴ CFU/ml. The total number of bacteria in each station was almost in the same order of magnitude. This was consistent with a previous report of 2.0 × 10⁴-8.6 × 10⁵ CFU/ml (Hong et al., 2017). The total numbers of bacteria at J4 and J5 at the estuary end were higher, followed by the nearshore sites (J6 and J7). Those of J1 and J2 at the river end were lower. The total number of bacteria at the estuary was four times that at the river. Therefore, the overall distribution of total bacteria was estuary > nearshore > river. The total number of heterotrophic bacteria was not greatly related to salinity, suggesting its negligible source from terrestrial input, whereas it was significantly related to inorganic nitrogen and soluble reactive phosphate (SRP). The result is shown in Equation 11.
The correlation coefficient indicated that nitrite and active phosphate were the promoting factors for the growth of heterotrophic bacterial communities, while nitrate and ammonium were negative factors. In contrast, Hong et al. (2017) showed a different finding in that the distribution of the heterotrophic bacterial community in the estuaries was mainly affected by the input of terrestrial sources, such as salinity and human activities, which may be related to variations in the sampling times and locations.
Phytoplankton Diversity Index
In this work, a total of 89 species of 45 genera and four phyla were identified, of which diatom was the dominant phylum. The dominant species were Skeletonema costatum, with a mean number of cells of 1.98 × 10⁵/L, accounting for 71.7% of the total cells. From the perspective of ecological group analysis, the wide-temperature species were dominant in the number of species and cells.
The biodiversity indices of phytoplankton are shown in Table 2. The statistical results indicated that the diversity index (H′) of phytoplankton ranged from 0.903 to 2.950, with an average of 1.715. The diversity indices at stations J1 and J5 were the highest and the lowest, respectively. Abundance (d) ranged from 1.392 to 2.542, with a mean of 1.898, of which stations J7 and J5 had the highest and lowest abundance, respectively. Evenness (J) ranged from 0.197 to 0.580, with an average of 0.340, of which J1 and J5 had the highest and lowest uniformity, respectively. Dominance (D2) was in the range 0.664–0.931, with an average of 0.840, of which stations J5 and J1 had the highest and lowest dominance, respectively. As a whole, J1 had high richness, diversity, and uniformity, but low dominance and a relatively stable phytoplankton community. In contrast, the richness, diversity, and evenness of J5 stations were low, while the dominance was high, and the stability of the phytoplankton community was relatively low.
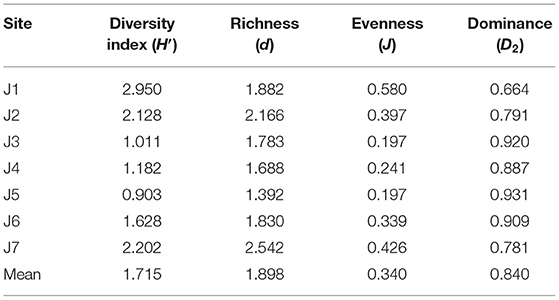
Table 2. Biodiversity index of phytoplankton.
The multiple regression equations of H, J, and D2 and inorganic nitrogen, active phosphate, and DOC in the phytoplankton ecological characteristic index were as follows:
Equations (12–14) showed that the H′ and J of phytoplankton were proportional to DOC and DIN and inversely proportional to SRP, suggesting that DOC and DIN were the promoting factors for phytoplankton growth and that the active phosphate may be the limiting factor. Yet, D2 was directly proportional to DOC and SRP and inversely proportional to DIN. The diversity, evenness, and dominance of phytoplankton were greatly affected by environmental factors. Nelson proposed that the thresholds of nutrients for phytoplankton growth were: [Si] = 2 μmol/L, [DIN] = 1 μmol/L, and [P] = 0.1 μmol/L (Fisher et al., 1992), and the relative restriction law can be derived from the relative concentration ratios of the nutrients, according to the stoichiometric threshold limit standards for nutrients proposed by Justić et al. (1995) and Dortch and Whitledge (1992): if Si/P and N/P were both >22, then P was the limiting factor; if N/P <10 and Si/N > 1, then N was the limiting factor; if Si/P <10 and Si/N <1, then Si was the limiting factor. To accurately identify the roles of the nutrients in the estuary of Jiulong River during the dry season, the nutrients were characterized, as shown in Supplementary Table 1. The nitrogen, phosphorus, and silicon contents were all greater than the absolute limit threshold, while Si/P and N/P were 63.8 and 95.6, respectively, which were both >22. Therefore, the limiting nutrient for phytoplankton growth was phosphorus, in line with the results from multiple regressions. In the present study, we focused on the effects of limiting nutrients on phytoplankton diversity. Salinity was not considered, but it is discussed in the correlation with zooplankton diversity.
Zooplankton Diversity Index
A total of three phyla and 49 species of zooplankton were identified in this work, of which arthropods were dominant. The dominant species was Acartiella sinensis. The average biomass and individual density were 56.4 mg/m3 and 3,159.4 ind./m3, respectively. The community was mainly composed of estuarine low-salt groups and wide-temperature and wide-salt groups.
Table 3 shows that the zooplankton diversity index (H′) ranged from 1.68 to 3.66, with an average of 2.64. The evenness of zooplankton was in the range 0.40–0.77, with a mean of 0.63. The abundance of the zooplankton ranged 0.75–2.77, with an average of 1.64. Dominance of zooplankton (D2) ranged from 0.29 to 0.79, with an average of 0.53. Overall, the levels of stability of the zooplankton community at J6 and J4 were relatively high and low, respectively. The species diversity and the evenness of the zooplankton in the studied area were at a medium level. No significant changes in the diversity and evenness of zooplankton were noted. The stability of the zooplankton community structure was weakened and the sensitivity was increased.
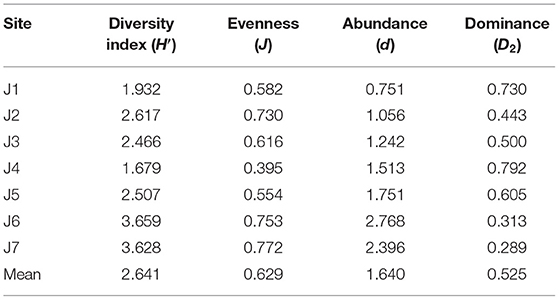
Table 3. Diversity indices of zooplankton.
The H′ value of zooplankton was significantly negatively correlated with the active phosphate content (R2 = 0.72, n = 7, p = 0.05), but weakly correlated with salinity (S) (R2 = 0.67, n = 7, p = 0.10). This may be due to the extensive salinity of the phytoplankton community in the estuarine area and the limited influence of salinity. Meanwhile, active phosphorus was the limiting nutrient for the phytoplankton community structure in the sea area, which affected the distribution of the phytoplankton community to a certain extent, thus impacting the community composition of the predators. It ultimately led to a significant negative correlation between the zooplankton H′ and SRP. For the multivariate regression analysis of d of zooplankton, salinity, DIN, and SRP, the equation was:
It indicated that the zooplankton abundance was mainly affected by salinity and nutrients, of which salinity and inorganic nitrogen were the promoting factors, suggesting that the land source input played a role in zooplankton abundance in the estuarine area. The significant negative correlation between d and SRP may be related to the limitation of phytoplankton diversity by phosphorus.
Relationship Between Nanoparticle Size and Heterotrophic Bacteria and Plankton
Correlation Between Total Number of Heterotrophic Bacteria and Nanoparticles
The total number of heterotrophic bacteria was significantly negatively correlated with C1 (R2 = −0.71, n = 7, p = 0.05) and C3 (R2 = −0.79, n = 7, p < 0.05). This may be due to heterotrophic bacteria being able to uptake easily degradable small molecular organics, especially amino acids and carbohydrates, to form large molecular organics in their cells (Ogawa et al., 2001). C1 and C3 in nanoparticles may be significant components of biodegradable small molecular matter.
Correlation Between Phytoplankton and Nanoparticles
Phytoplankton abundance (d) characterized the number of phytoplankton species, which was weakly negatively correlated with small-sized nanoparticles, C1 (R2 = −0.53, n = 7, p = 0.22). It may be related to C1 being a required nutrient component for the phytoplankton growth site, while H′ and J represented the maximum species diversity and diversity index, respectively. The large particle size component (C3) in the nanoparticles was strongly positive with phytoplankton d, H′, and J, with correlation coefficients, R2, of 0.72 (n = 7, p = 0.05), 0.64 (n = 7, p = 0.12), and 0.63 (n = 7, p = 0.12), respectively. The above correlation may be related to the following three factors: (1) the particle size of the ultra-micro phytoplankton (Pico, 0.2–3 μm) decreased due to decomposition of the ultrafiltration process, generating particles of 20–100 nm to be an important group of C3; (2) nutrients are needed for phytoplankton growth, and thus small-sized particles, C1, may be an important source of nutrients for its growth; and (3) phytoplankton, as a primary producer, was an important contributor of DOM in the ecosystem. The particle size of the DOM was related to the population structure, physiological state, and water environment (Baines and Pace, 1991; Benner and Amon, 2015). Additionally, large-sized particles, C3, may be a key component of DOM. The results indicated that phytoplankton, as a primary producer, may be an important provider of C3, and C1 as a nutrient source for phytoplankton growth may affect the stability of biodiversity.
Correlation Between Zooplankton and Nanoparticles
The large-sized molecules (C3) in the nanoparticles were significantly positively correlated with H′ and J, with R2 values of 0.75 (n = 7, p = 0.05) and 0.88 (n = 7, p < 0.05), respectively, which may be associated with zooplankton feeding activities. Some studies have shown that zooplankton can convert micron-sized particles into nanoscale or sub-nanoscale particles when feeding on phytoplankton. Meanwhile, due to the vertical movement of zooplankton, the vertical distribution of particle sizes was disturbed (Hannides et al., 2013). C3, as an important part of nanoscale matter, further corroborated the above conclusion. The dominance variable (D2) represented the dominant species of zooplankton in the Jiulong River estuary. It was significantly negatively correlated with C1 (R2 = −0.73, n = 7, p = 0.06) and C3 (R2 = −0.74, n = 7, p = 0.06) in nanoparticles, which may be related to the following reasons: (1) the mirroring relationship between H′ and D2, and (2) zooplankton may ingest the DOM in C3. NOC had a strong negative correlation with zooplankton abundance (d) and evenness (J); the R2 values were −0.63 (n = 7, p = 0.13) and −0.71 (n = 7, p = 0.06), respectively, which may be related to NOC as an important part of POM, preferentially ingested by zooplankton. NOC may be an important carbon source for zooplankton in the sea area. The positive correlation of NOC and dominance (D2) (R2 = 0.56, n = 7, p = 0.18) may be related to the mirror relationship between D2 and J. This indicated that the large-sized molecules in the nanoparticles may impact zooplankton diversity.
Correlation Between Nanoparticle Size, Total Bacteria, and Phytoplankton
The correlations of the extracted nanoparticles of different sizes with the number of bacteria, the diversity indices of phytoplankton and animals, are presented in Supplementary Table 2. The total number of bacteria was negatively correlated with the nanoparticles of C1 and C3. The abundance of phytoplankton (d) was weakly negatively correlated with C1, while C3 was positively associated with d and evenness, indicating that C3 will affect the stability of phytoplankton diversity. C3 was significantly positively correlated with the zooplankton H′ and J, while C1 and C3 were strongly negatively correlated with D2. This suggested that C1 and C3 played a role in the balance of zooplankton diversity. NOC was negatively correlated with the d and J of zooplankton and positively correlated with D2, suggesting that NOC may impact the stability of zooplankton diversity.
Implications
The indices of plankton, such as the H′, d, J, and D2, explain the characteristics of the community structure from the macro level, yet they fail to yield the internal driving force of the structure of the community. The correlations between nanoparticles and H′, d, J, and D2 provide insights for an in-depth exploration of the endogenous force of planktonic community. In future studies, isotopic tracing techniques may be employed to examine the fate and transport of nutrients at nanoscale, particularly how nanoscale nutrients affect the energy flow transformation process of bacterial → phytoplankton → plankton.
Overall, the results of the present study provide a new approach for environmental protection in estuarine areas.
Conclusion
In the dry season, nanoparticles in the Jiulong River estuary were mainly composed of small nanoparticles, C1, accounting for 79% of the total, and no significant distribution differences were found between the surface and bottom layers. C2 and C3 were positively correlated with -N. C1, C2, and C3 were involved in the energy flow transformation of heterotrophic bacteria → phytoplankton → zooplankton in the ecosystem. Heterotrophic bacteria may ingest C1 and C3, while phytoplankton growth mainly absorbed the nutrients of C3 and was the killer of nanoparticles; phytoplankton was the producer of C3 in the nano-component. The results showed that biodiversity and the size of nanomaterials were mutually influencing processes. Firstly, biological activities would affect the particle size distribution of marine nanomaterials, which played an important role in the transformation of the size of DOM. Meanwhile, the change of particle size composition would also affect the nutrient element cycle process in the estuarine area, thereby affecting the stability and balance of biodiversity.
Data Availability Statement
The original contributions presented in the study are included in the article/Supplementary Material, further inquiries can be directed to the corresponding authors.
Author Contributions
SJ: methodology, data analysis, and writing–original draft preparation. PL: data curation, experimental analysis, and investigation. YC: data analysis and investigation. DC: data curation and experimental analysis. ZP: conceptualization, methodology, writing–reviewing and editing, and supervision. HL: supervision. FW: field sampling. QL: conceptualization and supervision. All authors contributed to the article and approved the submitted version.
Funding
This work was supported by the Public Welfare Project of Fujian Science and Technology Department (2015R1003-12 and 2020R1013001), Fujian Province Marine and Fishery Structure Adjustment Special Project (2020HYJG05 and 2021HYJG09), Special Fund for Marine Development of Fujian Province (ZHHY-2019-4 and FJHJF-L-2020-8), Special Scientific Research Project of Marine Public Welfare Industry of State Oceanic Administration (201505034-4), and the Key Special Programme of the Ministry of Science and Technology (SQ2020YFF042657).
Conflict of Interest
The authors declare that the research was conducted in the absence of any commercial or financial relationships that could be construed as a potential conflict of interest.
Publisher's Note
All claims expressed in this article are solely those of the authors and do not necessarily represent those of their affiliated organizations, or those of the publisher, the editors and the reviewers. Any product that may be evaluated in this article, or claim that may be made by its manufacturer, is not guaranteed or endorsed by the publisher.
Supplementary Material
The Supplementary Material for this article can be found online at: https://www.frontiersin.org/articles/10.3389/frwa.2021.706875/full#supplementary-material
Footnotes
1. ^Ministry of Ecology and Environment of the People's Republic of China, HJ442-2008: Specification for offshore Environmental Monitoring, China Environmental Sciences Press, Beijing.
References
Baines, S. B., and Pace, M. L. (1991). The production of dissolved organic matter by phytoplankton and its importance to bacteria: patterns across marine and freshwater systems. Limnol. Oceanogr. 36, 1078–1090. doi: 10.4319/lo.1991.36.6.1078
Belzile, C., and Guo, L. (2006). Optical properties of low molecular weight and colloidal organic matter: application of the ultrafiltration permeation model to DOM absorption and fluorescence. Mar. Chem. 98, 183–196. doi: 10.1016/j.marchem.2005.08.009
Benner, R., and Amon, R. M. (2015). The size-reactivity continuum of major bioelements in the ocean. Annu. Rev. Mar. Sci. 7, 185–205. doi: 10.1146/annurev-marine-010213-135126
Benner, R., Biddanda, B., Black, B., and McCarthy, M. (1997). Abundance, size distribution, and stable carbon and nitrogen isotopic compositions of marine organic matter isolated by tangential-flow ultrafiltration. Mar. Chem. 57, 243–263. doi: 10.1016/S0304-4203(97)00013-3
Clark, C. D., Litz, L. P., and Grant, S. B. (2008). Saltmarshes as a source of chromophoric dissolved organic matter (CDOM) to Southern California coastal waters. Limnol. Oceanogr. 53, 1923–1933. doi: 10.4319/lo.2008.53.5.1923
Dortch, Q., and Whitledge, T. E. (1992). Does nitrogen or silicon limit phytoplankton production in the Mississippi River plume and nearby regions? Cont. Shelf Res. 12, 1293–1309. doi: 10.1016/0278-4343(92)90065-R
Fisher, T. R., Peele, E. R., Ammerman, J. W., and Harding, L. W. Jr (1992). Nutrient limitation of phytoplankton in Chesapeake Bay. Mar. Ecol. Prog. Ser. 82, 51–63. doi: 10.3354/meps082051
Guo, L., Santschi, P. H., and Warnken, K. W. (1995). Dynamics of dissolved organic carbon (DOC) in oceanic environments. Limnol. Oceanogr. 40, 1392–1403. doi: 10.4319/lo.1995.40.8.1392
Hannides, C. C., Popp, B. N., Choy, C. A., and Drazen, J. C. (2013). Midwater zooplankton and suspended particle dynamics in the North Pacific Subtropical Gyre: a stable isotope perspective. Limnol. Oceanogr. 58, 1931–1946. doi: 10.4319/lo.2013.58.6.1931
Herndl, G. J., and Reinthaler, T. (2013). Microbial control of the dark end of the biological pump. Nat. Geosci. 6, 718–724. doi: 10.1038/ngeo1921
Hong, H., Wu, J., Shang, S., and Hu, C. (2005). Absorption and fluorescence of chromophoric dissolved organic matter in the Pearl River Estuary, South China. Mar. Chem. 97, 78–89. doi: 10.1016/j.marchem.2005.01.008
Hong, X., Zhang, Y., Chen, Z., Li, H., Zhao, C., and Yang, S. (2017). Phylogenetic diversity and spatiotemporal patterns of the bacterial community in Jiulong River estuary. J. Appl. Oceanogr. 36, 167–176. doi: 10.3969/J.ISSN.2095-4972.2017.02.003
Jiang, S., Lin, P., Cai, J., Wu, L., Xi, Y., Yang, M., et al. (2019). Establishment and application of comprehensive assessment modal for the coastal water quality: an example of the Jiulong river estuary (In Chinese). J. Guangdong Ocean Univ. 39, 65–70. doi: 10.3969/j.issn.1673-9159.2019.05.010
Justić, D., Rabalais, N. N., and Turner, R. E. (1995). Stoichiometric nutrient balance and origin of coastal eutrophication. Mar. Pollut. Bull. 30, 41–46. doi: 10.1016/0025-326X(94)00105-I
Lin, H., Chen, M., Zeng, J., Li, Q., Jia, R., Sun, X., et al. (2016). Size characteristics of chromophoric dissolved organic matter in the Chukchi Sea. J. Geophys. Res. Oceans 121, 6403–6417. doi: 10.1002/2016JC011771
Ma, Y., Wang, L., Liang, Y., Xu, H., Yu, T., Han, G., et al. (2007). General Administration of Quality Supervision, Inspection and Quarantine of the People's Republic of China and Standardization Administration of China. The Specification for Marine Monitoring-Part 7: Ecological Survey for Offshore Pollution and Biological Monitoring. Beijing: Standards Press of China.
Margalef, R. (2020). Temporal Succession and Spatial Heterogeneity in phytoplankton. Berkeley, CA: University of California Press.
Ogawa, H., Amagai, Y., Koike, I., Kaiser, K., and Benner, R. (2001). Production of refractory dissolved organic matter by bacteria. Science 292, 917–920. doi: 10.1126/science.1057627
Pielou, E. C. (1966). The measurement of diversity in different types of biological collections. J. Theor. Biol. 13, 131–144. doi: 10.1016/0022-5193(66)90013-0
Service, R. (2004). Nanotoxicology: nanotechnology grows up. Science 304, 1732–1734. doi: 10.1126/science.304.5678.1732
Shannon, C. E. (1948). A mathematical theory of communication. Bell Syst. Tech. J. 27, 379–423. doi: 10.1002/j.1538-7305.1948.tb01338.x
Stolpe, B., Zhou, Z., Guo, L., and Shiller, A. M. (2014). Colloidal size distribution of humic-and protein-like fluorescent organic matter in the northern Gulf of Mexico. Mar. Chem. 164, 25–37. doi: 10.1016/j.marchem.2014.05.007
Swan, B. K., Martinez-Garcia, M., Preston, C. M., Sczyrba, A., Woyke, T., Lamy, D., et al. (2011). Potential for chemolithoautotrophy among ubiquitous bacteria lineages in the dark ocean. Science 333, 1296–1300. doi: 10.1126/science.1203690
Wilding, A., Liu, R., and Zhou, J. L. (2005). Dynamic behaviour of river colloidal and dissolved organic matter through cross-flow ultrafiltration system. J. Colloid Interface Sci. 287, 152–158. doi: 10.1016/j.jcis.2005.01.114
Xu, H., Ma, Y., Yu, T., Han, G., Guan, D., Wang, J., et al. (2007). General Administration of Quality Supervision, Inspection, and Quarantine of the People's Republic of China and Standardization Administration of China. The Specification for Marine Monitoring-Part 3:Sample Collection, Storage, and Transportation. Beijing: Standards Press of China.
Yang, L., Hong, H., Chen, C.-T. A., Guo, W., and Huang, T.-H. (2013). Chromophoric dissolved organic matter in the estuaries of populated and mountainous Taiwan. Mar. Chem. 157, 12–23. doi: 10.1016/j.marchem.2013.07.002
Keywords: seawater, nanoparticles, size distribution, plankton, diversity index, zooplankton
Citation: Jiang S, Lin P, Cai Y, Chen D, Pan Z, Lin H, Wang F and Lin Q (2021) Association of Seawater Nanoparticle Size Distribution With Diversity of Marine Plankton. Front. Water 3:706875. doi: 10.3389/frwa.2021.706875
Received: 08 May 2021; Accepted: 21 June 2021;
Published: 29 July 2021.
Edited by:
Xiaolong Geng, New Jersey Institute of Technology, United StatesReviewed by:
Zhongyuan Xu, University of Delaware, United StatesWen Ji, New Jersey Institute of Technology, United States
Copyright © 2021 Jiang, Lin, Cai, Chen, Pan, Lin, Wang and Lin. This is an open-access article distributed under the terms of the Creative Commons Attribution License (CC BY). The use, distribution or reproduction in other forums is permitted, provided the original author(s) and the copyright owner(s) are credited and that the original publication in this journal is cited, in accordance with accepted academic practice. No use, distribution or reproduction is permitted which does not comply with these terms.
*Correspondence: Zhong Pan, cGFuemhvbmdAdGlvLm9yZy5jbg==; Qi Lin, eG1xbGluQHNpbmEuY29t