 Chengxiu Li1
 Weiyu Yu1,2Mawuli Dzodzomenyo3Moses Asamoah3Catherine Tlotlo Kerapetse4
 Matt Kandel1
 Jim Wright1*
- 1School of Geography and Environmental Science, University of Southampton, Southampton, United Kingdom
- 2School of Ecological Technology and Engineering, Shanghai Institute of Technology, Shanghai, China
- 3School of Public Health, University of Ghana, Accra, Ghana
- 4The WaterNet Secretariat, University of Zimbabwe, Harare, Zimbabwe
In sub-Saharan Africa, land cover change, expansion of hydropower infrastructure, and increased flooding complicate country-level efforts to meet the Sustainable Development Goal target concerning access to safe water. The Water, Energy and Food (WEF) nexus approach recognises that addressing these complex challenges requires cross-sectoral analyses at multiple scales. Building on such an approach, our study examined the interrelationships between land cover change, dam-related flooding and access to safe water via a national-level spatial analysis with local case studies in Malawi and Ghana. Our assessment of the water–food interactions found that areas of overlap between water points and cropland increased from 2000 to 2020 for both countries at national scale, but overlap extent varied greatly depending on the land cover product used. Local-scale exploration of water point installation patterns in Zomba, Malawi confirmed this pattern, highlighting increasing non-governmental funding of borehole installation programmes. Our assessment of water–energy interactions found that flooding mediated by hydropower dams increased for the White Volta Basin in Ghana, thereby increasing inundation of groundwater points. Local-scale focus group discussions revealed flooding resulted in contaminated water sources and high risk of injury or drowning whilst fetching water. Overall, our study highlights how socio-economic drivers are bringing water points, flooding and cropland into closer proximity, requiring flood mitigation measures at water points and agro-chemical management to minimise potential water quality impacts. Given differences between land cover products, we recommend more robust integration of existing land cover products to better monitor these phenomena.
Introduction
Sustainable Development Goal (SDG) 6 sets out to achieve universal and equitable access to safe and affordable drinking water (United Nations Dept of Economic Social Affairs, 2020). Simultaneously, governments have committed to zero hunger under SDG 2, whilst SDG 7 forms an international commitment to affordable and clean energy. The water–energy–food (WEF) nexus concept seeks to understand the cross-sectoral connections, synergies and trade-offs between these three resource sectors. However, there is no single, agreed WEF nexus definition, so for the purposes of our study, we define it broadly as “the study of the connections between these three resource sectors, together with the synergies, conflicts and trade-offs that arise from how they are managed,” following (Simpson and Jewitt, 2019). Progress towards all SDGs is affected by WEF nexus trade-offs and synergies, with for example all goals linked directly or indirectly to food (Simpson and Jewitt, 2019).
Sub-Saharan Africa (SSA) remains the region facing the greatest challenge in meeting all three SDGs. Only 64.5% of its population had access to basic or safely managed water services in 2020 with only Oceania having lower service coverage (UNICEF/WHO Joint Monitoring Program, 2021). Among safer water sources, non-piped improved water sources (i.e., boreholes, protected wells and springs; rainwater; and bottled or bagged water) predominate, supplying 42.8% of the SSA population in 2020 (UNICEF/WHO Joint Monitoring Program, 2021). The proportion of world population experiencing moderate to severe food insecurity increased from 23.2% in 2014 to 26.4% in 2018, with food price rises in SSA a notable contributor (United Nations Economic Social Council, 2020). In the same period, the global population lacking access to electricity became increasingly concentrated in SSA, so understanding WEF nexus issues in this region is especially critical. The region has particular characteristics that mediate trade-offs between these three targets. It is particularly dependent on hydropower (Falchetta et al., 2019), meaning that many trade-offs between renewable energy and household water and food security relate to dams. This situation is further complicated by numerous transboundary catchments, with the Southern African Development Community alone having 15 such catchments (Conway et al., 2015). SSA's agriculture sector is dominated by rain-fed agriculture and associated green water use, though with hotspots of blue (irrigation) water use (Conway et al., 2015). Agricultural land use has expanded rapidly throughout SSA, with the region's agricultural land increasing by 57% at the expense of natural vegetation over a 25 year period (Brink and Eva, 2009), though there are also pockets of agricultural land abandonment (Blair et al., 2018).
Given the importance of non-piped improved sources in rural SSA, this study examines a subset of WEF nexus inter-connections affecting borehole and well water point safety through an assessment of spatial connections between hydropower dam-mediated flooding and land use for food production. As water becomes scarce, most WEF studies focus on the water sector (Giupponi and Gain, 2017; Albrecht et al., 2018). Studies have examined growing water resources competition between the energy and agricultural sectors, such as multi-objective optimization for multi-purpose reservoir systems (Si et al., 2019), evaluation of the water and energy footprint of irrigated agriculture (Daccache et al., 2014), and understanding interactions between energy and water for agricultural production and food security (Albrecht et al., 2018). However, nexus issues affecting water point safety have received little attention, particularly considering their connection with energy security via flood regime mediation from hydropower dams, as well as the impact from growing agriculture expansion. Globally, conversion of natural to agricultural ecosystems has led to increased mobilisation of salts, particularly in drylands, and leaching of fertilisers into surface and groundwaters, often accompanied by increased streamflow (Scanlon et al., 2007). High salinity, often geogenic but sometimes exacerbated by anthropogenic processes, is a widespread cause of borehole abandonment in Sub-Saharan African countries such as Malawi (Rivett et al., 2019). Where natural ecosystems are converted to rangeland, there is growing evidence that faecal contamination from livestock represents a risk factor for diarrhoeal disease particularly in children (Zambrano et al., 2014; Penakalapati et al., 2017), including via water-borne pathogens such as Cryptosporidium (Daniels et al., 2016). Evidence of the impact of flooding on water point safety is sparser, though it can mobilise pathogens, overwhelm water supply infrastructure, and force consumers to use unsafe, alternative water sources (Levy et al., 2016). Pathogen mobilisation may have longer-term consequences: inundation history was associated with increased risk of microbiological contamination of tubewells in Bangladesh (Luby et al., 2008). For these reasons, observation checklists for identifying and managing contamination hazards around rural water points promoted by WHO have included proximity of livestock and cropland (World Health Organization, 1997), as well as inundation history in revised versions (World Health Organization, 2018).
Because of data availability, systematic review evidence (Albrecht et al., 2018) suggests many water-energy-food nexus studies have been undertaken regionally or nationally, with fewer examples (Nhamo et al., 2020b) at local level. There have also been calls (Chang et al., 2016) to synthesise “bottom-up” and “top-down” studies of trade-offs. Evidence from local case studies are valuable, given that they have been used to validate continental scale quantification of the numbers of people affected by dam construction (Richter et al., 2010). Localised case studies can also ensure broader-scale quantification of affected populations and cost-benefit analyses relating to dams to capture the full range of impacts experienced by downstream populations. Given the complex nature of the WEF nexus, interdisciplinary and mixed methods are also needed that combine quantitative with qualitative data to advance nexus assessments and capture complex synergies and trade-offs (Albrecht et al., 2018).
The complexity of the WEF nexus necessitates innovative use of datasets to understand cross-sectoral interactions (Albrecht et al., 2018). The increasing availability and reliability of geospatial data as a source of WEF-relevant information has been recognised by the FAO (FAO, 2014) and such data have been widely used in WEF analyses (Keskinen et al., 2015; Karabulut et al., 2016; Albrecht et al., 2018). Geospatial data products and spatial analysis thus provide an opportunity to assess both overall WEF security through composite indices created via a multi-criteria approach (Giupponi and Gain, 2017) and potential conflicts between sectors. As the lack of adequate data is a common limitation for studies using robust nexus methods (Wolfe et al., 2016), open access geospatial data further enable transferable and transparent WEF analysis. This study therefore presents an approach for integration of geospatial data and spatial analysis to understand connections between different WEF elements. It examines the interlinkage of water points (water security) with dam-mediated flooding (an energy-related conflict) and with agricultural expansion (a food-related conflict). The study explores the co-location and evolution over time of these three phenomena and thereby potential conflicts between the three dimensions of the WEF Nexus.
Specifically, this study aims to generate evidence on the changing spatial interactions between land use for food production, dam-mediated flooding, and domestic water points over two decades. By drawing on both quantitative and qualitative data sets, this study also aimed to address a methodological gap in the WEF literature, which remains dominated by quantitative approaches (Albrecht et al., 2018). It firstly aims to examine whether agricultural land use conversion and water point installation programmes bring water points into closer proximity with cropland, with potential consequences for managing their safety. Secondly, it aims to quantify the overlap between dam-mediated flooding and domestic water points, again with potential consequences for water safety management. Thirdly, it aims to evaluate the extent to which existing geospatial datasets are suitable for monitoring such spatial interactions in SSA. As energy and agricultural sector stakeholders often do not fully consider the effects of planning decisions on domestic water supply and use, in doing so, it seeks to inform decisions concerning trade-offs and support inter-sectoral coordination of local and national policy—key focal points for WEF analyses.
Materials and Methods
Overview and Conceptual Framework
In examining spatial process connecting flooding mediated by hydropower dams and agricultural land use expansion to domestic water points, our study focuses on two regulating services within the ecosystem services framework (Figure 1). Firstly, through dam overspill regimes, hydropower affects flood regulation and thereby water security as a constituent of well-being. Secondly, land conversion to agriculture mediates the ecosystem service of water purification, with consequences for managing the safety of rural water points.
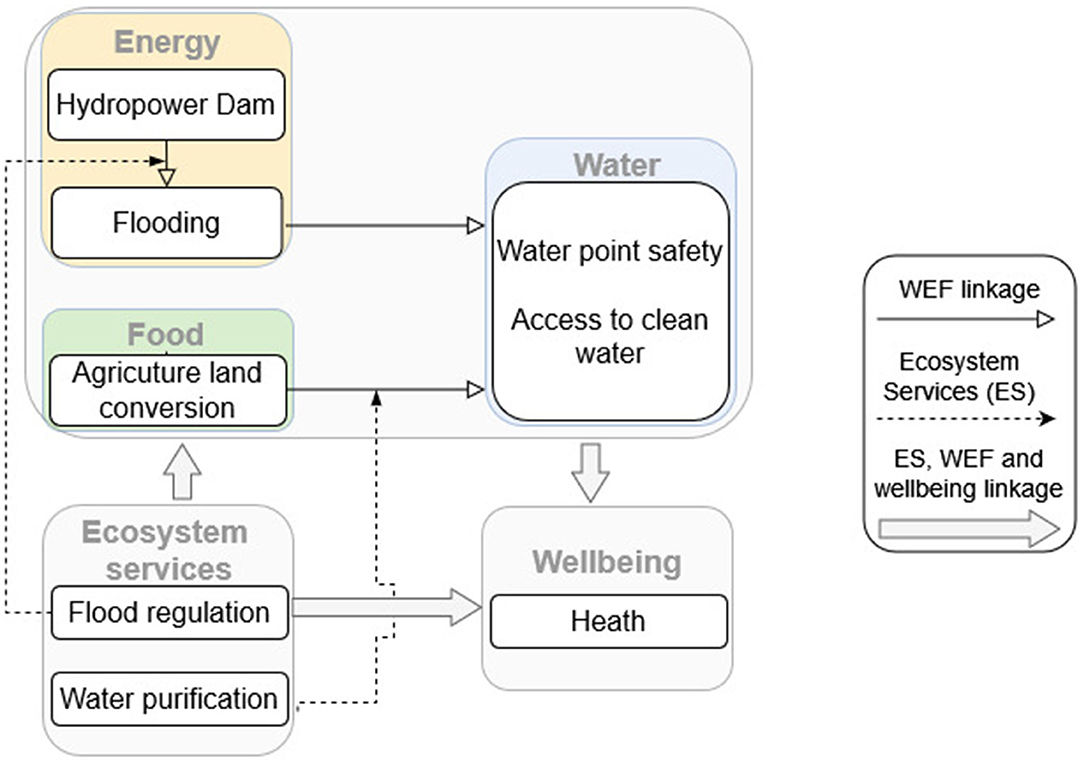
Figure 1. An ecosystem services conceptual framework for WEF nexus interactions between hydropower dams, agricultural land conversion, and water point safety.
To explore these issues, the study draws on Malawi and Ghana as two case study countries within SSA that have a shared reliance on groundwater points for water security, but where potential energy and food-related conflicts affecting groundwater safety vary. Malawi's landscape is dominated by intensively farmed cropland, with rapid cropland expansion, increased soil erosion, and reduced crop productivity (Li et al., 2021). Borehole abandonment from salinisation in Malawi has been exacerbated by agricultural expansion (Rivett et al., 2019). Poor drinking water quality from shallow wells (Smiley, 2017) is aggravated by agricultural pollution from fertilisers in the wet season, particularly in rural areas of southern Malawi (Mkandawire, 2008). In Ghana, woody savanna landscape dominates the central and northern parts of the country where mixed crop-livestock farming and mobile pastoralism are both widespread (Tonah, 2002; Callo-Concha et al., 2012). Livestock from such systems have been identified as a risk factor for faecal contamination of water points in Ghana (Ampofo, 1997; Wardrop et al., 2018). Whilst both countries rely heavily on hydropower for energy, current Malawian hydropower systems are run-of-river, whereas Ghana and upstream Burkina Faso have major hydropower dams such as the Akosombo (Djimesah et al., 2018). Northern part of Ghana is particularly susceptible to flooding from torrential rainfall, coupled with scheduled overspill from the Bagre Dam, Burkina Faso (Figure 2). Water point safety is thus connected with the energy sector, since the multipurpose Bagre Dam has hydropower capacity to provide 10% of Burkina Faso's electricity needs (Manu, 2019). For several decades, Bagre Dam water releases, typically occurring in August-October when dam levels reach 235 m.a.s.l., have caused severe flooding along the White Volta (Djimesah et al., 2018). A hydrological modelling study (Udo et al., 2012) suggested that the Bagre Dam overspill exacerbated flooding relative to a natural hydrological system. Modelling suggested its impact was greatest around 100–150 km downstream, where maximum flood levels at Pwalugu on the border between Upper East and Northern regions were 75 cm greater than they would have been without the dam.
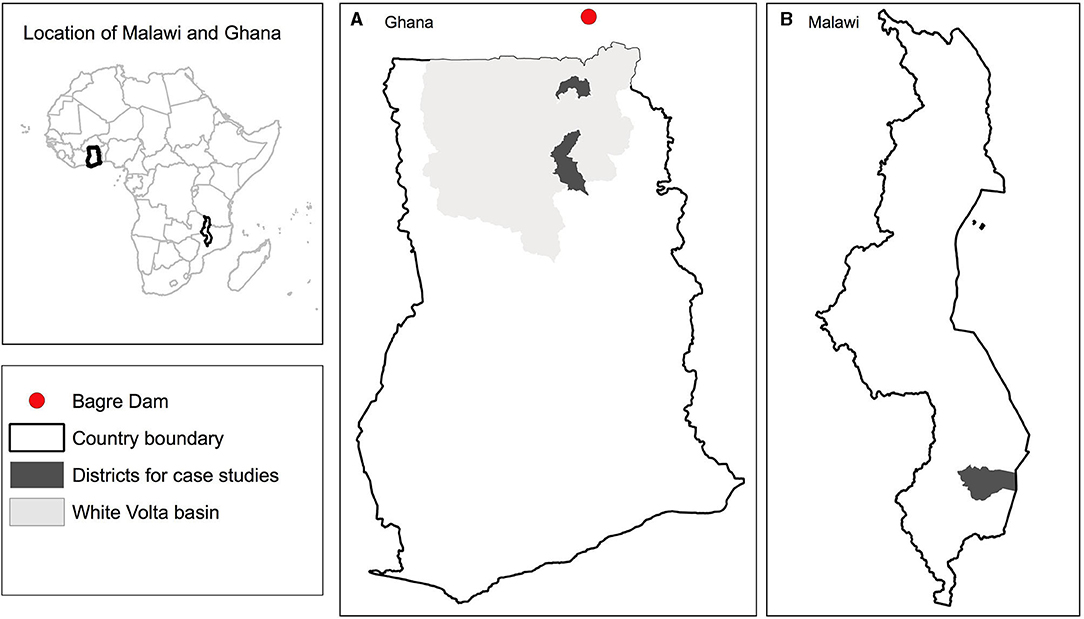
Figure 2. Maps showing (A) location of the case study districts of Talensi and Savelugu Nanton in the White Volta basin of Ghana relative to the Bagre Dam (B) location of the case study district of Zomba, Southern region, Malawi.
Considering the countries' different agricultural and hydropower systems, this study firstly explored agricultural land use change in relation to the spatial distribution of water points in both countries nationally, to assess potential impacts on water security, then explored detailed patterns of change in Zomba District, Malawi as a local case study. Secondly, as a case study exploring the transboundary energy-water nexus, it examines the changing overlaps between dam-related flooding and water points in the White Volta catchment in northern Ghana downstream of the Bagre Dam, with detailed local case studies in Savelugu Nanton and Talensi districts.
National Spatial Analysis
To examine spatial overlap between domestic water points and agricultural land cover types or flooding, gridded surfaces of water point potential geographic occupancy were first estimated from dug well and borehole water point map layers for 2000, 2010, and 2019. In each of these years, in each country, a range overlapping measure was then calculated for these surfaces in relation to cropland, shrubland/grassland, and a satellite-derived estimate of areas subject to inundation. Further details are provided below.
Modelling Potential Geographic Occupancy of Domestic Water Points
Water point data concerning boreholes and dug wells in Malawi and Ghana were obtained from the water point data exchange (See Table 1; Accessed on 2nd Mar 2021). Dug wells and boreholes were chosen for comparison, since there is typically greater oversight of borehole installation via regulators such as the Water Resources Commission in Ghana. In contrast, as a form of “self-supply” (Butterworth et al., 2013), hand-dug well installation is typically subject to less regulatory oversight. Other source types were excluded from analysis, either because too few water points had been mapped to enable analysis (e.g., surface water collection points; rainwater harvesting) or because of difficulties unambiguously classifying source types (e.g., “handpump”; “solar”). Since water points are often incompletely mapped (Yu et al., 2019), potential geographic occupancy was estimated from the raw water point data sets, following a maximum entropy (MaxEnt) modelling technique widely used in spatial ecology (Phillips et al., 2006). By combining georeferenced observational point data with environmental covariates, the MaxEnt model estimates the overall geographic distribution of target objects by predicting the relative probability of presence or relative site suitability across the landscape of interest. In this study, we chose MaxEnt as the modelling technique for its assumption-free and non-parametric nature, good predictive performance, and open-source user-friendly software.
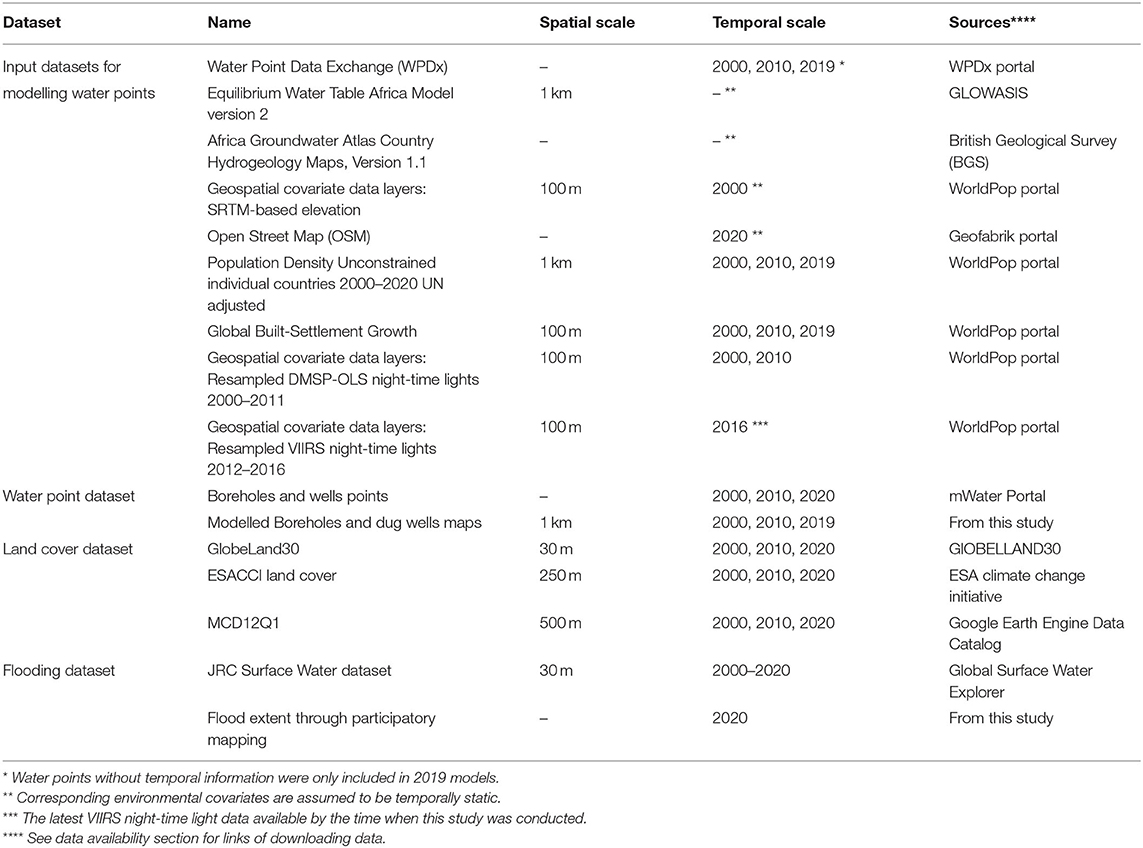
Table 1. Data sources used to model the spatial distribution of water points and examine potential conflicts with agricultural land use and dam-mediated flooding.
Ten covariates were used to predict the spatial distribution of boreholes and dug wells in Ghana and Malawi (Table 1): depth to groundwater level (Fan et al., 2013); groundwater productivity and geology with particular relevance to hydrogeology (British Geological Survey, 2021); lineament density (based on lineaments extracted via an algorithm) (Šilhavý et al., 2016) from NASA's Shuttle Radar Topography Mission (SRTM) DEM; distance to inland water (based on OpenStreetMap); elevation and slope (SRTM DEM); distance to settlements (based on Worldpop settlements); population density (Worldpop); and a poverty index created using population counts and night-time lights data (Elvidge et al., 2009). For each covariate layer likely to change over decadal time scales (e.g., spatial distribution of poverty), data sources were chosen that captured such temporal change. Covariates with finer resolutions were aggregated or resampled to 1 km resolution. Large water bodies identified in any source covariate layers were excluded to retain identical spatial extent for all covariate layers. By overlaying with the pre-processed covariate layers, water points with implausible coordinates (e.g., inside a water body or outside the spatial extent of covariate layers) and those with neighbouring water point(s) within the same 1 km grid cell were excluded from the analysis. Water points missing installation year details were only included in the 2019 model. Supplementary Figure 1 summarises water points excluded from analysis at each step by country and source type.
For each type of water source in each study country, model fitting was carried out using MaxEnt 3.3.3k (Phillips et al., 2006) for each of the years 2000, 2010 and 2019. Each model was fitted using a random subsample of 70% of the pre-processed water points, whilst the remainder was used for performance evaluation based on Monte Carlo cross validation. We restricted the selection of 10,000 background points to administrative level 2 units with observed water points to control for spatial variation in water point mapping effort and resultant sampling bias. Administrative boundaries were obtained from the Global Administrative Areas (GADM) database, version 3.6 (https://gadm.org/; Accessed on 2nd Mar 2021). All available functional transformations of the covariates (i.e., “linear,” “quadratic,” “product,” “threshold,” “hinge” and “discrete”) (Merow et al., 2013) were employed to capture potential non-linear, complex relationships between the covariates and water points. For each water source type in each country, the subsampling of training/test data, model fitting, performance evaluation and prediction were repeated 500 times to generate summary grids of final predictions and performance metrics. An optimal model was selected corresponding to the regularisation multiplier (swept from 0.5 to 10 with an increment of 0.5) with the largest Area Under the Receiver Operator Curve (AUC) (DeLong et al., 1988). AUC was used instead of information criteria (e.g., theAkaike Information Criterion) due to known issues with threshold and hinge features (Warren et al., 2014). The AUC value lies between 0.5 and 1, where denotes a perfect predictive power, whilst 0.5 denotes a useless prediction no better than a random distribution All model default settings were kept, whilst logistic output was used for ease of interpretation. The original logistic output arbitrarily assumed an occurrence prevalence of 0.5 (Merow et al., 2013) and thus can be interpreted as the relative ranking of each grid across the landscape instead of true occurrence probability. The model for the years 2000, 2010, and 2019 with the best performance was selected for prediction and projected by applying it to the covariate sets of the other 2 years. For each water source type in each country, we converted the final predicted relative site suitability surfaces to binary grids depicting areas potentially occupied/unoccupied by boreholes and dug wells by setting an optimal cut-off value based on the maximum sum of sensitivity and specificity as previously recommended (Liu et al., 2013).
Quantification of Changes in Land Cover
Our analysis focused on land cover conversion to croplands, grasslands and shrublands in relation to water point locations, with their definitions corresponding to Inter-governmental Panel on Climate Change (IPCC) land categories. Grasslands and shrublands were used as a proxy for rangeland, which together with croplands served as indicators of agricultural land use. These three land cover classes account for around 69 and 55% of land area in Malawi and Ghana respectively in 2020 based on the GlobeLand30 land cover dataset (Chen and Chen, 2018). Whilst various land cover datasets are available globally and nationally, there are quite large spatial inconsistencies between different land cover products, particularly concerning cropland and in Sub-Saharan Africa (Pérez-Hoyos et al., 2017; Hua et al., 2018; Xu et al., 2019). To understand uncertainties in land cover products and maximise the reliability of land cover representation, multiple land cover products were therefore compared and a composite land cover map created for both Ghana and Malawi. Three land cover products were selected, namely GlobeLand30, ESACCI land cover (European Space Agency Climate Change Initiative), and MCD12Q1 (a MODIS-derived land cover product, Friedl and Sulla-Menashe, 2019), since all cover the period from 2000 to 2020. As these land cover products use different detailed class labels, relevant land cover classes were harmonised to the same broad-level classes of croplands, grasslands and shrublands for comparison among three land cover products (Supplementary Table 1). To retain spatial detail, the ESACCI (300 m spatial resolution) and MODIS (500 m spatial resolution) datasets were resampled to the higher spatial resolution (30 m) of the GlobeLand30 data set. Two composite binary layers depicting croplands and grasslands/shrublands were created based on a voting method, where the land cover was classified as present when at least two of the three datasets agreed, but otherwise classed as absent. Temporal changes between 2000, 2010, and 2020 in croplands and grasslands, shrublands area were analysed based on the three land cover products as well as the composite map. All four land cover products were further used for subsequent overlap analysis with the spatial distribution of water points.
Flooding Patterns, as Mediated by Hydropower
Flooded areas in the White Volta catchment of northern Ghana were detected via the JRC Yearly Water Classification dataset, which was generated using Landsat 5, 7, and 8 satellite imagery from 1984 to 2019 (Pekel et al., 2016). This dataset maps the location and temporal distribution of seasonal and permanent surface water over a 38-year period at a spatial resolution of 30 m. For our study, areas classified as seasonal surface water were considered as flooding. For consistency with the temporal coverage of estimated water point potential geographic occupancy, the maximum areal extent of inundation was calculated for three 10-year periods (1991–2000, 2001–2010, 2011–2020) for the White Volta catchment in Ghana. Inundation extent was again used for overlap analysis with the spatial distribution of water points. We also obtained data on daily levels of the Bagre Dam from 2015 onwards via Ghana's National Disaster Management Organisation (NADMO), examining the timing of its overspill relative to flooding.
Changing Spatial Overlap Between Water Points, Cropland, and Dam-Mediated Flooding
To investigate trends in overlap between agricultural land cover classes and dam-mediated flooding, a spatial overlap index between target land cover classes and water points was calculated for each of the years 2000, 2010, and 2020. Rather than using relative site suitability or probability values, for simplicity, the overlap index was based on binary classifications of flood, cropland, rangeland and water point extent as described above. Following a commonly used metric in spatial ecology (Fieberg and Kochanny, 2005), the overlap index was defined as the proportion of flooded or rangeland/cropland within the area with high potential occupancy of water points.
Local Case Studies in Northern Ghana and Malawi
Impacts of Hydropower-Related Flooding on Water Point Use in Northern Ghana
Within each of two flood-prone districts of Savelugu Nanton and Talensi in northern Ghana, four flood-affected communities were identified via satellite imagery and stakeholder consultation for more detailed mapping of flood-affected sites. In each of these eight communities, the local assembly person (an elected representative) was asked to map the locations of water points and maximum flood extent on hardcopy basemaps of the area. Colour basemaps showing grid coordinates were generated from high resolution Google satellite imagery, with acquisition dates between 2016 and 2019. Map scales varied between communities from 1:5,000 to 1:20,000, following recommended practise for participatory mapping (Forrester and Cinderby, 2015). Subsequently, in each community, four focus group discussions (FGDs) were convened with groups of eight local residents per discussion. Eligible FGD respondents were over 18 years' old, resident for at least 10 years, and owning property or land. Each focus group discussed flooding impacts on water sources and the communities' coping strategies or alternative water sources used in response to flooding. All interviews and discussions took place in the Farafra and Dagbani dialects in September 2020 and were audio-recorded. Recorded interviews were translated into English and transcribed verbatim, then analysed using the NVivo 12 software. Thematic and content analysis methods were used to analyze the data both inductively and deductively (Braun and Clarke, 2006). A codebook was created based on the research questions, findings, field notes, and reading transcripts, to guide coding.
Local Trends in Water Point Installation in Zomba District, Malawi
To explore the relationship between installation programmes and spatial patterns of water point expansion through a local case study, we downloaded water point data for Zomba District from a national Malawian database (https://portal.mwater.co/) that contains installation programme details. We then examined installation programme trends, mapping individual water points in relation to land cover and testing for differences in recorded installation funders by decade using chi square analysis.
Results
National Spatial Analysis
Changes in Water Points
In this study, 0.5 was the optimal regularisation multiplier (a parameter to address model over-fitting) for both borehole and dug well models in Ghana, whilst 1 was the optimal multiplier for both water source types in Malawi. Our models display good predictive power according to the AUCs (for Ghana, AUCboreholes = 0.79; AUCdugwells = 0.83; and for Malawi, AUCboreholes = 0.83; AUCdugwells = 0.77). For Ghana, the areas predicted to have high borehole occupancy were concentrated in Upper East, Upper West and a substantial area of western Ghana, with isolated hotspots in Northern Region and Eastern Ghana (Figure 3A). For dug wells, the potential occupancy showed broadly similar geographic patterns to that of boreholes, except in Upper West where only isolated hotspots of relatively high occupancy were found (Figure 3B).
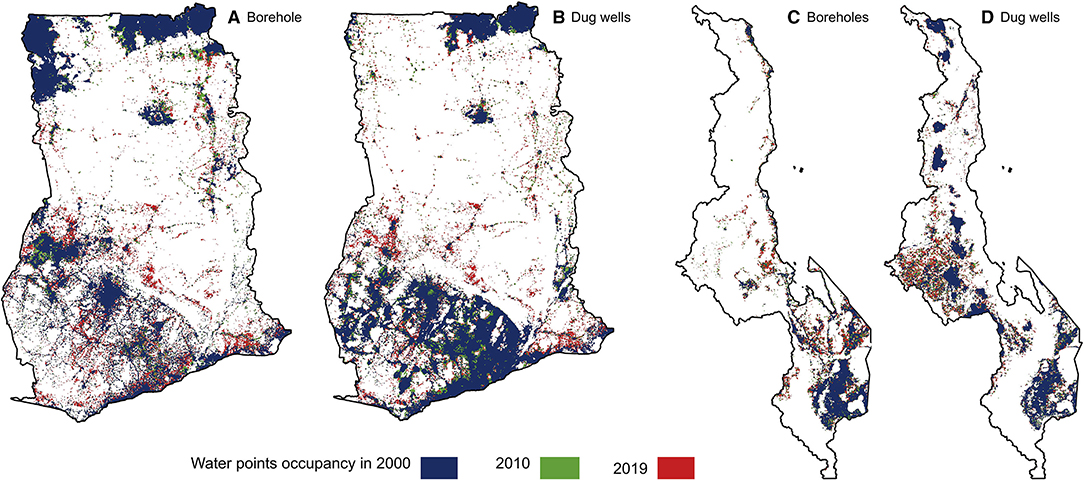
Figure 3. Maps depicting areas of high potential occupancy in the years 2000, 2010 and 2019 of (A) boreholes in Ghana; (B) hand-dug wells in Ghana; (C) boreholes in Malawi; and (D) hand-dug wells in Malawi, as derived via presence-only spatial distribution modelling of water point locations.
The analysis suggested that overall potential geographic occupancy of both boreholes and dug wells had expanded over the last 20 years as a proportion of Ghana's land area (Figures 3, 4): from 18.7% in 2000 to 20.3% in 2010 to 23.8% in 2019 for boreholes and from 18.7% in 2000 to 21.4% in 2010 to 25.7% in 2019 for dug wells. For Malawi, the areas with high borehole occupancy were mainly concentrated in Southern Malawi, with isolated hotspots in Central Malawi and along the shores of Lake Malawi (Figure 3C). Patterns of dug well occupancy in Malawi differed from that of boreholes, with more areas of high occupancy found in Northern and Central Malawi (Figure 3D). Potential occupancy areas also expanded over time in Malawi, from 10.4% in 2000 to 16.8% in 2019 for boreholes and from 16.6% in 2000 to 25.0% in 2019 for dug wells (Figure 4).
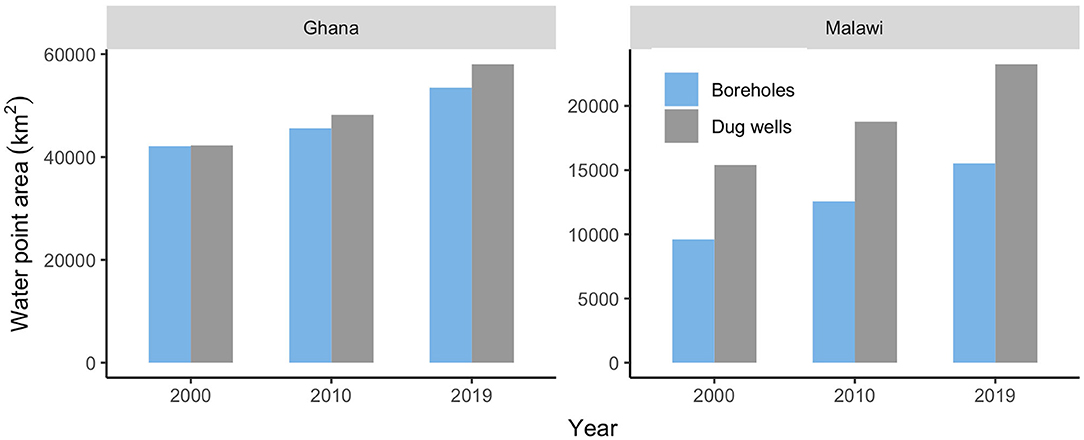
Figure 4. Total national area with high potential occupancy of boreholes and hand-dug wells in Ghana and Malawi in the years 2000, 2010 and 2019.
Food-Related Conflicts: Changes in Overlap Between Water Points and Agricultural Land Use
There was notable inconsistency in the cropland and shrubland/grassland area identified via the four land cover products (i.e., the three land cover datasets and the composite) for both Ghana and Malawi in 2000, 2010, and 2020 (Supplementary Figure 2). Although there were very large differences in land cover areas between the three products, each showed consistent temporal trends. Three out of four datasets showed a slight increase in area of both cropland area and grasslands/shrubland in Malawi (Supplementary Figure 2). For Ghana, three out of four datasets showed increased grasslands/shrublands, with the highest area in 2010. Cropland area however declined slightly, particularly from 2000 to 2010 (Supplementary Figure 2). All four land cover products were included in subsequent overlap analysis.
Overall, the area of overlap between agricultural land use (croplands, grasslands/shrublands as a proxy for rangeland) and water points increased for both boreholes and dug wells, and for both Ghana and Malawi (Figures 5, 6). However, the proportion of cropland within the water point occupancy area (measured by the cropland overlap index) declined for both countries and both boreholes and dug wells. In contrast to the cropland overlap index, the shrubland/grassland overlap index generally increased for both countries and for boreholes and dug wells (Figures 5, 6). However, for boreholes in Ghana, it declined from 2010 to 2020 based on the composite, ESACCI and GLC30 products. To conclude, there is growing overlap between agricultural land use and water points, predominantly driven by water point and shrubland/grassland expansion rather than by cropland expansion.
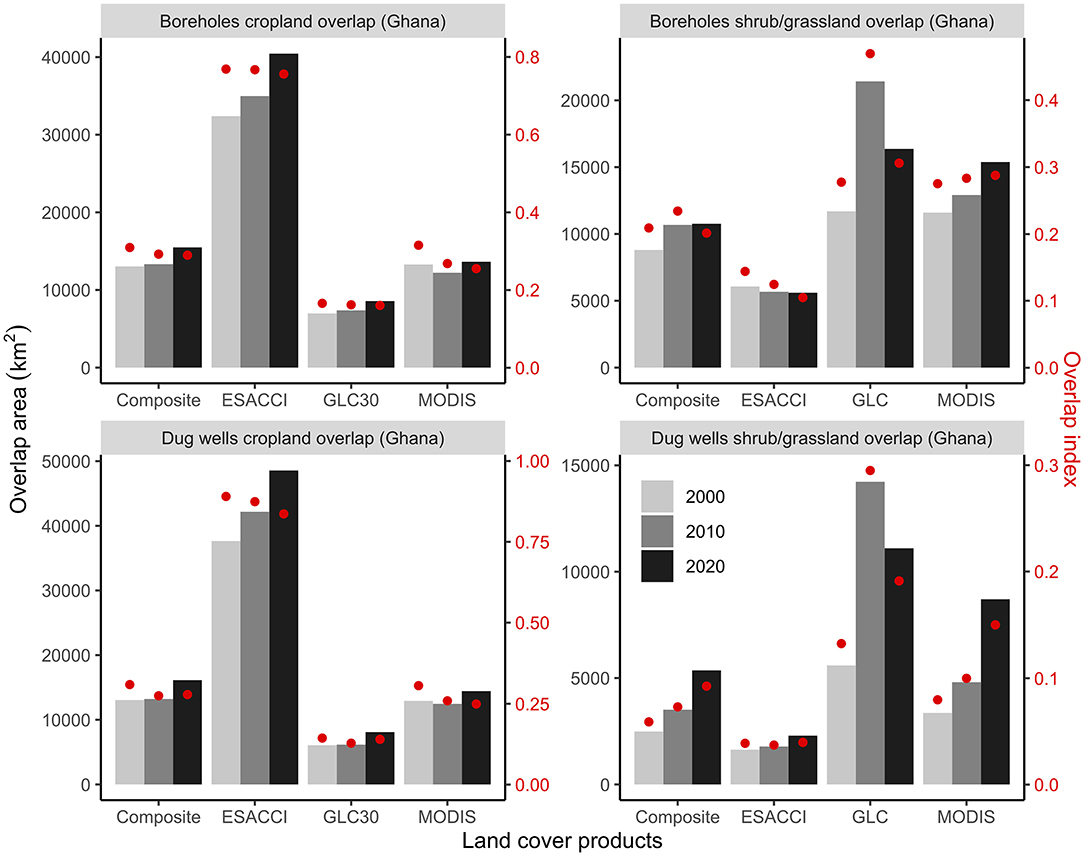
Figure 5. Overlap area and overlap index between agricultural land use (cropland, grassland and shrubland) and potential geographic occupancy with boreholes and dug wells in Ghana for 2000, 2010, and 2020 [analysis based on four land cover products, namely a composite based on a voting method, ESACCI, Globeland 30 (GLC30) and MODIS. Left-hand vertical axis indicates the total overlap area, whilst the right-hand axis shows an overlap index].
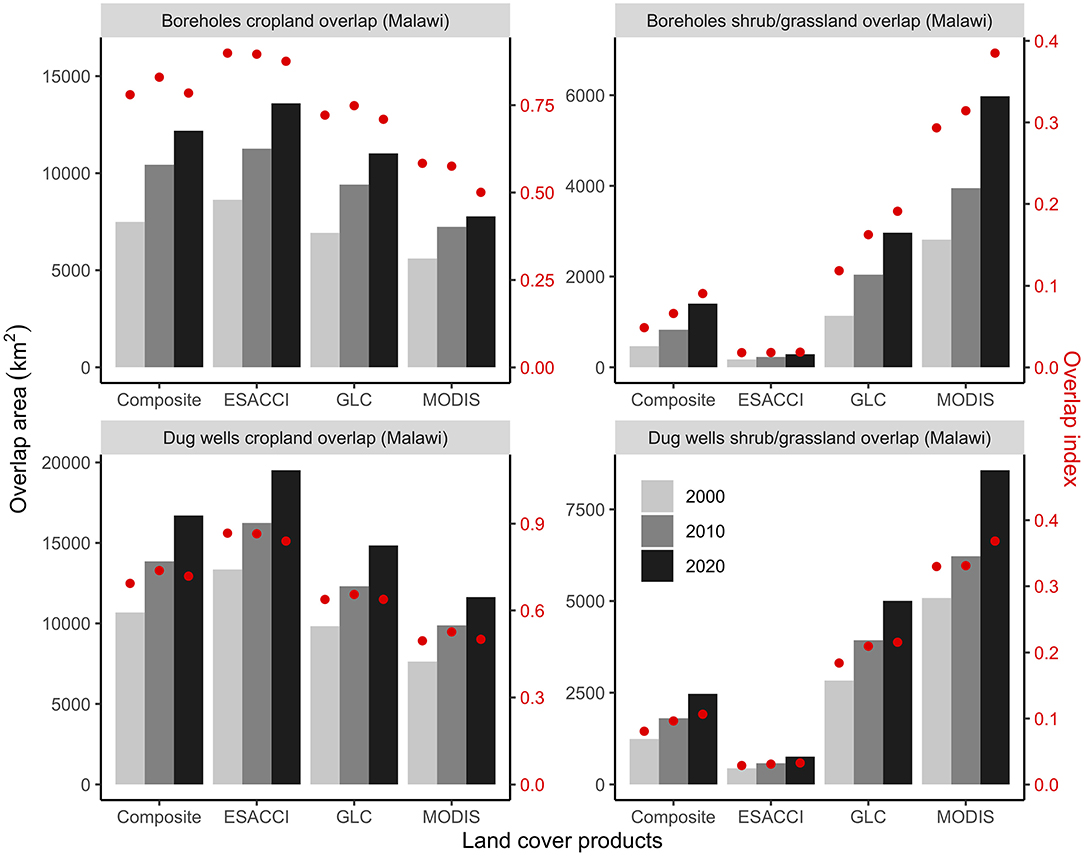
Figure 6. Overlap area and overlap index between agricultural land use (cropland, grassland and shrubland) and potential geographic occupancy with boreholes and dug wells in Malawi for 2000, 2010, and 2020 [analysis based on four land cover products, namely a composite based on a voting method, ESACCI, Globeland 30 (GLC30) and MODIS. Left-hand vertical axis indicates the total overlap area, whilst the right-hand axis shows an overlap index].
Energy-Related Conflicts: Changes in Overlap Between Water Points and Dam-Mediated Flooding
Over the two decades studied, the extent of inundation, exacerbated at times by overspill from the hydropower Bagre Dam, progressively increased in the White Volta basin in Ghana (Supplementary Figure 3). Similarly, there are increases in overlap area and overlap index between inundation extent and water points for both boreholes and dug wells (Figure 7). These increased overlaps indicated that water points were increasingly affected by flooding downstream of the Bagre Dam, with dam overspill occurring almost annually from 2015. NADMO records for 2015–2020 indicated that the Bagre Dam level reached 235 m, the threshold for triggering overspill, in every year except 2017. This level was reached on 14 Sept in 2015, 24th Sept 2016, 31st August in 2018, 21st October in 2019, and 10th August in 2020.
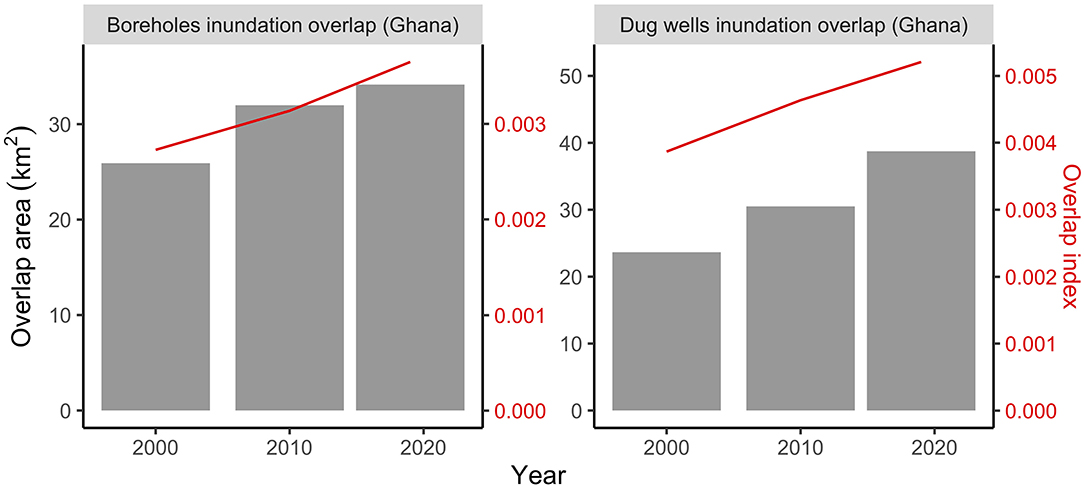
Figure 7. Overlap between inundation extent and areas with high borehole or hand-dug well potential geographic occupancy in downstream of the Bagre Dam White Volta basin of Ghana for the years 2000, 2010, and 2020 (left-hand vertical axis indicates the total overlap area, whilst the right-hand axis shows an overlap index).
Local Case Studies in Northern Ghana and Malawi
Hydropower-Related Flooding and Water Safety Management in Northern Ghana
As shown in Figure 8, the flood-affected communities where focus groups took place in Talensi and Savelugu districts, Ghana, used a mixture of boreholes, hand-dug wells, and surface water sources (dams and ponds). During flooding from the Bagre Dam overspill, the risk of drowning disrupted focus group participants' usual patterns of source use:
“All our boreholes have been submerged in water. Our dams are also covered by the flood, so we are unable to go near the dams to fetch water. It is very risky for one to get drowned at the dam when flooded. We see it as a death trap, so nobody goes near.” (Male respondent, Savelugu)
“My own nephew drowned and died at a water point when it was flooded and he tried to go and fetch water. A similar event happened in the past, so people get scared to go near a water source during flooding.” (Male respondent, Talensi)
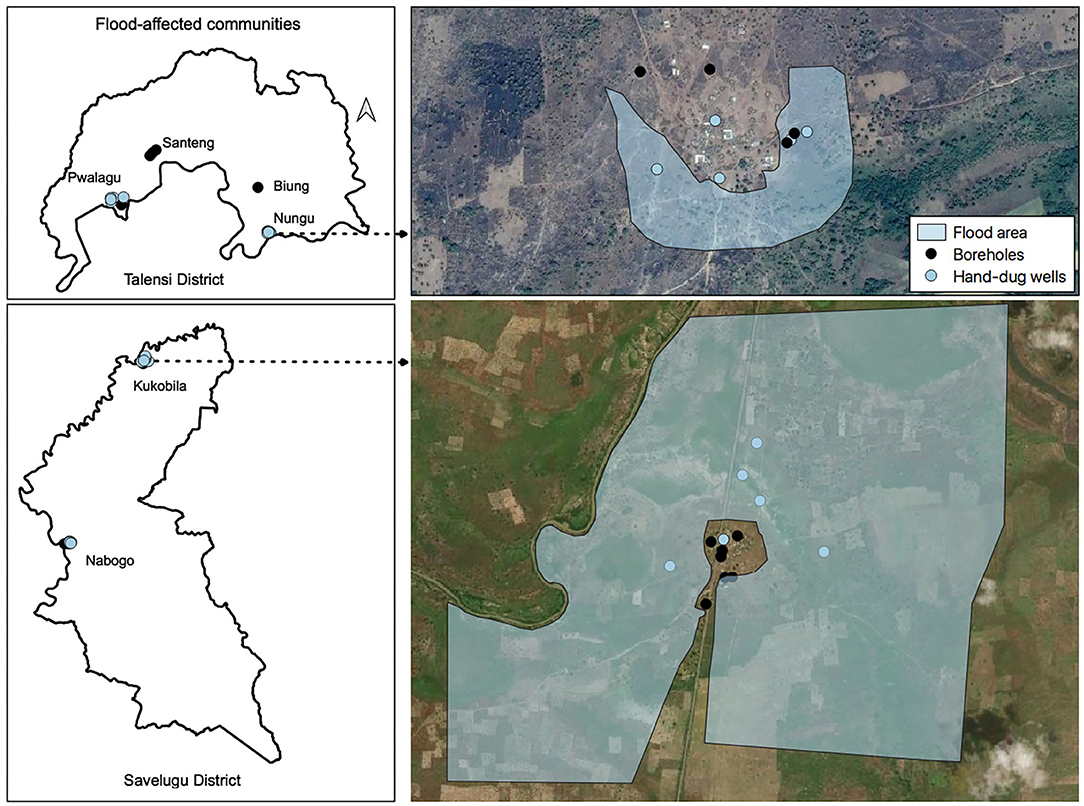
Figure 8. Maps of water points and maximum historical inundation extent mapped by local political representatives in selected communities of Tamale and Savelugu Nanton districts, Ghana. Map data: Google, © 2021 CNES/ Airbus, Maxar Technologies.
Following inundation, focus group participants in both districts described obvious contamination issues with boreholes and surface water:
“When the water subsided in one of the submerged boreholes, we noticed that there's so much dirt in the water when we fetched some. Maggots came from it when we pump the water. Sometimes, the water gets a certain rotten scent, which makes the water unhygienic to drink or use.” (Female respondent, Savelugu)
“We have to force and drink the affected water, which will in effect cause some diseases because all the water sources have been affected and we do not have any other option than to drink the affected water.” (Male respondent, Talensi)
To cope with the disruption, participants reported that some households were able to switch to harvested rainwater, whilst others attempted water treatment:
“My household as well as some of the community members harvest rainwater for drinking whenever our water source is affected by the floods.” (Female respondents, Savelugu)
“What we do is to use something to tie a sieve on the mouth of the borehole and then we pump the water and sieve out the maggots.” (Female respondents, Savelugu)
Whilst district health authorities reported promoting boiling and home water treatment through chlorination, focus group participants did not mention adopting these strategies.
Local Trends in Water Point Installation and Cropland Conversion in Zomba District, Malawi
Figure 9 shows the detailed local pattern of borehole and well expansion from 1991 to 2020 in the case study district of Zomba, Malawi, in relation to changes in cropland. Densification of both types of groundwater point is apparent within the area that was already cropland in the year 2000, with relatively small additional areas being converted to cropland elsewhere. The number of recorded well and borehole installations progressively increased by decade, rising from 487 in 1991 to 2000 to 1154 in 2011 to 2020 for boreholes and from 42 to 122 for wells (Supplementary Tables 2, 3). Examining the underlying funding records for water point installation in the mWater database, a chi square test indicated the proportion of borehole installations funded by the Malawian government decreased significantly from 52.8% (215 of 407) in 1991–2000 to 31.3% (206 of 658) by 2011–2020 (p < 0.001) (proportions are of those wells where a funder was recorded). Meanwhile, the proportion of boreholes installed by Non-Governmental Organisations (NGOs) increased significantly from 16.2% (66) to 34.5% (227) over these decades. Funding arrangements for wells remained similar however, with most wells community-funded in all decades (comprising 24 or 64.9% in 1991–2000 and 39 or 52.7% in 2011–2020).
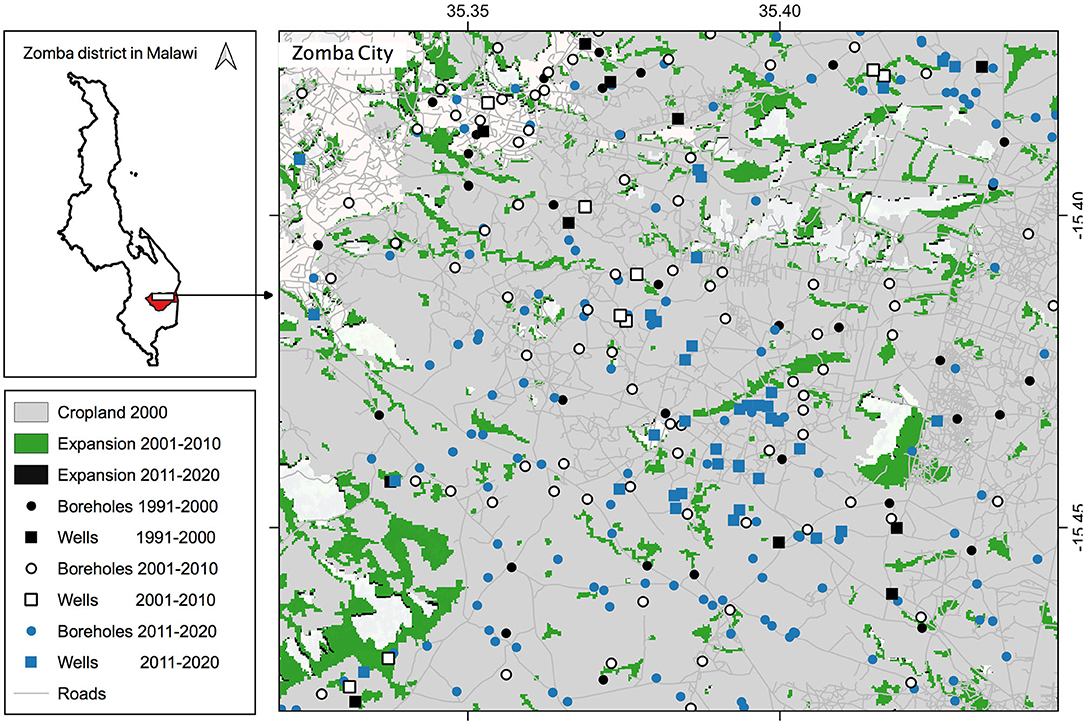
Figure 9. Map showing expansion of boreholes, wells, and cropland area in Zomba district, Malawi, from 1991–2020 (water point data from the mWater Portal).
Discussion
Challenges of Examining Water Points Safety Through a WEF Approach
This study, for the first time, integrates geospatial analysis with qualitative fieldwork to address complex WEF challenges at multiple scales. It examines the water–energy nexus whereby hydropower dams affect flood regimes and water point safety, and the water–food nexus whereby proximity with agriculture may compromise groundwater point safety. In contrast to the focus on water scarcity challenges in most studies, this study examined contamination hazards and water point safety, understanding and addressing these challenges through a WEF approach. This reflects the close connection between water point safety and the energy sector, since construction of hydropower dams may sometimes exacerbate flood risk for downstream water points (Richter et al., 2010), both as sources become contaminated and as consumers switch to alternative, riskier water sources during or following flooding (Levy et al., 2016). In addition, the interactions between water points and agriculture expansion are complex, with potential contamination pathways including exacerbated salinisation and fertiliser leaching into groundwater points (Scanlon et al., 2007) and faecal contamination as livestock share water points with people (Daniels et al., 2016; Penakalapati et al., 2017). Our study highlighted the growing spatial overlap between water points, flooding and agricultural land use, thereby providing insights into managing water points, as well as highlight difficulties in quantifying impacts on water point safety from hydropower dams and agriculture expansion.
The increasing absolute area of overlap between water points and cropland suggests the management of a growing number of water points needs to take account of the surrounding arable landscape. These increased overlaps are consistent for both boreholes and hand-dug wells in both Malawi and Ghana from 2000 to 2019, though the proportion of area with high potential occupancy overlapping with cropland has remained similar throughout (Figures 5, 6). As illustrated by the Zomba District case study, this growth in overlap was primarily due to an expansion in the distribution of both boreholes and hand-dug wells over this period, rather than an expansion of cropland. This trend is broadly apparent in each of three global land cover products. Hand-dug wells are often regarded as a form of “self-supply” installed by communities themselves without external intervention (Butterworth et al., 2013), whereas borehole installation requires specialist expertise. Formal regulatory oversight of both source types remains partial in much of SSA (Wijnen et al., 2012). Despite these differences in installation processes, both water point types showed similar overlap trends. Similarly, greater grassland and shrubland expansion was apparent in both Malawi and Ghana, leading to closer proximity of these land covers to water points, although a declining overlap trend was apparent for boreholes in Ghana (Figure 5).
Analysis of Ghana's White Volta catchment similarly suggests that the proportion and absolute area of both boreholes and hand-dug wells lying in flood-prone areas has also increased from 2000 to 2019 (Figure 6). This reflects both an expansion of water points, but also an apparent increase in flood-affected area within this period. Focus group discussions in affected communities indicate consistent reports of public health risks from this flooding, both as sources become contaminated but also through the risk of injury or drowning whilst fetching water. Integration of geospatial flood products is valuable in understanding where flooding and water points overlap, which could be used to target campaigns for flood-proofing of water points, for example.
We identified growing spatial overlap over the past two decades between flooding and water points, however there are difficulties specifically attributing flood risk to hydropower dams, such as the Bagre Dam in our study. Interviewees in previous qualitative studies have however attributed the cause of frequent flooding to spillage from the Bagre Dam (Adomah Bempah and Olav Øyhus, 2017; Abass et al., 2019). Previous flood modelling work (Udo et al., 2012) suggests that some of this risk is attributable to dam construction, but it is unclear how much, without further flood modelling of the natural vs. modified catchment or an understanding of flood risk prior to dam construction. In addition, dams can also mitigate flood risk. There is potential to examine the flood-related impacts of individual hydropower dams via geospatial flood products for the periods pre- and post-operation, for example where a dam became operational between 2010 and 2015. In future studies, there would be scope to assess spatio-temporal patterns of flooding pre- and post-dam construction in catchments downstream of such dams, so as to understand this interaction between water point management and the growing number of dams worldwide.
Opportunities and Limitations of Integrating Geospatial Data for Understanding the WEF Nexus
Given the complex nature of the WEF nexus, specific methods to analyse WEF interactions remain limited (Albrecht et al., 2018). The WEF nexus requires interdisciplinary and transdisciplinary approaches to advance nexus assessments and achieve optimal solutions (Albrecht et al., 2018; Botai et al., 2021), together with numerous and diverse analytical tools from environmental management, economics and social science (Albrecht et al., 2018). These include indicator-based approaches (Mabhaudhi et al., 2019; Nhamo et al., 2020a), scenario analysis (De Stercke et al., 2020), and stakeholder engagement (Hoolohan et al., 2018; Bielicki et al., 2019). Using geospatial water point mapping data, land cover classification, and flood mapping from satellite imagery, our study illustrates a methodology for potential integration of such geospatial products to examine the WEF nexus at catchment or regional scale, and evaluates the impacts of land use change on the community at local scale. For the first time, our study integrates geospatial analysis with qualitative fieldwork to address complex WEF challenges at multiple scales, thereby highlighting opportunities and limitations in using geospatial analysis and products for addressing WEF nexus challenges.
Geospatial analysis allows integration of all components of the water–food–energy–nexus at national scale, but also targeting of localised fieldwork at specific locations. In our study, examination of flood imagery enabled subsequent targeting of areas for FGD fieldwork. Furthermore, our national-scale analysis highlights specific locations where water points are exposed to flooding and agriculture expansion, which could be targeted for future microbiological testing surveys. In addition, spatially explicit data provides potential to scale up local studies to the national scale. For example, local patterns of borehole and well expansion could also be driven by NGO funding elsewhere in Malawi apart from Zomba, especially in the modelled, national-scale hotspots of water point expansion (Figure 3). Similarly, other parts of Ghana could also experience increased water contamination and high accident risks when community members fetch water during flooding, as identified by FGDs in the two study districts.
Geospatial data, however, carry uncertainties that present difficulties for WEF analysis. For example, the extent of cropland varies between land cover products in SSA (Pérez-Hoyos et al., 2017; Hua et al., 2018; Xu et al., 2019) and in Ghana and Malawi as shown in this study. Such discrepancies reflect the different spatial resolutions of these products and the region's relatively small field sizes and heterogeneous landscape. Whilst we used a simple “voting” method to combine such products in our work, an accuracy assessment study using African ground validation data sets (Tsendbazar et al., 2015) suggests that more sophisticated data fusion methods for combining land cover products would yield more accurate estimates of cropland extent. Such data fusion methods could be used to assess overlap between water point distributions and cropland in future with greater accuracy.
In addition, geospatial data mostly provide indicators, rather than directly measuring water contamination hazards that constitute conflicts in WEF analysis. For example, in this study it remains problematic to map the spatial distribution of livestock from land cover classes when assessing overlap between water points and rangeland, despite growing evidence that livestock pose a significant faecal contamination risk to domestic water. Given the complexity of mixed crop-livestock farming systems in areas such as northern Ghana (Penu and Paalo, 2021), the use of land cover classes such as shrubland remain a comparatively poor proxy for rangeland. In future studies, an alternative approach would be to examine water point overlaps with the Gridded Livestock of the World (Gilbert et al., 2018) or related products (Da Re et al., 2020). Rather than relying solely on land cover, such products downscale livestock counts from agricultural censuses using ancillary geospatial data.
Aside from uncertainties in geospatial data, other limitations affecting our findings relate to the underpinning water point mapping data and overlap indices used. For example, water point inventories often have incomplete installation date recording and use inconsistent source typologies. Records seldom differentiate water points for irrigation from those for domestic purposes (Yu et al., 2019). Apparent trends in water point installation and funding by decade could thus reflect the changing incompleteness of underlying record-keeping, with proportionately more installation records being lost from earlier decades. We generated an overlap index based on a binary representation of cropland, flooding and water point distributions, but alternative overlap indices used in spatial ecology could be used to compare pairs of continuous map layers, such as potential water point occupancy, percentage cropland within a pixel, or flood frequency.
Conclusions
This study synthesised geospatial data concerning water points, land cover, and flooding to quantify spatial interactions between domestic water point safety, agricultural production, and dam-mediated flooding. Particularly given expansion of wells and boreholes through installation programmes, it highlights an increasing area of overlap between water points and cropland in both Malawi and Ghana, thus illustrating spatial aspects of the WEF nexus. For the White Volta basin in Ghana, we also show how geospatial products can be used to quantify overlap between dam-mediated flooding and water points, with the public health consequences of this overlap apparent through focus group discussion findings in case study communities within this basin. Given differences between land cover products, in future research, we recommend use of data fusion techniques to integrate these products and thereby better quantify spatial overlap with water points. Given the potential faecal contamination risk to domestic water points from livestock, we also recommend use of gridded livestock density map layers to quantify such overlaps.
Data Availability Statement
The water point datasets analysed for this study can be found in the Water Point Mapping Data Exchange (https://www.waterpointdata.org/), the mWater portal (https://portal.mwater.co/#/). For the predictive covariates used in the model, equilibrium water table depth can be downloaded through the European Union Collaborative project of Global Water Scarcity Information Service (GLOWASIS) at https://glowasis.deltares.nl/thredds/catalog/opendap/opendap/Equilibrium_Water_Table/catalog.html; [Accessed on 16th April, 2018] groundwater productivity and geology with relevance to hydrogeology can be obtained from https://www2.bgs.ac.uk/africagroundwateratlas/index.cfm; the NASA's Shuttle Radar Topography Mission (SRTM) DEM used to create lineament density, elevation and slope can be downloaded from the United States Geological Survey (USGS) EarthExplorer at https://earthexplorer.usgs.gov/; inland water derived from OpenStreetMap can be downloaded from http://download.geofabrik.de/; population density, settlements and resampled Visible Infrared Imaging Radiometer Suite (VIIRS) Night-time Lights can be downloaded from WorldPop portal at https://www.worldpop.org/. The land cover product can be found in http://www.globallandcover.com/home_en.html (GlobeLand30), http://www.esa-landcover-cci.org/ (ESACCI), https://developers.google.com/earth-engine/datasets/catalog/MODIS_006_MCD12Q1?hl=en (MCD12Q1). The JRC Yearly Water dataset for flooding detection can be found in https://global-surface-water.appspot.com/, and also https://developers.google.com/earth-engine/datasets/catalog/JRC_GSW1_3_GlobalSurfaceWater?hl=en. The Africa and country Administrative Boundaries can be found in ArcGIS online resources (https://www.arcgis.com/home/item.html?id=64aff05d66ff443caf9711fd988e21dd (Africa country boundaries), https://data.humdata.org/dataset/malawi-administrative-level-0-3-boundaries (Malawi Administrative Boundaries), https://data.humdata.org/dataset/ghana-administrative-boundaries (Ghana Administrative Boundaries)). The Bagre dam location can be found in Global Reservoir and Dam (GRanD) https://sedac.ciesin.columbia.edu/data/collection/grand-v1/sets/browse. Above dataset was accessed before July 2021. Participatory flood extent mapping output generated in this study are available on https://doi.org/10.5258/SOTON/D1956 (after 1st October, 2021).
Ethics Statement
The studies involving human participants were reviewed and approved by the Faculty of Environmental and Life Sciences Ethical Review Committee, University of Southampton, UK (25/07/2020, Reference 54506.A2) and the Institutional Review Board of the Noguchi Memorial Institute for Medical Research, University of Ghana (04/03/2020, Reference NMIMR-IRB CPN 062/19-20). The participants provided their written informed consent to participate in this study.
Author Contributions
CL, WY, and JW drafted the manuscript and designed the secondary data analysis. WY undertook water point analyses, whilst CL undertook analyses of land cover, and flood imagery. MA and MD designed, collected, analysed and curated the northern Ghana study data, and edited the manuscript. CK designed, collected, analysed and curated the Malawian case study, and edited the manuscript. MK contributed to the study design and edited the manuscript. MD and JW managed the project. All authors contributed to the article and approved the submitted version.
Funding
This work was funded through the Building REsearch Capacity for sustainable water and food security in drylands of sub-saharan Africa (BRECcIA) which is supported by UK Research and Innovation as part of the Global Challenges Research Fund, grant number NE/P021093/1.
Conflict of Interest
The authors declare that the research was conducted in the absence of any commercial or financial relationships that could be construed as a potential conflict of interest.
Publisher's Note
All claims expressed in this article are solely those of the authors and do not necessarily represent those of their affiliated organizations, or those of the publisher, the editors and the reviewers. Any product that may be evaluated in this article, or claim that may be made by its manufacturer, is not guaranteed or endorsed by the publisher.
Acknowledgments
We wish to thank Ghana's National Disaster Management Organisation (NADMO) for their support for fieldwork in Talensi and Savelugu Nanton Districts. We acknowledge the ESA CCI Land Cover project for providing land cover products © ESA Climate Change Initiative—Land Cover led by UCLouvain (2017).
Supplementary Material
The Supplementary Material for this article can be found online at: https://www.frontiersin.org/articles/10.3389/frwa.2021.730370/full#supplementary-material
References
Abass, K., Dumedah, G., and Frempong, F. (2019). Understanding the physical and human contexts of fluvial floods in rural Ghana. Int. J. River Basin Manag. 2019, 1–12. doi: 10.1080/15715124.2019.1653310
Adomah Bempah, S., and Olav Øyhus, A. (2017). The role of social perception in disaster risk reduction: beliefs, perception, and attitudes regarding flood disasters in communities along the Volta River, Ghana. Int. J. Disaster Risk Reduc. 23, 104–108. doi: 10.1016/j.ijdrr.2017.04.009
Albrecht, T. R., Crootof, A., and Scott, C. A. (2018). The water-energy-food nexus: a systematic review of methods for nexus assessment. Environ. Res. Lett. 13:043002. doi: 10.1088/1748-9326/aaa9c6
Ampofo, J. A. (1997). A survey of microbial pollution of rural domestic water supply in Ghana. Int. J. Environ. Health Res. 7, 121–130. doi: 10.1080/09603129773913
Bielicki, J. M., Beetstra, M. A., Kast, J. B., Wang, Y., and Tang, S. (2019). Stakeholder perspectives on sustainability in the food-energy-water nexus. Front. Environ. Sci. 7:7. doi: 10.3389/fenvs.2019.00007
Blair, D., Shackleton, C. M., and Mograbi, P. J. (2018). Cropland abandonment in south african smallholder communal lands: land cover change (1950–2010) and farmer perceptions of contributing factors. Land 7(4). doi: 10.3390/land7040121
Botai, J. O., Botai, C. M., Ncongwane, K. P., Mpandeli, S., Nhamo, L., Masinde, M., et al. (2021). A review of the water–energy–food nexus research in Africa. Sustainability 13:1762. doi: 10.3390/su13041762
Braun, V., and Clarke, V. (2006). Using thematic analysis in psychology. Qual. Res. Psychol. 3, 77–101. doi: 10.1191/1478088706qp063oa
Brink, A. B., and Eva, H. D. (2009). Monitoring 25 years of land cover change dynamics in Africa: a sample based remote sensing approach. Appl. Geogr. 29, 501–512. doi: 10.1016/j.apgeog.2008.10.004
British Geological Survey (2021). Africa Groundwater Atlas [Online]. Nottingham, UK: British Geological Survey. Available online at: https://www2.bgs.ac.uk/africagroundwateratlas/index.cfm (accessed October 10, 2020).
Butterworth, J., Sutton, S., and Mekonta, L. (2013). Self-supply as a complementary water services delivery model in Ethiopia. Water Alternat. 6, 405–423. Available online at: https://www.ircwash.org/sites/default/files/self-supply_as_a_complementary_water_services_delivery_model_in_ethiopia.pdf (accessed September 20, 2021).
Callo-Concha, D., Gaiser, T., and Ewert, F. (2012). “Farming and cropping systems in the West African Sudanian Savanna. WASCAL research area: Northern Ghana, Southwest Burkina Faso and Northern Benin,” in ZEF Working Paper Series (Bonn).
Chang, Y., Li, G. J., Yao, Y., Zhang, L. X., and Yu, C. (2016). Quantifying the water–energy–food nexus: current status and trends. Energies 9:65. doi: 10.3390/en9020065
Chen, J., and Chen, J. (2018). GlobeLand30: operational global land cover mapping and big-data analysis. Sci. China Earth Sci. 61, 1533–1534. doi: 10.1007/s11430-018-9255-3
Conway, D., van Garderen, E. A., Deryng, D., Dorling, S., Krueger, T., Landman, W., et al. (2015). Climate and southern Africa's water-energy-food nexus. Nat. Clim. Chang. 5, 837–846. doi: 10.1038/nclimate2735
Da Re, D., Gilbert, M., Chaiban, C., Bourguignon, P., Thanapongtharm, W., Robinson, T. P., et al. (2020). Downscaling livestock census data using multivariate predictive models: sensitivity to modifiable areal unit problem. PLoS ONE 15:e0221070. doi: 10.1371/journal.pone.0221070
Daccache, A., Ciurana, J. S., Rodriguez Diaz, J. A., and Knox, J. W. (2014). Water and energy footprint of irrigated agriculture in the Mediterranean region. Environ. Res. Lett. 9:124014. doi: 10.1088/1748-9326/9/12/124014
Daniels, M. E., Smith, W. A., Schmidt, W. P., Clasen, T., and Jenkins, M. W. (2016). Modeling cryptosporidium and giardia in ground and surface water sources in rural india: associations with latrines, livestock, damaged wells, and rainfall patterns. Environ. Sci. Technol. 50, 7498–7507. doi: 10.1021/acs.est.5b05797
De Stercke, S., Chaturvedi, V., Buytaert, W., and Mijic, A. (2020). Water-energy nexus-based scenario analysis for sustainable development of Mumbai. Environ. Modell. Softw. 134:104854. doi: 10.1016/j.envsoft.2020.104854
DeLong, E. R., DeLong, D. M., and Clarke-Pearson, D. L. (1988). Comparing the areas under two or more correlated receiver operating characteristic curves: a nonparametric approach. Biometrics 44, 837–845. doi: 10.2307/2531595
Djimesah, I. E., Okine, A. N. D., and Kissi Mireku, K. (2018). Influential factors in creating warning systems towards flood disaster management in Ghana: an analysis of 2007 Northern flood. Int. J. Disaster Risk Reduc. 28, 318–326. doi: 10.1016/j.ijdrr.2018.03.012
Elvidge, C. D., Sutton, P. C., Ghosh, T., Tuttle, B. T., Baugh, K. E., Bhaduri, B., et al. (2009). A global poverty map derived from satellite data. Comput. Geosci. 35, 1652–1660. doi: 10.1016/j.cageo.2009.01.009
Falchetta, G., Gernaat, D., Hunt, J., and Sterl, S. (2019). Hydropower dependency and climate change in sub-Saharan Africa: a nexus framework and evidence-based review. J. Clean. Prod. 231, 1399–1417. doi: 10.1016/j.jclepro.2019.05.263
Fan, Y., Li, H., and Miguez-Macho, G. (2013). Global patterns of groundwater table depth. Science 339:940. doi: 10.1126/science.1229881
FAO (2014). The Water-Energy-Food Nexus: A New Approach in Support of Food Security and Sustainable Agriculture. Rome: FAO.
Fieberg, J., and Kochanny, C. O. (2005). Quantifying home-range overlap: the importance of the utilization distribution. J. Wildl. Manage. 69, 1346–1359. doi: 10.2193/0022-541X(2005)691346:QHOTIO2.0.CO
Forrester, J., and Cinderby, S. (2015). A Guide to Using Community Mapping and Participatory-GIS. York: Stockholm Environment Institute, University of York.
Friedl, M., and Sulla-Menashe, D. (2019). MCD12Q1 MODIS/Terra+Aqua Land Cover Type Yearly L3 Global 500 m SIN Grid V006 [Data set]. NASA EOSDIS Land Processes DAAC. doi: 10.5067/MODIS/MCD12Q1.006 (accessed April 20, 2021).
Gilbert, M., Nicolas, G., Cinardi, G., Van Boeckel, T. P., Vanwambeke, S. O., Wint, G. R. W., et al. (2018). Global distribution data for cattle, buffaloes, horses, sheep, goats, pigs, chickens and ducks in 2010. Sci. Data 5:180227. doi: 10.1038/sdata.2018.227
Giupponi, C., and Gain, A. K. (2017). Integrated spatial assessment of the water, energy and food dimensions of the Sustainable Development Goals. Reg. Environ. Change 17, 1881–1893. doi: 10.1007/s10113-016-0998-z
Hoolohan, C., Larkin, A., McLachlan, C., Falconer, R., Soutar, I., Suckling, J., et al. (2018). Engaging stakeholders in research to address water–energy–food (WEF) nexus challenges. Sustain. Sci. 13, 1415–1426. doi: 10.1007/s11625-018-0552-7
Hua, T., Zhao, W., Liu, Y., Wang, S., and Yang, S. (2018). Spatial consistency assessments for global land-cover datasets: a comparison among GLC2000, CCI LC, MCD12, GLOBCOVER and GLCNMO. Remote Sens. 10:1846. doi: 10.3390/rs10111846
Karabulut, A., Egoh, B. N., Lanzanova, D., Grizzetti, B., Bidoglio, G., Pagliero, L., et al. (2016). Mapping water provisioning services to support the ecosystem–water–food–energy nexus in the Danube river basin. Ecosyst. Serv. 17, 278–292. doi: 10.1016/j.ecoser.2015.08.002
Keskinen, M., Someth, P., Salmivaara, A., and Kummu, M. (2015). Water–energy–food nexus in a transboundary river basin: the case of Tonle Sap Lake, Mekong River Basin. Water 7, 5416–5436. doi: 10.3390/w7105416
Levy, K., Woster, A. P., Goldstein, R. S., and Carlton, E. J. (2016). Untangling the impacts of climate change on waterborne diseases: a systematic review of relationships between diarrheal diseases and temperature, rainfall, flooding, and drought. Environ. Sci. Technol. 50, 4905–4922. doi: 10.1021/acs.est.5b06186
Li, C., Kandel, M., Anghileri, D., Oloo, F., Kambombe, O., Chibarabada, T. P., et al. (2021). Recent changes in cropland area and productivity indicate unsustainable cropland expansion in Malawi. Environ. Res. Lett. 16:084052. doi: 10.1088/1748-9326/ac162a
Liu, C. R., White, M., and Newell, G. (2013). Selecting thresholds for the prediction of species occurrence with presence-only data. J. Biogeogr. 40, 778–789. doi: 10.1111/jbi.12058
Luby, S. P., Gupta, S. K., Sheikh, M. A., Johnston, R. B., Ram, P. K., and Islam, M. S. (2008). Tubewell water quality and predictors of contamination in three flood-prone areas in Bangladesh. J. Appl. Microbiol. 105, 1002–1008. doi: 10.1111/j.1365-2672.2008.03826.x
Mabhaudhi, T., Nhamo, L., Mpandeli, S., Nhemachena, C., Senzanje, A., Sobratee, N., et al. (2019). The water–energy–food nexus as a tool to transform rural livelihoods and well-being in Southern Africa. Int. J. Environ. Res. Public Health 16:2970. doi: 10.3390/ijerph16162970
Manu, D. K. (2019). Assessing the Impact of Bagre Dam Spillage in the Pru East District of Brong Ahafo Region. PhD, University of Education, Winneba.
Merow, C., Smith, M. J., and Silander, J. A. Jr (2013). A practical guide to MaxEnt for modeling species' distributions: what it does, and why inputs and settings matter. Ecography 36, 1058–1069. doi: 10.1111/j.1600-0587.2013.07872.x
Mkandawire, T. (2008). Quality of groundwater from shallow wells of selected villages in Blantyre District, Malawi. Phys. Chem. Earth Parts A/B/C 33, 807–811. doi: 10.1016/j.pce.2008.06.023
Nhamo, L., Mabhaudhi, T., Mpandeli, S., Dickens, C., Nhemachena, C., Senzanje, A., et al. (2020a). An integrative analytical model for the water-energy-food nexus: South Africa case study. Environ. Sci. Policy 109, 15–24. doi: 10.1016/j.envsci.2020.04.010
Nhamo, L., Ndlela, B., Mpandeli, S., and Mabhaudhi, T. (2020b). The water–energy–food nexus as an adaptation strategy for achieving sustainable livelihoods at a local level. Sustainability 12:8582. doi: 10.3390/su12208582
Pekel, J.-F., Cottam, A., Gorelick, N., and Belward, A. S. (2016). High-resolution mapping of global surface water and its long-term changes. Nature 540, 418–422.
Penakalapati, G., Swarthout, J., Delahoy, M. J., McAliley, L., Wodnik, B., Levy, K., et al. (2017). Exposure to animal feces and human health: a systematic review and proposed research priorities. Environ. Sci. Technol. 51, 11537–11552. doi: 10.1021/acs.est.7b02811
Penu, D. A. K., and Paalo, S. A. (2021). Institutions and pastoralist conflicts in Africa: a conceptual framework. J. Peacebuild. Dev. 16, 224–241. doi: 10.1177/1542316621995733
Pérez-Hoyos, A., Rembold, F., Kerdiles, H., and Gallego, J. (2017). Comparison of global land cover datasets for cropland monitoring. Remote Sens. 9:1118. doi: 10.3390/rs9111118
Phillips, S. J., Anderson, R. P., and Schapire, R. E. (2006). Maximum entropy modeling of species geographic distributions. Ecol. Modell. 190, 231–259. doi: 10.1016/j.ecolmodel.2005.03.026
Richter, B. D., Postel, S., Revenga, C., Scudder, T., Lehner, B., Churchill, A., et al. (2010). Lost in development's shadow: the downstream human consequences of dams. Water Altern. 3, 14–42. Available online at: https://www.water-alternatives.org/index.php/volume3/v3issue2/80-a3-2-3/file (accessed September 20, 2021).
Rivett, M. O., Budimir, L., Mannix, N., Miller, A. V. M., Addison, M. J., Moyo, P., et al. (2019). Responding to salinity in a rural African alluvial valley aquifer system: to boldly go beyond the world of hand-pumped groundwater supply? Sci. Total Environ. 653, 1005–1024. doi: 10.1016/j.scitotenv.2018.10.337
Scanlon, B. R., Jolly, I., Sophocleous, M., and Zhang, L. (2007). Global impacts of conversions from natural to agricultural ecosystems on water resources: quantity versus quality. Water Resour. Res. 43:W03437. doi: 10.1029/2006WR005486
Si, Y., Li, X., Yin, D., Li, T., Cai, X., Wei, J., et al. (2019). Revealing the water–energy–food nexus in the Upper Yellow River Basin through multi-objective optimization for reservoir system. Sci. Total Environ. 682, 1–18. doi: 10.1016/j.scitotenv.2019.04.427
Šilhavý, J., Minár, J., Mentlík, P., and Sládek, J. (2016). A new artefacts resistant method for automatic lineament extraction using Multi-Hillshade Hierarchic Clustering (MHHC). Comput. Geosci. 92, 9–20. doi: 10.1016/j.cageo.2016.03.015
Simpson, G. B., and Jewitt, G. P. W. (2019). The development of the water–energy–food nexus as a framework for achieving resource security: a review. Front. Environ. Sci. 7:8. doi: 10.3389/fenvs.2019.00008
Smiley, S. L. (2017). Quality matters: incorporating water quality into water access monitoring in rural Malawi. Water Int. 42, 585–598. doi: 10.1080/02508060.2017.1344818
Tonah, S. (2002). Fulani pastoralists, indigenous farmers and the contest for land in Northern Ghana. Africa Spectrum 37, 43–59.
Tsendbazar, N.-E., De Bruin, S., Fritz, S., and Herold, M. (2015). Spatial accuracy assessment and integration of global land cover datasets. Remote Sens. 7, 15804–15821. doi: 10.3390/rs71215804
Udo, J., Klopstra, D., Hartman, M., Andah, W., van de Giessen, N., Termes, P., et al. (2012). North Ghana Sustainable Development, Disaster Prevention and Water Resources Management: Flood Hazard Assessment, White Volta. Lelystad, Netherlands.
UNICEF/WHO Joint Monitoring Program (2021). Household Data on Water Sanitation and Hygiene (WASH). New York: UNICEF. Available online at: https://washdata.org/data/household (accessed September 16, 2021).
United Nations Dept of Economic Social Affairs (2020). Make the SDGS a Reality. New York, NY: UN Dept of Economic and Social Affairs. Available online at: https://sdgs.un.org/#goal_section (accessed September 24, 2020).
United Nations Economic and Social Council (2020). Progress Towards the Sustainable Development Goals: Report of the Secretary-General. New York, NY: United Nations Economic and Social Council.
Wardrop, N. A., Hill, A. G., Dzodzomenyo, M., Aryeetey, G., and Wright, J. A. (2018). Livestock ownership and microbial contamination of drinking-water: evidence from nationally representative household surveys in Ghana, Nepal and Bangladesh. Int. J. Hyg. Environ. Health 221, 33–40. doi: 10.1016/j.ijheh.2017.09.014
Warren, D. L., Wright, A. N., Seifert, S. N., and Shaffer, H. B. (2014). Incorporating model complexity and spatial sampling bias into ecological niche models of climate change risks faced by 90 California vertebrate species of concern. Divers. Distrib. 20, 334–343. doi: 10.1111/ddi.12160
Wijnen, M., Augeard, B., Hillier, B., Ward, C., and Huntjens, P. (2012). “Managing the invisible: understanding and improving groundwater governance,” in Water Papers (Washington, D.C.).
Wolfe, M. L., Ting, K. C., Scott, N., Sharpley, A., Jones, J. W., and Verma, L. (2016). Engineering solutions for food-energy-water systems: it is more than engineering. J. Environ. Stud. Sci. 6, 172–182. doi: 10.1007/s13412-016-0363-z
World Health Organization (1997). Guidelines for Drinking-Water Quality. Vol. 3: Surveillance and Control of Community Supplies. Geneva: WHO.
World Health Organization (2018). Revision of WHO Sanitary Inspection Forms. Geneva: World Health Organization. Available online at: https://www.who.int/water_sanitation_health/sanitation-waste/sanitation/revision-of-who-sanitary-inspection-forms/en/ (accessed February 22, 2021).
Xu, Y., Yu, L., Feng, D., Peng, D., Li, C., Huang, X., et al. (2019). Comparisons of three recent moderate resolution African land cover datasets: CGLS-LC100, ESA-S2-LC20, and FROM-GLC-Africa30. Int. J. Remote Sens. 40, 6185–6202. doi: 10.1080/01431161.2019.1587207
Yu, W. Y., Wardrop, N. A., Bain, R. E. S., Alegana, V., Graham, L. J., and Wright, J. A. (2019). Mapping access to domestic water supplies from incomplete data in developing countries: An illustrative assessment for Kenya. PLoS ONE 14:e0216923. doi: 10.1371/journal.pone.0216923
Keywords: WEF nexus application, resource scarcity, spatial modelling, geographical information systems, water safety planning, land cover change
Citation: Li C, Yu W, Dzodzomenyo M, Asamoah M, Kerapetse CT, Kandel M and Wright J (2021) Growing Spatial Overlap Between Dam-Related Flooding, Cropland and Domestic Water Points: A Water–Energy–Food Nexus Management Challenge in Malawi and Ghana. Front. Water 3:730370. doi: 10.3389/frwa.2021.730370
Received: 24 June 2021; Accepted: 10 September 2021;
Published: 08 October 2021.
Edited by:
Alex Lechner, University of Lincoln, United KingdomReviewed by:
Xiang Li, China Institute of Water Resources and Hydropower Research, ChinaLuxon Nhamo, Water Research Commission, South Africa
Daohan Huang, Beijing University of Civil Engineering and Architecture, China
Copyright © 2021 Li, Yu, Dzodzomenyo, Asamoah, Kerapetse, Kandel and Wright. This is an open-access article distributed under the terms of the Creative Commons Attribution License (CC BY). The use, distribution or reproduction in other forums is permitted, provided the original author(s) and the copyright owner(s) are credited and that the original publication in this journal is cited, in accordance with accepted academic practice. No use, distribution or reproduction is permitted which does not comply with these terms.
*Correspondence: Jim Wright, Si5BLldyaWdodEBzb3Rvbi5hYy51aw==