 Paulo Sérgio Lourenço Saveca1,2,3*†
 Attoumane Abi2,4†
 Tibor Yvan Stigter2†
 Eelco Lukas3†
 Francois Fourie3†
- 1Division of Agriculture, Instituto Superior Politécnico de Gaza, Campus Politécnico de Lionde, Gaza, Mozambique
- 2Department of Water Resources and Ecosystems, IHE Delft Institute for Water Education, Delft, Netherlands
- 3Faculty of Natural and Agricultural Sciences, Institute for Groundwater Studies, University of the Free State, Bloemfontein, South Africa
- 4Department of Applied Sciences, Université du Québec à Chicoutimi, Chicoutimi, QC, Canada
Drought and water scarcity constrain the socioeconomic development of many (semi-)arid regions of Southern Africa. Moreover, due to the increase of water withdrawals upstream, the Limpopo River is no longer perennial in Mozambique. Fortunately, its river bed can store significant amounts of freshwater, because of the occurrence of thick and often coarse sand deposits formed through pronounced dryland weathering, erosion, and sedimentation in the river channel. Such so-called “sand rivers” exist in many parts of semi-arid Africa and have varying configurations and hydrological conditions. The current research aims to comparatively assess the Limpopo sand river aquifer in terms of recharge and discharge dynamics, storage potential, and interactions with the surface water flow, as a function of its specific hydrological conditions: its large size, location downstream of a dam releasing permanent ecological flow, and its relatively undeveloped state. For this purpose field investigations were carried out at two sites, involving groundwater level measurements, 2D geoelectrical surveying, water chemical and stable isotope analysis, and sediment classification. These investigations reveal the occurrence of medium to coarse sands with thicknesses that can reach 10–15 m, dropping to 2–5 m in the main river channel, underlain by less permeable clays and silts. Analysis of the river level shows that large parts of the sand river are flooded almost every year, providing optimal conditions for recurring and rapid recharge of the system (confirmed by infiltration tests) through two mechanisms: direct infiltration of surface runoff and lateral flow toward non-flooded areas of the river valley, also confirmed by the chemical and isotope study. During the dry season, groundwater provides base flow to the river and the average water level drop in the sand river system is about 1.8 m. The connectivity with the river margins is limited, due to the clayey nature of the river bank sediment, but local paleochannels can result in a continuation of sand layers. Hydrological processes controlling the water quality are evapoconcentration, mixing of discharging groundwater with the perennial surface water flow, and to a minor extent mineral dissolution, with the groundwater being of Ca-HCO3 type. The combination of the large size, high permeability, and frequent flooding of the sand river deposits provides optimal conditions for groundwater abstraction, requiring additional assessment of the impact on riparian vegetation and downstream users.
Introduction
Water scarcity in semi-arid regions is becoming more critical due to increasing water demand, population growth, changing land use/land cover, and climate change (e.g., Scanlon et al., 2006; Cuthbert et al., 2016; Xiao et al., 2018). Groundwater is the primary source of water for socioeconomic development in semi-arid regions. Understanding the groundwater dynamics and hydrological processes is crucial to assessing groundwater-surface water interactions and their importance for (ground)water availability in surface and shallow subsurface systems, a particular example of which are ephemeral rivers.
The twenty-first century has been projected to be characterized by a progressive increase of drought, following a similar trend observed in the twentieth century for the southern African countries (Stocker et al., 2013). Similar to the other countries sharing the Limpopo river basin (LRB), Mozambique is affected by such climatic evolution (Shongwe et al., 2009). At the same time, several studies have pointed out the increasing and uncontrolled abstractions in the upstream area of the LRB (FAO, 2004; van der Zaag et al., 2010), as well as the river's decreasing discharge in the dry period (FAO, 2004; LBPTC, 2010). Although the literature does not explicitly report discharge values for the dry period, some authors state that the Limpopo River regularly dries out (Ferro and Bouman, 1987). Others report that the river is no longer perennial (LBPTC, 2010).
The LRB is shared between four countries, in which several water usages are listed, including irrigation, which represents half of the total water demand (LBPTC, 2010). Moreover, water consumption is expected to increase with new water infrastructures being planned within the Limpopo basin (LBPTC, 2010; van der Zaag et al., 2010). Furthermore, many authors highlight the difficulties that the Limpopo River riparian countries face to fulfill the current water need and the concerns about future water requirements (FAO, 2004; van der Zaag et al., 2010). In addition, some cases of pollution have been reported, such as the bioaccumulation of metals in fish muscles (Jooste et al., 2014), the death of crocodiles due to an accumulation of toxic elements within the sediments (LBPTC, 2010), and a deterioration of the water quality from upstream to downstream, especially in Mozambique (FAO, 2004; Chilundo et al., 2008; LBPTC, 2010). Moreover, the investigations of Chilundo et al. (2008) in the Mozambican part of the Limpopo River, have shown that the sodium adsorption ratio (SAR) is >10 for the majority of the samples collected between November and January, which indicates a risk of soil sodification and consequently a decrease of the soil infiltration capacity (Ayers and Westcot, 1994).
In addition to extracting water directly from the river, the sand deposited inside the river channels has historically been employed as an alternative water resource in the semi-arid Southern African regions, especially in the dry period, when the river dries out (Hussey, 2003). With the first studies reported in the early 1980s in Botswana (Hussey, 2003), the high potential of sand river deposits, also known as sand rivers, to provide water in water-scarce areas has been acknowledged particularly in Sub-Saharan Africa (Herbert et al., 1997; Hussey, 2003, 2007; Wekesa, 2017). It is important to note that the occurrence of sand rivers is conditioned by the availability of sediments through incomplete weathering and erosion mechanisms (Hussey, 2007). Factors such as semi-arid climate with large seasonal thermal amplitudes, the occurrence of basement rock and high-slope areas control the supply and deposition of sediments, as explained by Hussey (2003) and Collinson et al. (2006). Sediment grain size and sand river dimensions are significant for the potential storage (Hussey, 2007; Stigter et al., 2019). On the other hand, Mansell and Hussey (2005) show that the slope and the length of the sand river are important for the period that the water can be held in the matrix: a higher slope and shorter stretch of sand river will result in a faster depletion of the reservoir.
These previous studies have shown that sand rivers have different configurations and hydrogeological properties. In general, their recharge appears to place during flood events and seems to be a rapid process, given the high hydraulic conductivity of the sediment (Herbert et al., 1997). Depending on the geological setup, the sand river system can be connected to the regional aquifer (Hussey, 2007). In addition, the water of the sand river aquifers is commonly reported to be of good quality compared to the river water (Hussey, 2003, 2007; Svubure et al., 2011). Notwithstanding, these shallow systems are vulnerable and can be easily polluted (Herbert et al., 1997), as revealed by Svubure et al. (2011), who reported on pollution with bacteria and viruses in the district Lupane in Zimbabwe. Although we nowadays know more about sand rivers, their heterogeneity and varying behavior at different scales call for additional study on the recharge and discharge mechanisms and dynamics, as well as sand river continuity and connectivity with the river banks. In the current study, we aim to assess the properties and behavior of the Limpopo sand river in its largest (up to 500 m wide) and most downstream segment, located in Mozambique, where its potential for development is still largely underutilized (contrary to many other sand rivers in the world), but where the perennial flow is artificially maintained through dam release. More specifically, we aim to evaluate the importance of these boundary conditions (large size, perennial flow, undeveloped state) on the sand river flow system, its boundaries, the predominant recharge mechanisms and frequency, storage potential, and groundwater interaction with the river. This is done with the aid of geophysical surveys, sediment analysis, water level measurements and hydrochemical and stable isotope analyses of groundwater and river water. Ultimately this will allow us to make a comparative assessment with other sand river systems with different characteristics (i.e., smaller, and/or non-perennial river flow, and/or exploited), and come up with recommendations for the management and use of the Limpopo sand river system as a water source for crop production and/or drinking supply for small farmers and communities.
Study Area Description
The study area covers a downstream segment of the Limpopo River, located in the Gaza province in Mozambique (Figure 1), lower Limpopo Sub-basin covering an area of 5,618 km2. The LRB is a transboundary watershed with an area of 412,938 km2, shared by four riparian countries: Botswana, Mozambique, South Africa, and Zimbabwe. The length of the Limpopo River in Mozambique is 562 km, discharging toward the Indian Ocean.
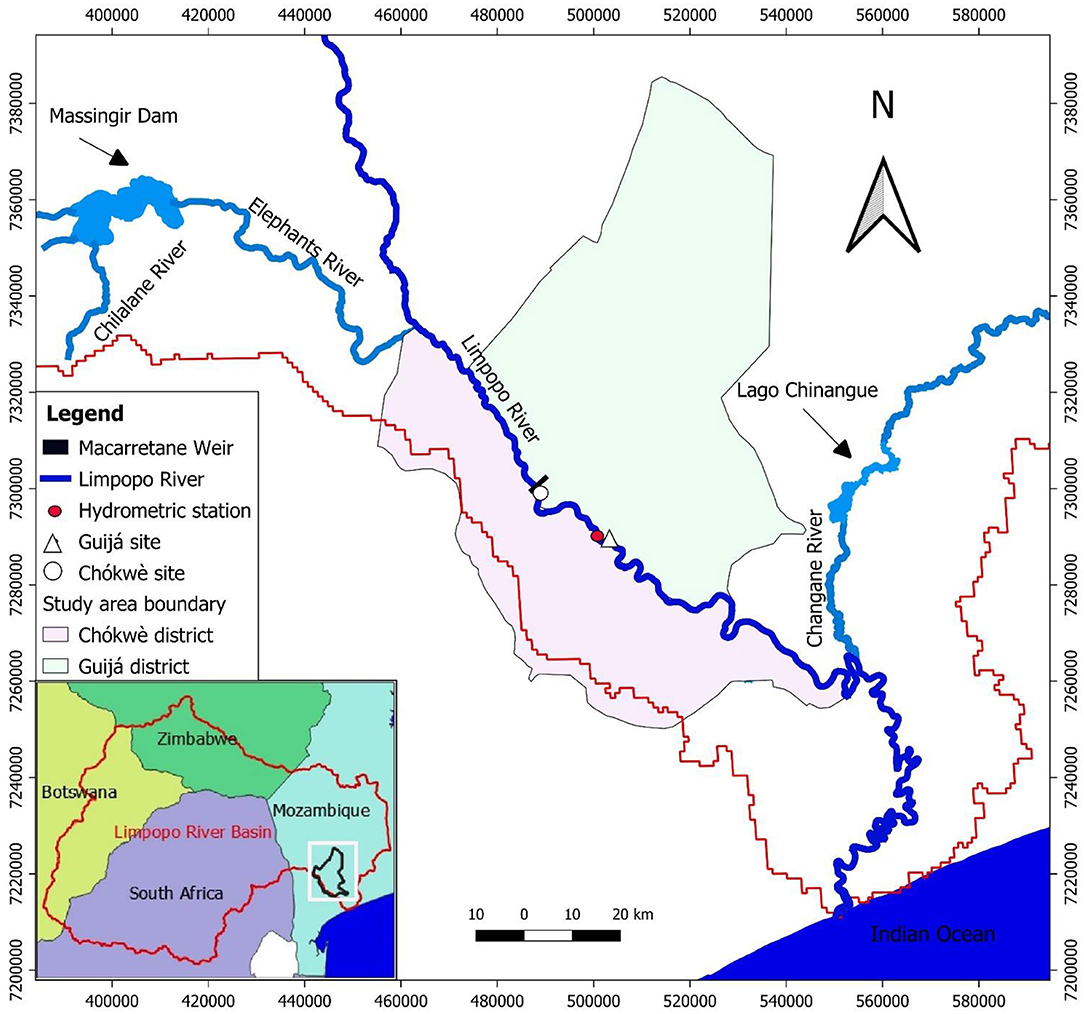
Figure 1. Location of the study sites within the Limpopo River and corresponding basin.
Two experimental sites were set up in the area, between the districts of Chókwè and Guijá, approximately 25 km apart, and 150 km away from the river mouth at Xai-Xai (Figure 1). The selection of the sites was made following a survey along the river, and strongly relied on the presence of potential users of sand river water, in addition to representativeness and accessibility. The climate of the study area is described as dry savanna type according to the classification of Köppen, with annual rainfall between 400 and 500 mm/a, potential evapotranspiration between 1,600 and 2,600 mm/a, and temperature between 23 and 26°C (Ferro and Bouman, 1987). In general, rainfall events occur in a short period of time through thunderstorms between October/November and March/April (Ferro and Bouman, 1987; LBPTC, 2010).
The river channel at both locations is up to 500 m wide, and there are significant elevation differences (up to 8 m) within the channel. At the Chókwè site the elevation varies from 27 to 34 m, whereas at the Guijá site, further downstream, the elevation varies from 22 to 29 m. The highest elevations correspond to river sand dunes developed within the river channel, whereas the lowest values correspond to the perennial river.
The sand river of the lower Limpopo sub-basin is quite different from other sand river systems. Single or multiple channels characterize the study site and the channels are classified as meandered and braided patterns, respectively (Alabyan and Chalov, 1998). On the other hand, the occurrence of different compartments of water bodies along the river channel is an indication of the flood magnitude. Flood magnitude determines the change of the shape and the size of the river channel as well as the natural flow regime, including interactions of water sources (Bunn and Arthington, 2002; Naiman et al., 2008). Three tributaries join the Limpopo river in Mozambique: Nuaneadzi river, Changane river, and Elephants river. The Limpopo river discharge is managed at the Massingir Dam and Macarretane Weir, to ensure ecological river flow during the year and water management in the Chókwè Irrigation Scheme (Chilundo et al., 2008).
The geology of the study area (Figure 2) is dominated by quaternary alluvium deposits of heterogeneous size (poorly sorted sands, silts, and clays, with occasional gravels) underlying the Limpopo River (Ferro and Bouman, 1987; SADC GIP, 2010). At the immediate floodplain, the formation consists of more clayey sand with low permeability (SADC GIP, 2010). The geological formations encountered in the upstream area of the LRB are more diverse. These include intrusive and extrusive igneous rocks, and metamorphic rocks, which are a good source of rock for producing sands through (incomplete) weathering and erosion. The latter is further promoted by the semi-arid climate. The river bed deposits forming the sand river aquifers do not appear explicitly on the geological map; their properties and thicknesses will be described in more detail in the following sections.
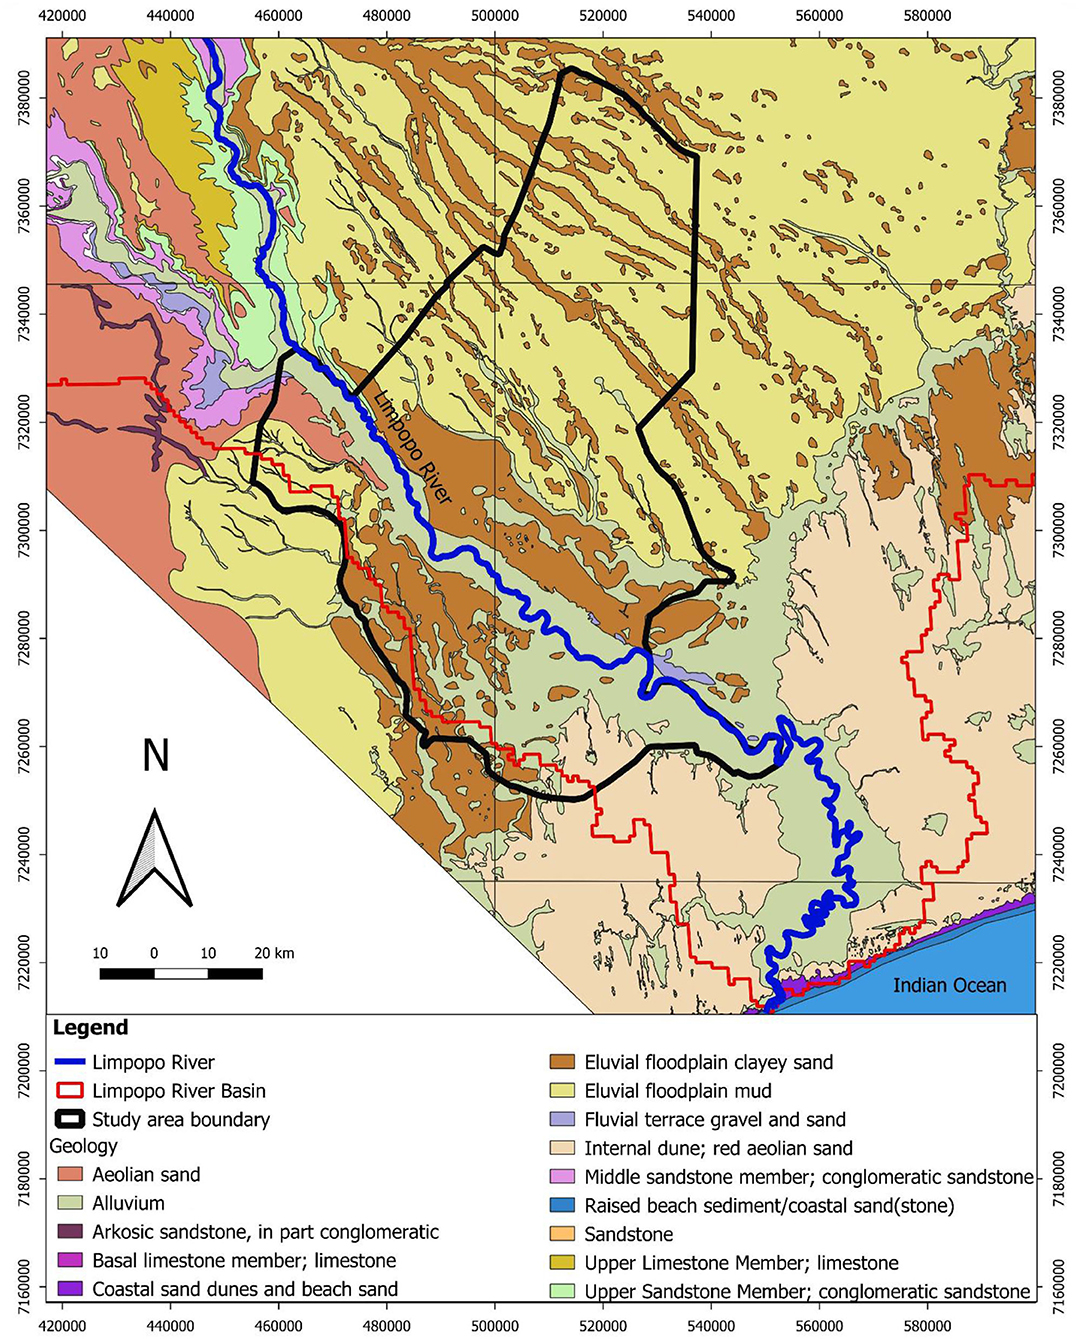
Figure 2. Geological map of the Limpopo River basin in Mozambique (provided by the National Directorate for Geology) showing the dominant Quaternary alluvium deposits underlying the Limpopo River.
The land cover of the LRB is characterized by forests with different ecosystems: woodland, bushland, savannah as well as open grassland (Figure 3). Due to its specific biophysical and agro-ecological environment, the land use in the area is mostly dominated by livestock, agriculture, and mining as the main socioeconomic activities (FAO, 2004). The most common land use classes in the study site are scrub/shrubland (44%), followed by trees (39%) and crops (12%), covering an area of 2,934, 2,589, and 789 km2, respectively (Figure 3).
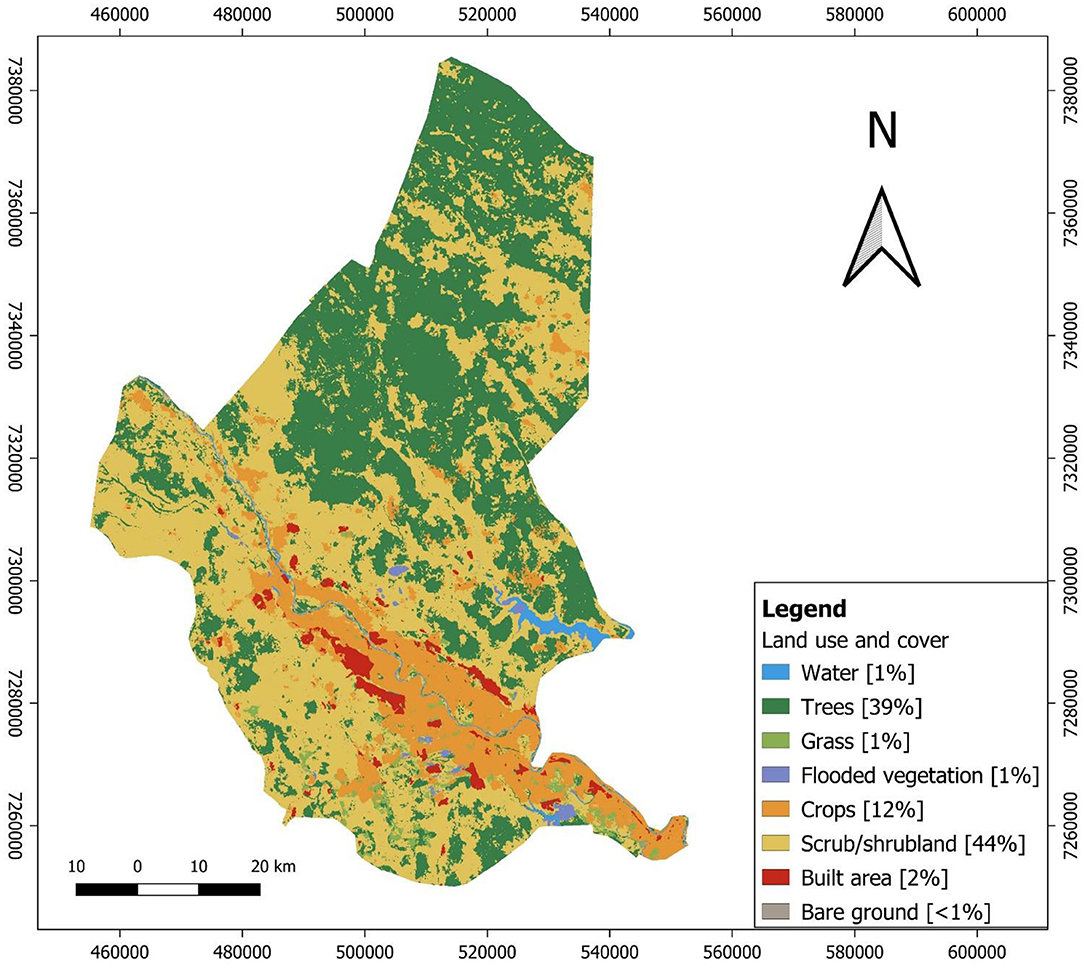
Figure 3. Description of land cover and use with the respective class definitions. The map is derived from ESA Sentinel-2 satellite imagery at 10 m resolution published on July 2021. It is composed of land use and land cover predictions for 10 classes throughout the year, representing the snapshots of 2020.
Unlike in Botswana and Zimbabwe, where the sand rivers are used for water supply and agricultural purposes (Hussey, 2003; LBPTC, 2010), such usages are not yet developed in Mozambique (FAO, 2004), despite the large thickness of the sediment deposits, which can exceed 20 m (Ferro and Bouman, 1987).
Materials and Methods
Fieldwork preparation and selection of sites started from the end of October to mid-December 2017, at the end of the dry period (the official rain season started during the fieldwork, but hardly any rainfall was recorded, and river levels did not change), while field investigations continued throughout the years up to 2021. Table 1 summarizes the techniques and methods used to determine the parameters and dimensions of the sand river aquifer, as well as the physicochemical properties of the water and the recharge rates and frequency.
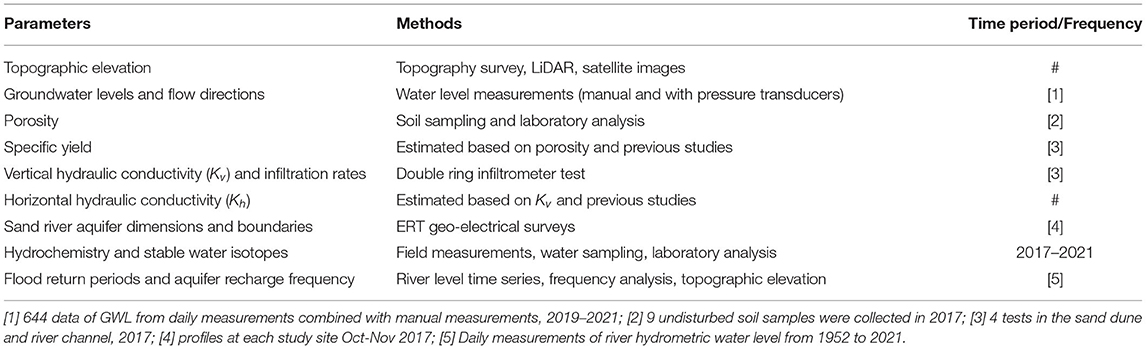
Table 1. Employed methods for estimation of sand river parameters, hydrochemistry and recharge rates, and frequency.
For determining the topographic elevation, this research benefited from the availability of a LiDAR topographic survey, which covered the Limpopo River and its flood plains in Mozambique. A conventional topographic survey, with a total station, was carried out in the field to complement and validate the LiDAR elevation data. Information on sediment and groundwater levels was obtained from wells and piezometers installed within the scope of the larger DUPC2 A4Labs project and later combined with CES-RURAL project. A total of six large boreholes were drilled, three per site, with an average depth of 10 m. Furthermore, several manual auger holes were drilled and two of them were equipped to serve as shallow observation piezometers, at the Chókwè site (Figure 4). A pressure transducer was installed in one of the wells at the Guijá site and manual measurements of groundwater depth were performed with monthly frequency.
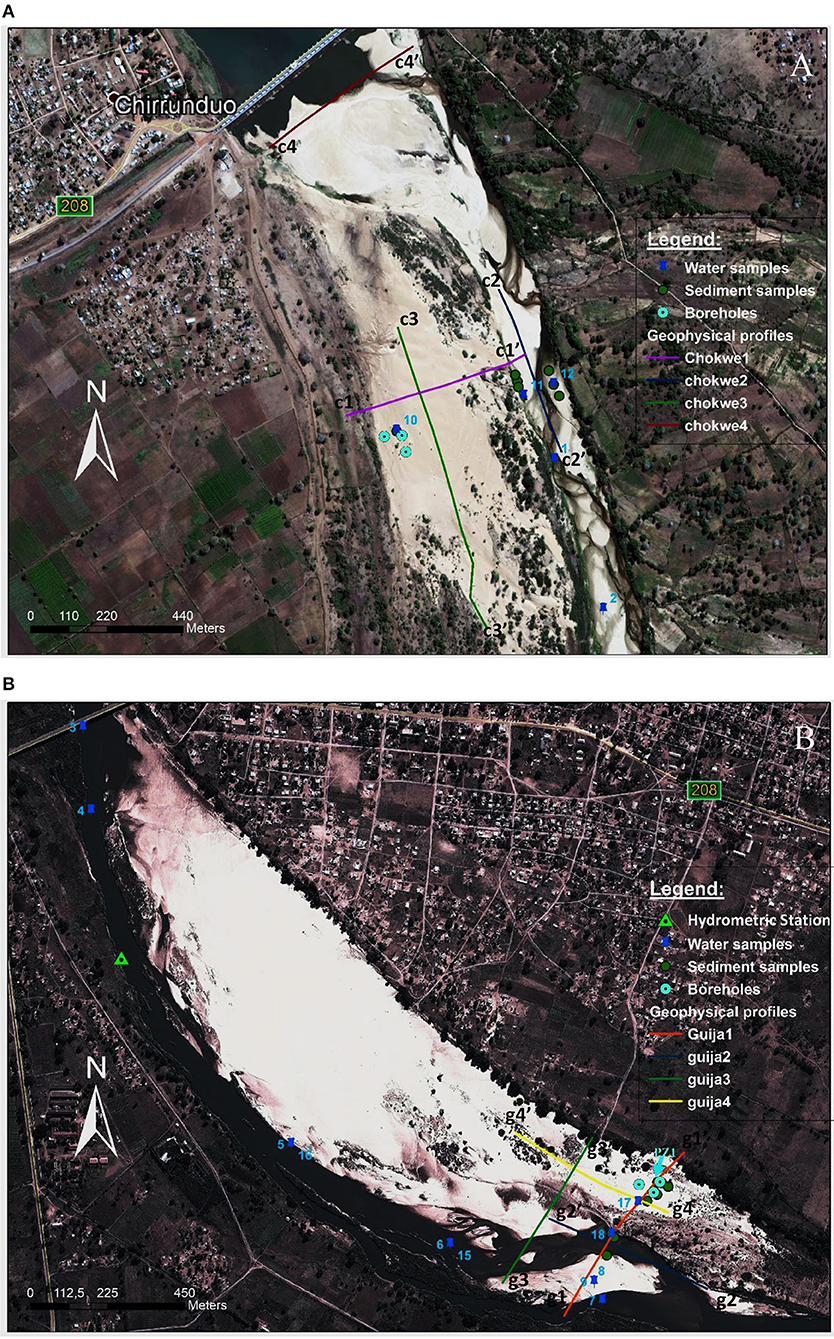
Figure 4. Locations of field investigations in Chókwè (A) and Guijá (B) sites. It includes the geophysical profiles, water samples, sediment samples, boreholes and the location of the hydrometric station. Base map derived from satellite imagery Google Earth pro 2017, Map data: Google, DigitalGlobe 2017.
Daily water levels of the Limpopo River measured at the hydrometric station of Macarretane were provided by the ARA-Sul Water Authority, for the period 1952–2021. Frequency analysis was performed using the Gumbel distribution function to fit the observed annual maximum water levels, with 90% confidence intervals, and calculate a return period for specific water levels, in order to assess the flooding and recharge frequency and return period.
For sediment porosity assessment, nine undisturbed samples were collected at each site, half a meter below the surface, in the dry sand river sediment and the permanent river channel. Volumetric methods were used in the laboratory at Instituto Superior Politécnico de Gaza (ISPG) to estimate the porosity. These methods consist of subsequently saturating, weighing, drying, and weighing again the soil to determine the volume of void space. Vertical hydraulic conductivities and coupled infiltration rates were estimated based on four double-ring infiltration tests, performed at each site, with two measurements in the higher dune area within the river valley and two near the permanent river channel.
Geophysical surveys, employing the electrical resistivity tomography (ERT) method, were conducted at both sites, to investigate the subsurface in terms of sediments, water content, and lateral boundaries. The method involves the insertion of multiple electrodes at equal separations (unit electrode spacings) along a survey line, after which an electrical current is injected between two selected electrodes and the resulting electrical potential difference is measured between two other selected electrodes. This is subsequently done for all possible combinations of current and potential electrodes, obeying the rules of the employed configuration. By taking the distances between the various electrodes into account, the ratio of the measured electrical potential to the injected electrical current is used to calculate an apparent resistivity for the subsurface at a position halfway between the current electrodes (Wenner/Schlumberger configuration) or between the current and potential electrodes (Dipole/Dipole), at a pseudo-depth which depends on the separation between the electrodes. Selecting electrodes at larger distances from one another to act as current electrodes allows larger depths to be investigated. Multiple measurements along the survey line using different electrode pairs and different electrode spacings produce a two-dimensional (2D) pseudosection of the apparent resistivities plotted at pseudo-depths. The 2D pseudosection may be converted to obtain a model of the subsurface resistivity distribution through an iterative mathematical process called inversion. More on the theory can be found in Loke (2000).
The equipment used for this study was the ABEM Terrameter-SAS 4000 system, employing 81 electrodes installed at a spacing of 5 m, and a set of four 100 m-long multi-core cables. For profiles longer than 400 m, the roll-along method was used to create overlap between neighboring cross-sections (Loke, 2000). The electrodes need to be watered to ensure good galvanic contact with the dry sand. Four ERT profiles were performed at each site: two across the river valley and two parallel to the river (see location in Figure 4). Of the latter, one profile was executed on the higher dune part of the river valley, and the other in the lower permanent river channel. The 2-D pseudosections were inverted using the RES2DINV software developed by Geotomo Software. Pore water electrical conductivity (EC) was measured in the observation wells to anticipate the range of bulk resistivities obtained by the ERT. Using Archie's law, the bulk (formation) resistivity of the rock can be expressed as a function of the EC (reciprocal of pore water resistivity) and sediment properties, namely cementation factor, tortuosity, and porosity. Observations on sediment type from borehole logs and auger hole records were also used to support the interpretation of the geophysical results.
Regarding hydrochemistry, field measurements of EC, temperature, pH, and alkalinity (HACH titration field kit) were done in the river and in groundwater. Samples were collected for major cation and anion analysis, in polyethylene bottles, filtered, acidified with for the cations in separate bottles and stored at low temperature. At the IHE Delft laboratory the cations were measured through inductively coupled plasma mass spectrometry (ICP-MS) and flame atomic absorption spectroscopy (FAAS). The former allowed determining the concentrations of Na+, K+, Mg2+, Fe2+, and Mn2+, and the latter the concentration of Ca2+. Ion chromatography (IC) was used for the analysis of the anions Cl−, , and . Samples for stable water isotopes were collected in special glass vials and also analyzed at the IHE Delft laboratory for deuterium (2H) and oxygen 18 (18O). Values are related to the Vienna Standard Mean Ocean Water (VSMOW). Given that we did not build our own local meteoric water line (LMWL), we used the one created for rainfall data from the nearest Mozambican station provided by the Global Network of Isotopes in Precipitation (GNIP), located in Gorongosa. As introduced in the previous section, to interpret the deuterium and oxygen 18 concentrations in water, one should use a LMWL as an indication of enrichment or depletion of isotopes concentration in water samples.
The physicochemical analysis and characterization of groundwater was based on major ions to understand the processes that influence the water quality and recharge/discharge mechanisms in the sand river system and in the river channel.
Results
Sand River Geometry and Characteristics
For each site, the results for three of the performed ERT profiles are shown in Figure 5. Overall the highest resistivities correspond to dry sand (red colors), followed by saturated sand with values ranging from 100 to 400 Ωm, depending on porosity and pore water resistivity. The measured pore water EC varies between 228 μS/cm (in the river valley sand dunes) and 671 μS/cm (in the permanent river channel), which when considering Archie's law with a formation factor of 6–7, indeed leads to bulk (formation) resistivities of the saturated sand within the indicated range. When comparing the longitudinal ERT profiles taken in the river valley sand dunes (Chókwè 3 and Guijá 4, Figure 5A) with those in the permanent river channels (Chókwè 2 and Guijá 2, Figure 5B) it can clearly be observed that the saturated sands have lower resistivity in the river channel (Figure 5). The main explanation for this fact is that the baseflow in the permanent river has higher EC which mixes with the groundwater below; an additional factor could be a slight increase in mineralization due to the location at the discharge area of the sand river groundwater system (see the section on hydrochemistry). In contrast, the sand dunes contain mostly flood recharge waters with low EC leading to higher resistivities.
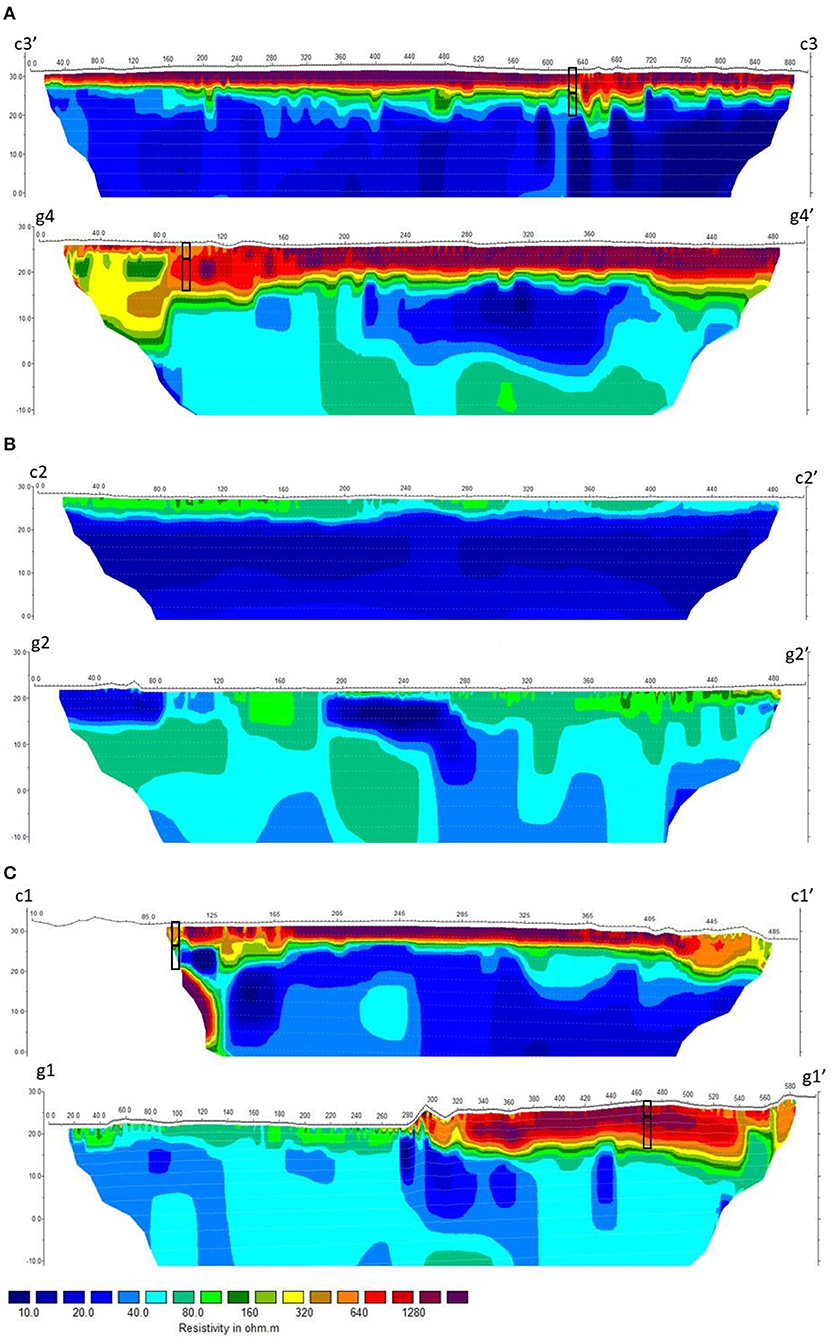
Figure 5. 2D ERT profiles combined with topography taken at Chókwè and Guijá sites (for the location see Figure 4); (A) longitudinal profile of the sand dunes; (B) longitudinal profile of the river valley; and (C) transverse profile. The boreholes presented in the cross-sections are 10 m deep and the level of the water table is provided as a black bar in the middle of the borehole.
The lowest values observed in the ERT profiles are in the order of 20–40 Ωm and correspond to the clay and silt deposits. Their thickness was seen to exceed 40 m in the ERT profiles, but at the Guijá site, the material appears to be somewhat coarser, including silts and fine sands. In the transverse profiles taken over the sand river in the SW-NE direction (Guijá1 and Chókwè1 in Figure 5C), the lateral variation of the sand thickness is clearly shown. The continuity of the sand below the clay is less clear, as the profiles did not enter far enough into the margins. The thicker occurrence of sands at certain locations is probably linked to deeper incisions and subsequent depositions. The sand thickness can exceed 10 m in the sand dunes, but is thinner in the permanent river channel, with a thickness of 1–5 m.
Borehole drilling and hand auger logs allowed validating the ERT models, confirming the thickness of the sand deposits as well as the depth of the water level at a few locations near the ERT profiles (see Figure 5). The clay deposits were encountered in two of the six drilled wells in the sand dunes (one at each site) at a depth of 10 m, whereas at the four other wells the clay layer was not reached. The average depth to the water table in the sand dune was 3.5 and 5 m at the Chókwè and Guijá sites, respectively, depending on the topography. At the river channel sides, groundwater was at or very near the surface.
Flood Frequency and Recharge Mechanisms
Table 2 presents the calculated frequency and return period, as well as the percentage of a flooded area in the river valley at the two study sites, for four specific river stage thresholds (RST):
• RST <2 m: The river water level is contained in the river channel, with <5% of the river valley being flooded.
• 2 m ≤ RST <4.4 m: An intermediate river level, which can flood up to 60% of the sand river surface.
• 4.4 m ≤ RST < 5.5 m: The river floods between 60 and 95% of the valley surface.
• RST ≥ 5.5 m, the river floods the entire sand river system at both sites.
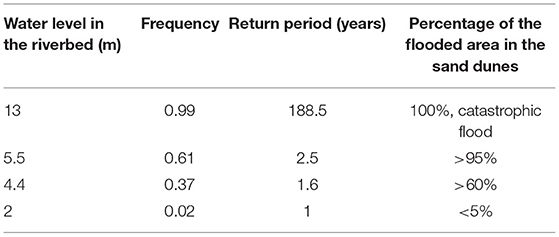
Table 2. Frequency analysis and percentage of the sand river's flooded areas for certain water levels.
Figure 6 shows the area of the river valley that is flooded with each of the RST. Results reveal that a river stage of 4.4 m covering more than 60% of the area occurs very frequently, almost in two out of every 3 years. The river stage is of course largely controlled by dam release, which in its turn depends on rainfall and its distribution in time. To give an example, the flood event of 2018 took place at the end of February, with a maximum recorded water level of 5 m that indeed submerged near to 95% of the sand river, for a period of time of less than a week. Despite this relatively short period, recharge of the system will have been very rapid, as revealed by the measured infiltration rates: in the dune area of Guijá site, the average rate was 116 m/d with a minimum value of 110 m/d and a maximum of 122 m/d; whereas at Chókwè site, the average rates of 96 m/d with a minimum value of 86 m/d and a maximum value of 106 m/d. Lower (though still high) values were found where the saturated zone was near the surface (near the permanent river channel), with average values of 23 and 31 m/d, respectively. Therefore, recharge occurs almost instantly upon flooding of the sand.
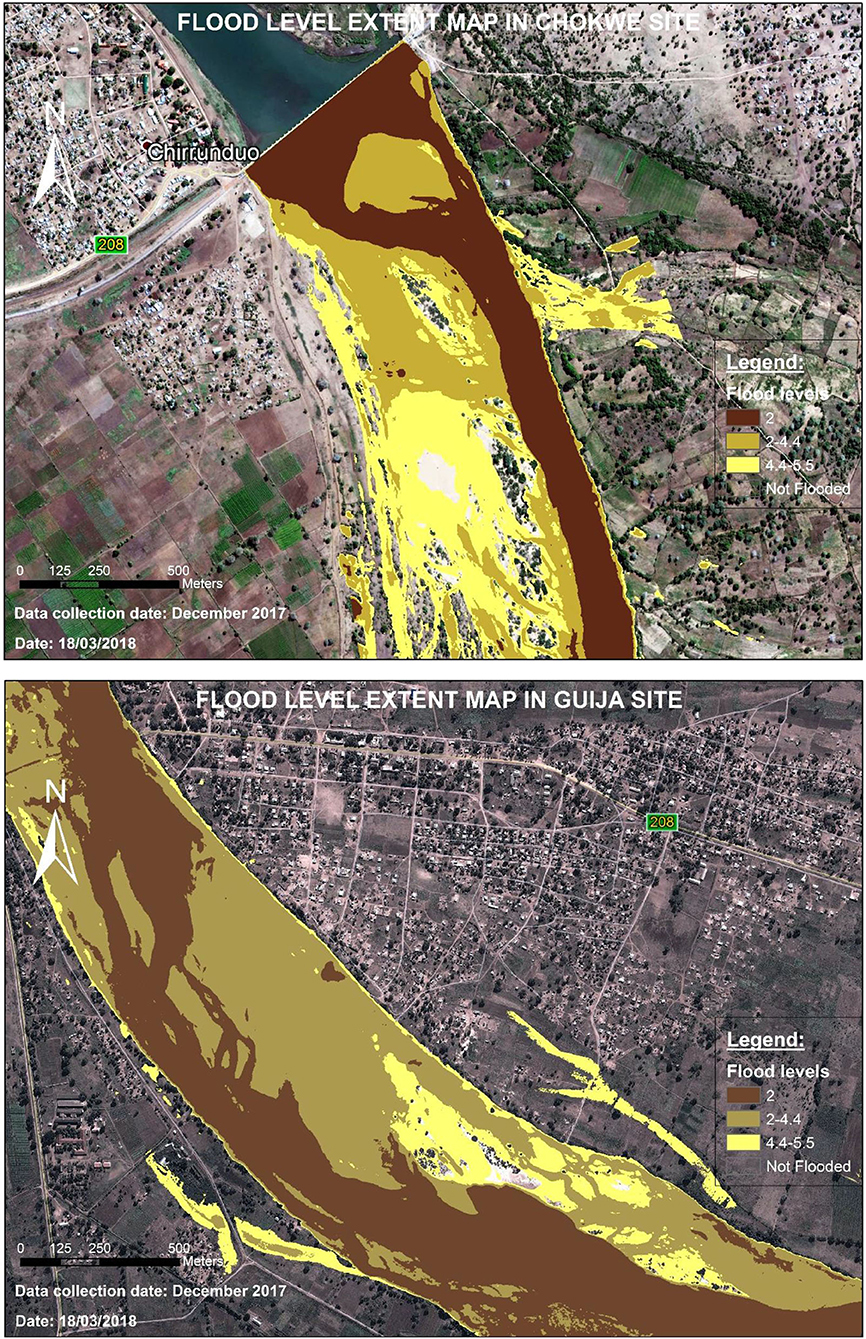
Figure 6. River stage thresholds and the respective area of the river valley that is flooded at the two study sites; the base map is derived from satellite imagery Google Earth pro 2017, Map data: Google, DigitalGlobe 2017.
The second form of recharge is revealed when looking at the response of groundwater to river flooding in an area that is not flooded. This can be seen in Figure 7, where overall we observe that the fluctuations of the groundwater level in the sand river aquifer (PZ1) closely follow those of the river. Notwithstanding, a delay of 1.5 days is observed between the peaks of the river water level and those of PZ1, which is caused by the distance between the river channel and the piezometer. As PZ1 is not flooded, the water needs to recharge the aquifer in the form of lateral flow from the flooded area to PZ1. Once again, the short delay and fast response time are indicative of the high transmissivity of the sand river aquifer.
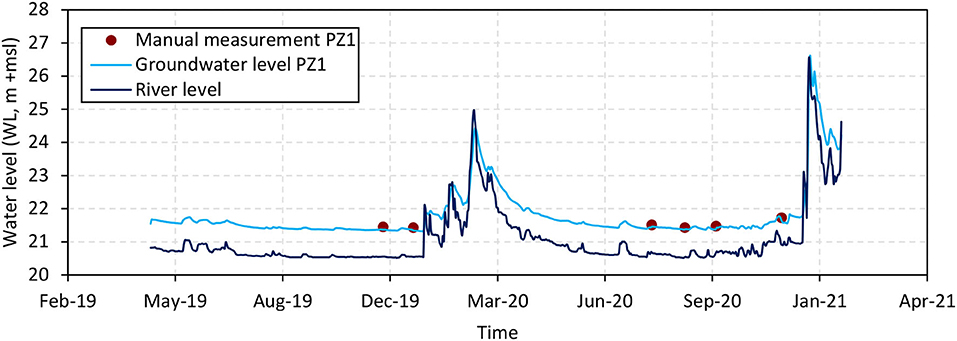
Figure 7. Average monthly groundwater hydrodynamic levels from monitoring well PZ1 in the Guijá site and the corresponding water levels in the Limpopo River for the period of March/2019–January/2021. Manual measurements were used to validate the recorded data from the pressure transducer.
Groundwater Discharge Mechanisms
Besides the interaction through recharge described in the previous section, groundwater discharges into the river throughout most of the dry season. Although the recession of the water table is very fast, revealing the high permeability of the aquifer, groundwater levels are higher than the river level throughout the dry season. The spatial distribution of groundwater levels in the dry season of 2017 is provided in Figure 8. Such interaction between the groundwater from the sand dunes and the river is therefore favored by (1) the level difference between the river channel and the sand dunes, (2) hydrogeological characteristics (hydraulic conductivity) and available storage of the system at each site. Water balance calculations from ongoing numerical modeling efforts show that average inflow from the aquifer in the dry season is in the order of 30–40 l/s per km stretch of sand river aquifer, which seems low when compared to the minimum dam release in the dry season (15 m3/s), but can add up to be quite significant over the extent of the sand river aquifer, longer than 100 km. These same calculations indicate that evapo(transpi)ration from the aquifer and riparian vegetation is the second-most important outflow.
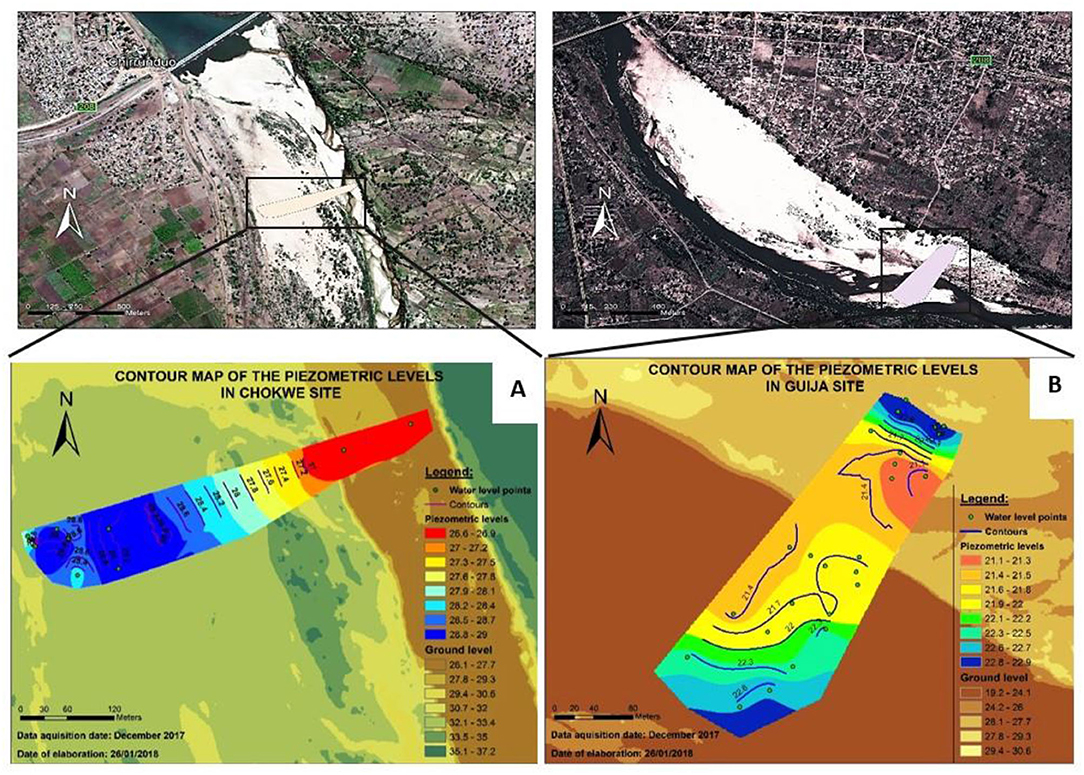
Figure 8. Groundwater levels at the two study sites during the dry season. (A) Groundwater in Chókwè and (B) groundwater in Guijá. Base map derived from satellite imagery Google Earth pro 2017, Map data: Google, DigitalGlobe 2017.
Hydrochemical and Isotope Characteristics
Statistical analysis of the water chemistry (Table 3) revealed that groundwater from the sand river aquifer is generally less mineralized in comparison with water samples from the river channel, with mean values of 353 and 534 μS/cm, respectively. Notwithstanding, the values for the sand river aquifer are also characterized by a large range, depending on where the samples were collected within the flow system, further revealed by the Stiff diagrams in Figure 9 and Piper diagram (Supplementary Figure 1), in the Supplementary Material. The degree of mineralization is lowest in the dune areas of the river valley and increases toward the perennial river, which was also verified with the geophysical surveys. For surface water, the low EC range is explained by the fact that sampling occurred in the dry season only; lower EC values (of 150–200 μS/cm) are measured in the flood season. The Stiff diagrams further reveal that groundwater is mostly of a Ca-HCO3 type, whereas surface waters are much more mixed water types, with higher concentrations of the other major ions (see also Table 3). This reveals the different nature of the water released from the dam, i.e., a mix of baseflow from upstream geological formations and evapoconcentrated surface water, as opposed to the local sand aquifer water originating from rapidly infiltrated runoff water of low mineralization and some dissolution of reactive minerals along the (relatively short) flow path. Mixing between these water types may be revealed by the groundwater samples taken near the perennial river.
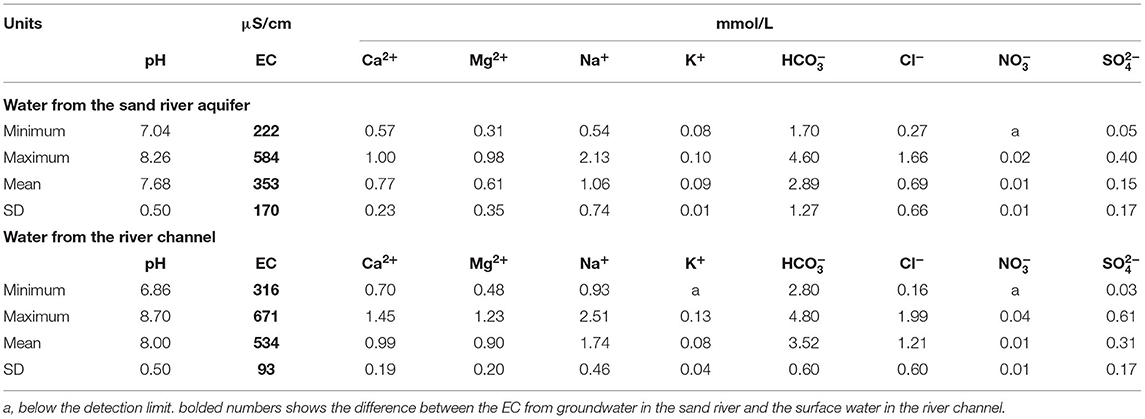
Table 3. Descriptive statistical analysis of the chemical parameters of the sand river aquifer and the river water.
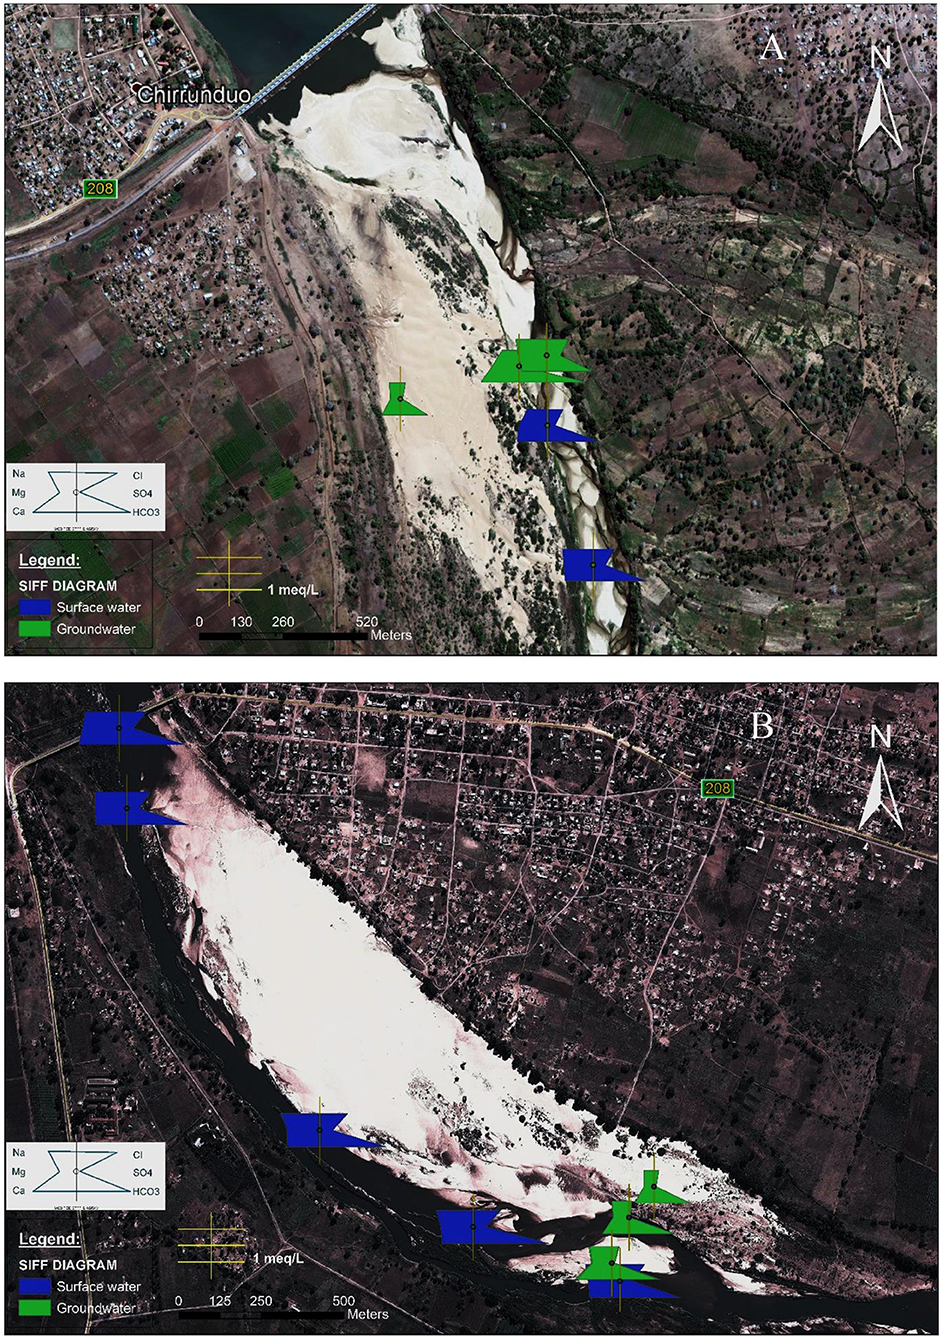
Figure 9. Stiff diagrams of groundwater and surface water samples and their location in Chókwè (A) and Guijá (B). Base map derived from satellite imagery Google Earth pro 2017, Map data: Google, DigitalGlobe 2017.
From Figures 9, 10, it can be seen that total dissolved concentrations in the river tend to increase from upstream (Chókwè) to downstream (Guijá), which could be due to the dissolution of minerals, lateral subsurface inflow and/or evapoconcentration. The plot of the saturation index of calcite vs. HCO3 (Figure 11) reveals subsaturation in the dune areas and supersaturation due to evapoconcentration and CO2 degassing in the perennial river water. Calcite-saturated groundwater samples seem to indicate reactive mineral dissolution, either calcite or silicate, although the effect of mixing with surface water cannot be excluded. The relationship between Na+ vs. in the Supplementary Figure 2, shows that Na+ and is originated from weathering of silicate or carbonate minerals, respectively.
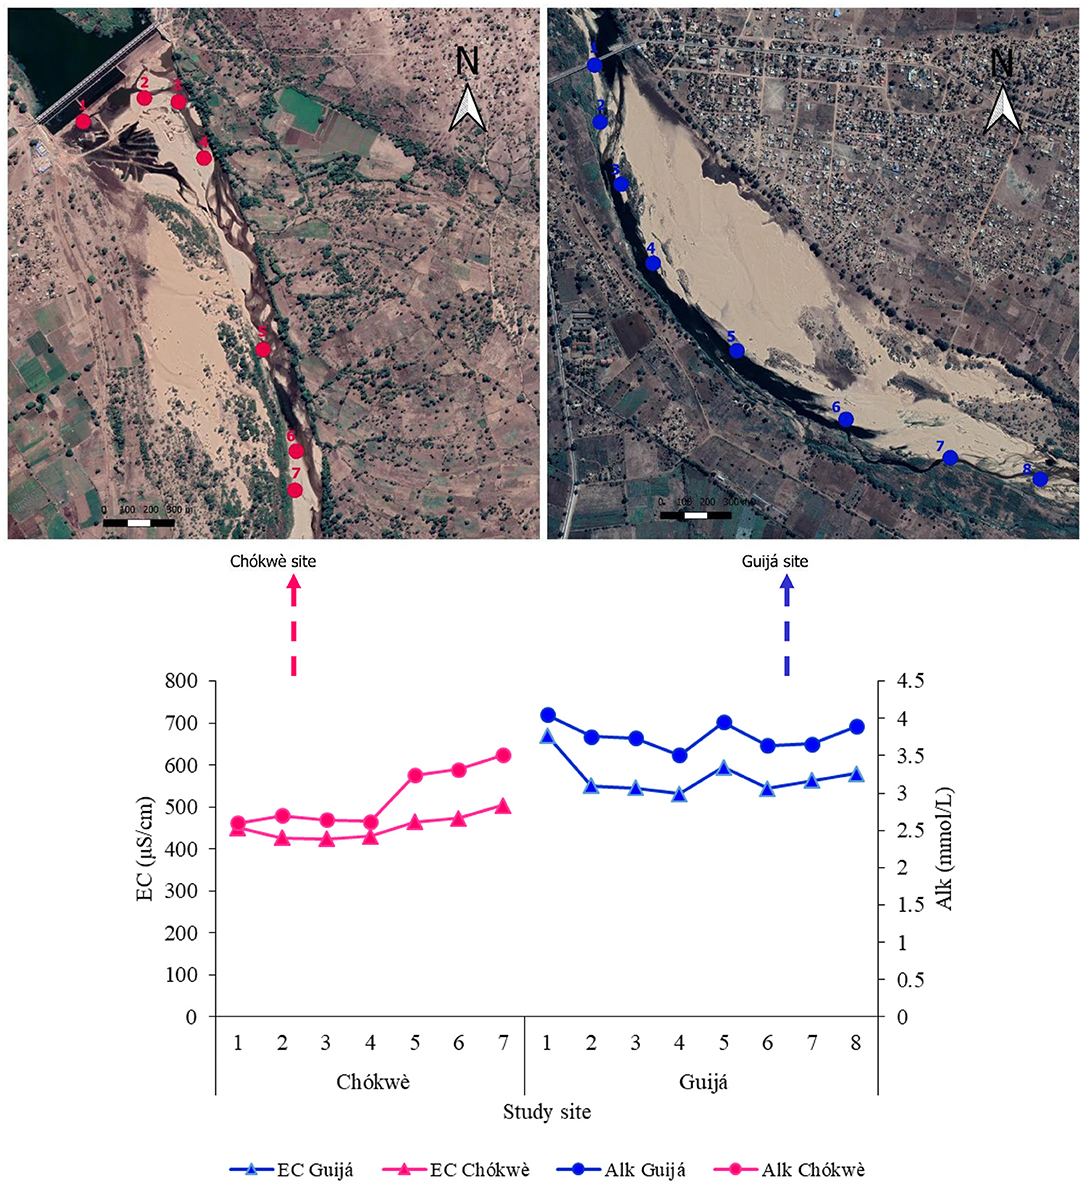
Figure 10. Variation of electrical conductivity and alkalinity from Chókwè to Guijá site in the river and the respective location in the base map from satellite imagery Google Earth pro.
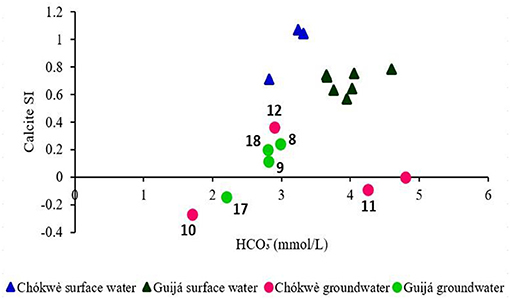
Figure 11. Scatter plot of Calcite saturation index vs. bicarbonate (labels presented for groundwater samples, for location see Figure 4).
Figure 12 presents a scatterplot of oxygen 18 vs. deuterium along with the LMWL. Surface water samples are the most enriched and plot below the LMWL, confirming evaporation as a major process, enhanced by the surface water dam located upstream, where this water is temporarily stored. Groundwater samples from the sand dunes are lighter, and plot above and near the LMWL, which indicate that those samples have isotope concentrations similar to rain and runoff water. Groundwater samples near the river channel plot below the LMWL and either between the surface water (river water) samples and groundwater samples from the dunes or near the river samples. This shows that in the discharge zone shallow groundwater is also prone to evaporation, and to a certain extent may reveal mixing with surface water. It proves difficult to separate these two phenomena.
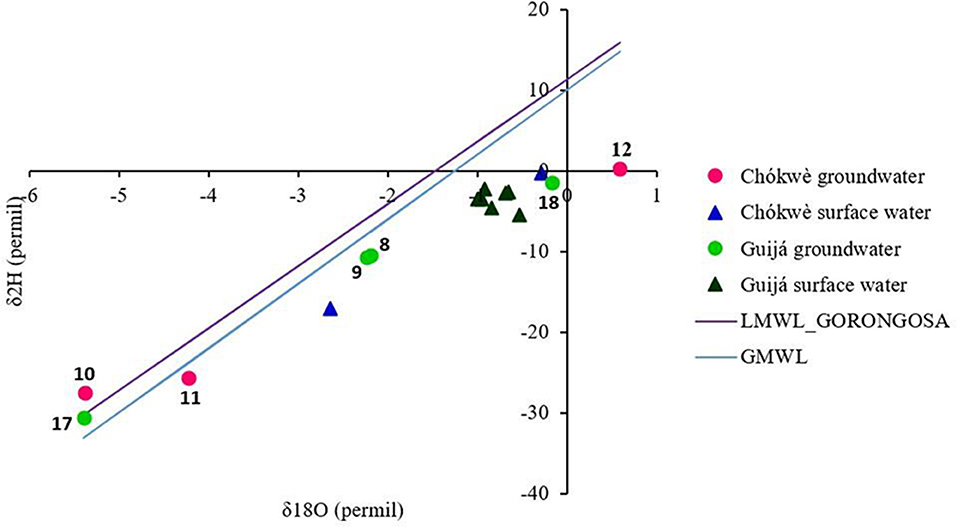
Figure 12. Plot of δ2H vs. δ18O for the surface and groundwater samples at the two study sites. The data source of LMWL of Gorongosa is the Global Network of Isotopes in Precipitation (GNIP) provided by the International Atomic Energy Agency (IAEA).
Discussion
Groundwater-Surface Water-Atmosphere Interactions
To guide the discussion two conceptual models were derived from the results and are shown for (i) the dry season and (ii) the flooding season, in Figure 13, allowing a more comprehensive understanding of groundwater-surface water interactions and their seasonal variations in the sand river system. The time-dependent balance of the inflow and outflow components determine the rapid variations in groundwater storage. The analysis of the seasonal variations of groundwater and river water levels in Figure 7, shows that these follow each other closely. Both show a rapid rise in the flood season, with river levels occasionally surpassing groundwater levels, followed by fast and strong recessions. Notwithstanding, the river level does drop below that of groundwater in the dunes and throughout the dry season is approximately 1 m lower.
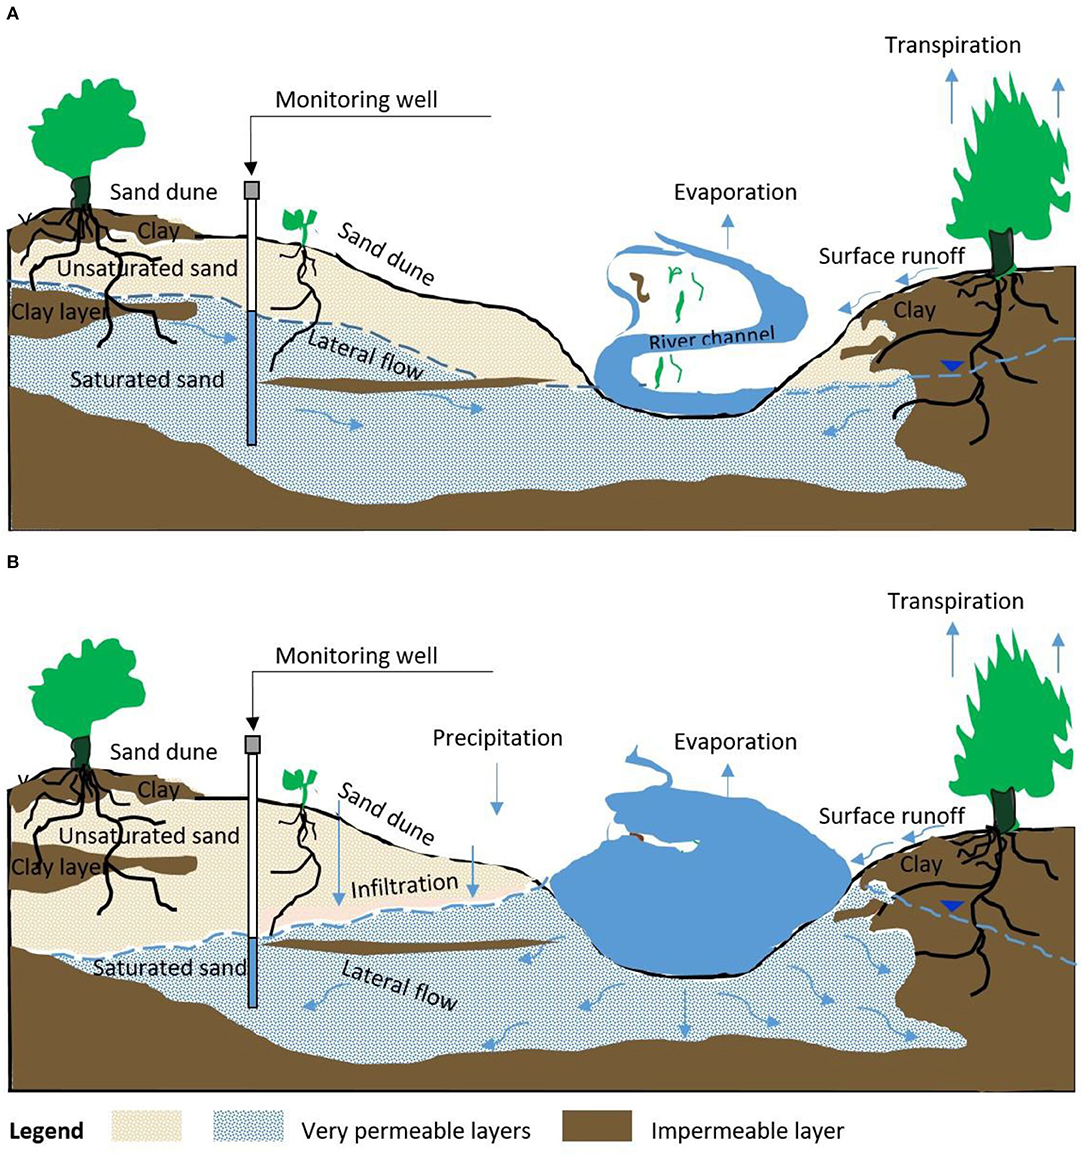
Figure 13. 2D schematic cross section representing the conceptual model of the sand river aquifer system and the respective hydrological processes. (A) Dry season, (B) flooding season.
Dry Season
In the dry season, the Limpopo river is gaining through release from groundwater storage via lateral flow (Figure 8, cf. Figure 13), which becomes increasingly significant downstream (as compared to the perennial dam release), revealed by the increasing alkalinity and EC (Figure 10). Groundwater flow and baseflow release paths are strongly controlled here by the lithological distribution of sediments in the subsurface, as the sand river system is bordered laterally and at the bottom by clay and silt sediments (Figure 13, cf. Figure 5). Similar observations were made by Beliaev and Krichevetsts (2018), Xiao et al. (2018), and Gallo et al. (2020). This largely reduces the potential of lateral subsurface inflow from the river margins, characterized by highly mineralized waters (Ferro and Bouman, 1987; Saveca, 2016).
Due to the meandering nature of the river, the thickness of sand deposits is smallest between two bends, which forces groundwater to flow upwards along the boundary between sands and impermeable clays (see Supplementary Figure 3 and geophysical cross-section in Figure 5A where the sand thickness is shown to reduce toward the southeast) and in this way feeds more permanent reaches inside the river. Xiao et al. (2018) and Xing et al. (2018), also show that clay layers influence the characteristics of groundwater, confining the groundwater flow, and it may thus contribute significantly to perennial flow. What this further seems to imply is that the sand river aquifer is built up of compartments of larger thickness that may be poorly connected and hence affect the way the sand river responds to groundwater abstractions. A parallel can be drawn to the compartments that occur in sand rivers and hard rock environments, due to the presence of sills (Hussey, 2007; Moulahoum, 2018).
The recession of the water level is initially very fast, down to half of the original rise within days (Figure 7, but in the dry season can extend up to 100 days, as also observed by Masvopo et al. (2008) and Moulahoum (2018). In the particular case of the Limpopo river, and contrary to other sand river sites (Beliaev and Krichevetsts, 2018; Moulahoum, 2018), recession rates throughout the dry season are controlled by the perennial nature of the river and the absence of pumping. Temporal groundwater level dynamics are highly correlated to those of surface water and hence can be explained by a combination of three factors: (i) high hydraulic conductivity of the aquifer; (ii) perennial flow released from the dam causing a clear boundary condition; and (iii) absence of groundwater abstractions. Groundwater abstractions would cause a further lowering of the water level throughout the dry season and rapid recharge in the next rain/flood season. The absence of regulated flow would most likely cause the river to dry up in certain reaches and have disconnected permanent reaches where groundwater is forced upwards along the clay/sand interface. In the present case of permanent regulated flow, if abstractions were to commence, groundwater development would not merely be limited by the sand river storage capacity but would be able to capture water from the regulated permanent river reach (as confirmed in ongoing modeling work). This behavior is therefore quite unique for the Limpopo sand river system.
Direct evaporation from the upper 60–90 cm of the soil/sediment and transpiration by riparian vegetation account for significant discharge from the sand river aquifer system in the dry season, confirming results obtained elsewhere (Cataldo et al., 2010; Arvidsson et al., 2011; Moulahoum, 2018; Walker et al., 2018; Wekesa et al., 2020). The isotopic signatures of surface water (although masked by evaporation from the Macarretane dam) and adjacent groundwater (Figure 12), as compared to the higher dune recharge area, also show the importance of ET, further enhanced by the upward flow of groundwater along the clay/sand interface. The effect of evaporation on groundwater-surface water was also acknowledged by Lyu et al. (2019) as the main mechanism controlling groundwater hydrochemistry in an arid environment.
Rain Season
Water level rise during the flood season is extremely fast but temporary, as already noticed by Hussey (2007) in research conducted in a sand river in Zimbabwe. Recharge occurs through quick infiltration from flood waters (e.g., Cataldo et al., 2010; Wekesa et al., 2020) into very permeable sands, which are directly linked to the natural discharge of the sand river aquifer system to sustain the groundwater-surface water interaction after the rain season (e.g., Cai et al., 2020). Floods occur almost every year although at different levels (Table 2; Figure 6) and in the current case study strongly controlled by dam release. Shallow dune water chemistry reveals a Ca-HCO3 (subsaturated) water type of low mineralization (Figure 9) with no signs of evaporation (Figure 12), a consequence of quick flood water infiltration (also observed by e.g., Nur et al., 2012). Two different groundwater recharge mechanisms were identified in the study site: (1) vertical flow through infiltration—when/where the river stage rises so far that it floods the entire valley (Figure 6); this is the main recharge mechanism observed in other studies (Arvidsson et al., 2011; Walker et al., 2018; Wekesa et al., 2020); (2) lateral flow—when/where the river stage rise only floods part of the valley; but due to high hydraulic conductivity the recharge quickly spreads laterally; this quite specific form of recharge mechanism is characteristic for very wide sand river systems with strongly varying topography inside the river valley. Groundwater recharge from direct rainfall is less significant, given the small surface area of the sand river and the low recharge potential of the clayey river banks. Similar conclusions were reached by Hussey (2007) in Zimbabwe, Walker et al. (2018) in South Africa, and Gonzalez-Carballo (2018) in Ethiopia. The isotopic similarity between rainfall and recharge found in the dune area of the river valley, which could be interpreted as rainfall-derived recharge, is here believed to be directly linked to rainfall-driven runoff recharging the sand river aquifer.
Limpopo Sand River Storage and Abstraction Potential
Three aspects favor a high storage and abstraction potential of the Limpopo sand river aquifer. The first relates to sediment thickness: results from the geoelectrical surveys and borehole logs reveal a thickness of 2–5 m in the river channel and 10–15 m in the elevated areas inside the Limpopo river valley (Abi, 2018). Larger thicknesses could reveal the presence of paleochannels, as found at other sites with similar resistivity signals (e.g., Torrese and Rainone, 2013). Such channels are also expected to occur away from the main channel, in particular at the inner bends of migrating meanders. Overall the width and thickness of the Limpopo sand river system are among the largest found in the literature, as shown in Table 4, which is largely related to the downstream location of the study sites within the LRB. At the same time, the hydraulic properties are similar to those found elsewhere, related to the occurrence of coarse sediments (e.g., Levick et al., 2008), with high hydraulic conductivity, porosity, and specific yield, depicting the second aspect favoring high storage and abstraction potential and resulting in promising figures toward developing the sand river for water supply. Coarsely assuming a remaining average saturated thickness of 5 m at the end of the dry period, with a 400 m wide riverbed and a specific yield of 0.2, the system would be able to supply approximately 400,000 m3 per km of river stretch, equivalent to 40 ha of irrigated land. Thirdly, recharge through (partial) flooding of the valley bottom is seen to occur with an almost annual frequency, meaning that storage depletion in the dry season could be allowed, as replenishment would be guaranteed in the subsequent rain/flood season. Notwithstanding, many aspects need to be considered when deciding to advance with groundwater abstractions.
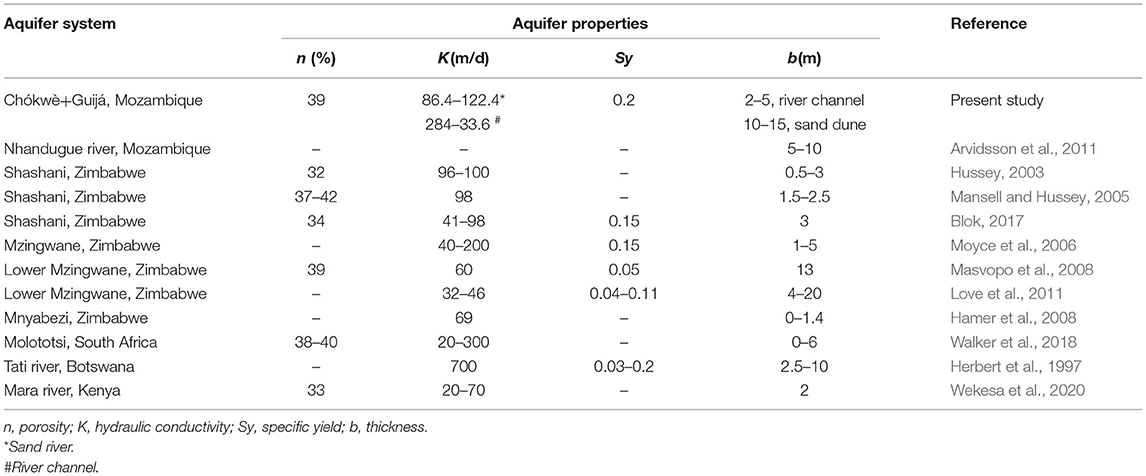
Table 4. Physical characteristics of different sand rivers aquifer systems.
One aspect is that of climate change that could cause the number of dry years to increase, resulting in a deficit in terms of recharge in certain years. Second, the impact on other users of the sand river needs to be carefully assessed. The sand river hydrology is directly linked to the aquatic biodiversity (Bunn and Arthington, 2002) and (permanent) ecological flow in the ephemeral river channel to sustain the equilibrium of the sand river ecosystems dependents in the (semi) arid regions. Riverine species are hosted in the biophysical environment of the sand river in its different compartments (e.g., Wekesa et al., 2020). Over-abstraction could affect groundwater-dependent ecosystems in the sand river system through (i) a dropping water table in the river banks, possibly affecting the riparian vegetation and (ii) reduction of ecological flow. Therefore, management practices should be established to ensure sustainable use of the sand river system. Ongoing modeling studies confirm that the impact of over-abstraction on the water table in the margins can be minimized by implementing lower pumping rates in a more distributed manner over the system. Such low pumping rates could benefit individual farmers and households employing low-yield pumping practices, for instance through the use of solar pumps (Acacia Water, 2019). In addition, the reduction of ecological flow could be partly compensated by a higher release from the upstream surface water dams, whose storage would then be replenished again in the following flood season (Acacia Water, 2019). Notwithstanding, further studies are needed to assess the impact of pumping on downstream discharge rate.
Despite the current suitability of groundwater for agriculture and drinking, revealed from the chemical results, the sand river system is vulnerable to contamination of surface runoff and river water by human activities. Chilundo et al. (2008) noted that the surface water from the Changane sub-catchment and Massingir reservoir is polluted by heavy metals (Cd, Cu, Fe, Hg, Pb, and Zn) due to the occurrence of upstream mining activities. These pollutants can be released into the sand river aquifer and cause contamination. Therefore, the occurrence of heavy metals in the sand river groundwater needs to be investigated and monitored to ensure safe use of groundwater from the sand river system, in particular, if used for domestic purposes.
Sand mining is another significant anthropogenic issue with physicochemical and ecological impact on the sand river system. The demand for sand for construction works is increasing in the study area and the ecosystem response is complex, as it is linked to its hydrological characteristics (Koehnken et al., 2020). Moreover, as reported by Jia et al. (2007), notable changes in sand mining are mostly visible in a changing morphology (longitudinal gradient) and the lowering of the water table, which can affect the storage potential of the sand river system if no action is taken.
Conclusions
This paper highlights the first results of a detailed sand river study carried out in the lower Limpopo in Mozambique. The physicochemical description of the sand river system is still relatively limited due to the lack of information and periods of the fieldwork, as well as the spatial coverage of the whole system. Therefore, further studies are ongoing, with the help of more frequent isotopes/hydrochemical sampling, additional geophysical surveys, water level recording, and numerical models, to address the flow system, recharge and discharge mechanisms on the local scale (connection with river banks, compartmentalization of sand river sectors within the meandering system) and the maximum storage capacity and abstraction of the sand river concerning recharge (temporal distribution) and dependent ecosystems.
The present study provides an assessment of groundwater hydrodynamics and hydrological processes in the Limpopo sand river system, to understand its recharge mechanisms, characteristics of groundwater flow and storage potential. From this study, it was clearly demonstrated that flood events are the main hydrological driving force of groundwater recharge in the sand river. The recharge is very quick as the aquifer is dominated by unconsolidated sediments (sand) with high hydraulic conductivity. Both vertical flow (infiltration) and lateral flow of floodwater were identified as important recharge mechanisms. Important groundwater-surface water-atmosphere interactions were detected through the use of hydrochemical, isotopic and piezometric tools, revealing lateral groundwater flow and evapotranspiration as important discharge mechanisms in the dry season. These interactions are influenced by the channel characteristics and the (sub)surface distribution of sediments, resulting in thicker (meander-dominated) sand compartments which are (most probably poorly) connected by the thinner (straight) reaches where clays and silts dominate. Slightly more mineralized (ground)water occurs in the river channel than in the dune area, as a result of mixing, dissolution of minerals, and evapoconcentration, which together with CO2 degassing determine the hydrochemistry of the river along the flow system. The assessed dimension, hydraulic properties, and recharge/flood frequency of the Limpopo sand river system result in a high potential for groundwater abstraction that could represent an important alternative resource for socioeconomic development. Notwithstanding, future abstraction schemes need to be carefully planned and developed to avoid disruption of ecosystems and access to water by other users downstream.
Data Availability Statement
The original contributions presented in the study are included in the article/Supplementary Material, further inquiries can be directed to the corresponding author/s.
Author Contributions
PS and AA: data curation, conceptualization, methodology, design, implementation of the research formal analysis, investigation, and writing. TS: supervision, conceptualization, methodology, writing, design, and implementation of the research. EL and FF: writing review, editing, and lab analysis. All authors contributed to the final manuscript.
Funding
This study was supported by the DUPC 2 collaborative DUPC2 programme between IHE Delft and the Dutch Ministry of Foreign Affairs under the Arid African Alluvial Aquifer (A4Labs) project with collaboration from an ongoing initiative, community empowerment through sustainable resource use and agricultural value-chain development in the Limpopo Basin (CES-RURAL) project.
Conflict of Interest
The authors declare that the research was conducted in the absence of any commercial or financial relationships that could be construed as a potential conflict of interest.
Publisher's Note
All claims expressed in this article are solely those of the authors and do not necessarily represent those of their affiliated organizations, or those of the publisher, the editors and the reviewers. Any product that may be evaluated in this article, or claim that may be made by its manufacturer, is not guaranteed or endorsed by the publisher.
Acknowledgments
The authors acknowledge IHE Delft and the Institute for Groundwater Studies at the University of the Free State for scientific support and physicochemical analyses of water samples, as well as ARA-Sul for supporting the field and sharing their knowledge, and staff and students from Instituto Superior Politécnico de Gaza for participation in fieldwork campaigns.
Supplementary Material
The Supplementary Material for this article can be found online at: https://www.frontiersin.org/articles/10.3389/frwa.2021.731642/full#supplementary-material
References
Abi, A. (2018). Assessing the Groundwater Dynamics, Recharge and Storage Potential in the Limpopo River Sand Deposits. UNESCO-IHE Institute for Water Education.
Alabyan, A. M., and Chalov, R. S. (1998). Types of river channel patterns and their natural controls. Earth Surf. Process. Landforms 23, 467–474. doi: 10.1002/(SICI)1096-9837(199805)23:5<467::AID-ESP861>3.0.CO;2-T
Arvidsson, K., Stenberg, L., Chirindja, F., Owen, R., and Dahlin, T. (2011). A hydrogeological study of the Nhandugue River, Mozambique - a major groundwater recharge zone. Phys. Chem. Earth 36, 789–797. doi: 10.1016/j.pce.2011.07.036
Ayers, R. S., and Westcot, D. W. (1994). Water Quality for Agriculture. FAO Irrigation and Drainage Paper. Rome: FAO.
Beliaev, A., and Krichevetsts, G. (2018). Qualitative effects of hydraulic conductivity distribution on groundwater flow in heterogeneous soils. Fluids 12, 102. doi: 10.3390/fluids3040102
Blok, T. (2017). Groundwater Storage in Sand Rivers: A Case Study od Shashani, Zimbabwe. Acacia Water, Netherlands. p. 39.
Bunn, S. E., and Arthington, A. H. (2002). Basic principles and ecological consequences of altered flow regimes for aquatic biodiversity. Environ. Manage. 30, 492–507. doi: 10.1007/s00267-002-2737-0
Cai, Z., Wanga, W., Zhao, M., Ma, Z., Lu, C., and Li, Y. (2020). Interaction between surface water and groundwater in Yinchuan Plain. MDPI Water J. 12, 2635. doi: 10.3390/w12092635
Cataldo, J. C., Behr, C., and Montalto, F. A. (2010). Prediction of transmission losses in ephemeral streams, Wester USA. Hydrol. J. 4, 19–34. doi: 10.2174/1874378101004010019
Chilundo, M., Kelderman, P., and O'keeffe, J. H. (2008). Design of a water quality monitoring network for the Limpopo River Basin in Mozambique. Phys. Chem. Earth 33, 655–665. doi: 10.1016/j.pce.2008.06.055
Collinson, J., Mountney, N., and Thompson, D. (2006). Sedimentary Structures, 3rd Rev. Edn. Harpenden: Terra Publishing.
Cuthbert, M. O., Acworth, R. I., Andersen, M. S., Larsen, J. R., McCallum, A. M., Rau, G. C., et al. (2016). Understanding and quantifying focused, indirect groundwater recharge from ephemeral stream using water table fluctuactions. Water Resour. Res. 52, 827–840. doi: 10.1002/2015WR017503
FAO (2004). Drought Impact Mitigation and Prevention in the Limpopo River Basin. Land and Water Discussion Paper 4. Rome: FAO.
Ferro, B. P. A., and Bouman, D. (1987). Explanatory Notes to the Hydrogeological Map of Mozambique: Scale 1:1 000 000. Project of the Hydrogeological Map of Mozambique, Sponsored by UNICEF. Maputo: National Directorate for Water Affairs.
Gallo, E. L., Meixner, T., Lohse, K. A., and Nicholas, H. (2020). Estimating surface water presence and infiltration in ephemeral to intermittent streams in the Southwestern U. S. Front. Water 2:572950. doi: 10.3389/frwa.2020.572950
Gonzalez-Carballo, A. (2018). Assessing Groundwater Recharge and Storage Enhancements in the Alluvial Aquifer of the Tigray Highlands (Ethiopia). MSc thesis, UNESCO-IHE. p. 153.
Hamer, W., Love, D., Owen, R., Booij, M. J., and Hoekstra, A. Y. (2008). Potential water supply of a small reservoir and alluvial aquifer system in southern Zimbabwe. Phys. Chem. Earth 33, 633–639. doi: 10.1016/j.pce.2008.06.056
Herbert, R., Barker, J., Davies, J., and Katai, O. T. (1997). “Exploiting groundwater from sand rivers in botswana using collector wells,” in Proceedings 30th International Geological Congress, Vol. 22 (Beijing), 235–257. doi: 10.1201/9781003079521-27
Hussey, S. W. (2003). The Feasibility of Sand-Abstraction as a Viable Method of Ground Water Abstraction. PhD, Loughborough, UK: Loughborough University.
Hussey, S. W. (2007). Water From Sand Rivers: Guidelines for Abstraction. WEDC, Loughborough University, UK.
Jia, L., Luo, Z., Yang, Q., Ou, S., and Lei, Y. (2007). Impacts of the large amount of sand mining on riverbed morphology and tidal dynamics in lower reaches and delta of the Dongjiang river. J. Geograph. Sci. 17, 197–211. doi: 10.1007/s11442-007-0197-4
Jooste, A., Marr, S. M., Addo-Bediako, A., and Luus-Powell, W. J. (2014). Metal bioaccumulation in the fish of the Olifants river, Limpopo Province, South Africa, and the associated human health risk: a case study of Rednose labeo labeo rosae from two impoundments. Afr. J. Aquat. Sci. 39, 271–277. doi: 10.2989/16085914.2014.945989
Koehnken, L., Rintoul, M. S., Goichot, M., Tickner, D., Loftus, A. C., and Acreman, M. C. (2020). Impacts of riverine sand mining on freshwater ecosystems: a review of the scientific evidence and guidance for future research. River Res Appl. 36, 362–370. doi: 10.1002/rra.3586
LBPTC (2010). Joint Limpopo River Basin Study Scoping Phase. Final report. República De Moçambique Ministério Das Obras Publicas E Habitação Direcção Nacional De Águas.
Levick, L., Fonseca, J., Goodrich, D., Hernandez, M., Semmens, D., Stromberg, J., et al. (2008). The Ecological and Hydrological Significance of Ephemeral and Intermittent Streams in the Arid and Semi-arid American Southwest. U.S. Environmental Protection Agency and USDA/ARS Southwest Watershed Research Center, EPA/600/R-08/134, ARS/233046, 116.
Loke, M. H. (2000). Electrical Imaging Surveys For Environmental And Engineering Studies. A Practical Guide to 2-D and 3-D Surveys. Unpubl. Short Train. Course Lect. Notes. Penang: Geotomo Software.
Love, D., van der Zaag, P., Uhlenbrook, S., and Owen, R. J. S. (2011). A water balance modelling approach to optimising the use of water resources in ephemeral sand rivers. River Res. Appl. 27, 908–925. doi: 10.1002/rra.1408
Lyu, M., Pang, Z., Yin, L., Zhang, J., Huang, T., Yang, S., Li, Z., Wang, X., and Gulbostan, T. (2019). The control of groundwater flow systems and geochemical processes on groundwater chemistry: a case study in Wushenzhao Basin, NW China. MDPI Water J. 11, 790. doi: 10.3390/w11040790
Mansell, M. G., and Hussey, S. W. (2005). An investigation of flows and losses within the alluvial sands of Ephemeral Rivers in Zimbabwe. J. Hydrol. 314, 192–203. doi: 10.1016/j.jhydrol.2005.03.015
Masvopo, T., Love, D., and Makurira, H. (2008). “Evaluation of the groundwater-potential of the malala alluvial aquifer lower Mzingwane River Zimbabwe,” in WaterNet. Available online at: https://cgspace.cgiar.org/handle/10568/21312.
Moulahoum, A. W. (2018). Using Field Assessment and Numerical Modelling Tools to Optimize a Water Abstraction System in the Shashane Sand River Aquifer (Zimbabwe).
Moyce, W., Mangeya, P., Owen, R., and Love, D. (2006). Alluvial aquifers in the mzingwane catchment: their distribution, properties, current usage and potential expansion. Phys. Chem. Earth. A/B/C. 31, 988–994. doi: 10.1016/j.pce.2006.08.013
Naiman, R., Latterell, J., Pettit, N. E., and Olden, J. D. (2008). Flow variability and the biophysical vitality of river systems. Compt. Rend. Geosci. 340, 629–643. doi: 10.1016/j.crte.2008.01.002
Nur, A., Ishaku, M. J., and Yusuf, N. S. (2012). Groundwater flow patterns and hydrochemical faceis distribution using geographical information system (GIS) in Damaturu, Northeast Nigeria. Int. J. Geosci. 3, 1096–1106. doi: 10.4236/ijg.0.2012.35111
SADC GIP (2010). SADC Groundwater - Public. Groundwater Information Portal. 2010. Available online at: https://ggis.un-igrac.org/ggis-viewer/viewer/sadcgip/public/default (accessed October 02, 2017).
Saveca, P. S. L. (2016). Investigation of Hydrogeochemical Processes and Groundwater Quality in the Chókwè District, Mozambique. Available online at: http://scholar.ufs.ac.za/xmlui/handle/11660/10349 (accessed February 11, 2021).
Scanlon, B. R., Keese, K. E., Flint, A. L., Flint, L. E., Gaye, C. B., Michael Edmunds, W., et al. (2006). Global synthesis of groundwater recharge in semiarid and arid regions. Hydrol. Proces. 20, 3335–3370. doi: 10.1002/hyp.6335
Shongwe, M. E., van Oldenborgh, G. J., van den Hurk, B. J. J. M., de Boer, B., Coelho, C. A. S., and van Aalst, M. K. (2009). Projected changes in mean and extreme precipitation in africa under global warming. Part I: Southern Africa. J. Clim. 22, 3819–3837. doi: 10.1175/2009JCLI2317.1
Stigter, T. Y., Moulahoum, A. W., Gonzalez, C. A., Abi, A., Saveca, P. S. L., and Ndlovu, S. (2019). “Groundwater assessment in sand rivers in adaptation to climate variability and water scarcity: opportunities and challenges in Semi-Arid Africa,” in: Proc. 46th IAH International Congress ‘Groundwater Management and Governance – Coping with Uncertainty’ (Malaga).
Stocker, T. F., Qin, D., Plattner, G.-K., Tignor, M., Allen, S. K., Boschung, J., et al. (2013). IPCC, 2013: Climate Change 2013: The Physical Science Basis. Contribution of Working Group I to the Fifth Assessment Report of the Intergovernmental Panel on Climate Change. Cambridge: Cambridge University Press.
Svubure, O., Gumbo, T., Soropa, G., Rusere, F., Ndeketeya, A., and Moyo, D. (2011). Evaluation of the sand abstraction systems for rural water supply: the case of Lupane District, Zimbabwe. Int. J. Eng. Sci. Technol. 3, 757–765. Available online at: http://www.idc-online.com/technical_references/pdfs/civil_engineering/Evaluation%20of%20the%20Sand.pdf
Torrese, P., and Rainone, R. (2013). “Identification and investigation of shallow paleochannels in the Chamelecon Valley (Honduras): 1D vs 2D electrical resistivity surveys,” in Symposium on the Application of Geophysics to Engineering and Environmental Problems 2013 (Denver, CO). doi: 10.4133/sageep2013-112.1
van der Zaag, P., Juizo, D., Vilanculos, A., Bolding, A., and Uiterweer, N. P. (2010). Does the Limpopo River basin have sufficient water for massive irrigation development in the plains of Mozambique? Phys. Chem. Earth 35, 832–37. doi: 10.1016/j.pce.2010.07.026
Walker, D., Jovanovic, N., Bugan, R., Abiye, T., du Preez, D., Parkin, G., et al. (2018). Alluvial aquifer characterisation and resource assessment of the Molototsi Sand River, Limpopo, South Africa. J. Hydrol. Reg. Stud. 19, 177–192. doi: 10.1016/j.ejrh.2018.09.002
Wekesa, S. S. (2017). Analysis of Groundwater Potential and Interactions with Surface Water in the Sand River Region, Mara Basin Kenya. MSc, Unesco-IHE, Delft.
Wekesa, S. S., Stigter, T. Y., Olang, L. O., Oloo, F., Fouchy, K., and MClain, M. E. (2020). Water flow behavior and storage potential of the semi-arid ephemeral river system in the Mara Basin of Kenya. Front. Environ. Sci. 8, 95. doi: 10.3389/fenvs.2020.00095
Xiao, Y., Shao, J., Frape, S. K., Cui, Y., Dang, X., Wang, S., and Ji, Y. (2018). Groundwater origin, flow regime and geochemical evolution in arid endorheic watersheds: a case study from Qaidam Basin, northwestern China. Hydrol. Earth Syst. Sci. 22, 4381–4400. doi: 10.5194/hess-22-4381-2018
Keywords: alluvial aquifer, hydrochemistry, groundwater, sand river, semi-arid region, Mozambique
Citation: Saveca PSL, Abi A, Stigter TY, Lukas E and Fourie F (2022) Assessing Groundwater Dynamics and Hydrological Processes in the Sand River Deposits of the Limpopo River, Mozambique. Front. Water 3:731642. doi: 10.3389/frwa.2021.731642
Received: 27 June 2021; Accepted: 31 December 2021;
Published: 21 March 2022.
Edited by:
Seifu Admassu Tilahun, Bahir Dar University, EthiopiaReviewed by:
K. Sreelash, National Centre for Earth Science Studies, IndiaTakeshi Hayashi, Akita University, Japan
Copyright © 2022 Saveca, Abi, Stigter, Lukas and Fourie. This is an open-access article distributed under the terms of the Creative Commons Attribution License (CC BY). The use, distribution or reproduction in other forums is permitted, provided the original author(s) and the copyright owner(s) are credited and that the original publication in this journal is cited, in accordance with accepted academic practice. No use, distribution or reproduction is permitted which does not comply with these terms.
*Correspondence: Paulo Sérgio Lourenço Saveca, cGF1bG8uc2F2ZWNhQGlzcGcuYWMubXo=
†ORCID: Paulo Sérgio Lourenço Saveca orcid.org/0000-0002-5219-1019
Attoumane Abi orcid.org/0000-0002-3398-403X
Tibor Yvan Stigter orcid.org/0000-0003-4096-2055
Eelco Lukas orcid.org/0000-0002-5114-3349
Francois Fourie orcid.org/0000-0002-8002-8489