 Elizabeth A. Bihn1*
 Kurt J. Mangione2
 Bill Lyons3†Annette L. Wszelaki4John J. Churey1†
 Don M. Stoeckel1
 Randy W. Worobo1
- 1Department of Food Science, Cornell Agritech, Geneva, NY, United States
- 2New York State Department of Agriculture and Markets Food Laboratory, Albany, NY, United States
- 3New York State Department of Agriculture and Markets, Albany, NY, United States
- 4Department of Plant Sciences, University of Tennessee, Knoxville, Knoxville, TN, United States
An Irrigation Water Quality Database was developed to help assess the microbiological quality of irrigation water used in fruit and vegetable production in 15 counties in New York (NY) State. Water samples from Tennessee (TN) were also included in the database. Four water quality parameters, quantified generic Escherichia coli, specific conductance, pH, and turbidity, were tested. Ground, reservoir, and running water were sampled over 2 years (2009 and 2010), covering three seasons each year (spring, summer, and fall). TN data are for all three seasons in 2010 only. Overall in NY (254 total samples), ground water had a geometric mean of 1 most probable number (MPN)/100 ml, reservoir water had a geometric mean of 8 MPN/100 ml, and running water had a geometric mean of 52 MPN/100 ml. Overall in TN (63 total samples), ground water had a geometric mean of 1 colony forming unit (CFU)/100 ml, reservoir water had a geometric mean of 5 CFU/100 ml, and running water had a geometric mean of 38 CFU/100 ml. These values are all below the 126 MPN/100 ml United States Environmental Protection Agency's Ambient Water Quality Standards (AWQS) standard for fresh water. The presence of E. coli had very weak but sometimes statistically signficiant correlatation with water specific conductance, pH, and turbidity, depending on the water source but the r-squared effect was not strong enough to make the other measurements a substitute for testing specifically for E. coli in water.
Introduction
Fresh fruit and vegetable production is a multi-billion dollar industry in the United States (U.S.) (Kaufman et al., 2000). These commodities are often irrigated with surface water throughout the U.S. (Suslow et al., 2003; Pachepsky et al., 2011). Surface water is more likely to be exposed to human and animal fecal contamination than ground water, and is expected to pose greater risk to human health than irrigation with water from deep aquifers with properly constructed and protected wells (Brackett, 1999; Steele and Odumeru, 2004). Contamination of surface water used for the production of fresh fruits and vegetables by human foodborne pathogens such as Salmonella, Escherichia coli O157:H7, Giardia, Listeria monocytogenes, and Cryptosporidium has been documented (Steele and Odumeru, 2004; Chaidez et al., 2005; Duffy et al., 2005; Izumi et al., 2008; Jones et al., 2014; Weller et al., 2019).
Initially studies of irrigation waters were concerned primarily with chemical rather than microbiological water-quality parameters (Seiler and Skorupa, 2001). As a result, there was a nationwide knowledge gap regarding sanitary quality of irrigation waters but many studies in the last decade have been focused on on-farm irrigation water quality (Strawn et al., 2013; Jones et al., 2014; Draper et al., 2016; Weller et al., 2019). Recreational water criteria set forth by United States Environmental Protection Agency's Ambient Water Quality Standards (AWQS) (United States Environmental Protection Agency, 2012) were developed for water used for recreation that results in full body contact by people, and it accepts that there is a baseline of individuals who are expected to contract gastrointestinal illness regardless of recreational water quality. The AWQS estimates that 36 illnesses per 1,000 swimmers will result at fresh-water beaches, even when standards are met. The illness rate expectations implicit in the AWQS may not be directly transferrable to irrigation water, but in the absence of water data related to fresh produce production, the AWQS structure and values have been used as the basis for agricultural water quality criteria. The Commodity Specific Food Safety Guidelines for the Production and Harvest of Lettuce and Leafy Greens (CSFSG) is one industry guideline that has modified the recreational water standards for use in fresh produce production. In addition to industry adoption of these standards, the Food Safety Modernization Act (FSMA) Produce Safety Rule, released on November 27, 2015, included AWQS-based water quality criteria for water used during the production of fresh produce when the water is intended to, or likely to, contact the harvestable portion of the crop (United States Food and Drug Administration, 2015).
The research outlined in this paper was conducted prior to the release of the FSMA Produce Safety Rule and prior to updated CSFSG water requirements (CSFSGPHLLG, 2020). This research resulted in the development of an Irrigation Water Quality Database to help growers better understand regional water quality and provide an example of how water test results could be collected to expand our understanding of water used for fruit and vegetable production. Preliminary research data gathered prior to the beginning of this project from surface water sources used to overhead irrigate fresh produce crops indicated that if growers were required to adopt the AWQS criteria, they would either have to discontinue the use of some of their water sources, or implement mitigation strategies, such as treatment, to reduce the microbiological load because surface water quality can vary over the season (Bihn et al., 2013). In fact, this concern has already partly come to fruition with the Leafy Greens Marketing Agreement April 2019 revisions to water quality metrics that remain in place today (CSFSGPHLLG, 2020). The revised metrics (for both California and Arizona) incorporate treatment as one risk reduction strategy for member organizations when using surface water or ground water that does not meet stringent water quality metrics for overhead irrigation within 21 days of harvest.
This project aimed to provide an objective assessment of the sanitary quality of surface water used for irrigation in New York (NY) State with a comparison of water from Tennessee at the time of the research through the collection of water quality parameters including quantified generic E. coli, specific conductance, pH, and turbidity. Investigating water quality over two years, through three seasons each year, was expected to provide useful insights into variation in water quality and identify ways to improve sampling strategies to further our understanding of surface water quality. Harvest seasons are known to impact the presence and abundance of pathogens in irrigation water, though these fluctuations are not always reflected in the microbial load on seasonal fresh produce (Selma et al., 2007). Since generic E. coli is only an indicator of fecal contamination and not the presence of pathogens, it would be valuable to know if growers could use other water quality parameters to predict the presence and abundance of generic E. coli besides testing specifically for E. coli since this process is expensive and it is often difficult to find laboratories in close proximity to farms. Overall, the database could improve our understanding of current water quality by identifying when fecal contamination is present, help growers meet industry and regulatory expectations, and also provide strategies for implementing an effective water-testing program. In addition, this database was developed to facilitate participation from others interested in providing water quality data so that a nationwide representation could result. Many individual growers and groups, including federal and state organizations, are collecting water samples and generating results, sometimes for the same water sources. Sharing data through a database, such as the one developed in this project, could allow the data to be used more effectively for water management decision making.
Materials and Methods
Irrigation Water Database Development
The irrigation water quality database utilized the FileMaker Pro 10 (Santa Clara, CA) data collection system. The database was comprised of six independent, relational files hosted on a FileMaker server. It was designed to facilitate data gathering from multiple sources, such as independent laboratories or researchers at other land-grant universities. Two of the files (data entry and grower address) were designed to be web-accessible, allowing an individual with proper permission to access the data entry file via a web browser without the need to own the FileMaker software. The remaining files had administrator privileges and were not viewable to those entering data.
Each grower who participated in the program was assigned a nine-digit, numeric grower code in an effort to ensure participant confidentiality. The “Grower” file stored the grower's contact information, commodities grown, and water source(s). State and county information for each grower was also recorded. This information was used to generate a water sample collection form, which included the unique nine-digit grower ID that appeared on each form.
The collection forms were given to those collecting water samples and in turn were submitted to the laboratory for analysis. The completed laboratory forms were then given to the data entry operator for entry into the FileMaker database. Upon registering with the program to enter data, individuals were provided with a database tutorial to instruct them how to access the data entry portal (Appendix A in Supplementary Material). They were then provided with an individualized password and login to gain entry to the database.
To enter data, the data entry operator was required to log into the database and enter the grower ID that appeared on each form. The operator entered all of the laboratory data from the water collection form, and submitted it for each grower. Multiple forms were required if an individual grower had more than one water sample source or sampling location. Each sample was entered separately. After all collection forms had been entered, the data entry operator would log out of the system.
When the database administrator logged into the water collection file, all grower collection data was imported automatically from the data entry file into the collection file. Once the import process was complete, all records in the data entry file were erased, thereby preventing the possibility of further access to the entered data. Only those with access to the water sample collection file could view the collected data. The data imported into the collection file was “as entered” by the data entry operator. If there was a mistake, the data entry operator was required to contact the database administrator to correct the data. If an administrator needed to correct entered data, there was a standard protocol in place for making corrections that included entering the user's ID, date, and reason for the correction. This information became part of the permanent record so that any data modifications were tracked.
Water Collection
A standardized water sampling protocol was developed, tested, and used as a training protocol (Appendix B in Supplementary Material). Four Department of Agriculture and Markets personnel and a summer intern were trained with the standardized water sampling protocol to facilitate sample collection across the state.
One liter of water was collected from each site into bottles that were either cleaned or purchased, then decontaminated following EPA protocol “B” (United States Environmental Protection Agency, 1992). Water was collected either at the source near the intake or for some limited samples, at the end of water distribution system in the field. For samples collected at the end of the distribution system, it was necessary to ensure the irrigation pump was operating and that it had been running long enough so that the sample was representative of the source. When samples were collected at the source, it was not necessary to ensure the water distribution system was operating. Collected samples were placed in a cooler containing ice packs, and either delivered directly or sent via overnight delivery for analysis at either the New York State Food Laboratory (Albany, NY) or the New York State Agricultural Experiment Station (Geneva, NY). Overnight delivery caused sample analysis to fall outside an 8-h analysis window, but according to Pope et al. (2003), samples held at 10°C and not frozen for up to 48 h generated comparable results to samples processed within the recommended 8-h hold time (American Public Health Association, 1998). TN samples were delivered directly to Microbac Laboratories (Maryville, TN or Nashville, TN) and all samples were analyzed for generic E. coli, specific conductance, turbidity, and pH.
Sample Analysis
Samples were analyzed for quantified generic E. coli, specific conductance, turbidity, and pH. Other data points related to water collection included date of sample collection, type of water source, name of water source (if a named body of water, such as a stream or lake), and code number for the grower.
Generic E. coli Quantification
IDEXX Quanti-Tray 2000 cards (Westbrook, ME) and IDEXX Quanti-Tray sealer (Westbrook, ME) were used according to the manufacturer's instructions for quantification of generic E. coli in water samples. Yellow wells and wells fluorescing at 366 nm were counted, and the numbers of positive wells for each test on each sample were recorded. Final most probable number (MPN) per 100 ml was determined by referring to the IDEXX Quanti-Tray 2000 MPN table with an upper limit of detection of 2,419 MPN per 100 ml (Kinzelman et al., 2005). Tennessee water samples were analyzed using modified mTEC (EPA 1603) protocol for quantification of generic E. coli resulting in colony-forming units (CFU) per 100 ml.
Specific Conductance
Specific conductance measures water's ability to conduct electricity, normalized to a temperature of 25°C. The parameter was included in this project as an indicator of run-off events that could impact water quality, as run-off events typically cause a decrease in the specific conductance of a particular water source. Specific conductance was measured with a conductivity meter (Oakton Instruments, Vernon Hills, IL), used in accordance with manufacturer's instructions.
Turbidity
Turbidity was measured in Nephelometric Turbidity Units (NTU) using a Hach 2100P Portable Turbidimeter (Loveland, CO) according to manufacturer's instructions.
pH
The pH of water samples was measured using a BeckmanΦ720 pH meter (Brea, CA). All results were recorded on the sample submission form.
Data Analysis
In NY, there were a total of 270 samples collected from 15 counties (Figure 1). These samples were taken from wells, rivers, streams, canals, swamps, lakes, and ponds. To aid in analysis, this larger data set was divided into three categories: ground water representing wells; running water representing rivers, streams, and canals; and reservoir water representing lakes, ponds, and swamps. Wells were expected to represent ground water that is protected from fecal contamination since they are not open to the environment. Though not all wells may be properly capped or protected, they were viewed as a distinct data set. A total of 254 samples were divided into running water (94 samples), reservoir water (137 samples), and ground water (23 samples) groups. Of the remaining samples, one sample was not properly analyzed for generic E. coli due to an incubator malfunction, and 15 were sampled directly from irrigation equipment and were removed from the predominant data set.
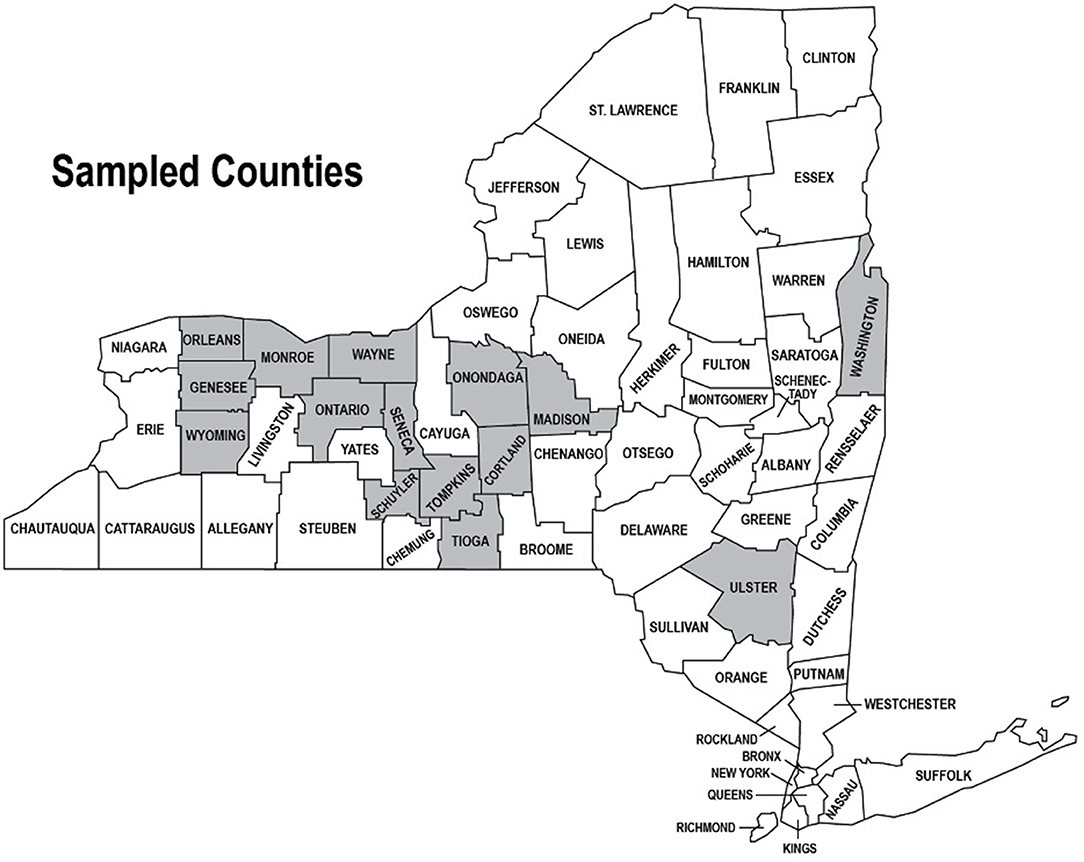
Figure 1. Water samples were collected from 15 counties throughout New York State. Counties with participating farms are highlighted in gray and data generated from the sampling were used to initially populate and test the Irrigation Water Quality Database.
The database contains NY data as well as data from TN (62 samples). Tennessee data were collected only in 2010, but utilized similar collection parameters to those in NY and were included for comparison in this paper. There were 65 samples collected in TN and entered into the database, including 19 ground water samples, 27 reservoir samples, 16 running water samples, and three municipal samples. The municipal TN samples were not included in the statistical analysis because there were no comparable data in NY. Several samples from TN were taken from irrigation equipment. In the NY data set these samples were removed because in many cases there were samples taken from the source water at the same time. Since there were fewer TN samples, the samples taken from irrigation water equipment were included in the analysis. Tennessee water samples were analyzed for the same parameters as the NY samples but the modified mTEC (EPA 1603) protocol was used for quantification of generic E. coli resulting in CFU per 100 ml. Our analysis is supported in the literature by Cho et al. (2010), who reported a positive correlation between CFU and MPN estimates. These methods also both appear on the list of approved microbiological methods for ambient water for measurement of E. coli (40 CFR §136.6). Since these protocols are considered equivalent, NY and TN results were compared on a one-to-one basis.
At the time of the study, reporting the geometric mean was the method used by both the AWQS and the CSFSG, so it is the standard used in this work (Dufour and Schaub, 2007; CSFSGPHLLG, 2010). Medians and averages were also calculated (data not shown). Median calculations aligned very closely to the geometric mean in most cases, while averages were usually much higher since calculating the average does not manage extreme data points in the data set as does the geometric mean calculation. Analysis was performed by year or by season, to determine if trends were present or to otherwise evaluate variability in the data.
All data were log-transformed prior to statistical analysis as is typically recommended for microbiological data that follow a log-normal distribution (American Public Health Association, 1998). In order to allow log transformation, data with “less than” values were assigned a value of half the detection limit. Two data points with “greater than” values were set at the detection limit (2420 MPN/100 ml) with the expectation that rare incidence would not skew statistical outcomes. One of these samples was a pond in New York in 2010, the other was from a drip irrigation line in New York. The central tendency for these data was approximated using the geometric mean. Confidence intervals were calculated using z-scores. Narrative descriptions of differences between the means of data sets are based on visual overlap of 95-percent confidence intervals. In addition, a t-test was used to confirm significance of differences (p < 0.05; with settings two-tail and unequal variance). Ability of each parameter to explain the patterns in generic E. coli concentration was tested by simple linear regression. Correlation coefficients were calculated using the linear regression function in Excel and correlation significance was evaluated at the level p < 0.05.
Results
Two hundred seventy surface water samples from NY State were collected and analyzed for pH, specific conductance, turbidity, and quantified generic E. coli. Overall for NY State, ground water had a geometric mean of 1 MPN/100 ml, reservoir water had a geometric mean of 8 MPN/100 ml, and running water had a geometric mean of 52 MPN/100 ml. Every ground water sample was below the 126 MPN/100 ml AWQS standard that is also used by the CSFSG. Reservoir water met the 126 MPN/100 ml standard 96% of the time, with only 3% of the samples exceeding 235 MPN/100 ml. The 235 MPN/100 ml value was the single sample upper limit standard for water intended for foliar applications to the edible portion of the crop as set forth in the CSFSG when this study was completed (CSFSGPHLLG, 2010). Similar to the single-sample value of 235 MPN/100 ml, other benchmarks that came into use after the timeframe of sample collection and analysis also originate with the USEPA Recreational Water Standards (United States Environmental Protection Agency, 2012). Specifically, the FSMA Produce Safety Rule, as published in 2015, used a statistical threshold value (STV) of 410 CFUs (equivalent to MPN) in 100 ml water and the August 2020 update to the LGMA metric revision used a single-sample maximum of 576 MPN/100 ml (United States Food and Drug Administration, 2015; CSFSGPHLLG, 2020). Running water samples met the 126 MPN/100 ml standard 74% of time, with only 15% of the samples being higher than the 235 MPN/100 ml standard. Though the rates of exceedance compared to the 235 MPN/100 ml standard (3% for reservoir water and 15% for running water) might appear low, there were samples that exceeded the limit, and therefore, would require mitigation, including retesting or abandoning the water source under contemporary rules during the sample collection time period.
Further analysis of water quality data from NY by year revealed consistent results from year to year and source to source (Figure 2). Ground water had the lowest quantified generic E. coli counts (with 21 of 23 samples below detection limit) while running water had the highest counts. The geometric mean values for reservoir water samples were almost an order of magnitude lower than running water sources, even though reservoir water sources are open to the environment like running water sources. Unlike reservoir sources, running water sources are subject to a multitude of variables due to the nature of running water sources having miles of banks with potential access by wildlife, septic systems, drainage tiles, run-off, and/or human recreational activity.
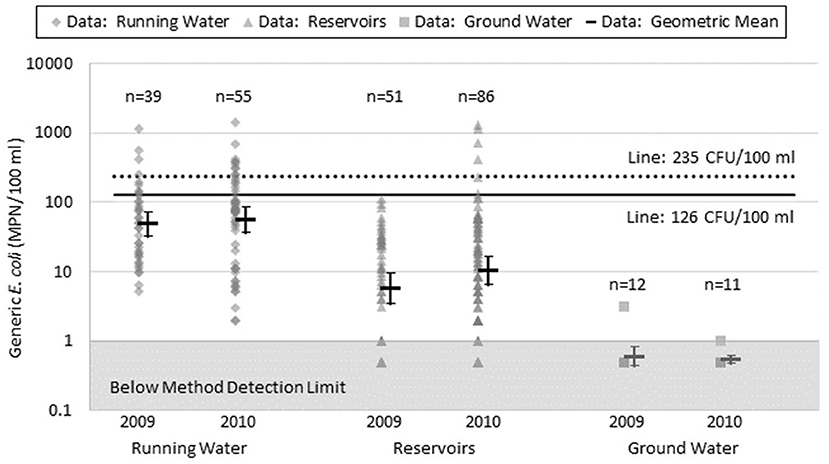
Figure 2. Range of values, geometric mean and confidence interval around the mean for quantified generic E. coli (most probable number per 100 ml) for each New York State water source group in 2009 and 2010. Number of samples below detection limit: Running Water 2009 n = 0, 2010 n = 0; Reservoirs 2009 n = 13, 2010 n = 15; Wells 2009 n = 11, 2010 n = 10.
Comparison by State and Season
Collaborators in TN began participating in the Irrigation Water Database in 2010. Overall, TN ground water had a geometric mean of 1 CFU/100 ml, reservoir water had a geometric mean of 5 CFU/100 ml, and running water had a geometric mean of 38 CFU/100 ml. Each ground water sample was below the 126 MPN/100 ml standard. Reservoir water met the 126 MPN/100 ml standard 93% of the time, with only 4% of the samples exceeding the 235 MPN/100 ml single upper limit standard. These percentages were consistent with those seen in NY water sources. Tennessee running water samples met the 126 MPN/100 ml standard 75% of the time, with only 6% of the samples being higher than the 235 MPN/100 ml standard. The percentage of samples achieving the 126 MPN/100 ml standard is comparable to NY, while the percentage of samples that exceed the 235 MPN/100 ml limit is approximately half of what was observed in NY. Sample size differences may help to account for this difference. Accurate estimation of exceedance rates was more likely for the larger NY sample set, with 94 observations (14 exceedances), compared with the smaller TN sample set, with only 16 observations (1 exceedance). The exceedance rates may also be affected by regional variation in water quality.
Analysis of TN running water data in the fall (22 September−20 December) indicated an excessively high geometric mean of 255 CFU/100 ml, but the geometric mean was calculated with only three samples and therefore the 95% confidence interval was broad (58–1,100 MPN/100 ml; see Figure 3). In general, a five-sample minimum is preferred for calculating a more precise geometric mean. The three samples were 860, 160, and 120 CFU/100 ml, all taken from the same water source, but at different, non-contiguous, locations along the water source, on the same day. Interestingly, two of the three samples did not exceed the 235 MPN/100 ml limit. Absent the highest value (860 MPN/100 ml) results from this data set likely would not have caused the grower to take any action, yet the 860 CFU/100 ml sample exceeds even the most liberal EPA recreational water standards of 575 MPN/100 ml for “Infrequently Used Full Body Contact” water, and it also exceeds the upper limit in the CSFSG standards (576 MPN/100 ml) for water that does not contact the edible parts of the plant such as water delivered through a drip system (United States Environmental Protection Agency (USEPA), 1986; CSFSGPHLLG, 2010).
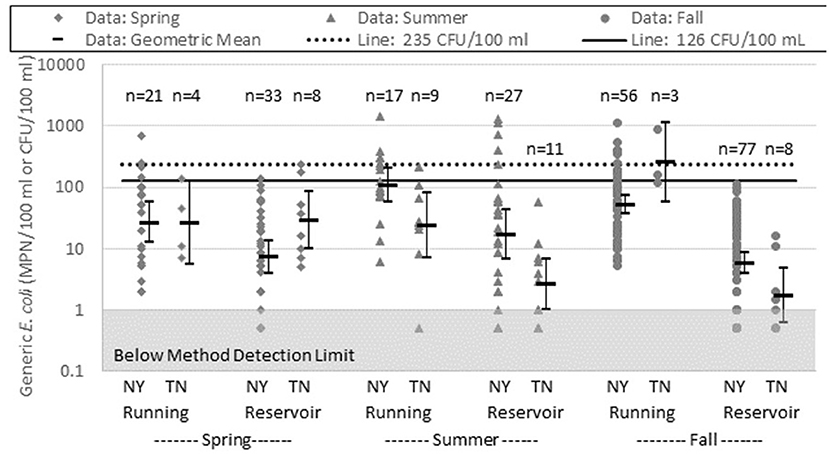
Figure 3. New York (NY) and Tennessee (TN) data were analyzed by season. Spring is represented by samples taken between 20 March and 20 June, summer is represented by samples taken between 21 June and 21 September, and fall is represented by samples taken between 22 September and 20 December. No samples were taken in winter (between 21 December and 19 March). NY samples from 2009 and 2010 were combined for this analysis. TN data are from 2010 only. The shaded gray box depicts the general method detection limit of 1 MPN or CFU per 100 ml.
With a clear understanding of these issues, the three data points from TN fall sampling of running water were included in the comparison of seasons and states found in Figure 3. Unlike NY, TN geometric mean concentrations of E. coli in running water samples were not always higher than the TN reservoir samples. In NY, E. coli geometric mean concentrations in both running and reservoir water were highest in the summer (21 June−21 September); in TN, spring (20 March−20 June) showed the highest counts in both reservoir and running water if the fall data from TN running water was discounted due to the issues discussed earlier in this section. To be confident in analysis of the TN data, more samples are needed for better representation of water quality by source type and season. The NY data showed seasonal trends in both running and reservoir water with the changes more pronounced in the running water from season to season. While the database was in use, TN continued to add data, as well as new collaborators in Texas and Maryland. Additional participation in the database from more states would have allowed additional data analysis and may have revealed trends that are regionally and/or seasonally dependent.
Correlations
In an attempt to determine if there were other, less expensive ways to monitor microbial water quality, correlations between E. coli counts and the other parameters tested, including specific conductance, turbidity, and pH (Table 1) were examined. These correlations were determined only for surface water sources sampled at the source water. There was a very weak statistically signficant negative correlation observed between E. coli levels and pH in all surface water samples over the 2 years (r = −0.18; p = 0.01), and a very weak positive correlation between E. coli and turbidity (r = 0.05; p = 0.55) and statistically significant very weak positive correlation for specific conductance (r = 0.13; p = 0.05). When running water and reservoir water were analyzed separately, some of the correlations were stronger. The strongest correlations identified were between E. coli and specific conductance (r = 0.20; p = 0.02) and E. coli and pH (r = −0.28; p = 0.00) in reservoir water, and E. coli and turbidity in running water (r = 0.21; p = 0.05). As noted above, several of these correlations were statistically significant (p < 0.05) but the r-squared values indicate a very low effect (Cohen, 1992). Based on the analysis these correlations would not be dependable indicators of the presence or quantity of E. coli.
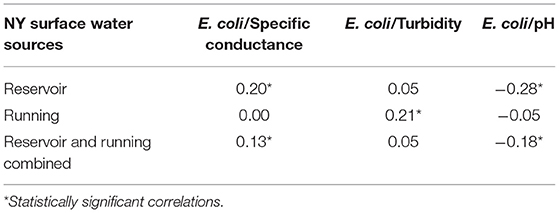
Table 1. Correlations among E. coli presence and three other water quality parameters, specific conductance, turbidity, and pH.
Discussion
Fresh produce growers who participated in this project benefited by having baseline water sampling completed for their on-farm water sources. They were supplied with a water testing protocol and had direct access to extension personnel to discuss water quality issues on their farms. Other NY farmers utilized trainings to help them understand the value of water testing, how to test their water sources, and how to locate laboratories that can provide the required analyses.
Ponds are a very common source of surface water in NY, and in this study the geometric mean of E. coli counts in ponds was 6 MPN/100 ml. In one particular case, a farm pond had an unusually high E. coli water test (>2,420 MPN/100 ml), so contact was made with the grower to discuss what could have been the cause. One of the farm owners participates in the Community Collaboration Rain, Hail, and Snow Network (CoCoRaHS), so they were able to share that the night before the sample was taken, they had 0.2 inch of rain. A review of the data showed all the indications of a rain event in that the turbidity was higher and the pH and specific conductance were lower, indicating dilution by rain. The other factor for this sample was that it was taken directly from the irrigation equipment, which in other instances in this study has also resulted in an unusually high E. coli count. A follow-up sample had a much lower E. coli count (3.1 MPN/100 ml), and was not a concern to the grower. This farm's participation in CoCoRaHS gave them a monitoring tool they did not know existed. In addition, being able to review the turbidity, specific conductance, and pH data provided a level of confidence in the determination that the water sample was affected by the rain event. Understanding the impact rain has on water quality attributes and the possible influence of irrigation equipment on water tests is important for making management decisions regarding water use. Rainfall data was not collected in this study, but growers should be made aware of options like CoCoRaHS to add to their arsenal of information that could help make water use management decisions.
The purpose of sharing this example is to highlight the fact that growers need to be aware of factors that can impact water quality and be able to interpret water-testing data. This project collected parameters outside the current recommendations for generic E. coli testing, yet adding these parameters does not significantly increase water testing cost and may provide growers with additional information that can assist them in determining the source and cause of contamination.
Impact of Sampling Location
For all water collections, sample location was noted. Most samples were taken directly from the source water, but there were several opportunities in the 2010 NY sampling season to collect water samples directly from irrigation equipment. The rationale behind sampling from irrigation equipment was to collect water closest to the point of use, and to obtain data that represent the microbiological quality of water that actually contacted the plant. Our results indicate that this may not be the best way to determine source water quality, but it is more representative of the use of the water and may be relevant to understanding overall risk to produce safety. During the 2010 season, nine pairs of samples were collected from irrigation equipment (running or flushed prior to sampling) and the source water that supplied the irrigation equipment. Two out of the nine sample pairs demonstrated that the irrigation equipment sample had higher E. coli counts than the source water sample. There were no cases where the source water sample had higher E. coli compared with the associated irrigation equipment sample. Observed differences were beyond the 95% confidence limits of the MPN test method (Table 2). For the other seven pairs, the data pairs had overlapping 95% confidence limits in the IDEXX Quanti-Tray 2000 results tables (indicating no credible difference in the results), though in three of those seven cases the overlap was one-sided. Concentrations of E. coli can vary significantly, making it difficult for growers to know the most representative location from which to collect water samples to determine water quality.

Table 2. Comparison of source water samples and irrigation line samples analyzed for E. coli.
Although there were only two samples from irrigation equipment that differed from their source water samples, the observation highlights several things a grower may want to consider. The first issue is that irrigation equipment could incorporate risks into the production of fresh produce through the addition of microbial contamination that is multiplied from, or did not exist in, the source water. This could be from intrusion of fecal contamination somewhere in the distribution system or growth of E. coli and possibly pathogenic bacteria in the distribution system from year to year. Two of the samples were from farms using drip irrigation, and the increase in microbial counts could have been related to soil conditions including the use of amendments that increase E. coli counts since the drip tape is in direct contact with the soil. The overall risk to the food production system should be low because the water is applied at or just below the soil line and primarily wets the soil, not the edible portion of the plant. There are two exceptions to this assessment, one is root crops that would be contacted by drip irrigation and the other is a malfunction in the drip irrigation system that results in overhead spray from an emitter. One of the samples was collected from overhead irrigation equipment and had high E. coli counts (1200 MPN/100 ml) when compared to the source water (727 MPN/100 ml). The grower identified that this water was used to irrigate leafy greens. E. coli counts in both source water and irrigation equipment significantly exceeded the single-sample limit of 235 MPN/100 ml [United States Environmental Protection Agency (USEPA), 1986; CSFSGPHLLG, 2010]. Since this water was identified as being applied by overhead irrigation, it represented the riskiest application method due to wetting of the edible portion of the crop. It is not known whether the grower was actually irrigating with this water, or how close to harvest it was applied, but the data clearly represent concerns that the grower should review. In assessing risks, growers using both systems should review the siphon system that feeds the irrigation pipe to be certain it is suspended in the water and not siphoning bottom sediment, as this is known to increase microbial content (Badgley et al., 2011).
A second important issue is that sampling from the irrigation equipment may not accurately reflect the quality of the source water, and as mentioned above, which should cause a grower to review other aspects of production such as the integrity of water delivery systems. This is important because financial and time resources are limited and growers should be targeting resources to mitigate risk. Modifying a siphon float, flushing, and sanitizing the irrigation lines, or reviewing soil amendment application timelines may be easier, less expensive, and reduce risks more effectively compared to treating the entire water source, but without testing both the source water and the irrigation equipment, the grower would not know where the risk was introduced. The data collected in this study did not support determination of which process explains the observation, but it highlights the value of sampling from each location on the same day to see if there is a difference. Each possibility could lead to different corrective actions to reduce risk but without data indicating an issue, a grower may not know there is a problem.
The CSFSGPHLLG (2010) instructs farm operators to “sample sources as close to the point-of-use as practical, as determined by the sampler to ensure the integrity of the sample.” The U.S. Food and Drug Administration (2015) instructs farm operators that samples “must be representative of (the) use of the water.” Based on the inconsistent data generated when sampling irrigation equipment, it may be that the sampler could determine that in order to ensure the integrity of the sample, it should be sampled from source water, not the equipment. An alternative solution would be to collect two samples, one from the source water and one from the irrigation equipment, but even this has its challenges. Although irrigation systems may feed off the same main pump line, most systems branch and thus have multiple end points, so that type of testing strategy would increase the number of samples and, subsequently, the cost substantially. If there was concern regarding an overhead irrigation system, growers may consider developing a sampling rotation to identify microbial risks in irrigation lines. This would minimize the number of samples but still enable the sampling of lines over time.
Recommendations for Growers
In drawing conclusions from this research, it is important to consider whether our results impact current Good Agricultural Practices recommendations. Based on weak correlational data, it is clear that the alternate measurements (pH, specific conductance, and turbidity) do not consistently allow estimation of the quality of a surface water source, based on E. coli as the indicator organism, as well as testing the water source for E. coli. Though there is much discussion about the value of generic E. coli as an indicator organism, it is the best available at the moment and there are laboratories that can complete the testing for growers (Suslow, 2010).
One recommendation for testing surface waters, based on the results of this research, would be to add additional parameters beyond quantified generic E. coli that do not substantially increase the cost of the test, but that provide the growers with additional information that might allow them to interpret their test results. In particular, specific conductance ($10) and turbidity ($8) would allow growers to understand if run-off is influencing their test results. Although the value of pH for water quality issues was not viewed as significant enough to recommend, some growers who signed up to participate in this study did so in order to determine the pH of their water sources because they were interested in the information relative to how it impacts their spray mixes. Since it is a relatively inexpensive test ($5) that can provide useful information to growers, including it in the recommended tests seems reasonable. Prices quoted for tests were provided by Certified Environmental Services Inc., a commercial water-testing laboratory in Syracuse, NY and are expected to be representative of prices at similar laboratories.
The amount and timing of testing is another area that warrants discussion. The 1986 EPA Ambient Water Quality Standard Criteria (EPAAWQSC) states that sampling frequency and testing to determine the quality of the water should be “based on a statistically sufficient number of samples (generally not <5 samples equally spaced over a 30-day period).” At the time when this research was conducted, this was adapted for use in the Commodity Specific Food Safety Guidelines for the Production and Harvest of Lettuce and Leafy Greens (CSFSGPHLLG, 2010) as part of the California Leafy Greens Marketing Agreement (LGMA). As appeared in the LGMA decision tree for pre-harvest water used for foliar applications that result in the edible portion of the crop being contacted by water (i.e., overhead irrigation, topical protective sprays, frost protection), it stated: “Sampling Frequency: One sample per water source shall be collected and tested prior to use if >60 days since last test of the water source. Additional samples shall be collected at intervals of no <18 h and at least monthly during use. Geometric means, including rolling geometric means, shall be calculated using the five most recent samples.” In August, 2020 these standard were updated to require that no untreated surface water be applied to leafy green crops within 21 days of harvest without additional pathogen testing required on the harvested crop (CSFSGPHLLG, 2020). The FSMA Produce Safety Rule, as published in 2015, states that “a minimum total of 20 samples of agricultural water…over a minimum period of 2 years, but not >4 years” is required for long-term water use decision making based on an expected standard deviation of 0.4 among log-transformed concentration data. Data collection and analysis in this project was collected prior to the release of the FSMA Produce Safety Rule so did not conform to these parameters. On March 18, 2019, FDA extended the compliance dates for meeting water quality requirements outline in FSMA Produce Safety Rule Subpart E “to address questions about the practical implementation of compliance with certain provisions and to consider how we might further reduce the regulatory burden or increase flexibility while continuing to protect public health.” (United States Food and Drug Administration, 2019). A release of an updated Subpart E is anticipated in 2021.
The sampling strategy set forward by the LGMA at the time this research was conducted was more reasonable for agriculture than five samples spaced over 30 days as in the AWQS, but the calculation of the rolling geometric mean of five samples increases the testing requirements. Some growing seasons are particularly short in NY, so in order to get five water samples over the season, growers would need to sample at least once per week and even at that frequency, they would not be able to calculate their first geometric mean until the season was almost over. The single sample standards are more relevant in short production seasons, but because they are based on the recreational water standards, they accept that some people will get ill. Of note, FDA in the FSMA Produce Safety Rule declined to provide a single-sample standard, opting instead for a STV that “is a measure of variability of (the) water quality distribution, derived as a model-based calculation approximating the 90th percentile using the lognormal distribution.”
Understanding and accepting that there are risks associated with using surface water sources during production is key to assessing the safety of surface water sources. Using water quality standards such as the EPA recreational water standards that clearly accept some illness as an outcome may seem unwise but requires additional consideration. Unlike full body contact water that assumes individuals will be directly exposed to the water and ingest some of it, surface water used for irrigation may never be ingested by those who consume the fresh fruits and vegetables. Irrigation water is often applied days before harvest so the water is dried by the time the fresh produce is picked. Exposure to sun and desiccation promote the reduction of microbial populations that may be deposited by the irrigation water, so the risk is likely less than in recreational waters because of the absence of conditions under which bacterial pathogens could subsequently reproduce on the produce (Steele and Odumeru, 2004).
Another consideration that supports the use of surface water for fresh produce production is the world-wide shortage of clean drinking water. If growers are driven to use water that has no detectable fecal-indicator bacteria, they will either have to treat the water or move to ground or municipal water. The use of ground or municipal water in the U.S. may not seem like such a dire option at the moment, but already in states like Florida and California, municipalities have established reclaimed water distribution systems to encourage people to not waste drinking water on watering lawns, gardens, and crops. When countries outside the U.S. are considered, the notion of using a clean drinking water source to irrigate crops is unrealistic in some cases. The World Health Organization sets the standard for wastewater used to irrigate crops that will be eaten raw at <1,000 fecal coliforms per 100 ml water (Blumenthal et al., 2000). Reclaimed water is usually treated, but because it likely originated from human sewage sources, can still contain human pathogens (Sadovski et al., 1978; Bastos and Mara, 1995; Oron et al., 2010). Treatment of reclaimed water may vary by municipality and location, so the quality of reclaimed water may not be consistent and could easily exceed microbial counts found in surface water sources. Conserving drinking water sources and using surface water sources responsibly is important to the management of water as a natural resource and should be a consideration for growers in assessing the risks of using surface water in relationship to other management issues. It is also important to investigate effective treatment options that do not have negative plant and environmental consequences.
Key Extension Points
This project provided several insights into irrigation water quality and on-farm management practices related to water use. First, it was noted that on-farm water testing was not standard practice on NY farms at the time of the study (2009–2010) despite the existence of voluntary programs (e.g, GAPs, LGMA) that recommend water testing. With increased pressure from buyers and the 2015 publication of the FSMA Produce Safety Rule, interest in water testing is increasing, but much extension training needs to be done to adequately educate farmers on best water testing practices and the implications of those results. Training should include water sampling protocols, how to monitor surface water sources through environmental assessment and water testing, and finally how to interpret results. Growers will need to implement water-testing practices for surface water sources they are using, and conduct inspections that should include assessing risks of their water use practices and implementation of corrective actions that reduce any identified risks when water analysis results exceed expectation or indicate increased risks. Data from this project indicate that surface water quality can vary dramatically over the growing season and there are not always clear factors to indicate why these variations occur. Although in this project we sampled on-farm water sources only three times during each growing season, it may be more practical to recommend that growers test their surface water sources prior to the start of the season and at least once a month during use or more often if there are concerns about the quality of the water. Testing should be targeted at times just prior to use so growers have an understanding of quality prior to application, particularly if water is applied directly to the crop or close to harvest. Reviewing water testing results on a per-farm basis and incorporating other available information, such as rainfall data, will allow growers to gain valuable information in assessing the risks their surface water sources may represent.
To implement water-testing practices, growers will need access to water testing laboratories that can provide testing of surface water sources. Furthermore, not every commercial water-testing laboratory may be prepared to handle surface water samples and provide the testing services farmers may need and request. Not all water-testing laboratories are prepared to present water-testing results in a format that is valuable to growers. The FSMA Produce Safety Rule includes the need to calculate a STV to set an upper limit for variability of generic E. coli concentrations. This uncommon calculation requirement creates a barrier for on-farm water management decisions. First, most growers do not know how to perform the calculation. Second, if the calculation is done incorrectly, growers may use water that has significant fecal contamination which could increase risk or avoid using water that has low fecal contamination and risk crop loss due to lack of irrigation. Either outcome has serious impacts on crop health and safety. Several groups developed educational materials including fact sheets and water calculators to assist growers with doing these calculations and understanding these requirements (Bihn et al., 2017; Harris and Rock, 2017; Rock and Harris, 2017; Stoeckel et al., 2017).
Water samples also require analysis within a certain time period. Some protocols require analysis within 8 h, while others allow up to 30 h of hold time prior to analysis. This is important, because some farms are not located near water testing laboratories, so they would be forced to use overnight mail delivery for sample submission and would not meet the 8-h requirement. Unfortunately, some farms are in rural areas that do not have access to overnight mail, so this creates another barrier to establishing a water testing strategy. Research has indicated there can be impacts as a result of both hold times and laboratories conducting the analysis on water sample results, including both increases and decreases in E. coli counts, depending on these variables (Pope et al., 2003; Selvakumar et al., 2004; United States Environmental Protection Agency, 2006; Harmel et al., 2016). Our analysis method and study design were selected based on research as well as a process that growers could actually implement in order to have samples kept at or below 10°C and not frozen and delivered to a laboratory within 48-h (Pope et al., 2003). As water testing becomes required for produce growers, it is important that farmers be provided with a standard they can meet and that resources, such as access to water testing laboratories, are available.
Lastly, a very important outcome of this research was the development of a database that could capture water testing results and share them in a confidential way to the county level. It is common in agricultural production areas the different farms are using the same water sources, including streams, rivers, and canals. Some government agencies, such as the United States Geological Survey, and many university researchers are sampling the same water sources that growers are using and generating valuable data. As was seen with our database, others were interested in using the database, but funding to maintain and expand it was not available. Regardless of regulatory or audit requirements, it would be great to collect water testing data so that it is available for those that could use it to make better informed food safety management decisions. In many instances, the expense of taking the sample, transporting it to the laboratory, and doing the analysis is already done. The last step of cataloging and sharing the data is missing. The database developed for this project demonstrated that data can be collected in a secure and private way so that water testing information could be shared and benefit the agricultural community as a whole.
Data Availability Statement
The raw data supporting the conclusions of this article will be made available by the authors, without undue reservation.
Author Contributions
EB was responsible for research design, water sampling, sample analysis at Cornell Agritech, and the writing the manuscript. KM was responsible for sample analysis at the New York State Food Laboratory. BL was responsible for supervision of state personnel that collected water samples. AW was responsible for all data collection in Tennessee and manuscript review. JC was responsible for guidance and assistance in the Cornell Agritech laboratory. DS was responsible for research design guidance and manuscript review, and RW was responsible for research design guidance, sampling analysis guidance, and manuscript review. All authors contributed to the article and approved the submitted version.
Funding
The authors acknowledge research funding support from the New York State Cabbage Research and Development Program, USDA National Integrated Food Safety Initiative grant #2008-51110-0688 and the USDA Specialty Crop Block Grant Program in TN.
Conflict of Interest
The authors declare that the research was conducted in the absence of any commercial or financial relationships that could be construed as a potential conflict of interest.
Publisher's Note
All claims expressed in this article are solely those of the authors and do not necessarily represent those of their affiliated organizations, or those of the publisher, the editors and the reviewers. Any product that may be evaluated in this article, or claim that may be made by its manufacturer, is not guaranteed or endorsed by the publisher.
Acknowledgments
The authors would like to acknowledget the many growers who allowed us to sample water from their farms. We would also like to thank Mark Kogut for technical assistance on developing the database and for assistance in creating Figures and Tables, Elizabeth Buerman, Bernie DiBattista, VJ DeSantis, and Wendy Ingersoll for assistance in collecting water samples on farms throughout New York State. We thank Donna P. Clements for valuable feedback on the manuscript. We also acknowledge Cheryl D. Galvani and Toria Melville for editorial assistance.
Supplementary Material
The Supplementary Material for this article can be found online at: https://www.frontiersin.org/articles/10.3389/frwa.2021.741653/full#supplementary-material
References
American Public Health Association (1998). Standard Methods for the Examination of Water and Wastewater, 20th Edn. Washington DC: American Public Health Association, American Water Works Association and Water Environmental Federation.
Badgley, B. D., Thomas, F. I. M., and Harwood, V. J. (2011). Quantifying environmental reservoirs of fecal indicator bacteria associated with sediment and submerged aquatic vegetation. Environ. Microbiol. 13, 932–942. doi: 10.1111/j.1462-2920.2010.02397.x
Bastos, R. K. X., and Mara, D. D. (1995). The bacterial quality of salad crops drip and furrow irrigated with waste stabilization pond effluent: an evaluation of the WHO guidelines. Water Sci. Technol. 31, 425–430. doi: 10.2166/wst.1995.0511
Bihn, E. A., Fick, B. J., Pahl, D. M., Stoeckel, D.M, Woods, K. L., et al. (2017). Geometric Means, Statistical Threshold Values, and Microbial Die-Off Rates. Produce Safety Alliance, Cornell University.
Bihn, E. A., Smart, C. D., Hoepting, C. A., and Worobo, R. W. (2013). Use of surface water in the production of fresh fruits and vegetables: a survey of fresh produce growers and their water management practices. Food Prot. Trends. 33, 307–314.
Blumenthal, U. J., Mara, D. D., Peasey, A., Ruiz-Palacios, G., and Stott, R. (2000). Guidelines for the microbiological quality of treated wastewater used in agriculture: recommendations for revising WHO guidelines. Bull. World Health Org. 78, 1104–1116. Available online at: https://www.scielosp.org/article/ssm/content/raw/?resource_ssm_path=/media/assets/bwho/v78n9/v78n9a06.pdf
Brackett, R. E. (1999). Incidence, contributing factors, and control of bacterial pathogens in produce. Postharvest Biol. Technol. 15, 305–311. doi: 10.1016/S0925-5214(98)00096-9
Chaidez, C., Soto, M., Gortares, P., and Mena, K. (2005). Occurrence of Cryptosporidium and Giardia in irrigation water and its impact on the fresh produce industry. Int. J. Environ. Health Res. 15, 339–345. doi: 10.1080/09603120500289010
Cho, K. H., Han, D., Park, Y., Lee, S. W., Cha, S. M. J.-H., et al. (2010). Evaluation of the relationship between two different methods for enumeration fecal indicator bacteria: colony-forming unit and most probable number. J. Environ. Sci. 22, 846–850. doi: 10.1016/S1001-0742(09)60187-X
Cohen, J. (1992). Statistical power analysis. Curr. Dir. Psychol. Sci. 1, 98–101. doi: 10.1111/1467-8721.ep10768783
CSFSGPHLLG (2010). Commodity Specific Food Safety Guidelines for the Production and Harvest of Lettuce and Leafy Greens. California Leafy Greens Marketing Agreement.
CSFSGPHLLG (2020). Commodity Specific Food Safety Guidelines for the Production and Harvest of Lettuce and Leafy Greens. California Leafy Greens Marketing Agreement. Downloaded from https://lgmatech.com/resources/
Draper, A. D., Doores, S., Gourama, H., and LaBorde, L. F. (2016). Microbial survey of Pennsylvania surface water used for irrigating produce crops. J. Food Prot. 79, 902–912. doi: 10.4315/0362-028X.JFP-15-479
Duffy, E. A., Lucia, L. M., Kells, J. M., Castillo, A., Pillai, S. D., and Acuff, G. R. (2005). Concentration of Escherichia coli and genetic diversity and antibiotic resistance profiling of Salmonella isolated from irrigation water, packing shed equipment, and fresh produce in Texas. J.Food Prot. 68, 70–79. doi: 10.4315/0362-028X-68.1.70
Dufour, A., and Schaub, S. (2007). “The evolution of water quality criteria in the United States, 1922-2003,” in Statistical Framework for Recreational Water Quality Criteria and Monitoring, ed J. Larry Wymer (Ames, IA: John Wiley and Sons, Ltd.), 1–12. doi: 10.1002/9780470518328.ch1
Harmel D. Wagner K. Martin E. Smith D. Wanjugi P. Gentry T. Gregory L. and T. Hendon (2016). Effects of field storage method on E. coli concentrations measured in storm water runoff. Environ. Monit. Assess. 188, 170. doi: 10.1007/s10661-016-5183-9
Harris, L. J., and Rock, C. (2017). Surface Water MWQP Calculator. Western Center for Food Safety, Version 6.0. Available online at: https://ucfoodsafety.ucdavis.edu/pre-post-harvest/produce-preharvest/agricultural-water (accessed July 14, 2021).
Izumi, H., Tsukada, Y., Poubol, J., and Hisa, K. (2008). On-farm sources of microbial contamination of persimmon fruit in Japan. J.Food Prot. 71, 52–59. doi: 10.4315/0362-028X-71.1.52
Jones, L. A., Worobo, R. W., and Smart, C. D. (2014). Plant-pathogenic oomycetes, Escherichia coli strains, and Salmonella spp. frequently found in surface water used for irrigation of fruit and vegetable crops in New York State. Appl. Environ. Microbiol. 80, 4814–4820. doi: 10.1128/AEM.01012-14
Kaufman, P. R., Handy, C. R., McLaughlin, E. W., Park, K., and Green, G. M. (2000). Understanding the Dynamics of Produce Markets: Consumption and Consolidation Grow. United States Department of Agriculture, Economic Research Service Agriculture Information, Bulletin No. 758. Available online at: https://www.ers.usda.gov/webdocs/publications/42294/32086_aib758_002.pdf?v=6930.2 (accessed June 11, 2021).
Kinzelman, J. L., Singh, A., Ng, C., Pond, K. R., Bagley, R. C., and Gradus, S. (2005). Use of IDEXX Colilert-18® and Quanti-Tray/2000 as a rapid and simple enumeration method for the implementation of recreational water monitoring and notification programs. Lake Reserv. Manag. 21, 73–77. doi: 10.1080/07438140509354414
Oron, G., Gillerman, L., Lael, A., Manor, Y., Braude, E., and Bick, A. (2010). Minimizing health risks during secondary effluent application via subsurface drip irrigation. Water Sci. Technol. 62, 2330–2337. doi: 10.2166/wst.2010.502
Pachepsky, Y., Shelton, D. R., McLain, J. E. T., Patel, J., Mandrell, R., et al. (2011). Irrigation waters as a source of pathogenic microorganisms in produce: a review. Adv. Agron. 113, 76–141. doi: 10.1016/B978-0-12-386473-4.00002-6
Pope, M. L., Bussen, M., Feige, M. A., Shadix, L., Gonder, S., Rodgers, C., et al. (2003). Assessment of the effects of holding time and temperature on Escherichia coli densities in surface water samples. Appl. Environ. Microbiol. 69, 6201–6207. doi: 10.1128/AEM.69.10.6201-6207.2003
Rock, C., and Harris, L. J. (2017). FSMA Produce Safety Rule OnlineCalculator (English and Spanish) University of Arizona Cooperative Extension. Avaialble online at: https://agwater.arizona.edu/onlinecalc/default.aspx (accessed July 14, 2021).
Sadovski, A. Y., Fattal, B., Goldberg, D., Katzenelson, E., and Shuval, H. I. (1978). High levels of microbial contamination of vegetables irrigated with wastewater by the drip method. Appl. Environ. Microbiol. 36, 824–830. doi: 10.1128/aem.36.6.824-830.1978
Seiler, R. L., and Skorupa, J. P. (2001). National Irrigation Water Quality Program Data-Synthesis Data Base 00-513. Avaialble online at: http://pubs.usgs.gov/of/2000/ofr00513/ofr00513.pdf (accessed June 11, 2021).
Selma, M. V., Allende, A., Lopez-Galvez, F., Elizaquivel, P., Aznar, R., and Gill, M. I. (2007). Potential microbial risk factors related to soil amendments and irrigation water of potato crops. J. Appl. Microbiol. 103, 2542–2549. doi: 10.1111/j.1365-2672.2007.03504.x
Selvakumar, A., Borst, M., Boner, M., and Mallon, P. (2004). Effects of sample holding time on concentrations of microorganisms in water samples. Water Environ. Res. 76, 67–72 doi: 10.2175/106143004X141591
Steele, M., and Odumeru, J. (2004). Irrigation water as source of foodborne pathogens on fruit and vegetables. J.Food Prot. 67, 2839–2849. doi: 10.4315/0362-028X-67.12.2839
Stoeckel, D. M., Pahl, D. M., Wall, G. L., Woods, K. L., and Bihn, E. A. (2017). The Water Analysis Method Requirement in the FSMA Produce Safety Rule. Produce Safety Alliance, Cornell University.
Strawn, L. K., Fortes, E. D., Bihn, E. A., Nightingale, K. K., Grohn, Y. T. Y. T., et al. (2013). Landscape and meteorological factors affecting prevalence of three food-borne pathogens in fruit and vegetable farms. Appl. Environ. Microbiol. 79, 588–600. doi: 10.1128/AEM.02491-12
Suslow, T. (2010). Standards for Irrigation and Foliar Contact Water. Available online at: https://www.pewtrusts.org/~/media/Assets/2009/PSPWaterSuslow1pdf.pdf (accessed October 04, 2021).
Suslow, T. V., Oria, M. P., Beuchat, L. R., Garrett, E. H., Parish, M. E., Harris, L. J., et al. (2003). Production practices as risk factors in microbial food safety of fresh and fresh-cut produce. Compr. Rev. Food Sci. Food Saf. 2(Suppl s1), 38–77. doi: 10.1111/j.1541-4337.2003.tb00030.x
U.S. Food Drug Administration (2015). Standards for the Growing, Harvesting, Packing, and Holding of Produce for Human Consumption. Available online at: https://www.regulations.gov/document/FDA-2011-N-0921-18558 (accessed October 04, 2021).
United States Environmental Protection Agency (1992). Specifications and Guidance for Contaminant-Free Sample Containers. EPA 540-R-93-051. Publication 9240.0-05A. Available online at: https://nepis.epa.gov/Exe/ZyPDF.cgi/2001266X.PDF?Dockey=2001266X.PDF (accessed August 19, 2021).
United States Environmental Protection Agency (2006). Assessment of the Effects of Holding Time and Enterocci Concentrations in Fresh and Marine Recreational Waters and Escherichia coli Concentrations in Fresh Recrational Waters. EPA-821-R-06-019. Washington, DC. Available online at: ///Users/eab38/Downloads/EPA-HQ-OW-2010-0192-0035_content.pdf (accessed September 15, 2021).
United States Environmental Protection Agency (2012). Recreational Water Quality Criteria. EPA 820-F-12-058. Available online at: https://www.epa.gov/wqc/2012-recreational-water-quality-criteria-documents (accessed August 22, 2021).
United States Environmental Protection Agency (USEPA) (1986). Ambient Water Quality Criteria for Bacteria. EPA 440/5-84-002. Available online at: https://www.epa.gov/sites/production/files/2019-03/documents/ambient-wqc-bacteria-1986.pdf (accessed June 11, 2021).
United States Food and Drug Administration (2015). Standards for the Growing, Harvesting, Packing, and Holding of Produce for Human Consumption.
United States Food and Drug Administration (2019). Standards for the Growing, Harvesting, Packing, and Holding of Produce for Human Consumption; Extension of Compliance Dates for Subpart Federal Register E. 84, 9706–9714.
Weller, D. L., Belias, A., Green, H., Wiedmann, M., and Roof, S. (2019). Landscape, water quality, and weather factors associated with an increased likelihood of foodborne pathogen contamination of New York streams used to source water for produce production. Front. Sustain. Food Syst. 3:124. doi: 10.3389/fsufs.2019.00124
Keywords: irrigation water, E. coli, microbiological risks, fresh produce, pH, specific conductance, turbidity
Citation: Bihn EA, Mangione KJ, Lyons B, Wszelaki AL, Churey JJ, Stoeckel DM and Worobo RW (2021) Development of an Irrigation Water Quality Database to Identify Water Resources and Assess Microbiological Risks During the Production of Fresh Fruits and Vegetables. Front. Water 3:741653. doi: 10.3389/frwa.2021.741653
Received: 15 July 2021; Accepted: 23 September 2021;
Published: 01 November 2021.
Edited by:
Daniel Lowell Weller, SUNY College of Environmental Science and Forestry, United StatesReviewed by:
Achyut Adhikari, Louisiana State University, United StatesCameron Bardsley, Virginia Tech, United States
Copyright © 2021 Bihn, Mangione, Lyons, Wszelaki, Churey, Stoeckel and Worobo. This is an open-access article distributed under the terms of the Creative Commons Attribution License (CC BY). The use, distribution or reproduction in other forums is permitted, provided the original author(s) and the copyright owner(s) are credited and that the original publication in this journal is cited, in accordance with accepted academic practice. No use, distribution or reproduction is permitted which does not comply with these terms.
*Correspondence: Elizabeth A. Bihn, RWFiMzhAY29ybmVsbC5lZHU=
†Retired