 Kevin A. Grady
 Liang Chen
 Trent W. Ford
- Climate and Atmospheric Science Section, Illinois State Water Survey, Prairie Research Institute, University of Illinois at Urbana-Champaign, Champaign, IL, United States
Spring and summer precipitation are both important factors for agricultural productivity in the Midwest region of the United States. Adequate summer precipitation, particularly in the reproductive and grain fill stages in July and August, is critical to corn and soybean success. Meanwhile, excessive spring precipitation can cause significant planting delays and introduces challenges with weed and pest management, and soil erosion and compaction. However, uncertainty especially in future summer precipitation changes, translates to uncertainties in how the joint distributions of spring and summer precipitation are expected to change by mid- and late-century across the Midwest. This study examines historical and projected changes in the characteristics of spring and summer precipitation in the Midwest using 12 dynamically downscaled simulations under the high-emission representative concentration pathway (RCP 8.5) from the NA-CORDEX project. Historical increases in spring precipitation and precipitation intensity are projected to continue into the mid- and late-century across the region, with strong model agreement. By comparison, projected changes in Midwest summer precipitation are more modest than for spring and have much less model agreement. Despite a projected three- to four-fold increase in the frequency of wet springs by late-century, relative to the model ensemble historical average, the lack of substantial and robust projected change in summer precipitation results in only a small increase in the risk of dry summers following wet springs in the Midwest by mid- and late-century.
Introduction
The Midwest region of the United States is an area crucial to the nation's production of corn and soybeans. Seven Midwest states—Iowa, Illinois, Minnesota, Indiana, Ohio, Missouri, and Wisconsin—rank among the top 10 for corn harvested for grain (National Agricultural Statistics Service, 2021), and six Midwest states—Illinois, Iowa, Minnesota, Indiana, Missouri, and Ohio—are also in the top 10 for soybean production (National Agricultural Statistics Service, 2021). Altogether, the Midwest produced over 9 billion bushels of corn and over 2.6 billion bushels of soybeans in 2020, accounting for about 64% of the yearly total produced for each crop in the United States. Corn production in the Midwest United States alone falls between the total corn production of China and Brazil, the second and third highest corn-producing countries (Foreign Agricultural Service, 2021).
The distribution of precipitation throughout the growing season can have a significant impact on corn and soybean production in the Midwest. Both corn and soybean yields tend to be positively correlated with summer precipitation (Goldblum, 2009; Liu and Basso, 2020), especially in July and August, during critical reproductive stages of corn and soybeans, respectively (El Mourid et al., 1986; Hatfield et al., 2018). Therefore, precipitation in July and August tends to be a strong predictor of end-of-season yield in both corn and soybeans across the Midwest (Hu and Buyanovsky, 2003; Westcott et al., 2005), such that drought in mid- to late-summer typically results in below-trend corn and soybean yields (Mishra and Cherkauer, 2010). Concurrently, excessive precipitation in the spring can have a negative impact on Midwest corn and soybeans. This is particularly the case with excessively wet conditions in April and May, which can delay fieldwork and planting, reduce flexibility for pre- and post-emergence herbicide application, discourage deep root growth, increase pressure from disease, weeds, and insect pests, and increase the risk of soil compaction (Hatfield et al., 2018; Daigh et al., 2020; Winsor, 2020). Urban et al. (2015) found that an extremely wet spring can reduce yields by 10% in Iowa, Illinois, and Indiana.
Given the negative impacts of both excessively wet springs and excessively dry summers on Midwest crop production, years with consecutive wet springs and dry summers are of great concern for Midwest producers. Climate model projections indicate Midwest spring precipitation will increase throughout the twenty-first century (Swain and Hayhoe, 2015; Byun and Hamlet, 2018; Bukovsky and Mearns, 2020), which is in line with historical spring precipitation trends across the Midwest. In northern Illinois, for example, April–May precipitation has increased by 4.6 mm per decade since 1895 and has increased 6.9 mm per decade since 1950 (NOAA NCEI, 2011). However, the picture is less clear for future changes in summer precipitation by mid- and late-century. While July–August precipitation has increased over the past 125 years across much of the Midwest, recent studies project decreased summer precipitation across all or part of the Midwest (Winkler et al., 2012; Byun and Hamlet, 2018; Gautum et al., 2021). Summer precipitation projections often come with more uncertainty than their corresponding springs due to poorer summertime ensemble agreement (Byun et al., 2019). Bukovsky and Mearns (2020) found in their models for North American summer precipitation “consistent inconsistency within regions and across the ensemble in the sign of the precipitation projections.” The ensemble changes in summer precipitation tend to be smaller than the ensemble changes in spring precipitation as well.
Uncertainty in future summer precipitation changes in the Midwest translates to uncertainties in how the joint distributions of spring and summer precipitation are expected to change. For example, Ford et al. (2021) found transitions from extremely wet to extremely dry conditions on subseasonal to seasonal timescales were occurring both more quickly and more frequently in recent decades in parts of the central and southern Midwest. Christian et al. (2015) found increasing interannual variability in recent decades, resulting in a higher likelihood of a significant wet year following a significant drought year in the central United States.
Given the importance of spring and summer precipitation for agriculture in the Midwest, it is crucial to gain a better understanding of how spring and summer precipitation patterns are projected to simultaneously change across the Midwest, and how these changes are expected to affect Midwest agriculture. By employing a suite of climate models, we estimate the projected changes in spring and summer precipitation, and examine how the frequency of wet springs, dry summers, and combinations of the two are expected to change in coming decades.
Data
To examine the projected changes in these precipitation patterns, we employ 12 model combinations from the North America Coordinated Regional Downscaling Experiment (NA-CORDEX) (Mearns et al., 2017). North America Coordinated Regional Downscaling Experiment provides dynamically downscaled climate simulations at spatial resolutions of 50 and 25 km over a domain covering most of North America from multiple regional climate models (RCMs), which are driven by the output of different global climate models (GCMs) from the Coupled Model Intercomparison Project-Phase 5 (CMIP5). In this study, we use the NA-CORDEX simulations at a spatial resolution of 25 km. Table 1 shows the details of the available 12 GCM-RCM combinations used in our analysis. There are seven GCMs (CanESM2, GEMatm-Can, GEMatm-MPI, GFDL-ESM2M, HadGEM2-ES, MPI-ESM-LR, and MPI-ESM-MR) used as lateral boundary conditions for four RCMs (CanRCM4, CRCM5-UQAM, RegCM4, and WRF). Among the seven GCMs, GEMatm-Can and GEMatm-MPI have bias-corrected sea ice and sea-surface temperatures (SSTs) from a separate GCM simulation (Hernández-Díaz et al., 2019). Therefore, the boundary conditions GEMatm-Can (or GEMatm-MPI) include the atmospheric fields from CanESM2 (or MPI-ESM-MR) and the bias-corrected SSTs. Among the four regional models, both CanRCM4 and CRCM5-UQAM are Canadian Regional Climate Model. The former is version 4 developed in Canadian Center for Climate Modeling and Analysis, and the latter is version 5 developed in Université du Québec à Montréal. Daily precipitation is obtained from the 12 GCM-RCM downscaling simulations for the historical period (1950–2005) and the Representative Concentration Pathway 8.5 (RCP 8.5) future period (2006–2100). The RCP8.5 represents a high-emission scenario. It allows us to examine the precipitation changes under the worst-case scenario of climate change. The RCP4.5 scenario, which represents mid-range emissions, is only available for very limited simulations at a spatial resolution of 25 km, and therefore not included in our analysis. It also should be noted that we use the raw downscaling output in this study because of the recently reported errors in its bias-corrected data (McGinnis, 2021).
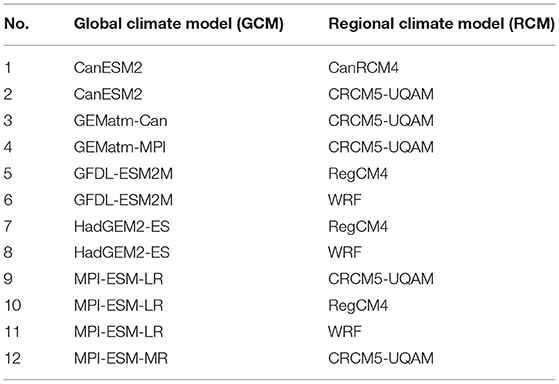
Table 1. The 12 NA-CORDEX GCM-RCM combinations used in this study.
We investigate changes in both spring (April–May) and summer (July–August) precipitation characteristics. We focus on April and May for spring and July and August for summer because excessive (deficient) rainfall in April–May (July–August) is associated with negative impacts to both corn and soybean yields in the Midwest (Westcott et al., 2005; Hatfield et al., 2018). Specifically, spring and summer precipitation is characterized by four metrics: (1) total seasonal precipitation, (2) the simple daily intensity index (SDII), (3) the number of heavy precipitation days in a season, (4) and the number of dry days in a season. Total precipitation is calculated from all days, including those with non-zero totals that are <2.5 mm. A heavy precipitation day is one in which at least 25 mm of precipitation is observed, and a dry day is one in which <2.5 mm is observed. Conversely, we define a wet day as one in which 2.5 mm or more of precipitation is observed, and the SDII is the average precipitation that falls on wet days during a season. We also employ three different versions of the dry day metric. While the seasonal total number of dry days is the one primarily used, we also consider both the average and maximum dry spell length in a season in later sections, where a dry spell is a period of consecutive dry days.
Verification of the NA-CORDEX simulation ensemble is done using gridded precipitation observations from the National Oceanic and Atmospheric Administration Monthly United States Climate Divisional Database (NClimDiv, Vose et al., 2014). The NClimDiv historical record covers the period 1951 through the present and contains precipitation data interpolated to 5-km grids spanning the contiguous United States. For comparison, the NClimDiv data is upscaled to the NA-CORDEX spatial resolution. The study area, defined as the Midwest United States, spans 35.5° and 48°N latitude and 83° and 95°W longitude.
Results
Precipitation Climatology and NA-CORDEX Validation
Figure 1 shows the upscaled spring and summer NClimDiv observed precipitation climatology across the Midwest during the period 1951–2005. Total spring precipitation follows a strong south-to-north gradient across the region, ranging from nearly 300 mm in western Kentucky to <120 mm in northern Minnesota. Spring precipitation intensity—represented by both SDII and the frequency of heavy precipitation days—are also highest in the southern Midwest and lowest in the northern Midwest. Specifically, parts of southern Missouri and western Kentucky experience, on average, 3–4 heavy precipitation days (>25 mm) per spring season, while much of Minnesota, Wisconsin, and Michigan experience fewer than one heavy precipitation day on average in spring. Conversely, the northern Midwest experiences more dry days in spring, 45–50 in Minnesota, Wisconsin, and Michigan, compared with 40–45 dry days in Indiana, Ohio, and Kentucky.
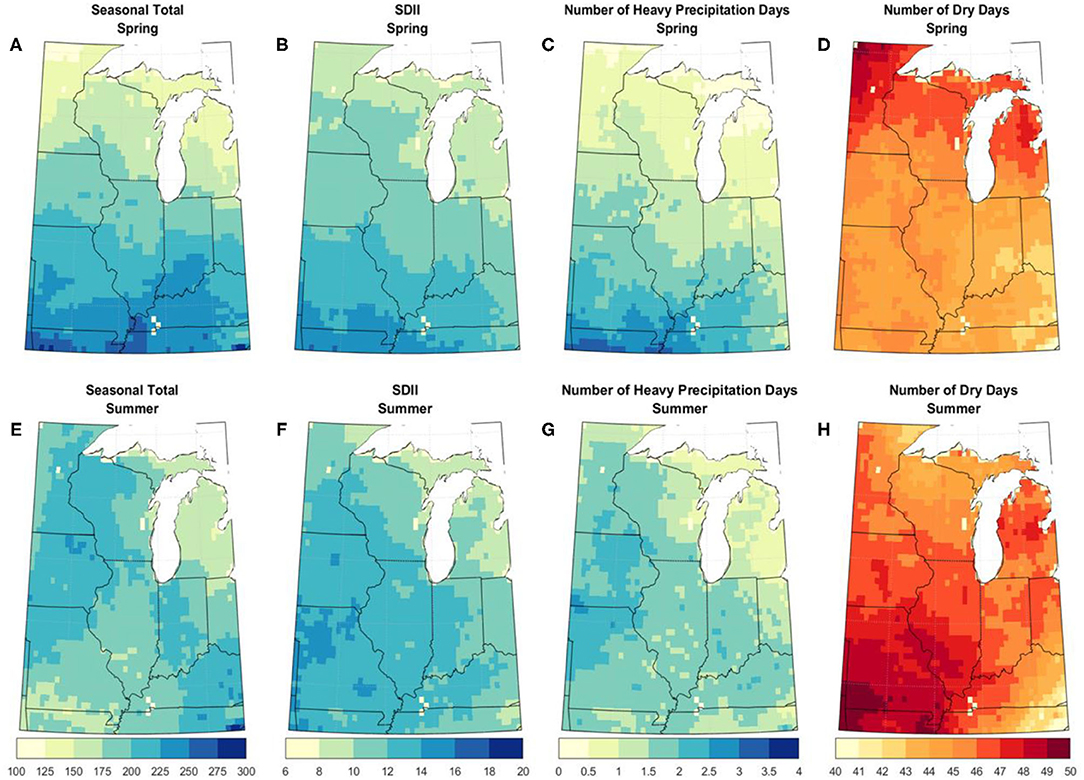
Figure 1. The upscaled NClimDiv spring and summer climatology for the seasonal precipitation totals [(A,E), mm], SDII [(B,F), mm day−1], seasonal number of heavy precipitation days [(C,G), days], and seasonal number of dry days [(D,H), days] for the historical period 1951–2005.
Summer precipitation characteristics are less spatially coherent than in spring. Summer tends to be wetter in the western and southeastern Midwest, with totals ranging from nearly 250 mm in parts of Iowa and Kentucky to <150 mm in Michigan (Figure 1). The patterns of precipitation intensity and dry day frequencies in the summer distinguish multiple, diverse summer precipitation regimes in the Midwest. Specifically, the southwest quadrant of the Midwest experiences both highest summer SDII (i.e., highest precipitation intensity) and highest dry day frequency. For example, parts of northwest Missouri experience, on average, among the highest rates of both heavy precipitation days (2–3) and dry days (48–50) in the summer. This implies the southwest Midwest experiences highly variable summer precipitation climatology, with prolonged dry periods broken up by intense precipitation. In contrast, the areas adjacent to Lake Superior, including parts of Minnesota, Wisconsin, and Michigan, experience relatively low frequencies of both heavy precipitation days (0.5–1.5) and dry days (43–45) per summer. This pattern suggests a more consistent, less intense summer precipitation climatology in the northern part of the Midwest.
We compare the NClimDiv observed data with the NA-CORDEX multi-model ensemble median during the 55-year period 1951–2005. Figure 2 shows the median of differences from this comparison. The NA-CORDEX simulations exhibit a wet bias across most of the region in spring of about 25–50 mm, or approximately 10–20% of the regionally averaged observed spring precipitation climatology (Figure 2A). The largest biases can be seen in the southwest and northeast parts of the Midwest, where the multi-model ensemble median shows spring precipitation totals that are 50–75 mm greater than the observed climatology (15–25% of historical climatology). The simulations exhibit slightly higher spring precipitation intensity than the observed climatology across the Midwest, especially in the Great Lakes region, with SDII biases mostly <2 mm (Figure 2B) and 1 or fewer additional heavy precipitation days (Figure 2C). The models produce 1–4 fewer dry days than observed across virtually the entire Midwest (Figure 2D).
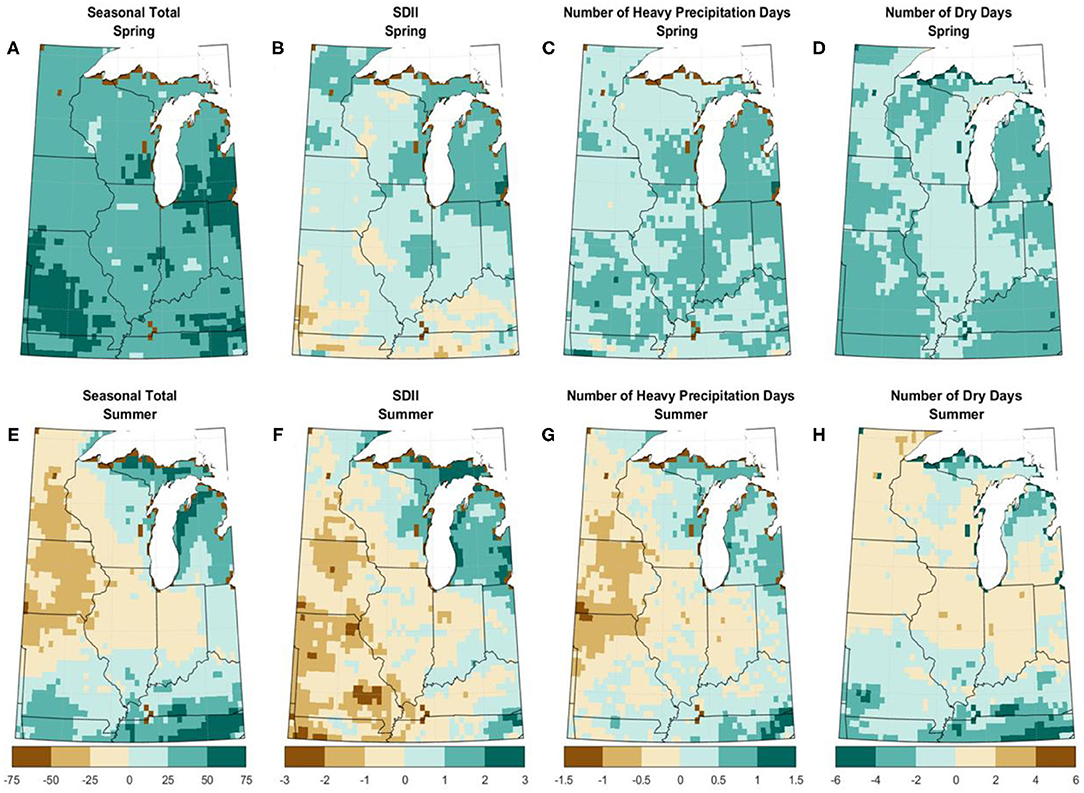
Figure 2. The NA-CORDEX multi-model ensemble median error when compared with the upscaled NClimDiv observed climatology for the spring and summer over the historical period 1951–2005. Shown are the results for the seasonal precipitation totals [(A,E), mm], SDII [(B,F), mm day−1], seasonal number of days with heavy precipitation [(C,G), days], and seasonal number of dry days [(D,H), days].
The simulations show a dry bias in summer in the western Midwest of 10–50 mm, 10–25% of the regionally averaged observed summer precipitation climatology, and a wet summer bias of similar magnitude in the northeast and southeast Midwest (Figure 2E). The simulations also show lesser summer precipitation intensity outside of Michigan and parts of Ohio and Kentucky, with SDII biases between 1 and 2.5 (Figure 2F). Simulations produce 1–1.5 fewer (additional) heavy precipitation days in the western Midwest (Michigan) (Figure 2G), and generally have 1–2 additional summer dry days across the region (Figure 2H).
The performance of NA-CORDEX model combinations in simulating spring and summer Midwest precipitation are summarized in Table 2. The region-average mean absolute error (MAE) of spring season total precipitation is 45.1 mm, representing approximately 20% of the observed climatological spring totals. Region-average summer total precipitation MAE was 22.2 mm, between 11 and 12% of the observed climatological summer total. Despite the relatively high differences in spring, the simulations do a good job representing the spatial gradient of spring precipitation (spatial correlation of 0.97). Comparatively, simulation underestimation (overestimation) of summer precipitation in the western (eastern) Midwest (e.g., Figure 2) results in a low summer precipitation spatial correlation of 0.13. The NA-CORDEX simulations do a better job representing spring and summer precipitation intensity (SDII) and dry day frequency, with MAE representing <7% of the observed climatology and spatial correlations ranging from 0.70 to 0.95. The MAE values of both spring and summer heavy precipitation day frequency are <0.5 day. However, while the simulations capture the spatial gradient of heavy precipitation days in the spring (spatial correlation of 0.95), their performance in the summer is lacking (spatial correlation of 0.21).
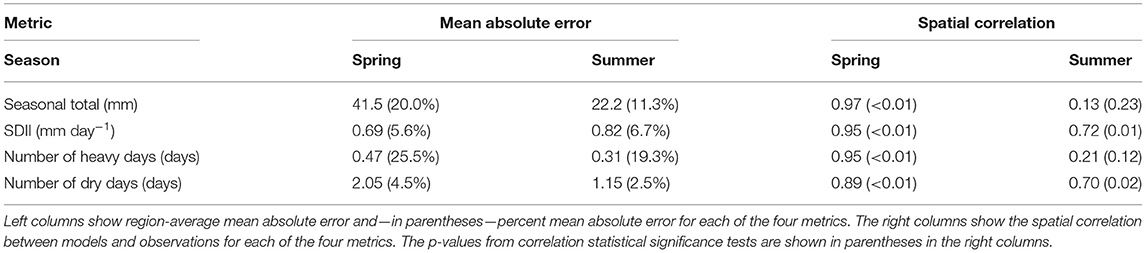
Table 2. Model validation summary statistics.
Projected Changes in Spring Precipitation
Our investigation of projected changes in spring and summer Midwest precipitation focuses on three 30-year periods: historical 1976–2005, mid-century 2030–2059, and late century 2070–2099. We compare projections from RCP 8.5 to the model historical period to characterize projected changes in both spring and summer precipitation. Comparison of the NA-CORDEX multi-model ensemble median projections for mid- and late-century spring precipitation with the historical period reveals several noteworthy patterns. Overall, total precipitation, precipitation intensity (SDII), and the frequency of heavy precipitation days in April and May are all projected to increase across the Midwest.
The largest increases in both total spring precipitation and spring precipitation intensity by the late-century are in the western parts of the Midwest, ranging from 50 to 80 mm of additional spring precipitation west of the Mississippi River, representing a 25–50% increase relative to the model historical baseline. The simulations show good agreement in increasing spring precipitation by mid-century for most of the Midwest outside of southeast Wisconsin and northern Michigan (Figures 3A–C), while agreement is strong across the entire region for increases by late-century (Figures 3D–F). Projected increases in precipitation intensity, both SDII and heavy precipitation day frequency, by mid-century are robust across most of the Midwest region (Figures 3B,C). Meanwhile, there is widespread agreement across the entire Midwest for late-century projected increases in both precipitation intensity metrics (Figures 3E,F). Late-century projections indicate increased SDII by 1–4 mm region-wide and an additional 1–2 spring heavy precipitation days, with the largest projected increases in the southern and western halves of the region.
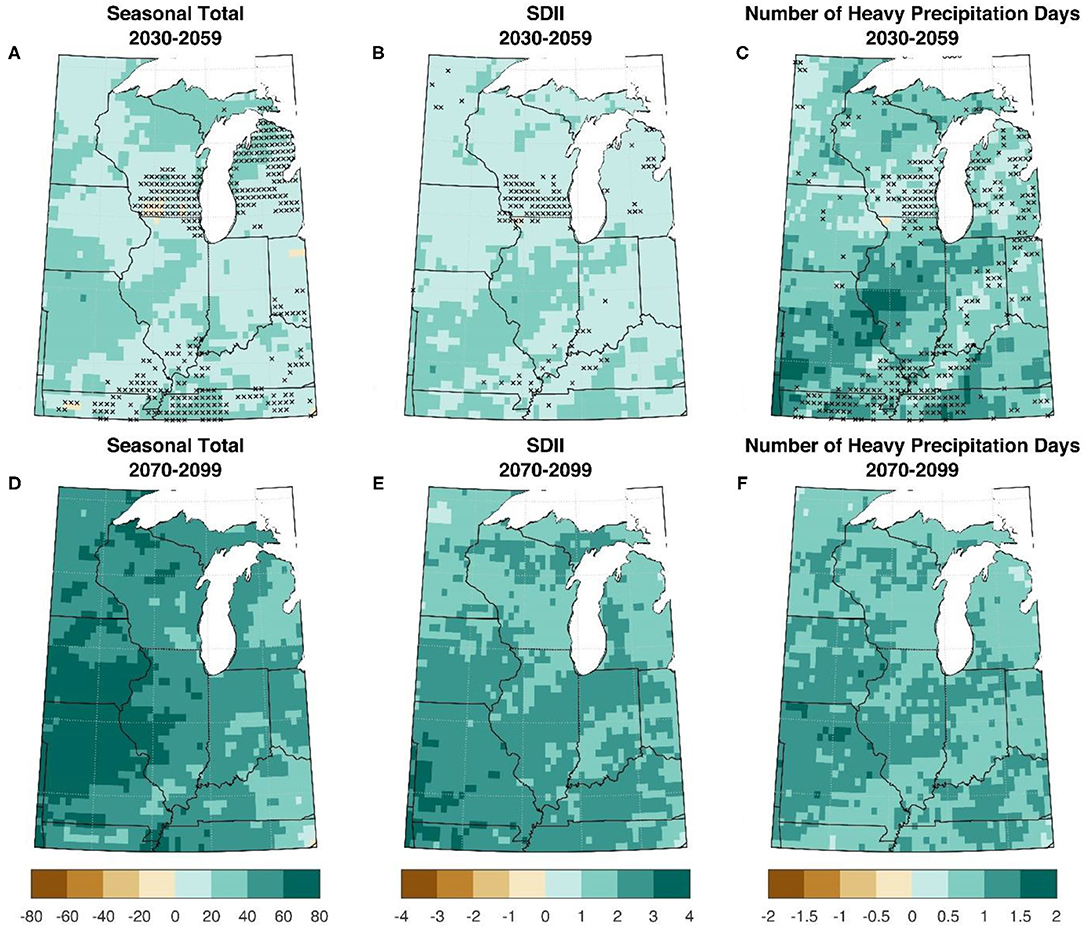
Figure 3. Projected changes in the 30-year spring climatology of the NA-CORDEX multi-model ensemble median in mid- (2030–2059) and late-century (2070–2099), relative to the model historical period (1976–2005). Maps show the seasonal precipitation totals [(A,D), inches], SDII [(B,E), mm day−1], and heavy precipitation day frequency [(C,F), days]. Stippling represents areas where fewer than 9 of the 12 simulations agreed on the sign of the change.
Coinciding with projected increases in April–May precipitation and precipitation intensity across the Midwest, projections indicate overall decreases in the frequency of dry days and length of dry spells in spring (Figure 4). There is a distinct spatial gradient, however, in both the average and maximum dry spell lengths in projections for both mid- and late-century. Namely, the multi-model mean shows slight (0.3–1 day per year) increases in the average and maximum dry spell lengths across the southeast Midwest, while most of the northwest quadrant of the Midwest exhibits decreased average and maximum dry spell lengths of 0.5–2 days per year by mid-century. The simulations do not show good agreement in mid-century projections of changes in dry days or dry spell length (Figures 4A–C). Meanwhile, late-century projections of decreases in spring dry days and dry spell length are more widespread, more robust, and of larger magnitude (Figures 4D–F). Namely, the average dry spell length is projected to decrease by 0.5 to over 2 days by late century, with the largest changes in northern Wisconsin and Minnesota. Overall, we find good agreement in both mid- and late-century projections of increased spring precipitation and precipitation intensity across the Midwest.
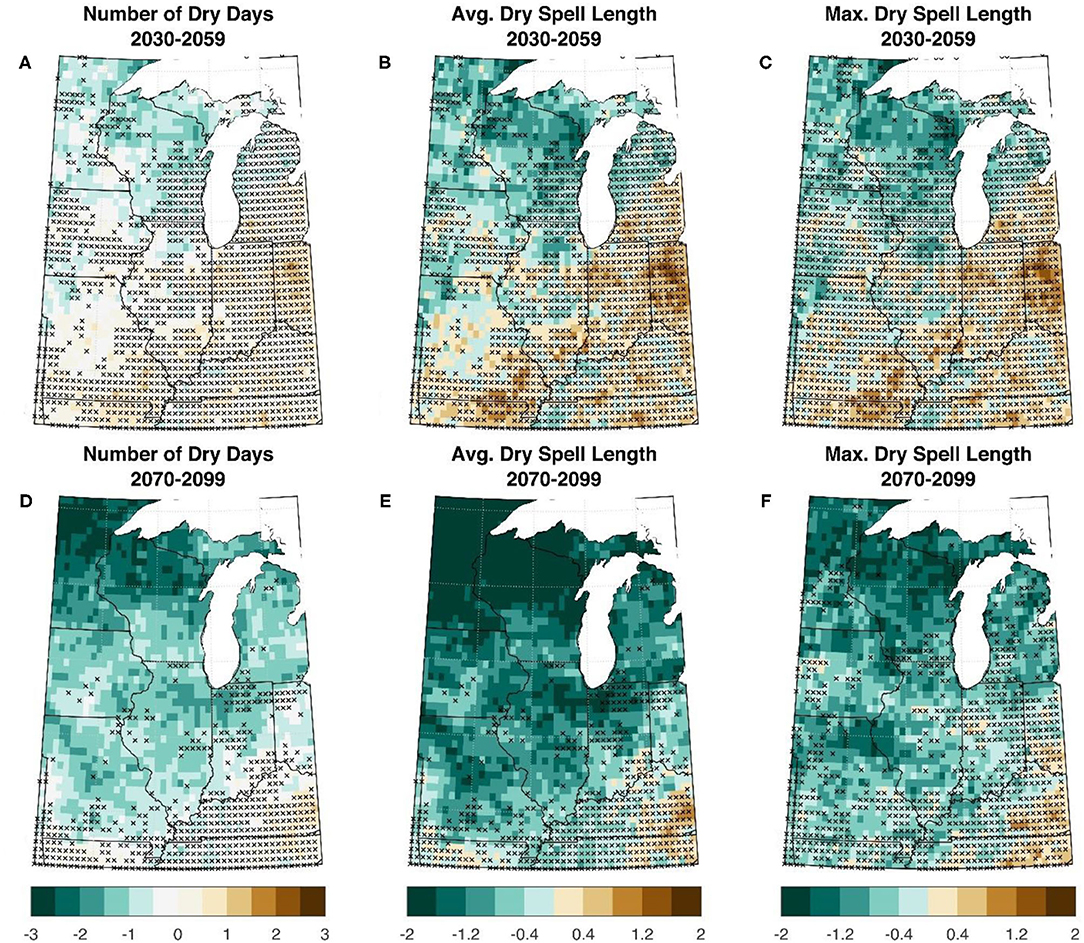
Figure 4. The projected change in the 30-year spring climatology of the NA-CORDEX multi-model ensemble median in mid- (2030–2059) and late-century (2070–2099), relative to the model historical period (1976–2005). Shown are the number of dry days (A,D), the average dry spell length (B,E), and the maximum dry spell length (C,F). Stippling represents areas where fewer than 9 of the 12 simulations agree on the sign of the change.
Projected Changes in Summer Precipitation
We compare projected summer precipitation metrics in the mid- and late-century to the model historical period (Figure 5). Projected changes in summer precipitation and precipitation intensity are more variable in both sign and strength and exhibit more spatial variability than spring projections. Ensemble median projections indicate 10–30 mm decreases in summer precipitation across most or parts of Missouri, Illinois, Indiana, Michigan, and Ohio, and increased precipitation of the same magnitude in the northwest and southeast Midwest (Figure 5A). Meanwhile, late-century projections show more widespread 10–40 mm increases in summer precipitation across the Midwest (Figure 5D). However, projections of modest increases or decreases in total summer precipitation and precipitation intensity by mid- and late-century are overwhelmed by the lack of simulation agreement. As indicated by widespread stippling in Figure 5 maps, agreement in the projected sign of summer precipitation and precipitation intensity change was low across most of the Midwest. The lone exception is for late-century projected increases in summer SDII on the order of 1–2.5 mm, which are robust for much of the northwest Midwest (Figure 5E).
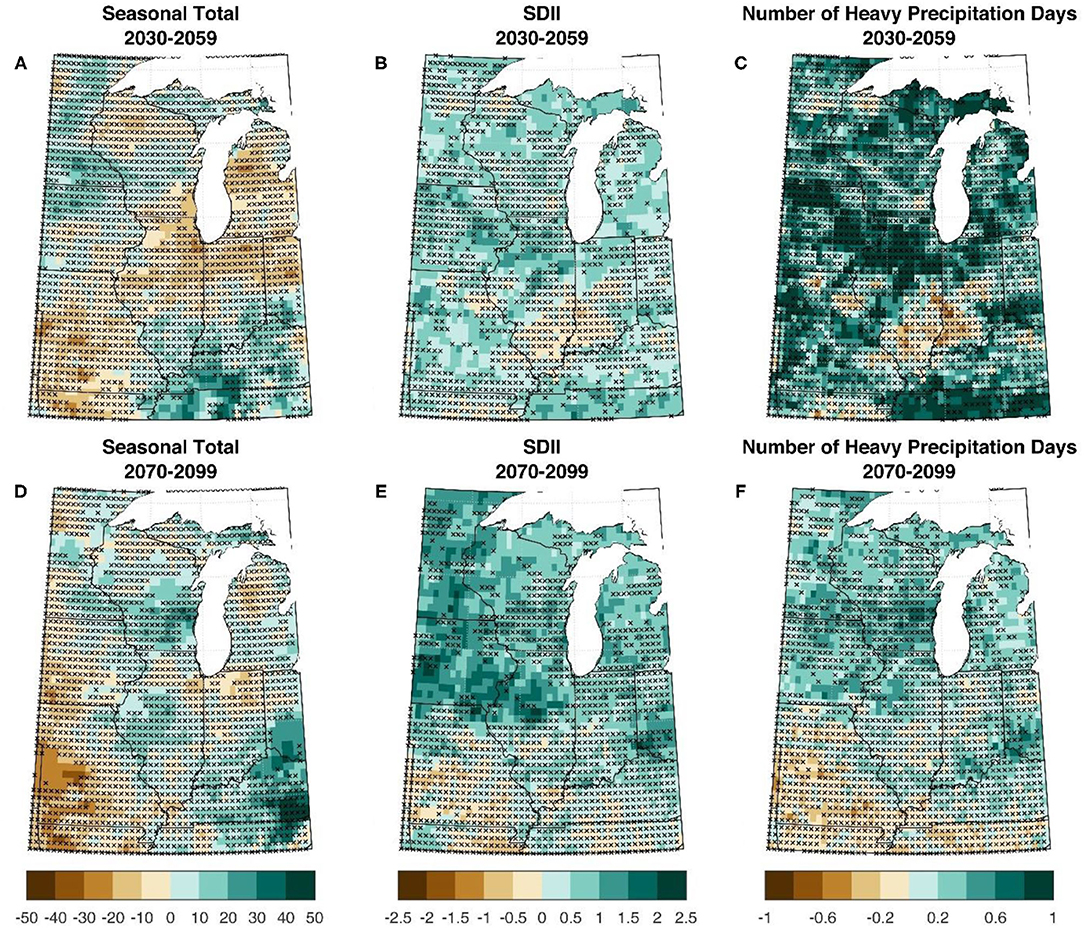
Figure 5. The projected change in the 30-year summer climatology of the NA-CORDEX multi-model ensemble median in mid- (2030–2059) and late-century (2070–2099), relative to the model historical period (1976–2005). Shown are the seasonal precipitation totals [(A,D), mm], SDII [(B,E), mm day−1], and the number of heavy precipitation days [(C,F), days]. Stippling represents areas where fewer than 9 of the 12 simulations agree on the sign of the change.
Simulations indicate an increase of 1–3 additional summer dry days by mid- and late-century in the northern and western Midwest, with more modest projections of <1 fewer summer dry day in the southern Midwest (Figure 6). Mid- and late-century projections also show increased dry spell length, particularly in the northern and western Midwest. However, like summer precipitation and intensity projections, agreement for summer dry day frequency and dry spell length is low across the region.
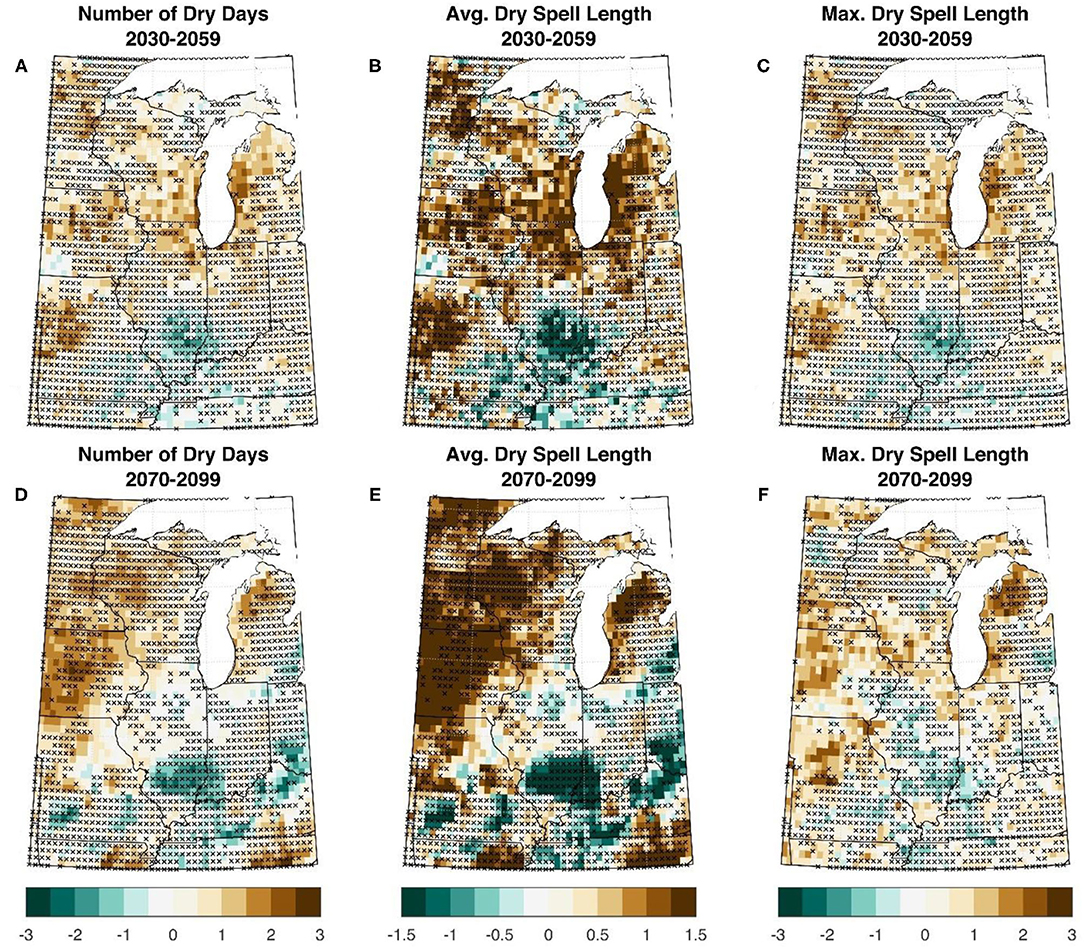
Figure 6. The projected change in the 30-year summer climatology of the NA-CORDEX multi-model ensemble median in mid- (2030–2059) and late-century (2070–2099), relative to the model historical period (1976–2005). Shown are the number of dry days (A,D), the average dry spell length (B,E), and the maximum dry spell length (C,F). Stippling represents areas where fewer than 9 of the 12 simulations agreed on the sign of the projected change.
We compare individual model projected changes in region-wide summer precipitation characteristics to better understand the lack of consistency between models. Each simulation's mid- and late-century projections of region-wide summer total precipitation, SDII, and heavy precipitation days (Figure 7) along with total dry day frequency and average and maximum dry spell lengths (Figure 8) are compared to that simulation's historical values using a two-sample t-test. Projected changes are considered statistically significant at the 95% confidence level. Only 7 of the 12 simulations project increases in region-wide summer precipitation by mid- and late-century, although 5 of the 7 late-century projections are significantly different from the model historical climatology (Figures 7A,B). In general, the simulations are a bit more consistent in projected increases in summer SDII, with at least 9 of 12 projecting increased SDII by mid- and late-century. Five simulations project significant increases in SDII by mid- and late-century (Figures 7C,D). Projected changes in region-wide spring precipitation have considerably stronger agreement between simulations compared to those for summer (Supplementary Figure 1). All 12 simulations show significant increases in total spring precipitation, spring SDII, and the frequency of spring heavy precipitation days by late-century (Supplementary Figure 1).
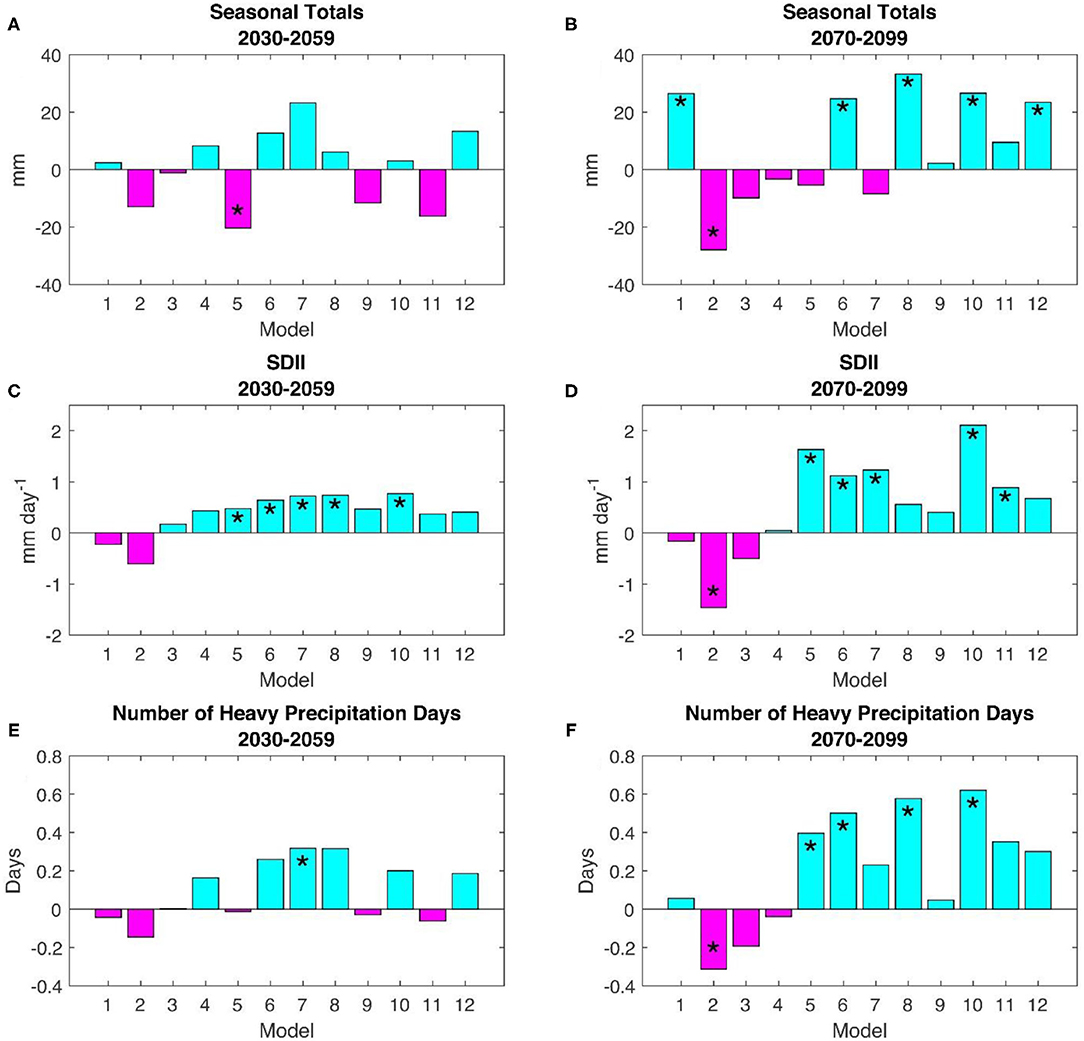
Figure 7. The projected changes in the 30-year, regionally averaged summer climatologies for each NA-CORDEX model in mid- (2030–2059) and late-century (2070–2099), relative to the model historical period (1976–2005). Shown are the seasonal precipitation totals [(A,B), mm], SDII [(C,D), mm day−1], and the number of heavy precipitation days [(E,F), days]. Model numbers are the same as in Table 1. Asterisks indicate models where the regional change was statistically significant at the 5% level.
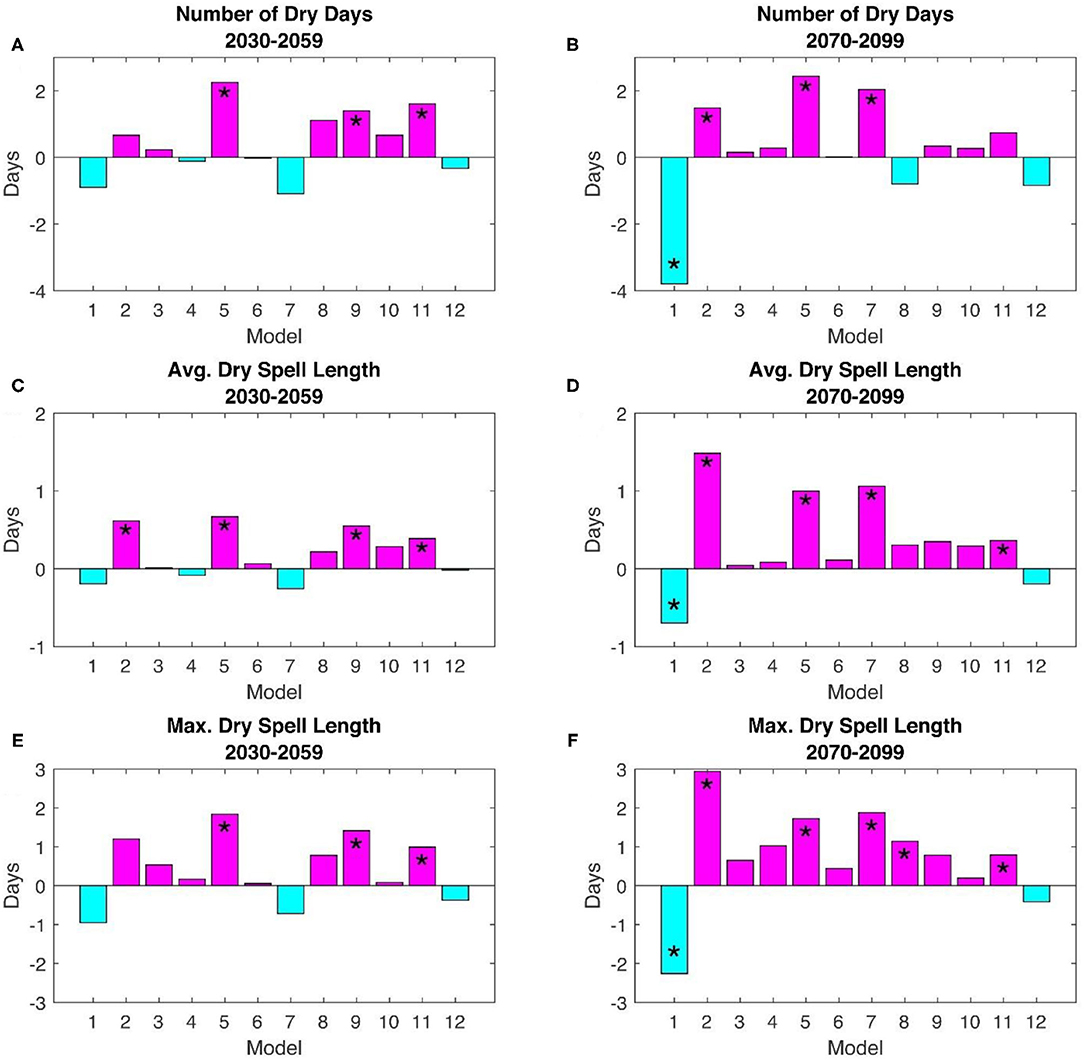
Figure 8. The projected changes in the 30-year, regionally averaged summer climatologies for each NA-CORDEX model in mid- (2030–2059) and late-century (2070–2099), relative to the model historical period (1976–2005). Shown are the number of dry days (A,B), average dry spell length (C,D), and the maximum dry spell length (E,F). Model numbers are the same as in Table 1. Asterisks indicate models where the regional change was statistically significant at the 5% level.
Late-century projections of summer dry days and dry spell length have a bit more agreement between models than mid-century for the Midwest region (Figure 8). Disregarding whether the projected change is statistically significant or not, only 3 of the 12 simulations project decreased dry day frequency and 2 out of 12 project decreased average or maximum dry spell length by late-century (Figures 8D,F). This compares to five simulations that project decreased dry day frequency and four simulations that project decreased dry spell length by mid-century. Late-century projections of spring dry days and dry spell length show better agreement between simulations than those for summer (Supplementary Figure 2). Only 1 out of 12 simulations show increased spring dry days, average dry spell length, and maximum dry spell length (Supplementary Figure 3).
Region-wide projected changes in summer precipitation characteristics, including totals, frequency, and intensity, are more consistent between the 12 NA-CORDEX model combinations than when comparing projections locally; and agreement on the sign of summer precipitation change tends to increase from mid- to late-century projections. Overall, most simulations project increased summer precipitation in the Midwest region by mid- and late-century, but with a higher frequency of dry days and longer average and maximum dry spell lengths. Taken together, the projections indicate a wetter, but more variable Midwest summer precipitation climatology throughout the remainder of the twenty-first century.
Changing Risk of Wet Spring-Dry Summer Seasons
Projections of continued increases in April and May precipitation and concurrent (albeit less consistent) increased July and August precipitation variability imply the potential risk of more frequent excessively wet springs followed by dry summers. We investigate the joint changes to spring and summer Midwest precipitation in the Midwest in more detail. Specifically, we examine how the frequency of years with both wet springs and dry summers is projected to change through the end of the century. We examine the difference between each season's precipitation total and the corresponding historical average at each grid point. Spring seasonal precipitation totals at a particular grid point that are at least 1.3 standard deviations above the historical average at that point will be considered wet. Likewise, summer totals that are at least 1.3 standard deviations below the historical average at a point will be considered dry. The 1.3 standard deviation threshold is commonly used to denote severe drought, as in the U.S. Drought Monitor (Svoboda et al., 2002), and has been used in past studies to represent both severe dryness and wetness (e.g., Ford et al., 2021).
Figure 9 shows the occurrences of wet springs, dry summers, and years with both in the observed NClimDiv data during the 30-year period 1976–2005. Although there is quite a bit of spatial variability, in general the frequency of wet springs outweighs that of dry summers in the Midwest. The region-wide average number of wet springs was 5.6, or 1 in every 5–6 years over the 30-year historical period, while the average number of dry summers was 3.2, or 1 in every 9–10 years. However, dry summers rarely follow wet springs in the Midwest, and most areas did not experience a wet spring to dry summer transition between 1976 and 2005. With that said, a small region in southern Illinois and Indiana has experienced between 2 and 4 of these events in the 30-year historical period. This is also a region shown by Ford et al. (2021) to have an increasing propensity for wet-to-dry transitions on subseasonal timescales over the past several decades.
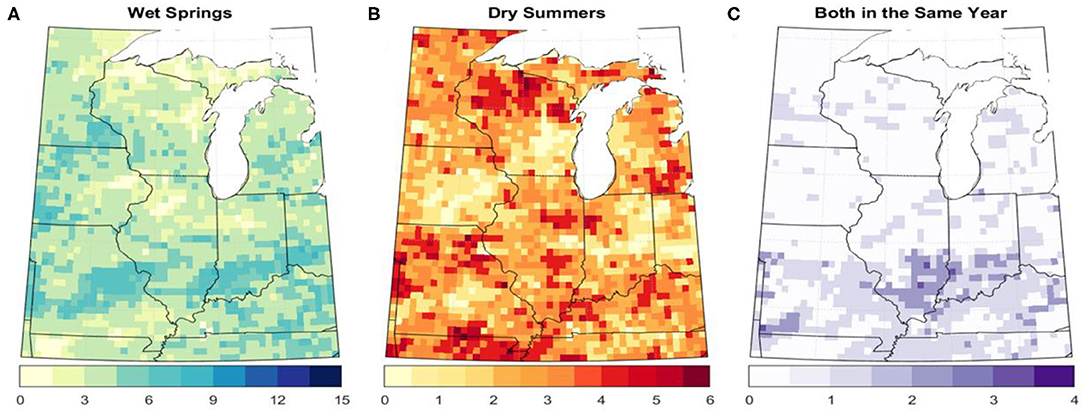
Figure 9. Observed historical (1976–2005) frequency of wet springs (A), dry summers (B), and years with adjacent wet springs and dry summers (C). The thresholds used to identify wet springs and dry summers were calculated using the data from 1951 to 2005.
Compared with the historical observations, NA-CORDEX model combinations produce far fewer historical wet springs (Figure 10A) and slightly fewer historical dry summers (Figure 10D). For the simulations, the region-wide average number of historical wet springs is around 3.2, and the average number of historical dry summers is around 2.5, compared with 5.6 and 3.2 for the NClimDiv data, respectively. Analysis of the individual model ensemble members revealed none of the members produced wet spring frequency equal to or exceeding that in the observations. These discrepancies could be partly attributed to the lower interannual variability in spring precipitation in the simulations relative to the observations. When averaged across all simulations and the entire study region, the simulated standard deviation of spring precipitation during the historical (1951–2005) period represents 27% of the simulated mean total spring precipitation. Meanwhile, the observed standard deviation of spring precipitation represents 36% of the mean total, implying overall more interannual variability in the observations than the simulations. Due to the relative dearth of wet springs in the simulations, there are virtually no years with both wet springs and dry summers anywhere in the Midwest during the model historical period (Figure 10G).
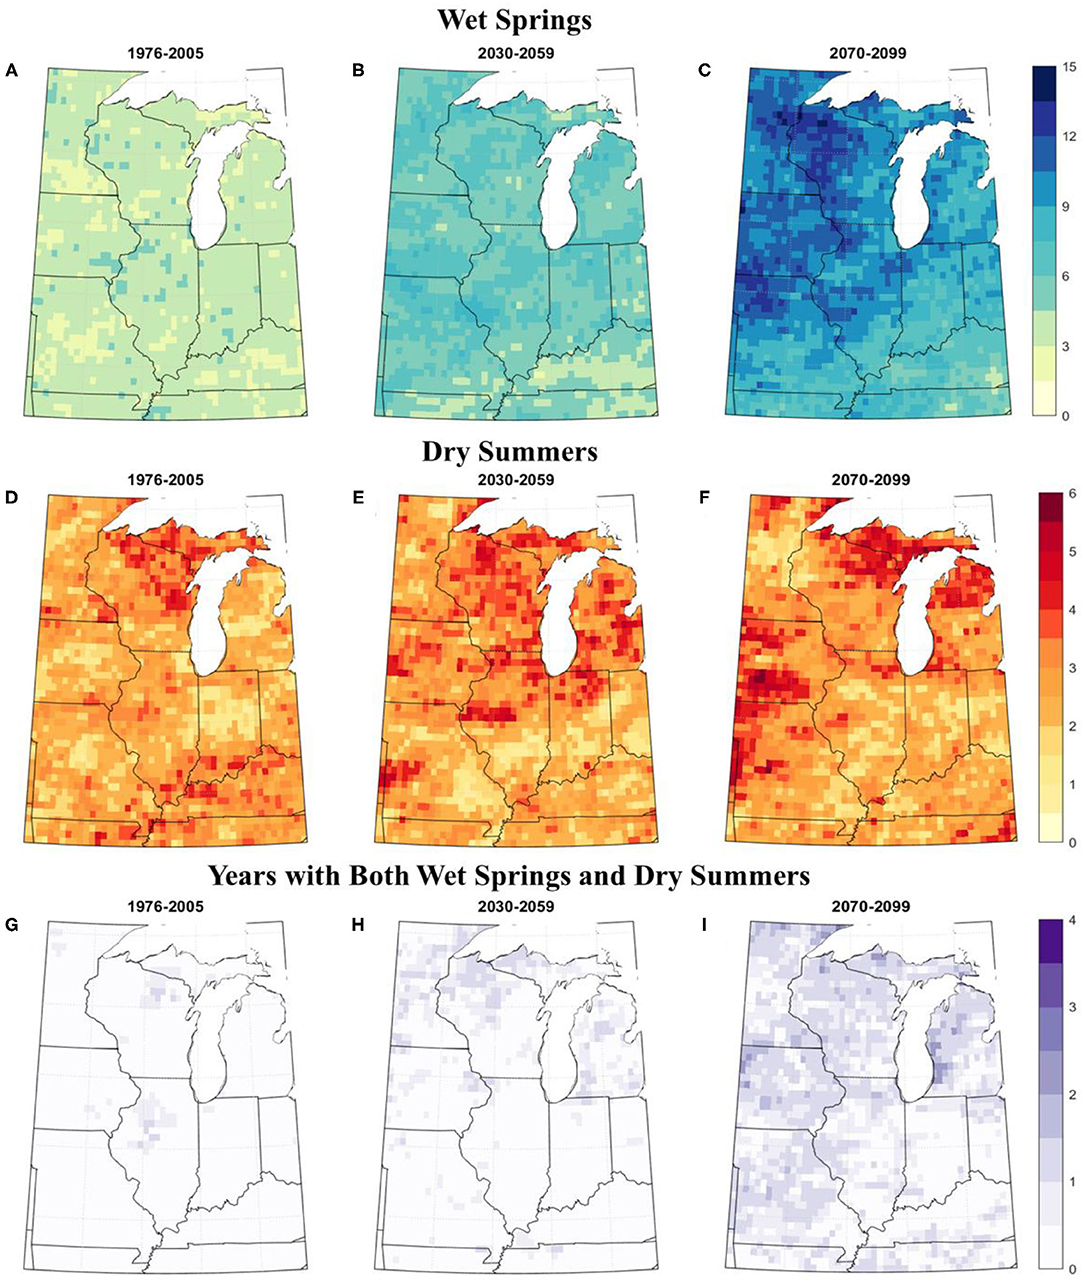
Figure 10. The number of wet springs (A–C), dry summers (D–F), and years with both (G–I) during each period based off the multi-model ensemble median seasonal totals for the NA-CORDEX historical period 1950–2005.
The projected frequency of wet springs increases to a regional average of 7 springs for the 30-year mid-century period and 12 springs for the 30-year late-century period (Figures 10B,C). Meanwhile, the frequency of dry summers is projected to increase only in the far western and northern Midwest, by 2–3 summers for the 30-year mid-century and late-century periods (Figures 10E,F). Despite the sizeable projected increase in wet spring frequency, the modest projected change in summer precipitation limits projected wet-spring to dry-summer years to 1 additional for the 30-year late-century period (Figures 10H,I).
Excessively wet springs can cause significant impacts to agriculture, irrespective of conditions in the following summer. The Midwest experienced one such year in 2011, when persistent rains across the Midwest caused damaging floods, saturated soils, and significant planting delays, all of which placed enormous physical, emotional, and financial strain on Midwest farmers (Olson and Wright Morton, 2012; NOAA NCEI, 2021). Region-wide April–May 2011 was the wettest in the historical observed period of record. To put this record season in the context of projected increased spring precipitation across the region, we compared the wettest spring in the 55-year historical period for each simulation and found its corresponding rank in spring total precipitation in the last 55-years of each simulations' projection (2045–2099). The rank of the historically wettest spring in each simulations' 2045–2099 projections ranged from 5th wettest to 18th wettest, with a 12-simulation median rank of 10th wettest. These results suggest a substantial increase in the likelihood of excessive and damaging spring precipitation, akin to 2011, by mid- to late-century in the Midwest.
Summary and Conclusions
In this study, we have examined changes to spring and summer precipitation characteristics in the Midwest by the mid- and late-century as projected by an ensemble of NA-CORDEX model combinations. The simulations strongly agree that springs will become increasingly wetter through the end of the century. Heavy and persistent spring precipitation can be detrimental to Midwest agriculture through delays in planting, pre- and post-emergence disease and pest control, and increasing soil erosion (Landau et al., 2021; Thaler et al., 2021). Increased river nitrogen loads in the Midwest are directly attributable to heavy precipitation in the region, particularly in the spring (Baeumler and Gupta, 2020). Issues caused by excessively high spring precipitation can significantly affect crop yield, but also increase stress on farmers, farm workers, and rural economies (Cianconi et al., 2020; Henning-Smith et al., 2021).
We find projections of changes in summer precipitation are variable in both sign and strength across the Midwest. Simulation agreement on summer precipitation changes by mid- and late-century is low relative to spring projections. This agrees with Bukovsky and Mearns (2020), who find a robust increase in spring total precipitation and consistent inconsistency in the sign of the summer total precipitation projections in NA-CORDEX. Although, when examining projections on a region-wide scale we find more consistent indications of increases in Midwest summer precipitation by late-century, albeit with more frequent summer dry days and longer summer dry spells. These findings indicate a potential transition to a wetter but more variable summer precipitation climatology for the Midwest as a whole, while agreement on future changes in local summer precipitation characteristics is much more uncertain.
Projected changes to precipitation in the NA-CORDEX simulations can be influenced by the forcing GCM output. Consistent with the downscaling results, each of the five CMIP5 models, which are used as the lateral boundary conditions for the NA-CORDEX downscaling, showed increased precipitation in the Midwest during spring in the mid-century, with even higher totals evident by the end of the century (Supplementary Figure 3). However, changes to summer precipitation are more mixed. Two models (HadGEM2-ES and MPI-ES-LR) show an overall drying trend, and the changes in the other models are less evident, suggesting less robustness in the projections of summer precipitation. CanRCM4 downscaling. Meanwhile, we noted many NA-CORDEX simulations show opposite changes in summer precipitation between the mid-century and late-century (Figures 7A,B), which are not found in the CMIP5 models (Supplementary Figure 3). This discrepancy can possibly be associated with the physics and configurations of the downscaling models. Previous comparison studies have documented the difference in summertime precipitation projections between GCMs and RCMs (e.g., Mariotti et al., 2011; Liu et al., 2017; Coppola et al., 2021), which can possibly be attributed to the different treatments of aerosol forcings and local land-atmosphere feedbacks.
This may also explain why our summertime results differ from those in other recent studies (e.g., Winkler et al., 2012; Swain and Hayhoe, 2015; Byun and Hamlet, 2018; Byun et al., 2019; Hamlet et al., 2020). While most of these studies agree with our results that spring precipitation will continue to increase in the Midwest through the end of the century, some disagree about late-century summers, projecting that the mid-century dryness will continue through the late-century. This could be attributable to the specific data sets and models used and how they are downscaled in each study. While our models are dynamically downscaled, those in Byun and Hamlet (2018), Byun et al. (2019), and Hamlet et al. (2020) for example are statistically downscaled, and Swain and Hayhoe (2015) directly use the GCMs instead. Although downscaling relies on projections from the driving GCMs, RCMs have the potential to capture some of the synoptic and mesoscale convective processes that dominate mid- to late-summer precipitation in the Midwest, which could explain the different results. In other words, the regional assessment based on the downscaled results can be affected by the choice of RCMs due to their different parameterizations of physical processes. For instance, with the same driving GCM as their boundary conditions, RCMs show different changes in summer precipitation (Figures 7, 8). The different treatments of climate forcings (e.g., aerosols) in GCMs and RCMs can also lead to different behaviors of climate variables (Chen, 2021; Coppola et al., 2021). However, the inconsistency in summer projections implies further model refinement and inter-comparison are needed to better understand and communicate the potential risks of summer precipitation changes in the Midwest.
It should be noted, in both discussion of the observed precipitation climatology and the comparison with the model historical climatology that our use of the gridded NClimDiv dataset to represent observations comes with its own limitations. Spatial interpolation that is necessary to move from individual gauge-based to gridded precipitation datasets has been shown to reduce the frequency of heavy precipitation events in the Midwest (Ensor and Robeson, 2008). We demonstrate this issue by comparing high-quality gauge observations from the National Weather Service Cooperative Observer station in Champaign, Illinois with the NClimDiv grid cell in which the station resides over the period 1951–2020. The gridded NClimDiv dataset consistently underestimates the frequency of heavy precipitation days (>25 mm) and overestimates the frequency of wet days (>2.5 mm) in both spring and summer, relative to the gauge-based observations (Supplementary Figure 4). The differences between gridded and gauge-based heavy precipitation days in Champaign are 0.56 days in spring and 0.61 days in summer, representing 29 and 26% of the 1951–2020 gauge-based average in spring and summer, respectively. Differences in wet days in Champaign are 1.9 days in spring and 3.2 days in summer, representing 13 and 27% of the gauge-based average for each season. Although gridded observation-based datasets provide many advantages over gauge-based observations, particularly in comparison to or validation of gridded model simulations, the biases reported in prior literature and demonstrated in Supplementary Figure 3 are important to acknowledge.
This study does not consider projected changes to temperature, which are widely expected to increase through mid- and late-century in the Midwest (Hamlet et al., 2020; Wuebbles et al., 2021). Increased growing season temperatures are associated with increases in evaporation and evaporative demand, which can induce additional stress to crops. Elevated evaporative demand, when combined with preexisting dryness, can create damaging flash drought in the Midwest, as was the case in 2012 (Otkin et al., 2018). Vapor pressure deficit has been shown to be an important precursor to agricultural drought impacts in the Midwest (Kimm et al., 2020). However, studies of historical changes in vapor pressure deficit in the Midwest have yielded varying results. Ficklin and Novick (2017) find significant increases in vapor pressure deficit in the Midwest between 1979 and 2013. However, Seager et al. (2015) found vapor pressure deficit in the Midwest has decreased over the longer period between 1961 and 2013, driven by observed increases in actual vapor pressure in the region. Similarly, Basso et al. (2021) find growing season potential evapotranspiration in the Midwest has decreased between 1960 and 2019, but more importantly find that the sign and strength of apparent Midwest evapotranspiration and vapor pressure deficit trends are highly sensitive to the historical record length. These inconsistencies are partly due to the complex change in Midwest temperatures both over the past century and in the past 30 years. Over both long-term (e.g., 50–100 year) and short-term (20–30 year) periods, growing season minimum temperatures have risen at a faster rate than maximum temperatures (Pathak et al., 2016; Angel et al., 2018; Basso and Ritchie, 2018), which has caused actual vapor pressure to increase at a similar rate to saturation vapor pressure (Basso et al., 2021). Importantly, summertime maximum temperatures in the Midwest have increased at a faster rate over the past 30 years relative to their rate of change since the turn of the twentieth century (Wuebbles et al., 2021). If changes in summertime maximum temperatures begin to outpace those of minimum temperatures in the Midwest, vapor pressure deficit will increase. However, if minimum temperature increases continue to exceed maximum temperature changes through the twenty-first century, increased vapor pressure deficit in the Midwest is not inevitable. Differences in the magnitude of daily minimum and maximum temperatures, as well as humidity, will continue to be important considerations for drought research in the Midwest.
Our study also only considered the high emissions RCP8.5 scenario, and it is possible that different pathways, such as RCP4.5 for example, may show different results. However, Midwest precipitation response to emissions reductions, particularly spring and summer precipitation, have been shown to be less dramatic than temperature (Wuebbles et al., 2021). It also should be noted that the climate projections in this study are based on downscaled CMIP5 simulations. Although CMIP5's successor, CMIP6, provides climate simulations from state-of-the-art climate models with improved model physics (Eyring et al., 2016), most of their spatial resolutions (e.g., 50 km or more coarse) are still not adequate for regional climate assessments.
Data Availability Statement
The raw data supporting the conclusions of this article will be made available by the authors, without undue reservation.
Author Contributions
KG led data analysis, manuscript writing, and figure creation. LC contributed to data analysis, project scoping, manuscript writing, and figure creation. TF lead project scoping, contributed to data analysis, manuscript writing, and figure creation. All authors contributed to the article and approved the submitted version.
Funding
This work was supported by NOAA Contract NA18OAR4310253B.
Conflict of Interest
The authors declare that the research was conducted in the absence of any commercial or financial relationships that could be construed as a potential conflict of interest.
Publisher's Note
All claims expressed in this article are solely those of the authors and do not necessarily represent those of their affiliated organizations, or those of the publisher, the editors and the reviewers. Any product that may be evaluated in this article, or claim that may be made by its manufacturer, is not guaranteed or endorsed by the publisher.
Acknowledgments
The authors thank the Illinois Farm Bureau for supporting this work.
Supplementary Material
The Supplementary Material for this article can be found online at: https://www.frontiersin.org/articles/10.3389/frwa.2021.780333/full#supplementary-material
References
Angel, J., Swanston, C., Boustead, B. M., Conlon, K. C., Hall, K. R., Jorns, J. L., et al. (2018). “Midwest,” in Impacts, Risks, and Adaptation in the United States: Fourth National Climate Assessment, Vol. II, eds D. R. Reidmiller, C. W. Avery, D. R. Easterling, K. E. Kunkel, K. L. M. Lewis, T. K. Maycock, and B. C. Stewart (Washington, DC: U.S. Global Change Research Program), 872–940. doi: 10.7930/NCA4.2018.CH21
Baeumler, N. W., and Gupta, S. C. (2020). Precipitation as the primary driver of variability in river nitrogen loads in the Midwestern United States. J. Am. Water Resour. Assoc. 56, 113–133. doi: 10.1111/1752-1688.12809
Basso, B., Martinez-Feria, R. A., Rill, L., and Ritchie, J. T. (2021). Contrasting long-term precipitation trends reveal minor changes in projected potential evapotranspiration in the US Midwest. Nat. Commun. 12, 1–10, doi: 10.1038/s41467-021-21763-7
Basso, B., and Ritchie, J. T. (2018). Evapotranspiration in high-yielding maize and under increased vapor pressure deficit in the US Midwest. Agr. Env. Lett. 3:170039. doi: 10.2134/ael2017.11.0039
Bukovsky, M. S., and Mearns, L. O. (2020). Regional climate change projections from NA-CORDEX and their relation to climate sensitivity. Clim. Change 162, 645–665. doi: 10.1007/s10584-020-02835-x
Byun, K., Chiu, C. M., and Hamlet, A. F. (2019). Effects of 21st century climate change on seasonal flow regimes and hydrologic extremes over the Midwest and Great Lakes region of the US. Sci. Total Environ. 650, 1261–1277. doi: 10.1016/j.scitotenv.2018.09.063
Byun, K., and Hamlet, A. F. (2018). Projected changes in future climate over the Midwest and Great Lakes region using downscaled CMIP5 ensembles. Int. J. Climatol. 38, e531–e553. doi: 10.1002/joc.5388
Chen, L.. (2021). Uncertainties in solar radiation assessment in the United States using climate models. Clim. Dyn. 56, 665–678. doi: 10.1007/s00382-020-05498-7
Christian, J., Christian, K., and Basara, J. B. (2015). Drought and pluvial dipole events within the Great Plains of the United States. J. Appl. Meteorol. Climatol. 54, 1886–1898. doi: 10.1175/JAMC-D-15-0002.1
Cianconi, P., Betrò, S., and Janiri, L. (2020). The impact of climate change on mental health: a systematic descriptive review. Front. Psychiatry. 11:74. doi: 10.3389/fpsyt.2020.00074
Coppola, E., Nogherotto, R., Ciarlo', J. M., Giorgi, F., van Meijgaard, E., Kadygrov, N., et al. (2021). Assessment of the European climate projections as simulated by the large EURO-CORDEX regional and global climate model ensemble. J. Geophys. Res. Atmos. 126, e2019JD032356. doi: 10.1029/2019JD032356
Daigh, A. L. M., DeJong-Hughes, J., and Acharya, U. (2020). Projections of yield losses and economic costs following deep wheel-traffic compaction during the 2019 harvest. Agric. Environ. Lett. 5, e20013. doi: 10.1002/ael2.20013
El Mourid, M., He, G. Q., Andrade, F. H., and Anderson, I. C. (1986). Relationship of corn and soybean yields to weekly moving averages for precipitation and temperature at four climatic locations in Iowa. Iowa State J. Res. 61, 49–64.
Ensor, L. A., and Robeson, S. M. (2008). Statistical characteristics of daily precipitation: comparisons of gridded and point datasets. J. Appl. Meteorol. Climatol., 47, 2468–2476, doi: 10.1175/2008JAMC1757.1
Eyring, V., Bony, S., Meehl, G. A., Senior, C. A., Stevens, B., Stouffer, R. J., et al. (2016). Overview of the couple model intercomparison project phase 6 (CMIP6) experimental design and organization. Geosci. Model Dev. 9, 1937–1958. doi: 10.5194/gmd-9-1937-2016
Ficklin, D. L., and Novick, K. A. (2017). Historic and projected changes in vapor pressure deficit suggest a continental-scale drying of the United States atmosphere. J. Geophys. Res. 122, 2061–2079, doi: 10.1002/2016JD025855
Ford, T. W., Chen, L., and Schoof, J. T. (2021). Variability and transitions in precipitation extremes in the Midwest United States. J. Hydrometeor. 22, 533–545. doi: 10.1175/JHM-D-20-0216.1
Foreign Agricultural Service (2021). United States Department of Agriculture. World Agricultural Production.
Gautum, S., Costello, C., Baffaut, C., Thompson, A., and Sadler, E. J. (2021). Projection of future drought and extreme events occurrence in Goodwater Creek Experimental Watershed Midwestern US. Hydrol. Sci. J. 66, 1045–1058. doi: 10.1080/02626667.2021.1906878
Goldblum, D.. (2009). Sensitivity of corn and soybean yield in Illinois to air temperature and precipitation: the potential impact of future climate change. Phys. Geogr. 30, 27–42, doi: 10.2747/0272-3646.30.1.27
Hamlet, A. F., Byun, K., Robeson, S. M., Widhalm, M., and Baldwin, M. (2020). Impacts of climate change on the state of Indiana: ensemble future projections based on statistical downscaling. Clim. Change 163, 1881–1895. doi: 10.1007/s10584-018-2309-9
Hatfield, J. L., Wright-Morton, L., and Hall, B. (2018). Vulnerability of grain crops and croplands in the Midwest to climatic variability and adaptation strategies. Clim. Change 146, 263–275. doi: 10.1007/s10584-017-1997-x
Henning-Smith, C., Alberth, A., Bjornestad, A., Becot, F., and Inwood, S. (2021). Farmer mental health in the US Midwest: key Informant perspectives. J. Agromed. 2021, 1–10. doi: 10.1080/10599924X.2021.1893881
Hernández-Díaz, L., Nikiéma, O., Laprise, R., Winger, K., and Dandoy, S. (2019). Effect of empirical correction of sea-surface temperature biases on the CRCM5-simulated climate and projected climate changes over North America. Clim. Dyn. 53, 453–476. doi: 10.1007/s00382-018-4596-2
Hu, Q., and Buyanovsky, G. (2003). Climate effects on corn yield in Missouri. J. Appl. Meteorol. 42, 1626–1635. doi: 10.1775/1520-0450(2003)042<1626:CEOCYI>2.0.CO;2
Kimm, H., Guan, K., Gentine, P., Wu, J., Bernacchi, C. J., Sulman, B. N., et al. (2020). Redfining droughts for the US Corn Belt: the dominant role of atmospheric vapor pressure deficit over soil moisture in regulating stomatal behaviro in Maize and Soybean. Agr. For. Meteorol. 287, 107930. doi: 10.1016/j.agrformet.2020.107930
Landau, C. A., Hager, A. G., and Williams, I. I. M. M. (2021). Diminishing weed control exacerbates maize yield loss to adverse weather. Glob. Chang. Biol. 27, 6156–6165. doi: 10.1111/gcb.15857
Liu, C., Ikeda, K., Rasmussen, R., Barlage, M., Newman, A. J., Prein, A. F., et al. (2017). Continental-scale convection-permitting modeling of the current and future climate of North America. Clim. Dyn. 49, 71–95. doi: 10.1007/s00382-016-3327-9
Liu, L., and Basso, B. (2020). Impacts of climate variability and adaptation strategies on crop yields and soil organic carbon in the US Midwest. PLoS ONE. 15:e0225433. doi: 10.1371/journal.pone.0225433
Mariotti, L., Coppola, E., Sylla, M. B., Giorgi, F., and Piani, C. (2011). Regional climate model simulation of projected 21st century climate change over an all-Africa domain: comparison analysis of nested and driving model results. J. Geophys. Res. Atmos. 116:D15111. doi: 10.1029/2010JD015068
McGinnis, S.. (2021). NA-CORDEX Bias Correction Error. Available online at: https://na-cordex.org/bias-correction-error.html (accessed October 10, 2021).
Mearns, L. O., McGinnis, S., Korytina, D., Scinocca, J., Kharin, S., Jiao, Y., et al. (2017). “The NA-CORDEX Dataset, Version 1.0.,” in NCAR Climate Data Gateway (Boulder, CO: The National Center of Atmospheric Research.
Mishra, V., and Cherkauer, K. A. (2010). Retrospective droughts in the crop growing season: implications to corn and soybean yield in the Midwestern United States. Agric. For. Meteorol. 150, 1030–1045. doi: 10.1016/j.agrformet.2010.04.002
National Agricultural Statistics Service (2021). United States Department of Agriculture. Crop Production 2020 Summary.
NOAA NCEI (2011). NOAA National Centers for Environmental Information, State of the Climate, National Climate Report for May 2011, published online June 2011. Available online at: https://www.ncdc.noaa.gov/sotc/national/201105/supplemental/page-3 (accessed September 20, 2021).
NOAA NCEI (2021). NOAA National Centers for Environmental Information, Climate at a Glance: Regional Time Series. published August 2021. Available online at: https://www.ncdc.noaa.gov/cag/ (accessed September 2, 2021).
Olson, K. R., and Wright Morton, L. (2012). The impacts of 2011 induced levee breaches on agricultural lands of Mississippi River Valley. J. Soil Water Conserv. 67, 5A−10A. doi: 10.2486/jswc.67.1.5A
Otkin, J. A., Svoboda, M., Hunt, E. D., Ford, T. W., Anderson, M. C., Hain, C., et al. (2018). Flash droughts: a review and assessment of the challenges imposed by rapid-onset droughts in the United States. Bull. Am. Meteorol. Soc. 99, 911–919. doi: 10.1175/BAMS-D-17-0149.1
Pathak, P., Kalra, A., and Ahmad, S. (2016). Temperature and precipitation changes in the Midwestern United States: implications for water management. Int. J. Water Res. Develop. 6, 1003–1019. doi: 10.1080/07900627.2016.1238343
Seager, R., Hooks, A., Williams, A. P., Cook, B., Nakamura, J., and Henderson, N. (2015). Climatology, variability, and trends in the US vapor pressure deficit, an important fire-related meteorological quantity. J. Appl. Meteorol. Climatol. 54, 1121–1141. doi: 10.1175/JAMC-D-14-0321.1
Svoboda, M., LeComte, D., Hayes, M., Heim, R., Gleason, K., Angel, J., et al. (2002). The drought monitor. Bull. Am. Meteorol. Soc. 83, 1181–1190. doi: 10.1175/1520-0477-83.8.1181
Swain, S., and Hayhoe, K. (2015). CMIP5 projected changes in spring and summer drought and wet conditions over North America. Clim. Dyn. 44, 2737–2750. doi: 10.1007/s00382-014-2255-9
Thaler, E. A., Larsen, I. J., and Yu, Q. (2021). The extent of soil loss across the US Corn Belt. Proc. Nat. Acad. Sci. U.S.A. 118:e1922375118. doi: 10.1073/pnas.1922375118
Urban, D. W., Roberts, M. J., Schlenker, W., and Lobell, D. B. (2015). The effects of extremely wet planting conditions on maize and soybean yields. Clim. Change 130, 247–260. doi: 10.1007/s10584-015-1362-x
Vose, R. S., Applequist, S., Squires, M., Durre, I., Menne, M. J., Williams, C. N., et al. (2014). Data from: NOAA Monthly U.S. Climate Divisional Database (NClimDiv). NOAA National Climatic Data Center. (2014). doi: 10.7289/V5M32STR
Westcott, N. E., Hollinger, S. E., and Kunkel, K. E. (2005). Use of real-time multisensor data to assess the relationship of normalized corn yield with monthly rainfall and heat stress across the central United States. J. Appl. Meteorol. 44, 1667–1676. doi: 10.1175/JAM2303.1
Winkler, J. A., Arritt, R. W., and Pryor, S. C. (2012). “Climate projections for the Midwest: Availability, interpretation and synthesis,” in U. S. National Climate Assessment Midwest Technical Input Report, eds J. Winkler, J. Andresen, J. Hatfield, D. Bidwell, and D. Brown (Ann Arbor, MI: Great Lakes Integrated Sciences and Assessment (GLISA) Center), 1–24.
Winsor, S.. (2020). Keep your eyes open for these wet-season soybean diseases. Crops Soils. 53, 16–23. doi: 10.1002/crso.20033
Keywords: drought, climate projections, climate change, Midwest, agriculture, NA-CORDEX
Citation: Grady KA, Chen L and Ford TW (2021) Projected Changes to Spring and Summer Precipitation in the Midwestern United States. Front. Water 3:780333. doi: 10.3389/frwa.2021.780333
Received: 20 September 2021; Accepted: 24 November 2021;
Published: 24 December 2021.
Edited by:
Julie A. Winkler, Michigan State University, United StatesReviewed by:
Scott Robeson, Indiana University, United StatesJonathan Winter, Dartmouth College, United States
Copyright © 2021 Grady, Chen and Ford. This is an open-access article distributed under the terms of the Creative Commons Attribution License (CC BY). The use, distribution or reproduction in other forums is permitted, provided the original author(s) and the copyright owner(s) are credited and that the original publication in this journal is cited, in accordance with accepted academic practice. No use, distribution or reproduction is permitted which does not comply with these terms.
*Correspondence: Trent W. Ford, dHdmb3JkQGlsbGlub2lzLmVkdQ==