 Kerri-Leigh Robinson
 Heye R. Bogena
 Qiqi Wang
 Erik Cammeraat
 Roland Bol
- 1Institute of Biodiversity and Ecosystem Dynamics (IBED), University of Amsterdam, Amsterdam, Netherlands
- 2Forschungszentrum Jülich GmbH, Agrosphere Institute (IBG-3), Jülich, Germany
Deforestation can lead to an increase in the availability of nutrients in the soil and, in turn, have an impact on the quality of water in receiving water bodies. This study assesses the impact of deforestation by evaluating the in-stream concentrations of dissolved organic carbon (DOC) and nitrate, their internal relationship, and those with stream discharge in the Wüstebach headwater catchment (Germany). This catchment has monitored stream water and associated environmental parameters for over a decade as part of the TERENO initiative. Additionally, there is a paired undisturbed forested catchment that serves as a reference stream. Our approach included a more advanced correlation analysis, namely wavelet analysis, that assists in determining changes in the correlation and lag time between the variables of interest over different time scales. This study found that after deforestation, there was an immediate increase in in-stream DOC concentrations, followed by an increase in nitrate ~1 year later. Overall, the mean DOC concentration increased, and mean nitrate concentration decreased across the catchment post-deforestation. Elevated stream water nutrient levels peaked around 2 to 3 years after the clear-cutting, and returned to pre-deforestation levels after ~5 years. The deforestation had no influence on the anti-correlation between DOC and nitrate. However, the correlation between both compounds and discharge was likely altered due to the increased soil nutrients availability as a result of deforestation. Wavelet coherence analysis revealed the “underlying” changing strengths and directions of the main correlations between DOC, nitrate and discharge on different time scales resulting from severe forest management interventions (here deforestation). This information provides new valuable impact insights for decision making into such forest management interventions.
Introduction
The actual state and amount of carbon (C) and nitrogen (N) stored in forest environments not only impact the immediate ecosystem, but it also has an influence on global C and N cycling (Nabuurs et al., 2007). As these two cycles are tightly coupled, changes in the cycling of these compounds influences availability and demand for the other element (Zaehle, 2013; Haghverdi and Kooch, 2020). Forest disturbances can result in changes in the availability of C and N, affecting the structure, biological activity and performance of ecosystems over the long term (Hamilton et al., 2016; Ekblad and Bastviken, 2019; Guiry et al., 2020; Frainer and McKie, 2021; Georgiev et al., 2021). In order to document the long-term effects of disturbances on forest systems it is useful to evaluate stream water chemistry as it is sensitive to changes in forest ecosystem functioning and performance (Bogena et al., 2015). Deforestation, for example, has been shown to have strong effects on the hydrological system influencing various environmental processes and nutrient dynamics and different timescales (i.e., daily, seasonal, or annual scale) (Bogena et al., 2015). In terms of assessing the impact of disturbance on the C and N cycles, assessment of the fast, dynamic response of respective chemical water-soluble compounds, i.e., nitrate and dissolved organic carbon (DOC) has been shown to be an effective strategy (Kalbitz et al., 2004; Fujii et al., 2021). This is because both compounds are highly soluble and they can be readily transported from soils into adjacent water bodies (Jacobs et al., 2017).
The relationship between stream DOC and nitrate has been observed in recent years, Taylor and Townsend (2010) found a general non-linear negative relationship between DOC and nitrate in hydrological systems. Heppell et al. (2017) have shown that the dynamics of hydrological pathways is a controlling factor in determining the relationship between DOC and nitrate concentrations in small catchments in the UK, and Vaughan et al. (2017) found that the relationship between nitrate and DOC was strongly dependent on land use, i.e., agricultural sites have a higher nitrate yield per water yield and a higher DOC yield per water yield than urban or forested sites. Taking these findings into consideration, exploring the coupled DOC and nitrate relationship in a deforested catchment may enhance understanding of the effect of anthropogenic disturbance.
It is well-timed to evaluate the impact of deforestation on the C and N cycle as there is currently a drive in many European countries to return forest stands to the natural forest vegetation (Bredemeier et al., 2012). This process involves replacing monospecific, “artificial” conifer plantations with broadleaved mixed stands often via clear-cutting and it can lead to abrupt changes in forest ecosystems altering C fluxes and stocks (Bala et al., 2007; Saner et al., 2012; Nogueira et al., 2017) and causing abrupt shifts in the N cycle (Hamilton et al., 2016; Guiry et al., 2020). In addition to the current drive, forest loss has been exacerbated by the droughts and heat waves of recent years (e.g., Neuwirth et al., 2021).
Generally, deforestation is expected to increase the DOC concentration in streams. This is anticipated as removal of the forest canopy can result in increased solar radiation absorbed by soils, which in turn may increase the production of soil organic matter (SOM) (Gandois et al., 2012; Arias-Ortiz et al., 2020). Although the removal of trees does reduce the overall tree litter and thus SOM input, the fast decomposition of the fine woody debris from clear-cutting may still release a flush of nutrients to the soil (Kreutzweiser et al., 2008; Gandois et al., 2012). Such conditions stimulate microbial activity altering decomposition rates leading to C release in the form of dissolved C and CO2 (Gandois et al., 2012). Dissolved organic matter is generally the primary form of labile C in temperate and boreal terrestrial ecosystems and it serves as an important transport vector for organically bound nutrients to microorganisms within water bodies (Mostovaya et al., 2017; Guo et al., 2020; Burger et al., 2021). Furthermore, studies suggest that deforestation may increase the runoff generation in a catchment, e.g., due to a decrease in rainfall interception, evapotranspiration and soil compaction (Gholami, 2013; Hlásny et al., 2015; Wiekenkamp et al., 2016, 2019), and it can also reshape the land-surface energy-flux partitioning (Yuan et al., 2021). With regards to the impact on the N cycle, stream nitrate concentration might increase due to the increase in soil nitrate from higher N mineralization after vegetation clearing, which may leach into the groundwater or be transported via surface runoff to receiving surface water bodies (Rusinga et al., 2008). Despite these known findings, the effect of deforestation on the spatio-temporal relationship between DOC and nitrate had not yet been evaluated.
Wavelet analysis is a multi-resolution analysis that can break down a time series into time-frequency space, transforming the signal into scaled and translated versions of the original wavelet. In this way, the wavelet method can be extensively tested to determine the changes in correlation and lag time between these substances over different time scales. In this way, it is able to find localized intermittent periodicities (Grinsted et al., 2004). It is advantageous over most traditional mathematical methods that assess periodicities in the frequency domain, such as Fourier Analysis, that indirectly assume that the processes are stationary in time. Earlier studies have shown that a wavelet-based approach is suitable for investigating hydrological data (Graf et al., 2014; Fang et al., 2015; Weigand et al., 2017). It has been applied to detail transit times, and in more limited scope used in hydrochemistry/biogeochemical studies, for example on temporal changes of dissolved elements in glacier springs and karst springs or forested areas (Weigand et al., 2017; Brighenti et al., 2021; Rezaei and Saatsaz, 2021). However, its application is (still) limited by the fact that the method is rather “data hungry” (Lloyd et al., 2014).
This study tested the hypothesis that following deforestation, not only stream water DOC and nitrate content are modified, but also the temporal correlation between DOC and nitrate in the Wüstebach catchment. For example, due to induced changes in hydrological processes, such as the occurrence of preferential flow and fast subsurface runoff (Wiekenkamp et al., 2016, 2019). Hydrological processes were previously found to be crucial for explaining differences in C and N transport in the Wüstebach catchment (Weigand et al., 2017). Due to sufficient data availability and the ability of wavelet analysis to identify spatio-temporal relationships, this approach was used to elucidate correlations between DOC and nitrate, and between DOC or nitrate and discharge using the decadal time stream water data series within a deforested and mostly unaffected reference catchment. To our knowledge, this study is the first to conduct this type of wavelet analysis on pre- and post clearcut stream water nitrate and DOC time series.
Materials and methods
Site description
The Wüstebach catchment (Figure 1) is located in the Eifel National Park, near the German-Belgian border located at 50°30′16″ N and 6°20′00″ E (WGS 84) and is part of the TERENO Rur catchment observatory (Bogena et al., 2018). The site covers an area of 38.5 ha and the altitude ranges from 596 m a.s.l in the northern part of the catchment to 628 m a.s.l in the southern part (Bogena et al., 2020). The catchment receives ~1,220 mm annual precipitation and it is characterized by small headwater streams. The bedrock consists of weathered Devonian foliated siltstone and claystone, and it contains isolated quartzite. This layer is covered by a periglacial solifluction layer, which ranges from ~1 to 2 m in thickness. The pedology of the catchment has been classified according to the World Reference Base (USS Working Group WRB, 2015) for soil resources. The hillslopes are dominated by Cambisols and Planosols whilst the valleys are characterized by Gleysols and Histosols.
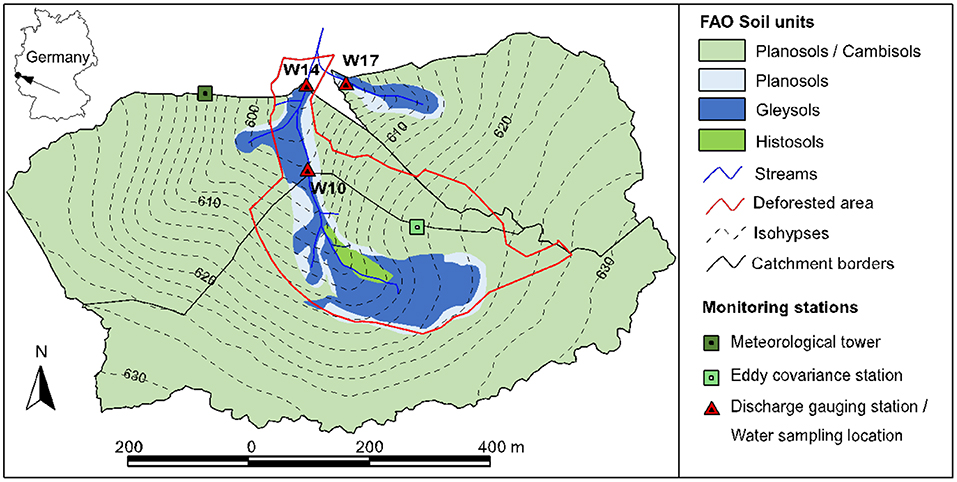
Figure 1. Map of the Wüstebach headwater catchment and the adjacent, smaller reference catchment. Shown are the FAO soil units, isolines, streams, the eddy covariance station, and the meteorological station. The water sampling locations and discharge gauging stations are specified with red triangles and the extent of the deforestation is marked by a red border. The sub-catchment border has been derived from Stockinger et al. (2014).
Northeast of the Wüstebach catchment is a paired stream (reference stream) with similar catchment characteristics to the Wüstebach catchment and a catchment area of 11 ha (Table 1). Norway Spruce (Piceas abies) is the dominant vegetation in both catchments, however, efforts are currently being made to restore the Eifel National Park to near natural deciduous forest. These efforts have included the clear-cutting of ~21% of the Wüstebach research site in the late summer/early autumn of 2013.
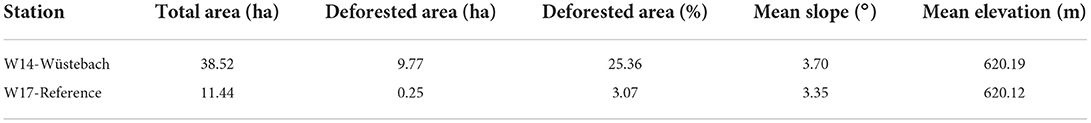
Table 1. Characteristics of both catchments indicating area, extent of deforestation, slope and elevation.
The extent of the deforestation can be seen in Figure 1 and the percentage of area that was cleared in both the Wüstebach and reference catchment is given in Table 1. The reference catchment was only slightly impacted by the clearance (3.07% of the total area) and as the catchment of the reference area otherwise has very similar characteristics to Wüstebach catchment, comparative studies of the effect of deforestation can be made with the measured discharge and water quality data.
The Wüstebach catchment was selected because: (i) decadal high quality hydrological data was available, (ii) the DOC and nitrate measurements were available before and after the clear-cut, and (iii) it includes a parallel reference catchment that has mostly been unaffected by the forest clearance. Furthermore, this area in Germany is also regarded as being representative for many low or middle mountain areas in Central Europe, which was the further reason to initiate the long-term monitoring in this specific catchment.
Data collection
In 2009, the Wüstebach stream was equipped with a high-resolution spatiotemporal measurement network (Weigand et al., 2017) to measure multiple parameters including, but not limited to, discharge and water chemistry parameters (Bogena et al., 2015). For this study, we used data from three discharge gauging stations (W10, W14 and W17, respectively) shown in Figure 1, which measure stream discharge at 10-min intervals. W10 and W14 fall within the partially deforested catchment and W17 falls within the mostly unaffected reference catchment (Figure 1).
To assess water quality, weekly grab samples are taken for chemical analyses at several locations along the Wüstebach stream (Bogena et al., 2015). For these samples, high density polyethylene (HDPE) bottles are pre-rinsed with stream water and subsequently filled and transported to the laboratory at Jülich Forschungszentrum for further analysis (Bogena et al., 2020). The samples are kept at a temperature of 4°C during transport and storage. All samples were filtered the next day in the laboratory (0.45 μm) prior to subsequent analysis. Nitrate concentrations were measured using ion chromatography and dissolved organic carbon (DOC) concentration as non-purgeable organic carbon (Shimadzu TOC-VCPN) (Bogena et al., 2015). The period of investigation extends from 04/01/2010 to 30/12/2019 creating a complete overview of the water chemistry before and after deforestation. All data used in this study is publicly available by the TERENO data portal at www.tereno.net.
Wavelet analysis
This study made use of the Cross Wavelet and Wavelet Coherence Toolbox (http://grinsted.github.io/wavelet-coherence/) developed by Grinsted et al. (2004). For a detailed background of wavelet analysis, we refer to publications by Torrence and Compo (1998), Grinsted et al. (2004) and Weigand et al. (2017).
Background
Wavelet analysis is a multi-resolution analysis that has become a popular tool for analyzing localized variations of power within a time series. It is able to break down a time series into time-frequency space, transforming the signal into scaled and translated versions of the original wavelet, and thus it is able to find localized intermittent periodicities (Grinsted et al., 2004).
Wavelet transforms can be divided into two classes namely: the continuous wavelet transform (CWT) and the discrete equal (DWT). DWT results in a compact data presentation and it is commonly used for the reduction and compression of noise whereas CWT is more useful in extracting features, particularly in complex time series that have a lot of noise (Grinsted et al., 2004; Sinha et al., 2005; Weigand et al., 2017). CWT is thus more appropriate for the purpose of this study.
According to Grinsted et al. (2004), a wavelet is a function that has zero mean and is localized in both frequency (Δω or bandwidth) and time (Δt). The Morlet wavelet is defined as:
with: ω0 =dimensionless frequency; η = dimensionless time.
The aim of the CWT is to apply the wavelet as a bandpass filter to the time series. By varying the wavelet's scale (s), it is stretched in time so that η = s•t, and normalizing it to have unit energy (Grinsted et al., 2004). Since the wavelet is not completely localized in time, the CWT has edge artifacts and thus it is useful to introduce a Cone of Influence (COI). The COI indicates the area in which the wavelet power caused by discontinuity at the edge has dropped to e−2 of the value of the edge and its purpose is to indicate the area in which the edge effects cannot be overlooked.
Wavelet transform coherence
The cross wavelet power indicates regions with high common power. In addition to this measure, how coherent the cross wavelet transform is in time frequency space is also useful. Following the work of Torrence and Webster (1999), Grinsted et al. (2004) has defined the wavelet coherence of two time series as follows:
with S = smoothing operator.
This equation strongly resembles that of the traditional correlation coefficient, and it is useful to consider the wavelet coherences as a localized correlation coefficient in the time frequency domain (Grinsted et al., 2004). Grinsted et al. (2004) define the smoothing operator as follows:
with Sscale = smoothing along wavelet scale axis; Stime= smoothing in time.
The smoothing operator should be designed so that it has a similar footprint to that of the wavelet used and consequently, Torrence and Webster (1999) have stated a suitable smoothing operator for the Morlet wavelet:
with c1 & c2 = normalization constants; π = rectangle function.
The factor of 0.6 is the determined scale decorrelation length for the Morlet wavelet (Torrence and Compo, 1998). Monte Carlo methods are used to determine the statistical significance level of the wavelet coherence. A large collective of surrogate data set pairs with the same AR1 coefficients as the input datasets are generated (Grinsted et al., 2004). The wavelet coherence is then calculated for each pair. This is followed by estimating the significance level of each scale using values outside the COI.
An interpretation key for reading the output of the wavelet analysis can be seen in Figure 2A and the key for deciphering the phase shifts in the outcome of the WTC spectra can be found in Figure 2B. For a detailed description of the terminology used to describe the phase shifts please see Supplementary material 10 and Weigand et al. (2017).
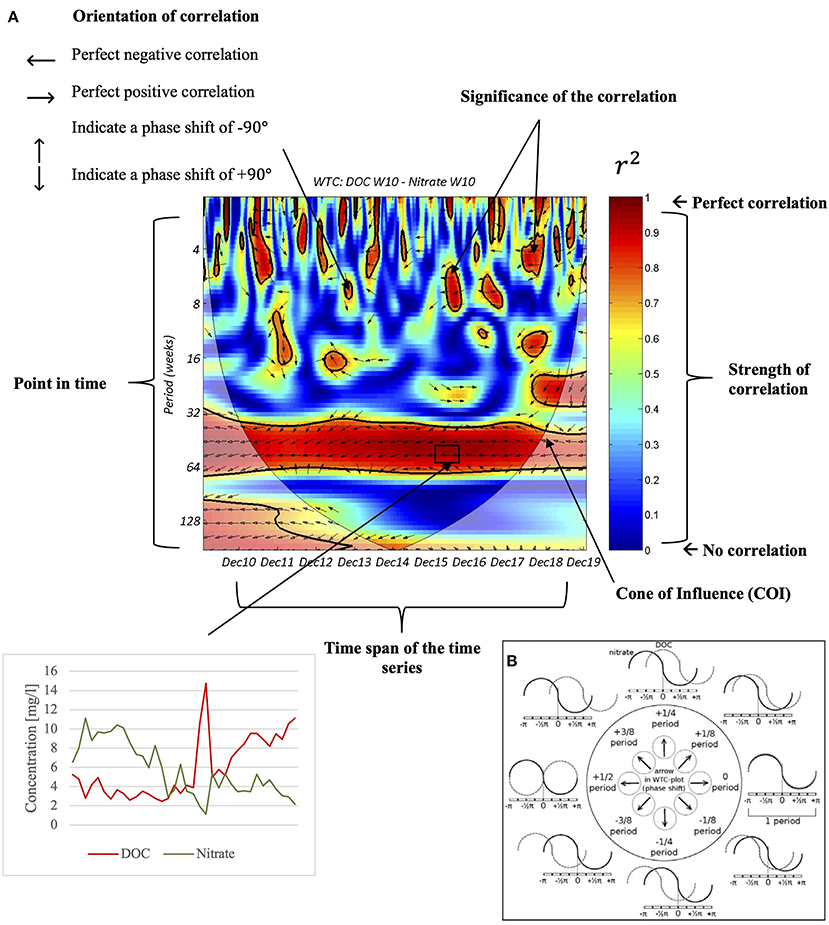
Figure 2. (A) The key for interpretation of a WTC. (B) The schematic presentation of the phase shifts between DOC and nitrate [Adapted from Weigand et al. (2017)].
Handling missing data
Wavelet analysis requires a complete, equidistant dataset to generate results. Following Weigand et al. (2017), we assume that the weekly grab samples taken every 7 ± 1.5 days can be considered equidistant. Nonetheless, data was not available for every week due to a range of factors including, but not limited to, weather restrictions and insufficient discharge leading to data gaps (Weigand et al., 2017). Different methods were used to fill the data gaps as explained in the following.
For nitrate and DOC data, 12.2% and 12.3% of the data were missing across all three sampling sites, respectively. For nitrate, data from the TriOs OPUS spectral sensor (TriOS Mess- und Datentechnik GmbH, Germany) installed at W14 were used to fill gaps whenever possible. This sensor was installed in October 2013 and automatically measures nitrate concentrations at 15-min intervals. These readings were converted to daily averages and a regression function was calculated using both datasets to estimate the missing data. Since the sensor data showed an offset compared to the weekly data, it was not possible to directly use the sensor data. The TriOs OPUS spectral sensor data was not available for the full period as there were times when it was broken and consequently captured inaccurate readings. Therefore, the remaining missing nitrate and DOC measurements for W14 were filled using linear interpolation. Subsequently, the missing nitrate and DOC data from W10 were filled using a local regression analysis of the completed W14 data set, and the W17 dataset was filled with the completed W10 data set, respectively (i.e., with 10 measurements each before and after the data gap).
In addition, data gaps in the discharge data were filled as follows. First, the high-resolution discharge data were converted to daily averages. In case of smaller data gaps (<=5 days), linear interpolation was applied. Since the daily mean discharges at W10, W14, and W17 and at the Erkensruhr gauging station downstream of Wüstebach were highly correlated, it was possible to close larger gaps via local regression analysis (see above). Once all discharge data for all three stations were completed, discharges at the date of the weekly sampling campaigns were extracted to complement the grab sample data. Of the weekly discharge dataset, 7.9% of the dates were gap filled.
The decision to fill the data using linear interpolation was inspired by Weigand et al. (2017) who used linear interpolation to fill gaps in their data from Wüstebach for a WTC analysis with a different research objective. They checked the validity of their results by using sets of uncorrelated random numbers with the same mean and standard deviation as the data itself to fill in the gaps. The WTC charts with randomly filled gaps differed only slightly from the WTC charts with linearly interpolated data, and the interpretations of the charts did not change. Therefore, we also applied linear interpolation to fill gaps in the Wüstebach data prior to our WTC analysis when no other comparable datasets were available to calculate regression functions.
Results
The highest average DOC concentration was recorded upstream in the Wüstebach catchment (W10: 4.52 ± 2.36 mg/L) with the lowest average recorded in the outlet of the reference catchment (W17: 2.23 ± 1.08 mg/L) (Table 2). The average DOC concentration decreased downstream in the Wüstebach catchment as the catchment outlet (W14) recorded an average of 3.52 ± 1.88 mg/L. This differed from the average nitrate concentrations recorded in the Wüstebach stream, as the average nitrate concentration increased downstream from W10 (4.46 ± 2.24 mg/L ) to W14 (5.37 ± 2.14 mg/L).
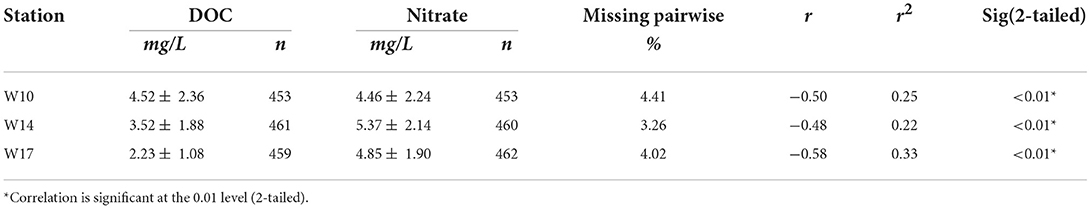
Table 2. Mean DOC and nitrate concentrations of the Wüstebach and reference streams and their linear relationships.
The average stream water DOC increased substantially in all three sampling points after deforestation with W10 and W14 (Wüstebach) showing the largest average increase (Figure 3). Contrary to this result, the average nitrate concentration declined across all three streams with the reference catchment showing the largest average decrease (Figure 3).
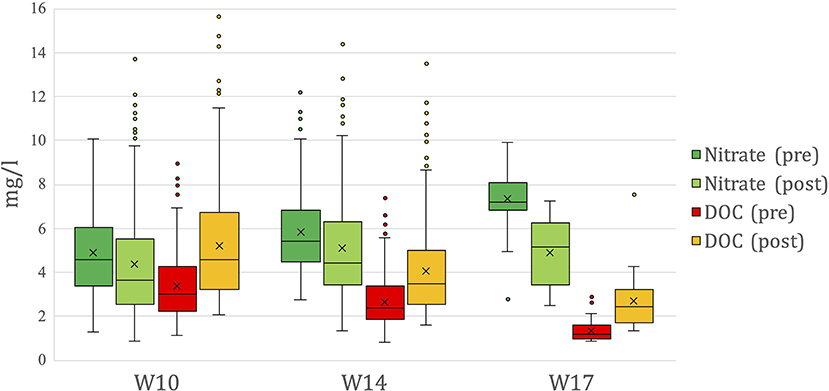
Figure 3. Boxplots indicating nitrate (green) and DOC (red/orange) concentration measured before and after deforestation. Boxplots indicating the distribution prior to the deforestation are colored with darker shades and post-deforestation boxplots are colored with lighter shades. X is indicative of the average.
The time series for all three stations (Figure 4) showed a distinct seasonal pattern with the highest DOC concentration measured in summer and the highest nitrate occurring in the winter. Following the deforestation, both affected streams (W10 and W14) recorded an immediate increase in DOC whilst the concentration recorded in the reference catchment (W17) remained constant (Figure 4). The increase in the nitrate concentration in the affected streams only occurred ~1 year after the deforestation and once more, the reference catchment concentration remained the same. Elevated stream water DOC and nitrate levels in the affected catchment peaked around 2 to 3 years after the deforestation and began to stabilize after ~5 years.
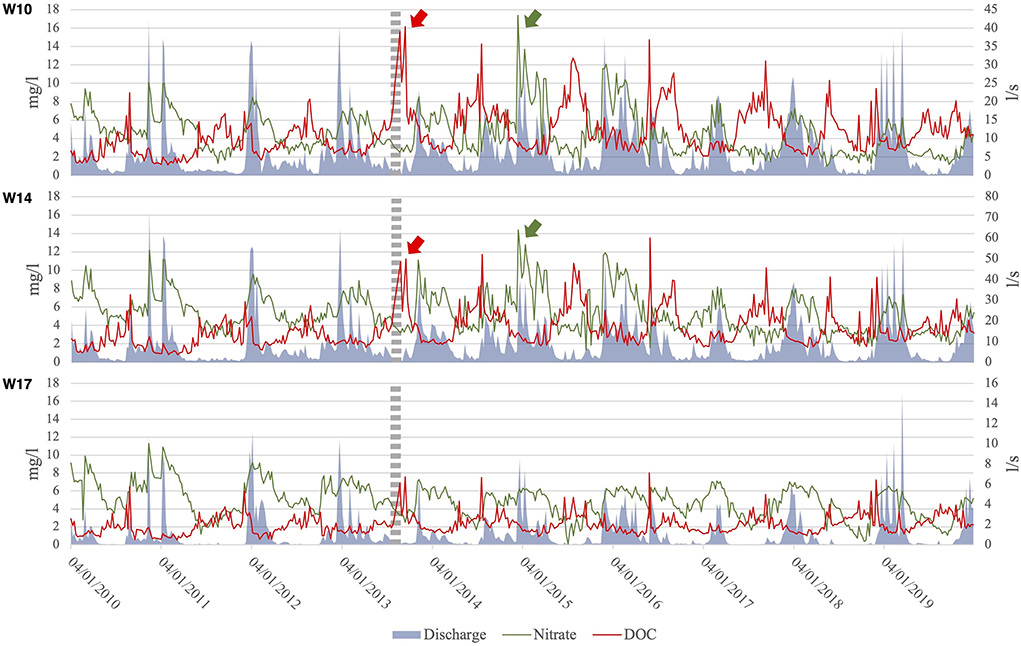
Figure 4. Descriptive time series indicating nitrate and DOC concentrations and the daily average discharge measured at the water sampling locations. The grey dashed line is indicative of the time in which the deforestation took place and the red and green arrows indicate concentration spikes following the clear cut. W10 and W14 are within the deforested catchment and W17 is in the marginally disturbed reference catchment.
The results of the Pearson's correlation coefficient test indicated that there was a significant, moderate to large, negative correlation (r in Table 2) between DOC and nitrate at all three stations. The highest negative correlation is recorded in the reference catchment (−0.58) and the weakest negative correlation is recorded at the outlet of the Wüstebach catchment (W14). The results of the linear regression analysis indicated a relatively low, linear coefficient of determination (r2 in Table 2) ranging from 0.22 at the Wüstebach catchment outlet (W14) to 0.33 in the reference catchment (W17).
The highest recorded discharge was observed at the outlet of the Wüstebach catchment (W14: 9.31 ± 11.90 L/s) (Table 3). The quantity of discharge in the Wüstebach catchment stream appears to have increased after the deforestation, but not in the reference catchment stream (Figure 5). The largest change in the distribution of data was observed at the Wüstebach catchment outlet (W14) where the upper quartile increased considerably, and higher significant outliers were measured. The increase in discharge after the deforestation in the time series (Figure 4) is not as clear as it is in the boxplots (Figure 5). However, at all stations there was a slight negative correlation between DOC and discharge and a positive correlation between nitrate and discharge.
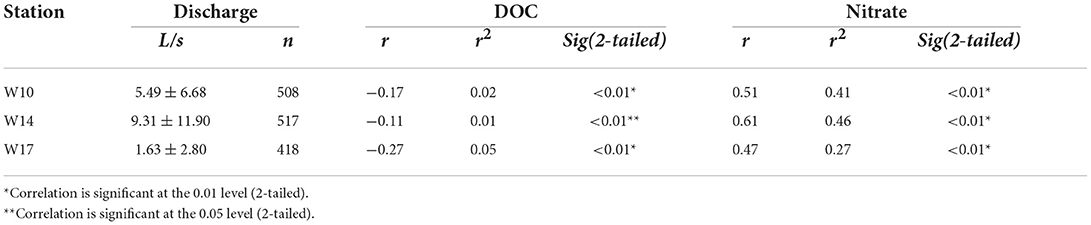
Table 3. Mean discharge and the linear relationship between discharge and DOC or nitrate for each sampling station.
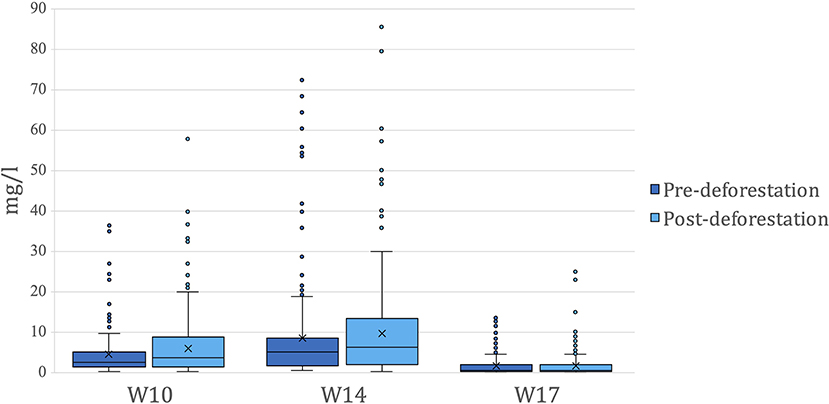
Figure 5. Boxplots of discharge measured before and after deforestation. Boxplots indicating the distribution prior to the deforestation are colored with darker shades and post-deforestation boxplots are colored with lighter shades. X is indicative of the average.
The Pearson's correlation coefficient test (r in Table 3) indicated that there was a weak, negative correlation between DOC and discharge and there was a moderate to strong, positive correlation between discharge and nitrate at all stations. The weakest DOC and discharge correlation (r = −0.11) and the strongest nitrate and discharge correlation (r = 0.61) were observed at the Wüstebach catchment outlet (W14). Note, using non-linear correlations for CQ plots between discharge and DOC or nitrate did not improve r values, except for W17 where it increased to 0.68 (y = 0.577 * ln(x) +5.742).
The coherence spectra in both the Wüstebach deforested and reference catchments indicated a highly significant anticorrelation between DOC and nitrate (Figures 6A,B). For more DOC and nitrate WTC plots for all stations, please consult the Supplementary material (Figures S1–S3). The anticorrelation is consistent on the annual time scale of 32 to 64 weeks, with DOC lagging between 4 and 8 weeks with respect to a perfect anticorrelation. In the Wüstebach catchment outlet (W14; Figure 6A; Supplementary Figure S2), there are a few significant correlations occurring at shorter time scales. These correlations are limited in time-frequency and display inconsistent phase shifts, which either result from short-term processes occurring in the catchment or are artifacts due to data gap filling. In contrast to the Wüstebach catchment, the reference catchment spectra (Figure 6B; Supplementary Figure S3) display significant correlations at shorter time scales where DOC is lagging 4 weeks behind a perfect anticorrelation to nitrate.
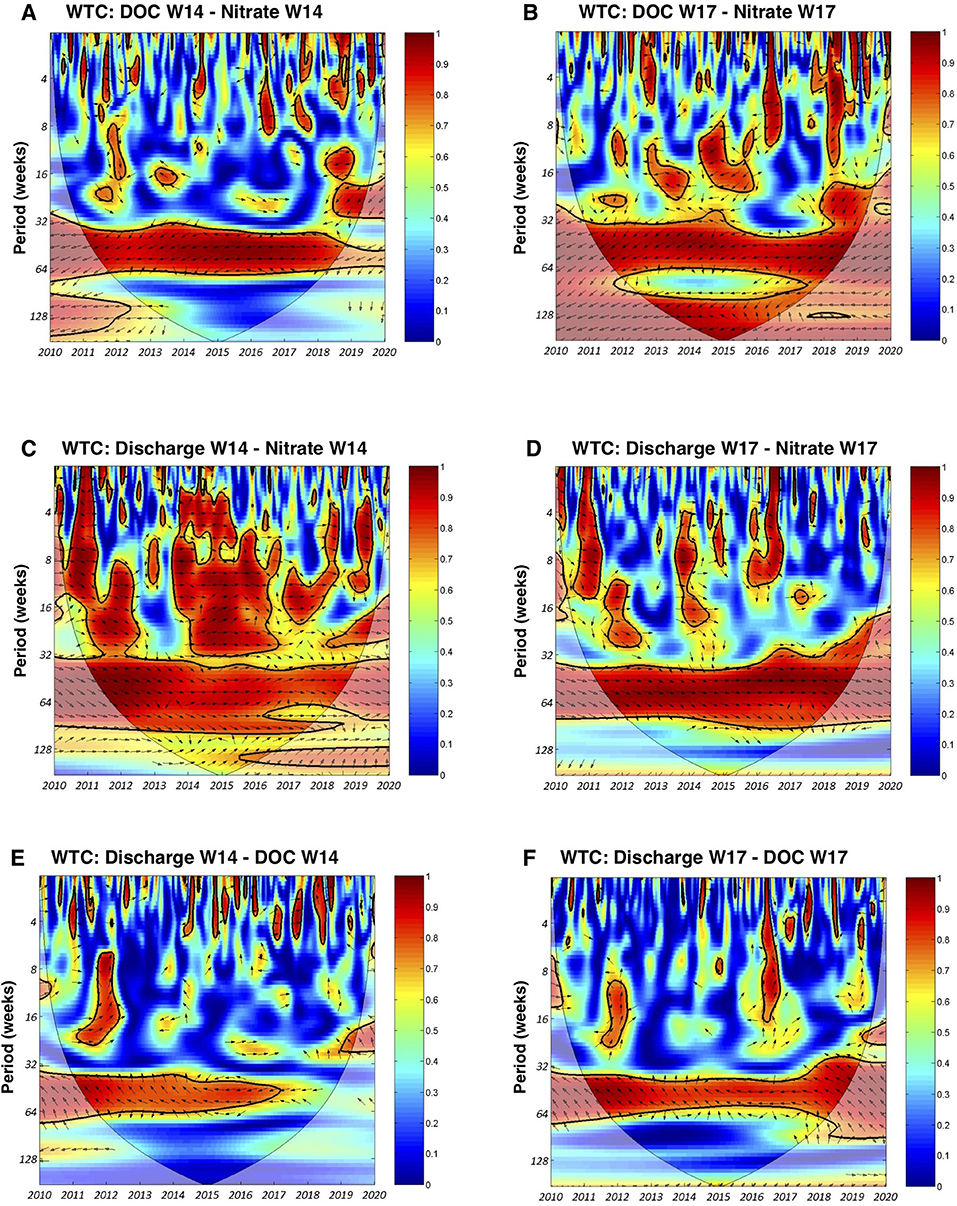
Figure 6. WTC plots indicating the relationship between DOC and nitrate (A,B), discharge and nitrate (C,D), discharge and DOC (E,F) in the main outlet of the deforested Wüstebach catchment (W14) and the reference catchment (W17). The deforestation occurred in early September 2013.
The WTC plots showing the correlation between discharge and nitrate are presented in Figures 6C,D and in the Supplementary material (Figures S4–S6). They indicate that there was a strong positive correlation between the two variables in both catchments at the time scale of 32 to ~64 weeks implying an annual correlation.
The spectra produced for W14 (Figure 6C; Supplementary Figure S5) differ from the reference catchment (Figure 6D; Supplementary Figure S6). It displays a mostly perfect positive correlation between discharge and nitrate from December 2013 to December 2016. This pattern is not found in the data of the reference catchment, where there are few short-term correlations occurring in time scales less than 32 weeks.
The WTC analysis results for the Wüstebach catchment show a highly significant anticorrelation between discharge and DOC at the annual time scale (32 to 64 weeks) from the beginning of the investigation until December 2016 (Figures 6E,F; Supplementary Figures S7–S9). There are some phase shifts in the correlation where DOC is lagging 4 to 8 weeks behind a perfect anticorrelation to discharge. A similar correlation is observed in the reference catchment (Figure 6F; Supplementary Figure S9), albeit here the anticorrelation does not decrease and disappear after December 2016. The correlation in the reference catchment appears to increase and expand over a longer period.
Discussion
Temporal changes in DOC, nitrate and discharge
Generally, the average stream nitrate concentration in Wüstebach catchment and the reference catchment decreased after the deforestation with higher, significant outliers measured in the Wüstebach stream (Figure 3). Despite the average decrease in nitrate, higher concentrations of nitrate were recorded in the Wüstebach stream during the winter months ~1 year after the deforestation (green arrows in Figure 4) until ~2017. Conversely, the average DOC concentration in both catchments increased following the deforestation with W10 recording the highest mean increase (Figure 3). The descriptive time series illustrates that there was an immediate increase in DOC concentrations following the deforestation in the affected catchment (red arrows in Figure 4) and they remained elevated for a period of 5 years. DOC transport in the Wüstebach catchment is controlled by fast runoff processes as shown by Weigand et al. (2017). Since the deforestation in the Wüstebach led to an intensification of the fast runoff processes, it was congruent that this led to increased DOC transport. The immediate increase in DOC concentrations can also be attributed, in part, to the increased C availability in the catchment. This resulted from the increased litter inputs from logging remains and increased soil C decomposition that was then exported into nearby surface waters (Schelker et al., 2012).
The increase in nitrate in W10 and W14 (Figure 3) can be attributed to the higher N mineralization in the soil because of vegetation clearing increasing soil nitrate pools that have the potential to be exported via surface runoff or leach into groundwater (Rusinga et al., 2008). Mupepele and Dormann (2016) found in their meta-analysis that effects of forest harvest are most pronounced in coniferous and deciduous forests, where clearcuts and patch-cuts result in high nitrate run-off up to 3 to 5 years after harvest. It was also noted that the intensity of harvest management has a strong influence on resulting nitrate concentration changes, i.e., if the immediate influence is low, only limited leaching of nutrients takes place (Mupepele and Dormann, 2016). The partial deforestation of the research area was carefully carried out by the management of the Eifel national park, thus resulting in very limited soil damage. This could explain the relatively limited increase in nitrate leaching directly after clearing. Although the time series (Figure 4) recorded a clear increase in nitrate in W10 and W14 for the period 1–5 years after the clearcut this increase was not recorded in the Figure 3. Overall, the concentration of nitrate decreased across all sample stations after the deforestation although the most pronounced reduction occurred in the reference catchment. This suggested that the general decrease in nitrate transport might have overcompensated an additional deforestation-induced export of W10 and W14. The general decrease in the nitrate concentration in W17 could have several reasons, i.e., a dilution effect to more runoff, climate change (2018 and 2019 were major drought events) or a general decrease in N deposition due to reduced spreading of slurry in the adjacent grassland areas. We see the same decreasing trend in nitrate concentrations in the nearby upland grassland Rollesbroich catchment in the Eiffel (unpublished data). It may also be part of a long term trend of declining atmospheric nitrate input into the forest or grassland watersheds in Europe (Templer et al., 2022).
The clear-cut resulted in increased availability of DOC and nitrate in the soils and these compounds were then readily transported to the catchment stream water. Inflated DOC concentrations can have implications on water quality, impact water biota and increase the cost of drinking water treatment (Hau et al., 2014; Ledesma et al., 2015). In-stream nutrient levels remained elevated for a period of 5 years. This finding is aligned with the results of other studies conducted on the effects of deforestation on stream water chemistry (Feller and Kimmins, 1984; Reynolds et al., 1995; Gundersen et al., 2006). The results of the Pearson's correlation test indicated that there was a negative correlation between in-stream DOC and nitrate. This inverse correlation has been observed in a number of studies (e.g., Konohira and Yoshioka, 2005; Rodríguez-Cardona et al., 2016; Roshan and DeVries, 2017). The highest, negative correlation was present in the reference stream which had an r value of −0.58 and the main outlet of the Wüstebach catchment (W14) had the lowest, but still a medium, negative correlation with an r value of −0.48 (Table 2). A previous study, conducted in the catchment prior to the deforestation, found that for the years 2009 to 2013 the in-stream correlation between these two variables was higher at all stations (W14: r value of −0.58; W17: r value of −0.67) (Weigand et al., 2017). The negative correlation thus weakened since the deforestation event but this change cannot be entirely attributed to the clear-cut because the correlation in the reference stream also decreased over time and consequently the hypothesis has been rejected. Furthermore, the results of the discharge boxplots indicate that the quantity of discharge measured in the deforested catchment increased post disturbance with more extreme outliers being recorded across all stations. This result is expected as forest loss is accompanied by an increase in surface runoff, peak flows and discharge (Guzha et al., 2018).
Spatio-temporal changes in DOC, nitrate and discharge
The results of the DOC and nitrate wavelet analysis indicated significant anticorrelations occurring from 32 to 64 weeks in both catchments (Figures 6A,B; Supplementary Figures S1–S3). Despite deforestation occurring in the late summer of 2013, it appears to have had no visible effect on the anticorrelation. In contrast to the Wüstebach catchment, the anticorrelation in the reference catchment appeared to be stronger and occurred at a shorter time scale. This difference may be attributed to the small riparian zone (i.e., Gleysols, Histosols and Planosols region; Figure 1) in the reference catchment, which results in lower in-stream DOC and higher nitrate concentrations (Stockinger et al., 2014). Riparian zones play a role in nutrient retention as the physical and biogeochemical properties that occur in these ecotones control the fluctuation of water, nutrients and other substances between the hillslopes and the stream (Weigelhofer et al., 2012; Finkler et al., 2021). Thus, riparian zones play an important role in removing nitrate from subsurface flows due to vegetation uptake and increased denitrification (Hill et al., 2014; Hill, 2019) and in C production and storage (Rheinhardt et al., 2012). This indicates that the much smaller riparian zone in the reference catchment leads to more export of nitrate via subsurface flows and less export of DOC as lower amounts of C are produced and stored in the immediate surroundings of the stream.
The coherence spectra of the relationship between discharge and nitrate of the Wüstebach stream (but not for the reference stream) showed an increased correlation in almost all time periods after the deforestation (Figure 6C; Supplementary Figures S4, S5), indicating the effect of the deforestation measure. This shorter period correlation in the affected catchment may be attributed to the increased soil mineralization due to higher energy without shading (Rusinga et al., 2008). Increased mineralization after clearcut would result in more “mobile” nitrate that exceeds the needs of soil fauna, which could explain the increased correlation with discharge.
Furthermore, the annual anti-correlation between discharge and DOC decreased strongly in the (partially) deforested Wüstebach catchment, while this anti-correlation remained unchanged in the reference catchment (Figures 6E,F; Supplementary Figures S7–S9). The decrease in the annual anti-correlation between these two variables may be explained by the increase in soil C availability due to deforestation, as clear-cutting has both direct and indirect effects on C stocks and fluxes in terrestrial environments (Bala et al., 2007). This increased availability of soil organic C may lead to increased export during precipitation events via direct runoff, as evidenced by the disappearance of in-stream anti-correlation.
Advanced correlation (wavelet) analysis allowed us, even within the transitional post-deforestation ecosystem recovery, to detect “underlying” changes in correlation and lag time between stream water DOC and nitrate over different time scales. It highlighted that the deforestation “shock effect” on water quality in this catchment lasted for at least 5 years. Although the present study was applied to a relatively small (<40 ha) catchment, it is likely that when appropriate data is available, our wavelet-based approach can be duplicated in other larger or smaller catchments and used to reveal the response of other nutrient or ionic pairings (e.g., carbon vs. potassium, sulfate vs. phosphate).
Conclusion
The average in-stream nitrate levels decreased after the deforestation across all stations, but the most notable decrease occurred in the reference catchment. The mean in-stream DOC concentration increased post deforestation at all three stations, with the most pronounced increase occurring in the deforested catchment. Following the deforestation there was an immediate spike in DOC concentrations in the deforested catchment, followed by a spike in nitrate ~1 year later. Elevated stream water nutrient levels peaked around 2 to 3 years after the clear-cutting but returned to pre-deforestation levels after ~5 years, thus indicating that the effects on water quality were ultimately transient. The correlation between discharge and DOC or nitrate was altered due to the increased soil nutrient availability after the deforestation. Critically, even for severe management forest interventions (here deforestation), generic statistical analyses did not fully reveal the complex temporal relationship between the solutes and discharge. Wavelet coherence analysis filled this gap by highlighting “underlying” altered strengths and direction of key correlations at different time scales.
Data availability statement
The datasets presented in this study can be found in online repositories. The names of the repository/repositories and accession number(s) can be found below: https://doi.org/10.5281/zenodo.6907193 for gap filled data from Robinson (2022) and www.tereno.net for the original stream water DOC and nitrate data from the TERENO data portal.
Author contributions
KR, HB, RB, and EC contributed to the conception and design of the study. KR collected and processed the data, performed the statistical analysis, and wrote the first draft of the manuscript. KR and HB accomplished the data interpretation. HB, RB, and EC commented on the draft, which was afterwards revised and submitted. All authors assisted with the revision and approved the final submitted version uploaded by KR.
Funding
Authors would like to thank TERENO (Terrestrial Environmental Observatories), financed by the Helmholtz Association. RB and HB acknowledge funding from POF IV: 2021-2026, grant 2173 Toward a Sustainable Bioeconomy—Resources, Utilization, Engineering and Agroecosystems.
Conflict of interest
The authors declare that the research was conducted in the absence of any commercial or financial relationships that could be construed as a potential conflict of interest.
Publisher's note
All claims expressed in this article are solely those of the authors and do not necessarily represent those of their affiliated organizations, or those of the publisher, the editors and the reviewers. Any product that may be evaluated in this article, or claim that may be made by its manufacturer, is not guaranteed or endorsed by the publisher.
Supplementary material
The Supplementary Material for this article can be found online at: https://www.frontiersin.org/articles/10.3389/frwa.2022.1003693/full#supplementary-material
References
Arias-Ortiz, A., Masqué, P., Glass, L., Benson, L., Kennedy, H., Duarte, C. M., et al. (2020). Losses of soil organic carbon with deforestation in mangroves of Madagascar. Ecosystems 24, 1–19. doi: 10.1007/s10021-020-00500-z
Bala, G., Caldeira, K., Wickett, M., Phillips, T. J., Lobell, D. B., Delire, C., et al. (2007). Combined climate and carbon-cycle effects of large-scale deforestation. Proceed. Nat. Acad. Sci. 104, 6550–6555. doi: 10.1073/pnas.0608998104
Bogena, H., Montzka, C., Huisman, J., Graf, A., Schmidt, M., Stockinger, M., et al. (2018). The TERENO-Rur hydrological observatory: a multiscale multi-compartment research platform for the advancement of hydrological science. Vadose Zone J. 17, 1–22. doi: 10.2136/vzj2018.03.0055
Bogena, H.R., Bol, R., Borchard, N., Bruggemann, N., Diekkruger, B., Drue, C., et al. (2015). A terrestrial observatory approach to the integrated investigation of the effects of deforestation on water, energy, and matter fluxes. Sci. China Earth Sci. 58, 61–75. doi: 10.1007/s11430-014-4911-7
Bogena, H. R., Stockinger, M. P., and Lücke, A. (2020). Long-term stable water isotope and runoff data for the investigation of deforestation effects on the hydrological system of the Wüstebach catchment, Germany. Hydrol. Process. 35, e14006. doi: 10.1002/hyp.14006
Bredemeier, M., Merino, A., and Gallardo Lancho, J. F. (2012). Water and carbon in forests: challenges for forest management under the pressures of climate change. Eur. J. Forest Res. 131, 1639–1642. doi: 10.1007/s10342-012-0655-0
Brighenti, S., Engel, M., Tolotti, M., Bruno, C. M., Wharton, G., Comiti, F., et al. (2021). Contrasting physical and chemical conditions of two rock glacier springs. Hydrol. Process. 35, 4. doi: 10.1002/hyp.14159
Burger, D. J., Vogel, J., Kooijman, A. M., Bol, R., de Rijke, E., Schoorl, J., et al. (2021). Colloidal catchment response to snowmelt and precipitation events differs in a forested headwater catchment. Vadose Zone J. 20, e20126. doi: 10.1002/vzj2.20126
Ekblad, A., and Bastviken, D. (2019). Deforestation releases old carbon. Nat. Geosci. 12, 499–500. doi: 10.1038/s41561-019-0394-7
Fang, Z., Bogena, H. R., Kollet, S., Koch, J., and Vereecken, H. (2015). Spatio-temporal validation of long-term 3D hydrological simulations of a forested catchment using empirical orthogonal functions and wavelet coherence analysis. J. Hydrol. 529, 1754–1767. doi: 10.1016/j.jhydrol.2015.08.011
Feller, M. C., and Kimmins, J. P. (1984). Effects of clearcutting and slash burning on streamwater chemistry and watershed nutrient budgets in southwestern British Columbia. Water Resour. Res. 20, 29–40. doi: 10.1029/WR020i001p00029
Finkler, N. R., Gücker, B., Boëchat, I. G., Ferreira, M. S., Tanaka, M. O., and Cunha, D. G. F. (2021) Riparian land use hydrological connectivity influence nutrient retention in tropical rivers receiving wastewater treatment plant discharge. Front. Environ. Sci. 9, 709922. doi: 10.3389/fenvs.2021.709922
Frainer, A., and McKie, B. G. (2021). The legacy of forest disturbance on stream ecosystem functioning. J. Appl. Ecol. 58, 151–1522. doi: 10.1111/1365-2664.13901
Fujii, K., Funakawa, S., Hayakawa, C., and Kosaki, T. (2021). Effects of clearcutting and girdling on soil respiration and fluxes of dissolved organic carbon and nitrogen in a Japanese cedar plantation. Forest Ecol. Manage. 498, 119520. doi: 10.1016/j.foreco.2021.119520
Gandois, L., Cobb, A. R., Hei, I. C., Lim, L. B. L., and Salim, K. A. C. F. (2012). Impact of deforestation on solid and dissolved organic matter characteristics of tropical peat forests: implications for carbon release. Biogeochemistry 114, 183–199. doi: 10.1007/s10533-012-9799-8
Georgiev, K. B., Beudert, B., Bässler, C., Feldhaar, H., Heibl, C., Karasch, P., et al. (2021). Forest disturbance and salvage logging have neutral long-term effects on drinking water quality but alter biodiversity. Forest Ecol. Manage. 495, 119354. doi: 10.1016/j.foreco.2021.119354
Gholami, V. (2013). The influence of deforestation on runoff generation and soil erosion (Case study: Kasilian Watershed). J. Forest Sci. 59, 272–278. doi: 10.17221/20/2013-JFS
Graf, A., Bogena, H. R., Drüe, C., Hardelauf, H., Pütz, T., Heinemann, G., et al. (2014). Spatiotemporal relations between water budget components and soil water content in a forested tributary catchment. Water Resour. Res. 50, 4837–4857. doi: 10.1002/2013WR014516
Grinsted, A., Moore, J. C., and Jevrejeva, S. (2004). Application of the cross wavelet transform and wavelet coherence to geophysical time series. Nonlinear Process. Geophys. 11, 561–566. doi: 10.5194/npg-11-561-2004
Guiry, E. J., Buckley, M., Orchard, T. J., Hawkins, A. L., Needs-Howarth, S., Holm, E., et al. (2020). Deforestation caused abrupt shift in Great Lakes nitrogen cycle. Limnol. Oceanogr. 65, 1921–1935. doi: 10.1002/lno.11428
Gundersen, P., Schmidt, I. K., and Raulund-Rasmussen, K. (2006). Leaching of nitrate from temperate forests - effects of air pollution and forest management. Environ. Rev. 14, 1–57. doi: 10.1139/a05-015
Guo, Z., Wang, Y., Wan, Z., Zuo, Y., He, L., Li, D., et al. (2020). Soil dissolved organic carbon in terrestrial ecosystems: global budget, spatial distribution and controls. Glob. Ecol. Biogeogr. 29, 2159–2175. doi: 10.1111/geb.13186
Guzha, A., Rufino, M., Okoth, S., Jacobs, S., and Nóbrega, R. (2018). Impacts of land use and land cover change on surface runoff, discharge and low flows: evidence from East Africa. J. Hydrol.: Regional Stud. 15, 49–67. doi: 10.1016/j.ejrh.2017.11.005
Haghverdi, K., and Kooch, Y. (2020). Soil carbon and nitrogen fractions in response to land use/cover changes. Acta Oecologica 109, 103659. doi: 10.1016/j.actao.2020.103659
Hamilton, R. L., Trimmer, M., Bradley, C., and Pinay, G. (2016). Deforestation for oil palm alters the fundamental balance of the soil N cycle. Soil Biol. Biochem. 95, 223–232. doi: 10.1016/j.soilbio.2016.01.001
Hau, K., Zhu, B., and Wang, X. (2014). Dissolved organic carbon loss fluxes through runoff and sediment on sloping upland of purple soil in the Sichuan Basin. Nutr. Cyc.l Agroecosyst. 98, 125–135 doi: 10.1007/s10705-014-9601-5
Heppell, C. M., Binley, A., Trimmer, M., Darch, T., Jones, A., Malone, E., et al. (2017). Hydrological controls on DOC: nitrate resource stoichiometry in a lowland, agricultural catchment, southern UK. Hydrol. Earth Sys. Sci. 21, 4785–4802. doi: 10.5194/hess-21-4785-2017
Hill, A. R. (2019). Groundwater nitrate removal in riparian buffer zones: a review of research progress in the past 20 years. Biogeochemistry 143, 347–369. doi: 10.1007/s10533-019-00566-5
Hill, A. R., Devito, K. J., and Vidon, P. G. (2014). Long-term nitrate removal in a stream riparian zone. Biogeochemistry 121, 425–439. doi: 10.1007/s10533-014-0010-2
Hlásny, T., Kočický, D., Maretta, M., Sitková, Z., Barka, I., Konôpka, M., et al. (2015). Effect of deforestation on watershed water balance: hydrological modelling-based approach / Vplyv odlesnenia na vodnú bilanciu povodia: prístup na báze hydrologického modelovania. Forestry J. 61, 89–100. doi: 10.1515/forj-2015-0017
Jacobs, R., Breuer, L., Butterbach-Bahl, K., Pelster, D. E., and Rufino, M. C. (2017). Land use affects total dissolved nitrogen and nitrate concentrations in tropical montane streams in Kenya. Sci. Tot. Environ. 603, 519–532. doi: 10.1016/j.scitotenv.2017.06.100
Kalbitz, K., Glaser, B., and Bol, R. (2004). Clear-cut of a Norway spruce stand – implications for controls on the dynamics of dissolved organic matter in the forest floors. Eur. J. Soil Sci. 55, 401–413. doi: 10.1111/j.1351-0754.2004.00609.x
Konohira, E., and Yoshioka, T. (2005). Dissolved organic carbon and nitrate concentrations in streams: a useful index indicating carbon and nitrogen availability in catchments. Ecol. Res. 20, 359–365. doi: 10.1007/s11284-005-0051-z
Kreutzweiser, D. P., Hazlett, P. W. J. M., and Gunn, J. M. (2008). Logging impacts on the biogeochemistry of boreal forest soils and nutrient export to aquatic systems: a review. Environ. Rev. 16, 157–179. doi: 10.1139/A08-006
Ledesma, J. L. J., Grabs, T., Bishop, K. H., Schiff, S. L., and Köhler, S. J. (2015). Potential for long-term transfer of dissolved organic carbon from riparian zones to streams in boreal catchments. Glob. Change Biol. 21, 2963–2979. doi: 10.1111/gcb.12872
Lloyd, C. E. M., Freer, J. E., Collins, A. L., Johnes, P. J., and Jones, J. I. (2014). Methods for detecting change in hydrochemical time series in response to targeted pollutant mitigation in river catchments. J. Hydrol. 514, 297–312. doi: 10.1016/j.jhydrol.2014.04.036
Mostovaya, A., Hawkes, J. A., Dittmar, T., and Tranvik, L. J. (2017). Molecular determinants of dissolved organic matter reactivity in lake water. Front. Earth Sci. 5, 106. doi: 10.3389/feart.2017.00106
Mupepele, A. C., and Dormann, C. F. (2016). Influence of forest harvest on nitrate concentration in temperate streams — a meta-analysis. Forests 8, 5. doi: 10.3390/f8010005
Nabuurs, G. J., Masera, O., Andrasko, K., Benitez-Ponce, P., Boer, R., Dutschke, M., et al. (2007). “Forestry,” in Climate Change 2007: Mitigation. Contribution of Working Group III to the Fourth Assessment Report of the Intergovernmental Panel on Climate Change, eds B. Metz, O.R. Davidson, P.R. Bosch, R. Dave, and L.A. Meyer (Cambridge, United Kingdom and New York, NY, USA: Cambridge University Press), 541–585.
Neuwirth, B., Rabbel, I., Bendix, J., Bogena, H. R., and Thies, B. (2021). The European heat wave 2018: The dendroecological response of oak and spruce in western Germany. Forests 12, 283. doi: 10.3390/f12030283
Nogueira, E. M., Yanai, A. M., de Vasconcelos, S. S., de Alencastro Graça, P. M. L., and Fearnside, P. M. (2017). Carbon stocks and losses to deforestation in protected areas in Brazilian Amazonia. Region. Environ. Change 18, 261–270. doi: 10.1007/s10113-017-1198-1
Reynolds, B., Stevens, P. A., Hughes, S., Parkinson, J. A., and Weatherley, N. S. (1995). Stream chemistry impacts of conifer harvesting in welsh catchments. Water, Air, and Soil Pollut. 79, 147–170. doi: 10.1007/BF01100435
Rezaei, A., and Saatsaz, M. (2021). Large-scale climate indices teleconnections with hydrochemical and isotopic characteristics of a karst spring using wavelet analysis. Environ. Earth Sci. 80, 335. doi: 10.1007/s12665-021-09636-0
Rheinhardt, R. D., Brinson, M. M., Meyer, G. F., and Miller, K. H. (2012). Carbon storage of headwater riparian zones in an agricultural landscape. Carbon Balance and Manage. 7, 1–5. doi: 10.1186/1750-0680-7-4
Robinson, K. (2022). Dataset Effect Forest Wuestebach Tereno Wavelet (1). Zenodo doi: 10.5281/zenodo.6907193
Rodríguez-Cardona, B., Wymore, A. S., and McDowell, W. H. (2016). DOC:NO3–ratios and NO3–uptake in forested headwater streams. J. Geophys. Res.: Biogeosci. 121, 205–217. doi: 10.1002/2015JG003146
Roshan, S., and DeVries, T. (2017). Efficient dissolved organic carbon production and export in the oligotrophic ocean. Nat. Commun. 8, 1–8. doi: 10.1038/s41467-017-02227-3
Rusinga, F., Israel, S., and Tredoux, G. (2008). Effect of vegetation clearing on the nitrogen cycle and water resource quality in South Africa. Curr. Plant Sci. Biotechnol. Agric. 42, 99–100. doi: 10.1007/978-1-4020-8252-8_34
Saner, P., Loh, Y. Y., Ong, R. C., and Hector, A. (2012). Carbon stocks and fluxes in tropical lowland dipterocarp rainforests in Sabah, Malaysian Borneo. PLoS ONE 7, e29642. doi: 10.1371/journal.pone.0029642
Schelker, J., Eklöf, K., Bishop, K., and Laudon, H. (2012). Effects of forestry operations on dissolved organic carbon concentrations and export in boreal first-order streams. J. Geophys. Res. Biogeosci. 117, 1011–1032. doi: 10.1029/2011JG001827
Sinha, S., Routh, P. S., Anno, P. D., and Castagna, J. P. (2005). Spectral decomposition of seismic data with continuous-wavelet transform. Geophysics 70, 19–25. doi: 10.1190/1.2127113
Stockinger, M., Bogena, H., Lücke, A., Diekkrüger, B., Weiler, M., Vereecken, H., et al. (2014). Seasonal soil moisture patterns control transit time distributions in a forested headwater catchment. Water Resour. Res. 50, 5270–5289. doi: 10.1002/2013WR014815
Taylor, P. G., and Townsend, A. R. (2010). Stoichiometric control of organic carbon–nitrate relationships from soils to the sea. Nature 464, 1178–1181. doi: 10.1038/nature08985
Templer, P. H., Harrison, J. L., Pilotto, F., Flores-Díaz, A., Haase, P., McDowell, W. H., et al. (2022). Atmospheric deposition and precipitation are important predictors of inorganic nitrogen export to streams from forest and grassland watersheds: a large-scale data synthesis. Biogeochemistry 106, 219–241. doi: 10.1007/s10533-022-00951-7
Torrence, C., and Compo, G. P. (1998). A practical guide to wavelet analysis. Bull. Am. Meteorol. Soc. 79, 61–78.
Torrence, C., and Webster, P. J. (1999). Interdecadal changes in the ENSO–Monsoon system. J. Clim. 12, 2679–2690.
USS Working Group WRB (2015). World Reference Base for Soil Resources 2014, update 2015 International Soil Classification System for Naming Soils and Creating Legends for Soil Maps. World Soil Resources Reports No. 106. FAO, Rome.
Vaughan, M. C., Bowden, W. B., Shanley, J. B., Vermilyea, A., Sleeper, R., Gold, A. J., et al. (2017). High-frequency dissolved organic carbon and nitrate measurements reveal differences in storm hysteresis and loading in relation to land cover and seasonality. Water Resour. Res. 53, 5345–5363. doi: 10.1002/2017WR020491
Weigand, S., Bol, R., Reichert, B., Graf, A., Wiekenkamp, I., Stockinger, M., et al. (2017). Spatiotemporal analysis of dissolved organic carbon and nitrate in waters of a forested catchment using wavelet analysis. Vadose Zone J. 16, vzj09.0077. doi: 10.2136/vzj2016.09.0077
Weigelhofer, G., Fuchsberger, J., Teufl, B., Welti, N., and Hein, T. (2012). Effects of Riparian forest buffers on in-stream nutrient retention in agricultural catchments. J. Environ. Qual. 41, 373–379. doi: 10.2134/jeq2010.0436
Wiekenkamp, I., Huisman, J., Bogena, H., Graf, A., Lin, H., Drüe, C., et al. (2016). Changes in measured spatiotemporal patterns of hydrological response after partial deforestation in a headwater catchment. J. Hydrol. 542, 648–661. doi: 10.1016/j.jhydrol.2016.09.037
Wiekenkamp, I., Huisman, J. A., Bogena, H. R., and Vereecken, H. (2019). Effects of deforestation on water flow in the vadose zone. Water 12, 35. doi: 10.3390/w12010035
Yuan, K., Zhu, Q., Zheng, S., Zhao, L., Chen, M., Riley, W. J., et al. (2021). Deforestation reshapes land-surface energy-flux partitioning. Environ. Res. Lett. 16, 024014. doi: 10.1088/1748-9326/abd8f9
Keywords: wavelet-analysis, deforestation, water chemistry, biogeochemical cycles, catchment, nitrate, dissolved organic carbon
Citation: Robinson K, Bogena HR, Wang Q, Cammeraat E and Bol R (2022) Effects of deforestation on dissolved organic carbon and nitrate in catchment stream water revealed by wavelet analysis. Front. Water 4:1003693. doi: 10.3389/frwa.2022.1003693
Received: 26 July 2022; Accepted: 21 October 2022;
Published: 10 November 2022.
Edited by:
Mohammad Safeeq, University of California, Merced, United StatesReviewed by:
Yang Yang, University of California, Merced, United StatesFa Li, University of Wisconsin-Madison, United States
Copyright © 2022 Robinson, Bogena, Wang, Cammeraat and Bol. This is an open-access article distributed under the terms of the Creative Commons Attribution License (CC BY). The use, distribution or reproduction in other forums is permitted, provided the original author(s) and the copyright owner(s) are credited and that the original publication in this journal is cited, in accordance with accepted academic practice. No use, distribution or reproduction is permitted which does not comply with these terms.
*Correspondence: Roland Bol, ci5ib2xAZnotanVlbGljaC5kZQ==