 Yaser Kishawi
 Aaron R. Mittelstet
 Zablon Adane
 Nawaraj Shrestha
 Paolo Nasta
- 1Department of Biological Engineering, University of Nebraska-Lincoln, Lincoln, NE, United States
- 2The World Resources Institute, Washington, DC, United States
- 3School of Natural Resources, University of Nebraska-Lincoln, Lincoln, NE, United States
- 4Department of Agricultural Sciences, AFBE Division, University of Naples Federico II, Portici, Naples, Italy
The Nebraska Sand Hills (NSH) is considered a major recharge zone for the High Plains Aquifer in the central United States. The uncontrolled expansion of the eastern redcedar (Juniperus Virginiana) under climate warming is posing threats to surface water and groundwater resources. The combined impact of land use and climate change on the water balance in the Upper Middle Loup River watershed (4,954 km2) in the NSH was evaluated by simulating different combinations of model scenarios using the Soil Water Assessment Tool (SWAT) model. A total of 222 climate models were ranked according to the aridity index and three models representing wet, median (most likely), and dry conditions were selected. Additionally, the impacts of carbon dioxide (CO2) emissions on root water uptake were simulated. Four plausible redcedar encroachment scenarios, namely 0.5% (no encroachment), 2.4, 4.6, and 11.9%, were considered in the numerical simulations. We, therefore, built: i) the historical scenario (2000–2019) with the current climate and redcedar cover leading to baseline results; ii) the most-likely future scenario (2020–2099) with projected climate (50th percentile of aridity index distribution) and redcedar encroachment that was estimated by using a combination of neural network and Markov-chain cellular automata model; iii) 16 future scenarios (2020–2099) with different combinations of extreme climate (5th and 95th percentiles of aridity index distribution) and four hypothetical encroachment scenarios (0.5, 2.4, 4.6, and 11.9%). The most-likely climate projection indicates that a warming pattern will be expected with a 4.1°C increase in average over the 100-year period, and this will be associated with lower-than-normal precipitation (P). Nevertheless, the concurrent increase in temperature and CO2 concentration is likely to induce stomata closure by reducing potential (ETp) and actual (ETa) evapotranspiration losses. Projected P and ETa are expected to decrease by 10 and 14% while recharge (R) and discharge (D) are expected to increase by 38 and 30% for the period 2020-2050. For the period 2051-2099, the projected P and ETa are expected to decrease by 8 and 32% while R and D are expected to increase by 140.2 and 40%. Finally, a sensitivity analysis of 16 combined climate and land use scenarios is presented and discussed. The scenario modeling approach presented in this paper can support decision-making by stakeholders for optimal management of water resources.
Introduction
Historically, water has been considered the backbone of human civilization and the main factor in its development. Increasing water demand related to the intensification of agriculture, industry, and domestic water uses and decreasing freshwater supplies have made it critical to continuously explore additional water sources and ways to achieve universal water access. Globally, the agricultural sector uses between 60 and 90% of water (Pedro-Monzonís et al., 2015; Adeyemi et al., 2017) and according to the Food and Agriculture Organization, FAO (2017) and Doungmanee (2016), this accounts for nearly 72.5% of freshwater withdrawals. Agriculture is considered the major user of groundwater and surface water in the United States (U.S.) with 80% consumption of water resources (up to 90% in the Western U.S.) (Hrozencik, 2021). Because 60% of irrigation in the U.S. relies on groundwater, aquifer overexploitation can significantly impact crop production. More importantly, groundwater depletion in the irrigated High Plains accounts for ~50% of groundwater depletion (Scanlon et al., 2012).
The High Plains Aquifer represents an invaluable source of groundwater for the U.S. The aquifer is in the central part of the U.S. expanding from South Dakota in the north to Texas in the south. It underlies parts of eight states (Overmann, 2021) with a total area of ~453,248 km2 and total recoverable water in the storage of about 3.6 trillion m3 (McGuire, 2017). The dust bowl of the 1930s and the development of modern pump hydraulics, improvements in irrigation technology, and availability of low-cost energy increased the number of wells drilled into the aquifer from 21,000 wells to 30,000 in 1980 (Gutentag et al., 1984) then increased to 200,000 wells in recent years (Hennings and Lynch, 2022). This reliable source of water helped transform this part of the U.S. into the “Breadbasket of the World” (Steward and Allen, 2016). However, groundwater withdrawals have greatly exceeded R rates by ~3 to 1 (American Ground Water Trust., 2002), decreasing the water storage by 410 km3 from 1935 to 2011 (Haacker et al., 2016). The largest reduction in water storage has been recorded in the Central and Southern Plains where the storage has declined by more than 11.9% per decade. The water level decline has been minimal in the Northern High Plains, the location of the Nebraska Sand Hills (NSH) (Haacker et al., 2016).
The NSH is considered a major recharge zone for the High Plains Aquifer. According to Rossman et al. (2014), the sand dunes in the NSH are composed of eolian sand (well-sorted) and fine-to-medium grained soil. This region has high sand content ranging from 94 to 97% which yields high infiltration rates and minimal overland flow. Eggemeyer et al. (2009) stated that 36% of the High Plains Aquifer area and 65% of its water are located under Nebraska (specifically NSH) where 6–14% of the annual precipitation (P) recharges the aquifer. Szilagyi et al. (2011) estimated that the largest mean annual recharge rates (200 ± 85 mm yr−1) occur in the southern and eastern parts of the NSH while smaller rates (40 ± 59 mm yr−1) occur in the western part. This supports the importance of the NSH as a recharge zone for the High Plains Aquifer.
In the NSH, the largest land use threat is the eastern redcedar (Juniperus Virginiana) (Heavican, 2021). Redcedar, a native Nebraska flora, was historically controlled by wildfires (Axmann and Knapp, 1993). The reduction in wildfires and the planting of redcedar for windbreaks have increased the number of trees in the NSH. Shrestha (2022) found that the area of redcedar in this part of Nebraska increased from 686.30 ± 409.58 km2 in 1990 to 1,521 ± 316.09 km2 in 2020 based on stratified random estimates. The encroachment rate thus varied between 2.26 and 11.19% annually. Applying the Markov-chain and cellular automata model to the encroachment trend estimated redcedar cover would increase from 5,016 km2 to 14,256 km2 by 2099.
Kishawi et al. (2023) used different scenarios that considered redcedar encroachment spatially throughout the watershed with different encroachment levels ranging from 11.9 to 100% of grassland converted to redcedar. The study found, for example, that 16.1% redcedar encroachment in the NSH can reduce D by 12% and increase evapotranspiration and percolation by 0.6 and 3.4%, respectively. With 100% encroachment, the D would be reduced by nearly 50% while the recharge increased by 26% thus potentially increasing the concentration of atrazine in the Platte River by 16.3 to 48.1%. Starks and Moriasi (2017) considered 10% increments of redcedar encroachments in the North Canadian River watershed in central Oklahoma. They found that if rangeland was replaced by redcedar completely (100% encroachment), a reduction in D could reach 112% of the current municipal water demand and 89% of the projected 2,060 demand. Zou et al. (2018) found that a complete conversion of rangeland to redcedar would reduce D by 20 to 40%. None of these studies considered the additional impact of climate change on the hydrology of the watershed.
Both land use and climate change can cause significant changes in water resources. Hydrological models can help understand how these variables interact and impact the water cycle. Several studies have evaluated the impact of climate change on the hydrological cycle at the watershed scale. Some studies applied different representative concentration pathways (RCPs) scenarios for different climate models under Coupled Model Intercomparison Project 5 (CMIP5) using RCP2.6, RCP4.5, and RCP8.5 (Fant et al., 2017; Ercan et al., 2020; Wang et al., 2020), or consider the impacts of changing CO2 on hydrological fluxes while applying climate models (Perazzoli et al., 2013; Lee et al., 2018b). Many studies used the Soil Water Assessment Tool (SWAT) with climate models on different scales worldwide (Pandey et al., 2021; Touseef et al., 2021), in the U.S. (Mueller-Warrant et al., 2019; Ercan et al., 2020) and in Nebraska (van Liew et al., 2012; Rehana et al., 2018).
Few studies have also evaluated the combined impact of both land use and climate change (Zhang et al., 2016; Petrovic, 2021; Teklay et al., 2021). Petrovic (2021) studied the impacts of both climate and land use change on hydrology and found that the overall decline of annual flow is due to the decline in seasonal flow under combined scenarios. Teklay et al. (2021) studied four land-use scenarios under climate projections from 2005–2015 to 2045–2055 using RCP4.5 and RCP8.5. The results showed that surface runoff increased by 5.1% while baseflow decreased by 6.5%. Under expansion of irrigation crops and forest, D decreased by 12.5 and 5.2%, while evapotranspiration increased by 4.8 and 8.9%, respectively. Under RCP8.5, D, surface runoff, and evapotranspiration increased by 34.3%, 51.8%, and 12.2% showing that climate change was more important than land-use change. Zhang et al. (2016) agreed with this conclusion by assessing separate and combined hydrological impacts of land use and climate change between 1995–2014 and 2015–2024. Zhang et al. (2016) applied two land-use models in SWAT and applied hypothetical climate scenarios based on analyzing climatic observations. It was concluded that a slight reductions in surface runoff and baseflow was due to land-use change.
The overall objective of this study is to simulate the combined impact of climate change and redcedar encroachment on the water balance in the NSH including impacts on recharge. The specific objectives of this study are to: i) evaluate the impact of historical climate and land use on D (D), recharge (R), deep recharge (DR), and actual evapotranspiration (ETa) (representing the main water balance components) within the study area during the historical period (2000–2019), ii) compare the impact of historical and most-likely climate and land use change scenario (2020–2099) on the water balance components, and iii) compare the impact of historical and 16 hypothetical scenarios (different combinations of redcedar encroachment and climate change) (2020–2099) on the water balance components.
Methodology
Study area
The study area is the Upper Middle Loup River (UMLR) watershed (4,954 km2), located in the NSH. The NSH, located in the western part of Nebraska, has a total area of 51,000 km2 (Figure 1). It consists of sand dunes with interdunal watersheds connected with an unconfined aquifer with many lakes and wetlands, predominantly in the western part. The climate in the study area is semi-arid with mean annual P 571.04 mm yr−1 and mean temperature of around 9.54°C for the historical period (2000–2019). The study area is covered by 93% pasture, 4.3% wetlands, 1.1% lakes and minimal cropland, urban and forest (Kishawi et al., 2023).
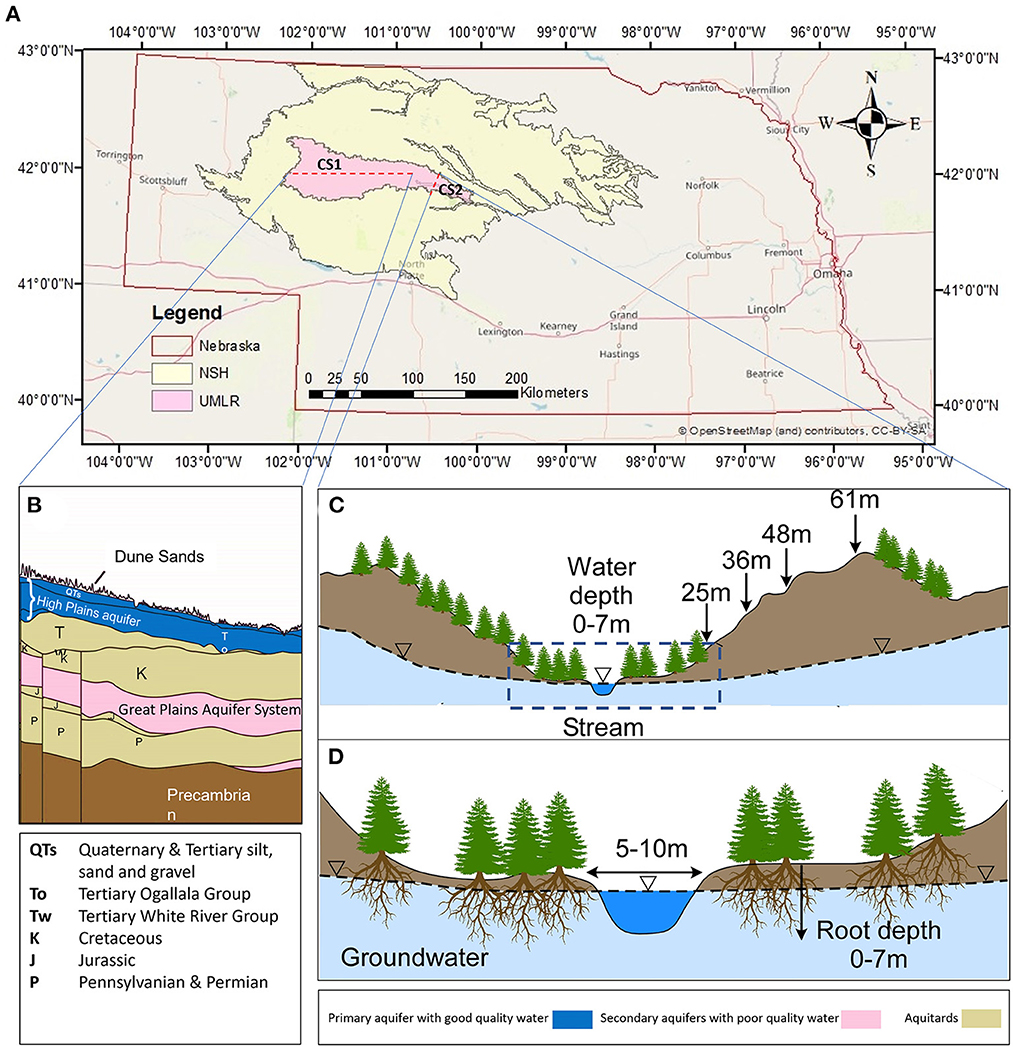
Figure 1. Map of the Upper Middle Loup River (UMLR) watershed (pink area) within the Nebraska Sand Hills (yellow area) and Nebraska (red line) (A). The red dotted line CS1 represent the cross-section shown in (B) and red dotted line CS2 represent the cross section in (C). The cross section (D) is a close-up view of (C).
While currently < 1% of the study area is covered by eastern redcedar (Juniperus Virginiana), 256,653 ha of grassland was converted to woody vegetation (predominantly redcedar) from 2007 to 2017 in Nebraska (Fogarty et al., 2020). Nearly 21,000 ha of Sand Hills grassland was converted to woody vegetation. The encroachment rate has increased significantly east, north and south of the UMLR watershed (Shrestha, 2022). Once controlled by wildfires, fire suppression and tree planting for windbreaks has led to the expansion of redcedar encroachment. Redcedar, concentrated near streams and windbreaks, would encroach into the grassland.
The thickness of the High Plains Aquifer can exceed 300 m with most of the sand dunes covered with grassland. The High Plains Aquifer is composed primarily of unconsolidated, poorly sorted clay, silt, sand, and gravel and was laid 10 to 12 million years ago by fluvial deposition from streams that flowed eastward from the Rocky Mountains during the Pliocene. The High Plains Aquifer in Nebraska and South Dakota is an unconfined system composed of sedimentary deposits of Quaternary, Tertiary, and Cretaceous age. The aquifer system thins from south to north and from west to east where the base of the aquifer slopes eastward at ~1.5 meter per kilometer. The depth of the water table varies from surface D to more than 150 m. Generally, the aquifer is found from 15 to 90 m below the surface. Saturated thickness ranges from zero (mainly near the western edge) to about 304 m in west-central Nebraska (Sand Hills region) but overall averages around 60 m (Gutentag et al., 1984).
Scenario modeling approach
SWAT is a semi-distributed ecohydrological model operating on a daily time scale at a watershed scale (Arnold et al., 1998; Dile et al., 2016; Mundetia, 2019). The main components of the water balance equation are the daily change in water storage (ΔWS) as controlled by P, ETa, and water yield. Water yield is given by the contribution of surface runoff, lateral flow, and groundwater circulation. Water yield is partially depleted by transmission losses from tributary channels and water abstractions. The D is calculated at the outlet of the UMLR watershed. The percolation represents the amount of water moving downward across the vadose zone when soil moisture exceeds field capacity. Percolation replenishes the shallow unconfined aquifer and can be assumed as R. Water stored in the shallow aquifer may replenish soil moisture in the soil profile (through upward flux induced by capillary fringe) or streamflow (through base flow or return flow). DR is the amount of water replenishing the deep confined High Plains Aquifer originating from seepage in the shallow aquifer or directly from percolation exiting through the bottom of the soil profile. All hydrological fluxes are expressed in units of mm of water height except D that is expressed as m3 s−1. As input, SWAT requires P and crop-specific potential evapotranspiration (ETp) and is based on the concept of hydrological response units (HRUs), which are areas identified by similarities in soil, land cover, and terrain attributes. The potential root water uptake depends on soil water content and CO2 levels and is reduced when the soil profile does not contain sufficient water in dry periods or CO2 level increase related to reduction in leaf conductance. SWAT typically uses the ArcSWAT interface to set up model inputs. ArcSWAT is a public domain software which works in the licensed ArcGIS environment. ArcSWAT version 2012.10.5.21 was used in this study. Kishawi et al. (2023) constructed and calibrated SWAT for the UMLR. For more details on model inputs, calibration and validation, see Kishawi et al. (2023).
The methodology adopted in this paper is shown in Figure 2. SWAT was calibrated by Kishawi et al. (2023) and used in this study to perform simulations under different combinations of climate (Section Climate change scenario) and land use change (Section Land use change scenarios) from 2000 to 2099. The D, ETa, DR and R simulated under the historical period (2000–2019) were compared to those ones obtained under: i) the most likely combined land use and climate change scenario and ii) 16 hypothetical scenarios combining four redcedar encroachments (0.5, 2.4, 4.6, and 11.9%) and two extreme climate projections split in two sub-period (2020–2050 and 2051 and 2099).
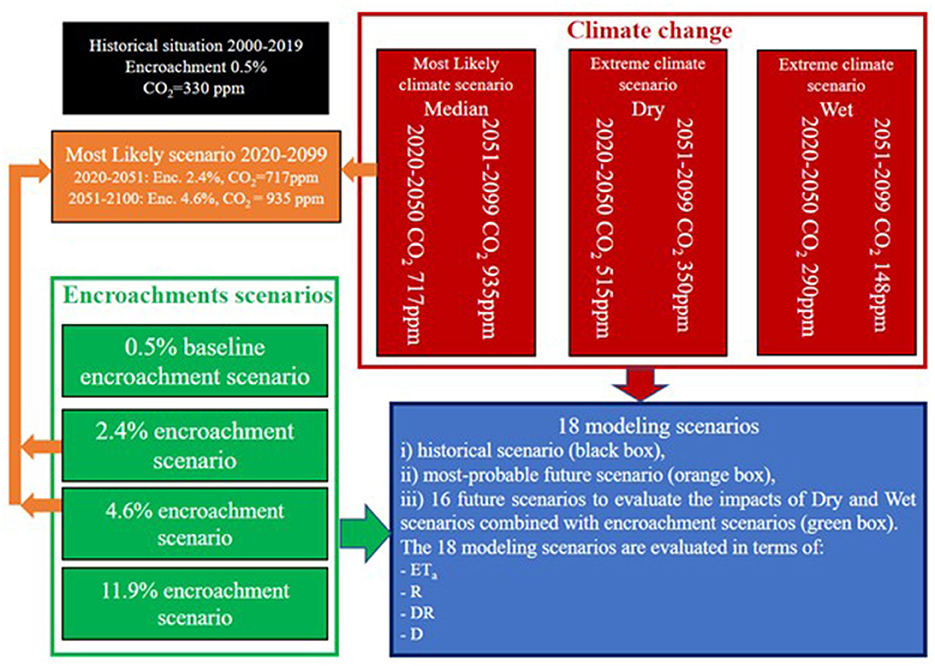
Figure 2. A schematic overview of the adopted methodology based on the data collected from Coupled Model Intercomparison Project (CMIP5) database and selected redcedar encroachment scenarios in the Upper Middle Loup River (UMLR) watershed. Baseline redcedar coverage is 0.5%.
Therefore, a total of 18 scenarios (blue box) were built to evaluate the simulations of the water balance components in SWAT:
1) Historical climate and land use scenario with daily climate data (CO2 of 330 ppm) recorded between 2000 and 2019 and encroachment of 0.5% (black box in Figure 2).
2) Most likely climate and land use change scenario with climate data (CO2 of 717 ppm in 2020–2050 and CO2 of 935 ppm in 2051–2099) estimated between 2020 and 2099 and encroachment of 2.4% in 2020–2050 and 4.6% in 2051–2099 (orange box in Figure 2).
3) 16 climate and land use change scenarios combining extreme climate projections (dry and wet) split in two sub-periods (red boxes in Figure 2) and four different encroachment scenarios (green boxes in Figure 2).
Climate change scenario
The climate raw data were obtained from an ensemble of General Circulation Models (GCMs) using the Downscaled CMIP3 and CMIP5 Climate and Hydrology Projections website (Maurer et al., 2007) accessed through https://esgf-node.llnl.gov/search/cmip5/ (CMIP, 2021). The full list includes 60 models. Each model presents four Representative Concentration Pathways (RCPs, i.e., 2.6, 4.5, 6.0, and 8.5) by potentially obtaining 240 climate simulations. Since 18 sets of RCPs with corresponding climate data were missing from the remaining climate models, a total of 222 climate projections were available. Table 2.S in the Supplementary material includes the full list of the 222 climate models with their corresponding RCPs.
Through the website explorer, the coordinates of the pixels representing the study area were used to download the climate models' raw data (P, minimum, and maximum temperature) on a daily time step from 2000 to 2099. We considered the historical period from 2000 to 2019 and climate projections from 2020 to 2099. A spatial-average historical mean annual rainfall and spatial-average projected mean annual rainfall were established using 17 × 5 pixels (85 pixels), however only 44 pixels were within the watershed.
The ETp at daily time resolution was calculated with the Hargreaves equation based on minimum and maximum temperatures (Hargreaves and Samani, 1985). The aridity index (AI) based on the Food and Agriculture Organization (FAO) is a climate indicator which is used for measuring the degree of dryness as it is expressed as the ratio between mean annual P over ETp (Spinoni et al., 2015). The mean annual AI values were calculated for each GCM. The 222 mean annual AI values were ranked in ascending order. Three models defined as dry, median, and wet climate scenarios were selected at 5th, 50th, and 95th percentiles, respectively, as recently done by Adane et al. (2019).
Land use change scenarios
The likely scenario of redcedar encroachment was created using a combination of neural network and Markov-chain cellular automata model. The current state of redcedar in 1990, 2015, and 2020 were extracted using multi-layer perceptron (MLP) neural network, trained and optimized with multiple hidden layers (3–5), regularization, and dropout parameters (Shrestha, 2022). The classified redcedar map of 1990 and 2015 were then used to calculate the transition probability using Markov-chain analysis. The transition potential was calculated using MLP with single hidden layer using environmental variables that affect the potential redcedar distribution. The variables included elevation, aspect, topographic position index, total insolation, duration of insolation, wind dispersion, distance to road, distance to windbreak, distance to stream, and depth to water table. Cellular automata method was then used to combine the transition probability and transition potential using multi-objective land allocation algorithm to predict the current (2020) and future redcedar scenarios (2050 and 2100). The predicted model of 2020 was validated against the classified redcedar map. The model with the highest accuracy predicted an encroachment of 2.4% by 2050 and 4.6% by 2099. For more details on the MLP neural network and Markov-chain cellular automata model, refer to Shrestha (2022).
In addition to the most likely scenario, hypothetical land use scenarios were also evaluated. Hypothetical redcedar encroachment scenarios were created by combining the evergreen and mixed forest classes of 2016 National Land Cover Database (NLCD) data. With redcedar comprising at least 90% of the conifer basal area in the Great plains and at early stage of encroachment occurring as understory species, mixed forest was also included (Filippelli et al., 2020). The NLCD data derived from Landsat images at 30 m resolution do not detect such occurrences of redcedar and therefore we assumed that including the mixed forest could also compensate for undetected redcedar that are significant for future encroachment scenarios. The baseline map (0.5% redcedar) was reclassified as a binary image with the presence of redcedar represented by a value of 1 while absence by 0. A morphological filter with size between 3 × 3 m to 7 × 7 m (Haralick et al., 1987) was used to create a hypothetical scenario of different encroachment levels (Kishawi et al., 2023). Dilation is a process where a zero value in a binary image is replaced by 1, simulating the process or encroachment from established redcedar pixels.
Results
Historical climate and land use scenario (2000–2019)
Table 1 shows the annual values of P, ETp, R, DR, ETa, and D under the historical scenario (2000-2019). The SWAT input climate variables are P and ETp. The mean annual P was 571.0 mm with the driest year in 2012 (P = 239.7 mm) and the wettest year in 2009 (P = 748.6 mm). Annual P sums are characterized by high temporal variability while annual ETp values are close to their mean annual value.
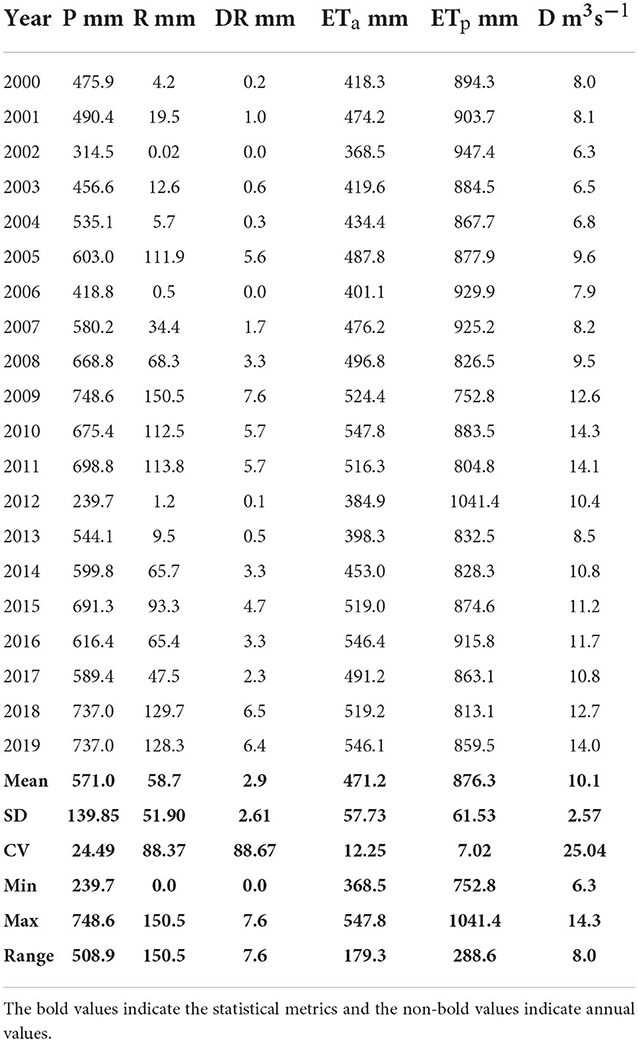
Table 1. Annual P, R, DR, ETa, ETp, and D in the historical period (2000–2019) under 0.5% redcedar cover.
Most likely combined land use and climate change scenario (2020–2099)
All 222 mean annual AI-values ranged from 0.333 to 0.426 and can be grouped within the semi-arid class (0.2<AI<0.5) (Spinoni et al., 2015). The 5th (AI = 0.35), 50th (AI = 0.371), and 95th (AI = 0.392) percentiles correspond to the climate models ACCESS 1–0.1 (RCP 4.5), CMCC-CM 0.1 (RCP 8.5), and Ec-Earth 0.8 (RCP 2.6), respectively. These three climate models were selected to represent dry, median, and wet climate scenarios, respectively. Figure 3 illustrates the frequency distribution of mean annual AI values for each climate model in CMIP5.
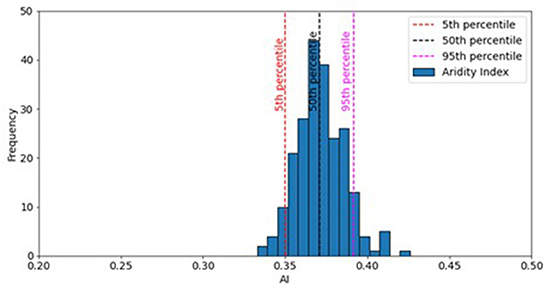
Figure 3. Frequency distribution of mean annual aridity index (AI) values. Vertical dashed lines depict the 5th (red line), 50th (black line), and 95th (magenta line) percentiles that denote the dry (access 1–0.1), wet (cmcc-cm 0.1), and median (ec-earth 0.8) climate scenarios, respectively. The annual AI-values lie between 0.20 and 0.50 (range of the semi-arid climate class).
The median climate scenario is considered as the most likely climate projection. The mean annual P is predicted to slightly decrease by 7.6% from 571.0 mm (2000–2019) to 527.9 mm (2020–2099). The mean annual temperatures are expected to increase from 9.5°C in the historical period (2000–2019) to 13.6°C in the period (2051–2099). The CO2 concentration is expected to increase to 717 ppm by 2050 and 935 ppm by 2099. The results indicate that a warming pattern will be expected with 4.1°C increase on average over the 100-year period, and this will be associated with lower-than-normal P and higher-than-normal ETp. Details of P and temperatures are included in the Supplemental material.
According to Shrestha (2022), the most likely redcedar coverage will be 2.4% by 2050 and 4.6% by 2099 with most of the encroachment occurring around the streams and water bodies. These encroachment rates were combined with the median climate scenario and represent the most likely projection in terms of redcedar cover and future P and ETp patterns. As shown in Table 2, ETa decreased from 471.2 mm to 406.65 mm by 2050 and to 328.8 mm by 2099. The reduction in ETa can be attributed to the root water uptake stress induced by increased CO2 concentrations. The results showed that the minimal increase in encroachment would not have a significant impact on ETa in the study area. Thus, CO2 concentration has the most impact on ETa compared to encroachment levels under the most likely scenario.
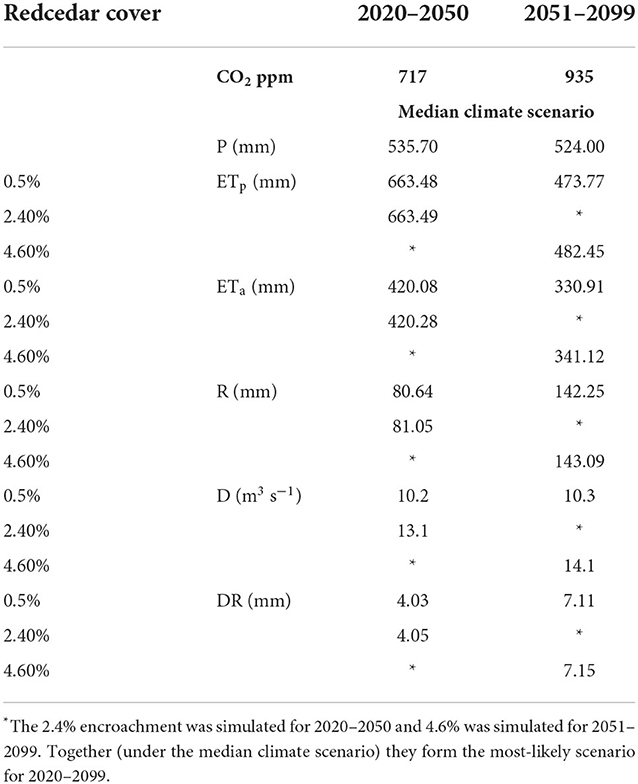
Table 2. Model simulations of ETa, R, DR, and D for the historical (0.5% redcedar) and most-likely scenario.
The impact of increased CO2 concentrations on the plant stomata and consequently on the water balance components is shown in Figure 4. The increase of CO2 level from 717 ppm (in the period 2020–2050) to 935 ppm (in the period 2051–2099) causes a reduction of 22% in the ETa thereby increasing D by 7.6% and R by 75% between the two periods. The DR is likely to double even though it remains a residual portion of mean annual P. The model simulation provides insight into what should be expected if the encroachment conditions occurred under the most likely climate scenario in the coming 100 years.
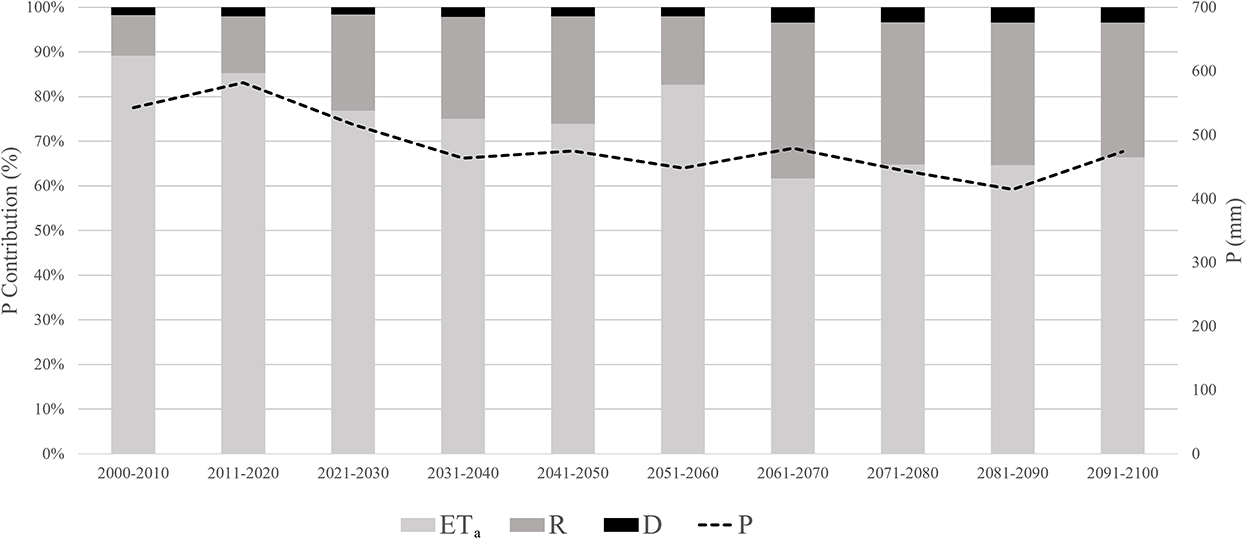
Figure 4. Annual simulated stacked percentages of ETa, R, and D, compared to decadal averages of P from 2000 to 2099.
Additionally, a statistical analysis of the historical (2000–2019) and projected model simulations for 2020–2050 and for 2051–2099 were performed. Table 3 lists the descriptive statistics of P, ETp, D, R, and DR. Compared to the historical period, projected P, and ETa are expected to decrease by 10%, and 14%, respectively while T and D will likely increase by 23% and 30% for the period 2020–2050. Similarly, P and ETa will decrease by 8 and 32% while D and T will increase by 40 and 43%, respectively for the period 2051–2099.
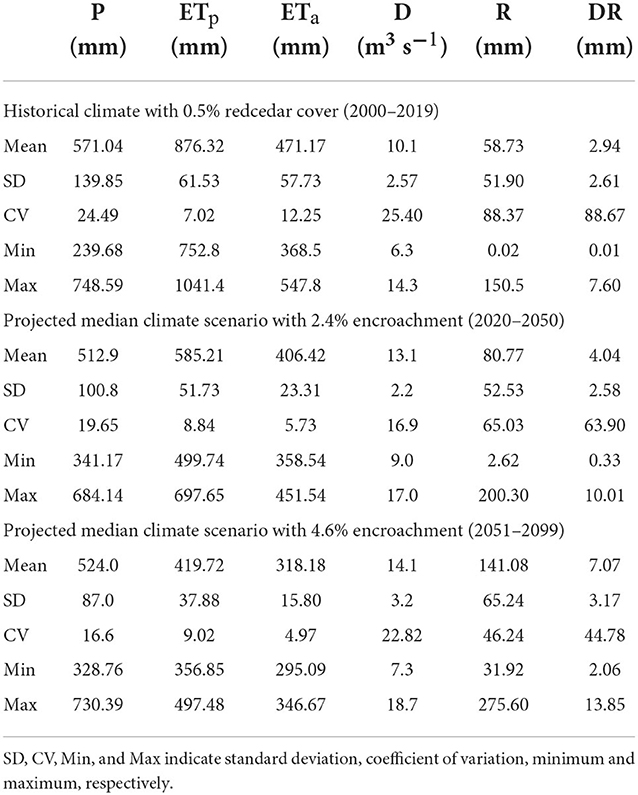
Table 3. Descriptive statistics of P, ETp, ETa, D and R under the historical scenario and most likely combined scenario.
As shown in Table 4, we report a 38 and 37% increase in R and DR for the 2020–2050 period and an increase of 140% for both R and DR for the 2051–2099 period. Because climate and hydrological factors are interacting in a complex manner, analyzing these factors in isolation may not reflect the actual impacts.
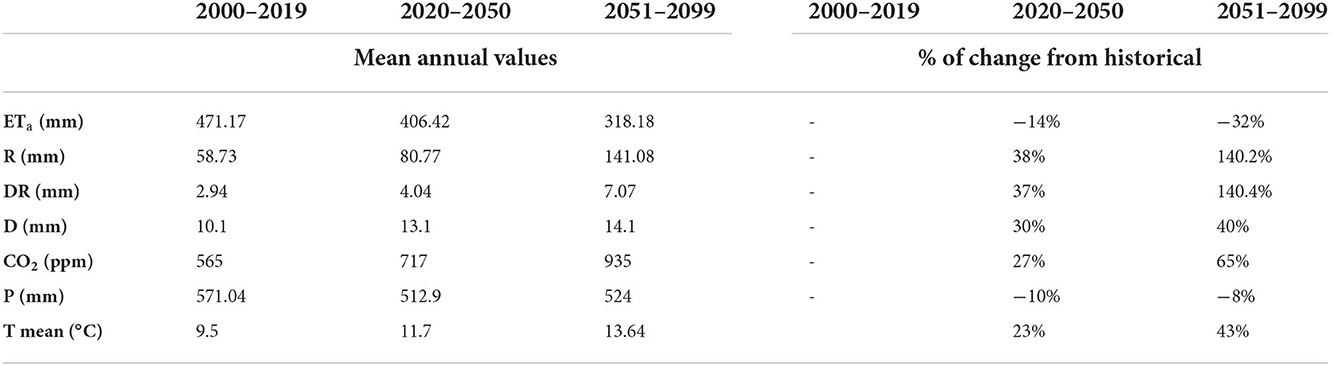
Table 4. Decadal averages of ETa, R, DR, and D and their relationship with the change in carbon dioxide (CO2), P, and temperature (T) in terms of percentage of change comparing median to historical scenario.
The sensitivities of annual ETa, D and R to annual AI are shown in Figure 5. The sensitivity is quantified by comparing the change in AI to the change in the water balance components. While the sensitivities of ETa and D to AI are weak, as indicated by the corresponding correlation coefficients (ρ = −0.57 and ρ = −0.34, respectively), AI shows significant impact on R as indicated by the strong positive correlation (ρ = +0.93). The scatterplot in Figure 5 corroborates the reported correlation coefficients between AI and change in ETa, D, and R.
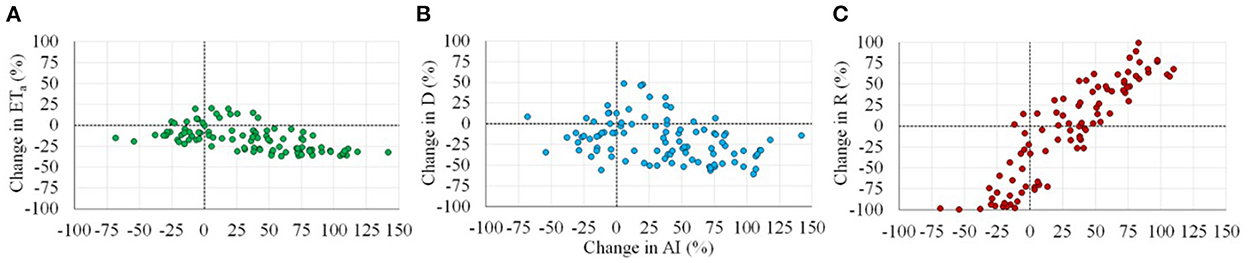
Figure 5. The relation between change in aridity index, AI and the change in (A) ETa (green circles), (B) D (blue circles) and, (C) R (red circles) under the most-likely combined scenario.
Combination of 16 hypothetical land use and extreme climate change scenarios (2020–2099)
In this section, a comparison between 16 hypothetical projected scenarios (2020–2099) and the historical scenario (2000–2019) was evaluated. For this scenario, the mean annual ETa under the historical period is equal to 471 mm. Combined with the 4.6% encroachment level, the wet climate scenario projected a slight increase in ETa to 476 (2020–2050) and 473 (2051–2099). For the dry climate scenario, the R increased by 0.2 mm and 1.2 mm for CO2 levels of 515 ppm and 350 ppm, respectively. On the contrary, under the wet climate scenario the R decreased by 0.1 mm and 2.9 mm for CO2 levels 290 ppm and 148 ppm, respectively. When considering the change in CO2 concentrations under the 0.5% encroachment (in the historical period 2000–2019) and compared to the projections, R decreased by 9.2 mm under the dry scenario but increased by 3.5 mm under the wet scenario. Under 11.9% encroachment and the dry climate scenario, R decreased by 10.2 mm. However, R increased by 0.3 mm under the wet scenario with 11.9% encroachment. DR slightly increased as encroachment level increases while it decreased when CO2 decreased.
The heat maps in Figure 6 show the ETa, D, and R under wet and dry scenarios over different encroachment simulations. The values range from high (red) to low (green) values. Under the dry scenario, ETa values are lower compared to the wet scenario. Also, higher D values (red cells) are more frequent in the first period of the century (2020–2050) compared to the second period of the century (2051–2099). Results indicate that higher ETa and lower D and R are likely to occur in the second period. The wet scenario, with RCP2.6, the projection shows lower than normal CO2 levels. ETp is not stressed and therefore ETa is higher-than-normal.
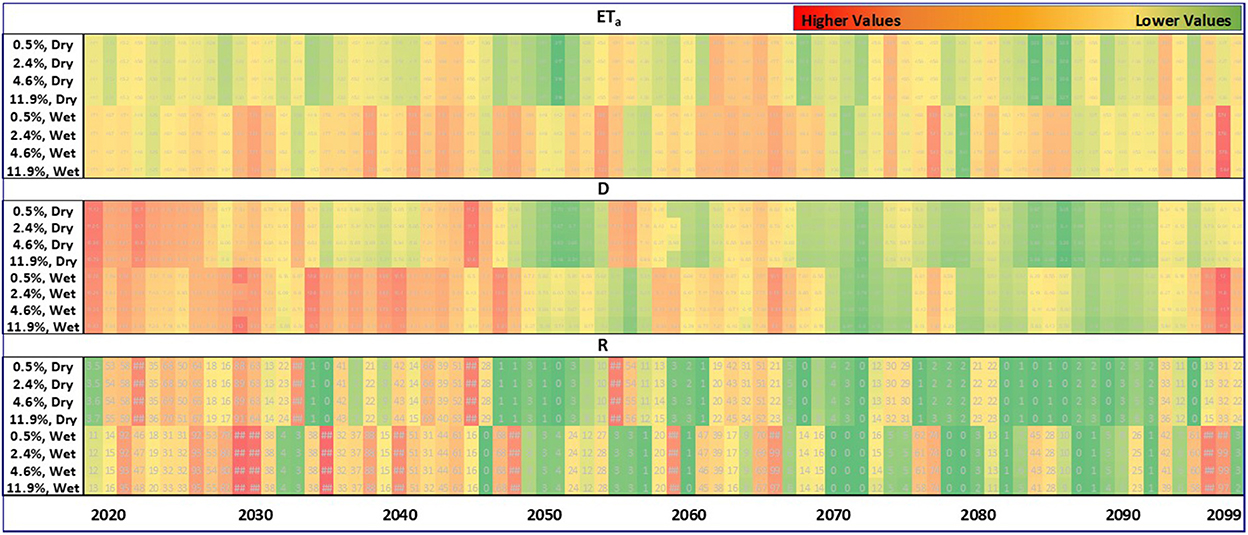
Figure 6. Heat maps of annual values of ETa, D and R under different combinations of encroachment scenarios from 2020 to 2099 (y-axis) and climate projections (x-axis) 0.5% refers to historical redcedar encroachment.
As encroachment increased, D decreased under both dry and wet scenarios by < 1 m3 s−1 regardless of CO2 levels. Additionally, under the same encroachment rate, but different CO2 concentrations, there was also a slight change in D by < 1 m3 s−1. It can be concluded that different CO2 levels had very little impact on D. The D had similar trends in the second period (2051–2099) under both dry and wet scenarios while in the first period (2020–2050) the wet scenario yielded higher D than the dry scenario.
The DR had similar trends as R under the climate and land use scenarios. As encroachment rates increased, the results indicated an increase in DR under all simulations except the wet scenario in the second period (2051–2099). Both dry and wet scenarios under the same land use conditions resulted in a reduction in DR as the CO2 levels increased toward the end of the century. On the contrary, the median climate scenario resulted in an increase of DR for the same period.
ETa is more sensitive to climate change than land use change. ETa increased by 2.6% when encroachment increased to 11.9% and increased by 3.0% from 471 to 485 mm under the wet scenario from the historical period 2000–2019 to the 2051–2099 period. This was due to the reduction in CO2 from 365 to 100 ppm. The combined impact of encroachment and climate change caused ETa to increase by 4.5% when considering the wet scenario and 11.9% encroachment. The largest impact of CO2 concentration on ETa was under the median scenario when CO2 increased to 800 ppm (2020–2050) where there was a reduction of 33.1% compared to the first third of the century. This reduction in ETa is due to the stomata closing as CO2 concentrations increase. The later period 2051–2099 showed a lower reduction of 11% compared to the first period.
Discussion
Resource identification initiative
In this study we assessed how climate and land use change influenced the hydrological cycle and management of water resources in a large watershed. We adopted a modeling scenario approach to determine the most likely forecast and 16 less probable predictions to support decision-making. The approach covering the full spectrum of plausible encroachments and climate projections represents a novelty in the body of literature. This is done through evaluating the most probable combined scenario (most probable projection and well-modeled encroachment) while the other scenarios (characterized by low occurrence probability) represent a sensitivity analysis. As far as we know, this approach was used for the first time in the NSH.
Three climate scenarios (i.e., dry, wet, and median), selected according to the AI criterion, were simulated using the corresponding CO2 levels. We gave more importance to the median climate scenario related to the highest probability of occurrence while the extremely dry (5th percentile) and wet (95th percentile) climate forecasts indicate the impact of potential climate hazard on water resources. Another novel aspect of this study is the influence of CO2 levels on stomata closure and its impact on the most relevant water balance component output, namely the ETa. While the default CO2 level in the SWAT model is 330 ppm, several CO2 projections have been used in different studies (Kishawi et al., 2023). Ficklin et al. (2009) modeled hydrological responses of stomata closure to two CO2 emissions (i.e., 550 and 970 ppm). Another study presented by van Liew et al. (2012) used three CO2 levels (330 ppm, 525 ppm, 475 ppm) in SWAT from 2040 to 2059. The study did not elaborate on progressively increasing the CO2 values over different years, rather focused on replacing baseline 330 ppm value with the new 525 and 475 ppm values based on the selected scenarios. Lee et al. (2018a) used six climate scenarios to assess the impacts of various CO2 concentrations on the water resources. This was conducted under different CO2 emissions including 330 ppm (baseline), 590 ppm, and 850 ppm. However, in this study different RCPs have specific CO2 emissions based on the literature review and IPCC reports (i.e., IPCC report 5). In our study, the dry, median, and wet scenarios consider RCP4.5, RCP8.5, and RCP2.6, respectively. Using data based on Pachauri et al. (2015), we varied the CO2 concentrations for each climate scenario. With the shallow aquifer near the stream and lower parts of the sand dunes, the deep roots of redcedar can significantly impact the lateral flow and streamflow D in the watershed (Kishawi et al., 2023).
Land use change plays an important role in controlling hydrological fluxes at watershed scale. In this study we considered the most likely redcedar encroachment forecast by using a combination of neural network and Markov-chain cellular automata model. The expected increase in encroachment induced higher-than-normal R, except under the wet scenario from 2051 and 2099 when we report higher-than-normal ETa induced by CO2 emissions below 330 ppm. Previous studies have shown that encroachment causes an increase in percolation and DR (Zou et al., 2018). According to Zou et al. (2018), the increased infiltration is attributed to a reduction in soil bulk density associated with a reduction in compaction and an increase in soil organic matter. The reduction in compaction is a result of decreased grazing intensity (Zou et al., 2014). In this study we found that under the dry scenario, the increase in R was 59.7% of that simulated under the historical scenario. Under the same land use conditions, both dry and wet scenarios resulted in a reduction in R as the CO2 levels increased toward the end of the century, however the median scenario resulted in an increase in 2020–2050 then followed by a lower increasing rate in 2050–2099. R was about five times larger under the wet scenario (R = 159 mm) than under the dry scenario (R = 30 mm) in 2020–2050.
Our results mostly reflect the findings reported in the body of literature. Increasing CO2 concentrations will likely impact the plant stomata and guard cells by increasing root water uptake stress which will limit the potential and ETa losses. Xu et al. (2016) indicated that under elevated CO2, stomata tend to close because of greater depolarization causing K+, Ca2+, and Cl− in plant guard cells to decrease while H+ concentrations remain at high levels. This can cause the plant stomata to shut down, reduce leaf transpiration leading to an increase in D and recharge rate. Aasamaa and Sober (2011) studied the responses of stomatal conductance to simultaneous changes in two environmental factors selected from a set of factors including air humidity, leaf water potential, air CO2 and light intensity. The concentration of the abscisic acid (ABA) increases in the cytosol of stomatal guard cells after a decrease in leaf or air water potential. Additionally, the results indicated that the “stomatal closing” stimuli, such as high CO2 and darkness, cause cytosolic levels in the cells to increase. Roelfsema et al. (2004) assessed the plant hormone ABA during drought and how it depolarizes guard cells in intact plants. The study concluded that the combined activation of selected anion channels leads to the transient depolarization of guard cells where the ABA response correlates with the transient extrusion of Cl2 from guard cells and a rapid but confined reduction in stomatal aperture.
Xu et al. (2016) also supported this conclusion by stating that elevated CO2 concentrations are among the main factors affecting the stomata behavior. However, it was mentioned that elevated CO2 concentrations generally cause reductions in stomatal density, stomatal conductance, leaf transpiration, and canopy/ecosystem evapotranspiration, but other factors might induce a reverse response when elevated CO2 concentrations interact with these climatic factors.
Kishawi et al. (2023) reported that increased encroachment reduced stream D in the UMLR watershed. In this study we observed that stream D is likely to increase as higher-than-normal CO2 concentrations are expected, by decreasing evapotranspiration losses. The results show an increase in the stream D up to 14.1 m3 s−1 (39.6%) compared to the historical period. As a conclusion from the sensitivity analysis (16 combined land use and climate change modeling scenarios) presented in this study, evapotranspiration, recharge, and stream D were more influenced by the change in climate rather than to the change in land use in this watershed.
However, we report some limitations in our approach that might be subject to future work improvements. The feedbacks in the soil-plant-atmosphere continuum was missing in the model set up and should be described in the future when considering the impact of climate and land use change on the hydrological cycle. Some output fluxes including water pumping from shallow and deep aquifers, transferring water outside the watershed, management practices were ignored in this study and might be included in future studies to integrate information on ecosystem services related to the water cycle. Potential improvement of this modeling scenario approach could include the simulation of soil erosion, the tracking of nitrogen and phosphorus, fertilizers and pesticides in the study area.
Conclusion
This study analyzed the hydrological responses in the Upper Middle Loup River watershed in the Nebraska Sand Hills under different redcedar encroachments and climate projections. SWAT was used to evaluate the impact of different combinations of climate and land use change on the hydrological cycle in the study area. Our results predicted a slight decrease in P but the expected increase in temperature and CO2 levels is likely to cause the plant stomata to close, resulting in a significant reduction in evapotranspiration (specifically in the last part of this century). The CO2 concentrations are more important than the projected P and temperature in influencing the water budget in the Upper Middle Loup River watershed.
The most probable combined land use and climate change scenario was given by two encroachment levels of 2.4% from 2020 to 2050 and 4.6% from 2051 to 2099 under the median climate projection (corresponding to the 50th percentile of the AI distribution). The results showed that an increase in CO2 was accompanied by a dramatic decrease in ETa and an increase in D, specifically over the last decades of the century. The decision-makers can benefit from the scenario modeling approach presented in this paper that can help support optimal management of water resources.
Data availability statement
The original contributions presented in the study are included in the article/Supplementary material, further inquiries can be directed to the corresponding author.
Author contributions
Conceptualization: YK and AM. Methodology: YK, AM, ZA, NS, and PN. Formal analysis: YK, ZA, NS, and PN. Writing—original draft preparation: YK and NS. Writing—review and editing and visualization: AM, ZA, and PN. Funding acquisition: AM. All authors have read and agreed to the published version of the manuscript.
Acknowledgments
The authors acknowledge the U.S. Department of Agriculture-National Institute of Food and Agriculture (Hatch project 1015698), Robert B. Daugherty Water for Food Global Institute at the University of Nebraska-Lincoln, and the Water Sustainability Fund, Nebraska Natural Resource Commission.
Conflict of interest
The authors declare that the research was conducted in the absence of any commercial or financial relationships that could be construed as a potential conflict of interest.
Publisher's note
All claims expressed in this article are solely those of the authors and do not necessarily represent those of their affiliated organizations, or those of the publisher, the editors and the reviewers. Any product that may be evaluated in this article, or claim that may be made by its manufacturer, is not guaranteed or endorsed by the publisher.
Supplementary material
The Supplementary Material for this article can be found online at: https://www.frontiersin.org/articles/10.3389/frwa.2022.1044570/full#supplementary-material
Supplementary Figure S1. Comparing monthly average (A) precipitation, (B) maximum temperature, and (C) minimum temperature, for historical (1981–2019), future predictions (2020–2099), and the absolute differences.
Supplementary Figure S2. Historic and projected trends (wet, median, and dry projection) for average annual (A) precipitation, (B) maximum temperature, and (C) minimum temperature from 1981 to 2099.
References
Aasamaa, K., and Sober, A. (2011). Responses of stomatal conductance to simultaneous changes in two environmental factors. Tree Physiol. 31, 855–864. doi: 10.1093/treephys/tpr078
Adane, Z., Zlotnik, V. A., Rossman, N. R., Wang, T., and Nasta, P. (2019). Sensitivity of potential groundwater recharge to projected climate change scenarios: a site-specific study in the Nebraska Sand Hills, USA. Water. 11, 950. doi: 10.3390/w11050950
Adeyemi, O., Grove, I., Peets, S., and Norton, T. (2017). Advanced monitoring and management systems for improving sustainability in precision irrigation. Sustainability. 9, 1–29. doi: 10.3390/su9030353
American Ground Water Trust. (2002). OGALLALA AQUIFER | American Ground Water Trust. Available online at: https://agwt.org/content/ogallala-aquifer-0
Arnold, J. G., Srinivasan, R., Muttiah, R. S., and Williams, J. R. (1998). Large area hydrologic modeling and assessment part I: model development. J. Am. Water Resour. Assoc. 34, 73–89. doi: 10.1111/j.1752-1688.1998.tb05961.x
Axmann, B. D., and Knapp, A. K. (1993). Water relations of juniperus virginiana and andropogon gerardii in an unburned tallgrass prairie watershed. Southwestern Naturalist. 38, 325–330. doi: 10.2307/3671610
CMIP (2021). Downscaled CMIP3 and CMIP5 Climate and Hydrology Projections. Available online at: https://gdo-dcp.ucllnl.org/downscaled_cmip_projections/dcpInterface.html#Projections: Subset Request
Dile, Y. T., Daggupati, P., George, C., Srinivasan, R., and Arnold, J. (2016). Introducing a new open source GIS user interface for the SWAT model. Environ. Model. Softw. 85, 129–138. doi: 10.1016/j.envsoft.2016.08.004
Doungmanee, P. (2016). The nexus of agricultural water use and economic development level. Kasetsart J. Soc. Sci. 37, 38–45. doi: 10.1016/j.kjss.2016.01.008
Eggemeyer, K. D., Awada, T., Harvey, F. E., Wedin, D. A., Zhou, X., and Zanner, C. W. (2009). Seasonal changes in depth of water uptake for encroaching trees Juniperus virginiana and Pinus ponderosa and two dominant C4 grasses in a semiarid grassland. Tree Physiol. 29, 157–169. doi: 10.1093/treephys/tpn019
Ercan, M. B., Maghami, I., Bowes, B. D., Morsy, M. M., and Goodall, J. L. (2020). Estimating potential climate change effects on the upper neuse watershed water balance using the SWAT model. J. Am. Water Resour. Assoc. 56, 53–67. doi: 10.1111/1752-1688.12813
Fant, C., Srinivasan, R., Boehlert, B., Rennels, L., Chapra, S. C., Strzepek, K. M., et al. (2017). Climate change impacts on us water quality using two models: HAWQS and US basins. Water. 9, 118. doi: 10.3390/w9020118
FAO (2017). Water for Sustainable Food and Agriculture Water for Sustainable Food and Agriculture. In A report produced for the G20 Presidency of Germany. Available online at: www.fao.org/publications
Ficklin, D. L., Luo, Y., Luedeling, E., and Zhang, M. (2009). Climate change sensitivity assessment of a highly agricultural watershed using SWAT. J. Hydrol. 374, 16–29. doi: 10.1016/j.jhydrol.2009.05.016
Filippelli, S. K., Vogeler, J. C., Falkowski, M. J., and Meneguzzo, D. M. (2020). Monitoring conifer cover: Leaf-off lidar and image-based tracking of eastern redcedar encroachment in central Nebraska. Remote Sens. Environ. 248, 111961. doi: 10.1016/j.rse.2020.111961
Fogarty, D. T., Roberts, C. P., Uden, D. R., Donovan, V. M., Allen, C. R., Naugle, D. E., et al. (2020). Woody plant encroachment and the sustainability of priority conservation areas. Sustainability. 12, 1–15. doi: 10.3390/su12208321
Gutentag, E. D., Heimes, F. J., Krothe, N. C., Luckey, R. R., and Weeks, J. B. (1984). Geohydrology of the high plains aquifer in parts of Colorado, Kansas, Nebraska, New Mexico, Oklahoma, South Dakota, Texas, and Wyoming (USGS, USA, groundwater). US Geological Survey Professional Paper, 1400 B. doi: 10.3133/pp1400B
Haacker, E. M. K., Kendall, A. D., and Hyndman, D. W. (2016). Water level declines in the high plains aquifer: predevelopment to resource senescence. Groundwater. 54, 231–242. doi: 10.1111/gwat.12350
Haralick, R. M., Sternberg, S. R., and Xinhua, Z. (1987). Image analysis using mathematical morphology. IEEE Transcations on Pattern Analysis and Machine Intelligence1, PAMI. 9, 532–550. doi: 10.1109/TPAMI.1987.4767941
Hargreaves, G. H., and Samani, Z. A. (1985). Reference crop evapotranspiration from temperature. Appl. Eng. Agric. 1, 96–99. doi: 10.13031/2013.26773
Heavican, K. (2021). Eastern red cedar tress could be the biggest threat to nebraska sandhills. Brownfield Ag News Website. Available online at: https://brownfieldagnews.com/news/eastern-red-cedar-tress-could-be-the-biggest-threat-to-nebraska-sandhills/
Hennings, J., and Lynch, H. (2022). Depleting the Ogallala Aquifer, FactSheet Episode 278. EarthData.
Hrozencik, A. (2021). USDA ERS - Irrigation and Water Use. Available online at: https://www.ers.usda.gov/topics/farm-practices-management/irrigation-water-use/
Kishawi, Y., Mittelstet, A. R., Gilmore, T. E., Twidwell, D., Roy, T., and Shrestha, N. (2023). Impact of Eastern Redcedar encroachment on water resources in the Nebraska Sandhills. Sci. Total Environ. 858, 159696. doi: 10.1016/j.scitotenv.2022.159696
Lee, S., Yeo, I. Y., Lang, M. W., Sadeghi, A. M., McCarty, G. W., Moglen, G. E., and Evenson, G. R. (2018b). Assessing the cumulative impacts of geographically isolated wetlands on watershed hydrology using the SWAT model coupled with improved wetland modules. J. Environ. Manage. 223, 37–48. doi: 10.1016/j.jenvman.2018.06.006
Lee, S., Yeo, I. Y., Sadeghi, A. M., McCarty, G. W., Hively, W. D., Lang, M. W., et al. (2018a). Comparative analyses of hydrological responses of two adjacent watersheds to climate variability and change using the SWAT model. Hydrol. Earth Syst. Sci. 22, 689–708. doi: 10.5194/hess-22-689-2018
Maurer, E. P., Brekke, L., Pruitt, T., and Duffy, P. B. (2007). Fine-resolution climate projections enhance regional climate change impact studies. Eos, Transactions American Geophysical Union. 88, 504. doi: 10.1029/2007EO470006
McGuire, V. L. (2017). Water-level and recoverable water in storage changes, high plains aquifer, predevelopment to 2015 and 2013-15. Available online at: https://pubs.usgs.gov/sir/2017/5040/sir20175040.pdf
Mueller-Warrant, G. W., Phillips, C. L., and Trippe, K. M. (2019). Use of SWAT to model impact of climate change on sediment yield and agricultural productivity in Western Oregon, USA. Open Journal of Modern Hydrology. 9, 54–88. doi: 10.4236/ojmh.2019.92004
Mundetia, N. (2019). International conference on swat-sea, siem reap, combodia, october, 24-25, 2019 hydrological impact assessment of land use change in an ungauged semi-arid river basin of rajasthan. India, 24–25.
Overmann, S. R. (2021). The High Plains Aquifer. Available online at: https://wps.prenhall.com/wps/media/objects/1373/1406592/Regional_Updates/update23.htm
Pachauri R. K. Meyer L. The Core Writing Team. (2015). Climate change 2014 synthesis synthesis report. In United Nations Environmental Programme. Available online at: https://www.ipcc.ch/site/assets/uploads/2018/02/SYR_AR5_FINAL_full.pdf
Pandey, A., Bishal, K. C., Kalura, P., Chowdary, V. M., Jha, C. S., and Cerdà, A. (2021). A soil water assessment tool (SWAT) modeling approach to prioritize soil conservation management in river basin critical areas coupled with future climate scenario analysis. Air, Soil Water Res. 14, 117862212110213. doi: 10.1177/11786221211021395
Pedro-Monzonís, M., Solera, A., Ferrer, J., Estrela, T., and Paredes-Arquiola, J. (2015). A review of water scarcity and drought indexes in water resources planning and management. J. Hydrol. 527, 482–493. doi: 10.1016/j.jhydrol.2015.05.003
Perazzoli, M., Pinheiro, A., and Kaufmann, V. (2013). Evaluation de l'impact des scénarios de changement climatique sur les ressources en eau dans le Brésil méridional. Hydrol. Sci. J. 58, 77–87. doi: 10.1080/02626667.2012.742195
Petrovic, F. (2021). Hydrological impacts of climate change and land use. Water. 13, 13–15. doi: 10.3390/w13060799
Rehana, S., Sireesha Naidu, G., Naresh, A., Khan, M., Munoz,-, F., and Munoz-Arriola, F. (2018). Climate Change Sensitivity Assessment using SWAT for a Highly Agricultural Watershed, Shell Creek, Nebraska, USA.
Roelfsema, M. R. G., Levchenko, V., and Hedrich, R. (2004). ABA depolarizes guard cells in intact plants, through a transient activation of R- and S-type anion channels. Plant J. 37, 578–588. doi: 10.1111/j.1365-313X.2003.01985.x
Rossman, N. R., Zlotnik, V. A., Rowe, C. M., and Szilagyi, J. (2014). Vadose zone lag time and potential 21st century climate change effects on spatially distributed groundwater recharge in the semi-arid Nebraska Sand Hills. J. Hydrol. 519, 656–669. doi: 10.1016/j.jhydrol.2014.07.057
Scanlon, B. R., Faunt, C. C., Longuevergne, L., Reedy, R. C., Alley, W. M., McGuire, V. L., et al. (2012). Groundwater depletion and sustainability of irrigation in the US High Plains and Central Valley. Proceedings of the National Academy of Sciences of the United States of America. 109, 9320–9325. doi: 10.1073/pnas.1200311109
Shrestha, N. (2022). Understanding Lake Dynamics and Redcedar Encroachment in the Nebraska Sand Hills: A Remote Sensing and Modelling Perspective. Order No. 2871324 The University of Nebraska-Lincoln, 2021 Ann Arbor ProQuest.
Spinoni, J., Vogt, J., Naumann, G., Carrao, H., and Barbosa, P. (2015). Towards identifying areas at climatological risk of desertification using the Köppen-Geiger classification and FAO aridity index. Int. J. Climatol. 35, 2210–2222. doi: 10.1002/joc.4124
Starks, P. J., and Moriasi, D. N. (2017). Impact of Eastern redcedar encroachment on stream discharge in the North Canadian River basin. J. Soil Water Conserv. 72, 12–25. doi: 10.2489/jswc.72.1.12
Steward, D. R., and Allen, A. J. (2016). Peak groundwater depletion in the high plains aquifer, projections from 1930 to 2110. Agric. Water Manag. 170, 36–48. doi: 10.1016/j.agwat.2015.10.003
Szilagyi, J., Zlotnik, V. A., Gates, J. B., and Jozsa, J. (2011). Mapping mean annual groundwater recharge in the Nebraska Sand Hills, USA. Hydrogeol. J. 19, 1503–1513. doi: 10.1007/s10040-011-0769-3
Teklay, A., Dile, Y. T., Asfaw, D. H., Bayabil, H. K., and Sisay, K. (2021). Impacts of climate and land use change on hydrological response in gumara watershed, Ethiopia. Ecohydrol. Hydrobiol. 21, 315–332. doi: 10.1016/j.ecohyd.2020.12.001
Touseef, M., Chen, L., and Yang, W. (2021). Assessment of surface water availability under climate change using coupled SWAT-WEAP in Hongshui River Basin, China. ISPRS International Journal of Geo-Information. 10, 298. doi: 10.3390/ijgi10050298
van Liew, M. W., Feng, S., and Pathak, T. B. (2012). Climate change impacts on streamflow, water quality, and best management practices for the shell and logan creek watersheds in Nebraska. Int. J. Agric. Biol. 5, 13–34. doi: 10.3965/j.ijabe.20120501.003
Wang, J., Hu, L., Li, D., and Ren, M. (2020). Potential impacts of projected climate change under CMIP5 RCP scenarios on streamflow in the Wabash River Basin. Adv. Meteorol. 2020, 18. doi: 10.1155/2020/9698423
Xu, Z., Jiang, Y., Jia, B., and Zhou, G. (2016). Elevated-CO2 response of stomata and its dependence on environmental factors. Front. Plant Sci. 7, 1–15. doi: 10.3389/fpls.2016.00657
Zhang, L., Nan, Z., Xu, Y., and Li, S. (2016). Hydrological impacts of land use change and climate variability in the headwater region of the Heihe River Basin, northwest China. PLoS ONE. 11, 1–25. doi: 10.1371/journal.pone.0158394
Zou, C. B., Turton, D. J., Will, R. E., Engle, D. M., and Fuhlendorf, S. D. (2014). Alteration of hydrological processes and streamflow with juniper (Juniperus virginiana) encroachment in a mesic grassland catchment. Hydrol. Process. 28, 6173–6182. doi: 10.1002/hyp.10102
Keywords: SWAT, CO2 emission, land use change, evapotranspiration, CMIP5, aridity index (AI)
Citation: Kishawi Y, Mittelstet AR, Adane Z, Shrestha N and Nasta P (2022) The combined impact of redcedar encroachment and climate change on water resources in the Nebraska Sand Hills. Front. Water 4:1044570. doi: 10.3389/frwa.2022.1044570
Received: 14 September 2022; Accepted: 17 November 2022;
Published: 13 December 2022.
Edited by:
Vittorio Di Federico, University of Bologna, ItalyReviewed by:
Ashutosh Sharma, Indian Institute of Technology Roorkee, IndiaGiulia Libero, University of Bologna, Italy
Copyright © 2022 Kishawi, Mittelstet, Adane, Shrestha and Nasta. This is an open-access article distributed under the terms of the Creative Commons Attribution License (CC BY). The use, distribution or reproduction in other forums is permitted, provided the original author(s) and the copyright owner(s) are credited and that the original publication in this journal is cited, in accordance with accepted academic practice. No use, distribution or reproduction is permitted which does not comply with these terms.
*Correspondence: Yaser Kishawi, eWFzZXJraXNoYXdpQGh1c2tlcnMudW5sLmVkdQ==
†These authors have contributed equally to this work