 Daniele la Cecilia
 Anne Dax1
 Heinz Singer
- 1Department of Environmental Chemistry, Eawag: Swiss Federal Institute of Aquatic Science and Technology, Dübendorf, Switzerland
- 2Cantonal Office for the Environment, Frauenfeld, Switzerland
Plant Protection Products (PPPs) pose a threat to surface water quality worldwide. While small streams compose the majority of the stream lengths and are crucial for biodiversity, their exposure patterns to PPPs and transformation products (TPs) are largely understudied in dry periods. This knowledge gap can lead to ineffective monitoring strategies for addressing water quality issues. Here, we focus on two extended dry periods the in-depth analysis of a unique continuous high-frequency (20 min) concentrations dataset for 60 PPPs and TPs. The dataset refers to the monitoring of a small tile-drained agricultural stream over 41 days from May to July in 2019. The overall 2560 concentration data per compound obtained with the on-site mass spectrometer MS2Field platform revealed: (i) surprisingly high maximum concentrations (hundreds to thousands ng/l for some compounds) over extended periods of time, (ii) novel diel fluctuations of concentrations in the order of hundreds of ng/l for some PPPs and TPs, (iii) unexpected high concentrations (up to 220 ng/l) of a legacy compound (the fungicide oxadixyl withdrawn from the Swiss market in 2005). We hypothesized the cause of our findings was rooted in high PPPs levels in the shallow groundwater. To investigate this, we complemented our measurements with the long-term Swiss national monitoring program integrating samples over 14 days at the same location. The continuous long-term measurements found a few PPPs all year-round, thus indicating the presence of persistent contamination sources in the catchment. Next, we collected spatially distributed grab samples in tile drain outlets and stream water on a dry summer day in 2020. The dry-day campaign not only confirmed our hypothesis given the measured high concentrations of PPPs and TPs in tile drain outlets but also highlighted large spatial variability in measured concentrations along the stream. Hereafter, we highlight the questions that different monitoring schemes can answer in dry conditions. This information was relevant to observe for the first time, and thus foresee, the dynamic patterns of PPPs and TPs in the aquatic ecosystem in dry summer conditions, with the latter generally becoming more frequent due to climate change.
1. Introduction
Plant protection products (PPPs) use promises to achieve global food security (Popp et al., 2012), but the consequent environmental contamination poses a global environmental hazard (Stehle and Schulz, 2015; Maggi et al., 2020). It is the common view that surface waters are predominantly exposed to high concentrations of PPPs during rain events (Schulz, 2001; Szocs et al., 2017) and to transformation products (TPs) in dry periods (Rasmussen et al., 2015; Spycher et al., 2018; Belles et al., 2019; Sanford and Prosser, 2020; Halbach et al., 2021; Le Cor et al., 2021). Given the large effort that goes with sampling and analyzing PPPs from streams, many studies increase sampling frequency in response to hydrological proxies, such as rainfalls or increments in discharge in accordance with the scientific evidence showing that the largest loads of PPPs in water bodies occur during rain events (Doppler et al., 2012; Halbach et al., 2021). While proxy-triggered auto sampling seems to be a rational strategy, it nevertheless causes a bias underrepresenting dry weather conditions in PPPs studies. The available PPPs data may therefore reveal only a limited picture of the full exposure situation.
The consequences of a knowledge gap in PPPs and TPs exposure patterns in small streams can be of particular concern. Spycher et al. (2018) for example shows persistent high concentrations of PPPs and TPs in five agricultural streams during dry periods monitored by means of 12-h composite samples, pooled to a temporal resolution of several days. The subsequent analyses of individual 12-h subsamples reveal that concentrations in single subsamples could exceed the concentrations of pooled samples by up to a factor of 10. The causes for those high concentrations could not be clarified from 12-h composite samples. This knowledge gap can be detrimental for preserving the high ecological value of small streams (Biggs et al., 2016). Also, small streams constitute the majority of the channel length of river networks (Wohl, 2017). Salo et al. (2017) indicate that the persistence of natural aquatic populations was threatened by additive and interactive effects resulting from multiple anthropogenic changes, such as even low levels of chemical pollution and short-term heat waves. And yet, the vicinity of small streams to agricultural fields and their poor dilution capacity exacerbate their exposure to PPPs losses resulting from land and pest management (Szocs et al., 2017).
The significance of sources and flowpaths of PPPs and TPs to small streams can be identified by means of targeted monitoring studies (Neumann et al., 2002). In dry periods, potentially toxic concentration levels may arise from farmyard losses (Reichenberger et al., 2007), spray drift following applications (Schulz, 2004) or mishandling (Kreuger, 1998). It is known that irrigation can drive substantial leaching of herbicides from maize fields (Giuliano et al., 2021) and numerical modeling also supports the relevance of this practice to leaching (la Cecilia et al., 2020). Groundwater can be the carrier of PPPs and TPs stored in the catchment (Belles et al., 2019; Welch et al., 2019; Le Cor et al., 2021). Groundwater can also deliver legacy contaminants (Rasmussen et al., 2015), some of which may still be under mandatory monitoring in Europe due to their health and environmental risk as prescribed by the Water Framework Directive (EC, 2013) (e.g., the herbicide atrazine). Other physical drivers can deliver PPPs to surface water. For example, Messing et al. (2013) study the dry deposition of volatilised PPPs. Silva et al. (2018) show the potential of wind-eroded soil particles to contaminate surface water. Finally, Englert et al. (2017) develop a model to explain the translocation of systemic neonicotinoids from foliage to leaf litter material in streams.
In order to improve future water quality, a profound understanding of underlying contamination sources and processes within a catchment is required (Thomas et al., 2016). Previous knowledge of contamination sources and processes has typically been achieved by controlled PPPs application studies that continuously monitor the known PPPs sources as well as the water bodies receiving the mobilized PPPs (Leu et al., 2004; Schulz, 2004; Doppler et al., 2012; Lefrancq et al., 2017; Schönenberger and Stamm, 2021). The analytical workflow of processing monitoring samples is time-consuming, as it involves the collection of many water samples, transport to the laboratory, storage, preparation, analysis and quantification of target compounds. Additionally, traditional sampling techniques used in these studies, such as grab samples, time composite samples or passive samplers (Moschet et al., 2015), may only represent episodic peaks or constant concentrations. Inherently, traditional sampling techniques are not suitable to understand in detail PPPs dynamics during dry conditions, when contamination sources are expected to be not active. Such knowledge gap hinders the comprehensive assessment of PPPs and TPs dynamics in small streams leading to biased monitoring strategies and risk mitigation approaches to protect aquatic ecosystems (Schulz, 2004).
In the companion study (la Cecilia et al., 2021), we present a first analysis of the novel continuous high-frequency dataset of PPPs and TPs acquired with the fully-automated, on-site high-resolution mass spectrometer platform MS2Field (Stravs et al., 2021). The first analysis focuses on wet periods. The second analysis is presented in this paper and made use of the same MS2Field dataset with a focus on dry periods. Additionally, we complemented the MS2Field dataset with two other datasets. The first complementary dataset was the continuous, low-frequency Swiss monitoring program. The second complementary dataset consisted of a follow-up dry-day field campaign. This latter involved collecting water samples from six point locations along the stream and four tile drain outlets. Using these three datasets, we report on the unexpected concentration patterns observed during two dry periods and on the spatial variability of contamination in shallow groundwater and its impact on surface water quality.
2. Methods
2.1. Study area
A small tile-drained agricultural catchment (2 km2) in the Swiss Plateau close to Lake Constance (Figure 1) was chosen for the continuous high-frequency MS2Field study (details on MS2Field in Section Monitoring campaigns). The choice was based on the results of a previous monitoring campaign (Spycher et al., 2018). The previous campaign revealed not only high PPPs and TPs concentrations but also substantial differences in concentration levels among 12-h composite samples in dry periods. The land use is mainly agricultural with urbanization below 1% and no wastewater treatment plant is present. There were slight changes in land use between 2019 and 2020, with more lands destined to corn and less areas covered with grasslands and orchards (visual and quantitative assessment in Supplementary Figure S1). The catchment is hilly with a median slope of about 3%. The catchment is drained by tile drains, which also connect an estimated additional surface of 0.7 km2 to the stream (black lines in Figure 1; Source of the georeferenced vector file: Planimpuls.ch). Given the relatively high presence of PPPs-intensive crops and farmyards connected to the stream, the catchment is ranked at high risk of PPPs pollution potential, together with 10% of Swiss agricultural streams (Koch and Prasuhn, 2021).
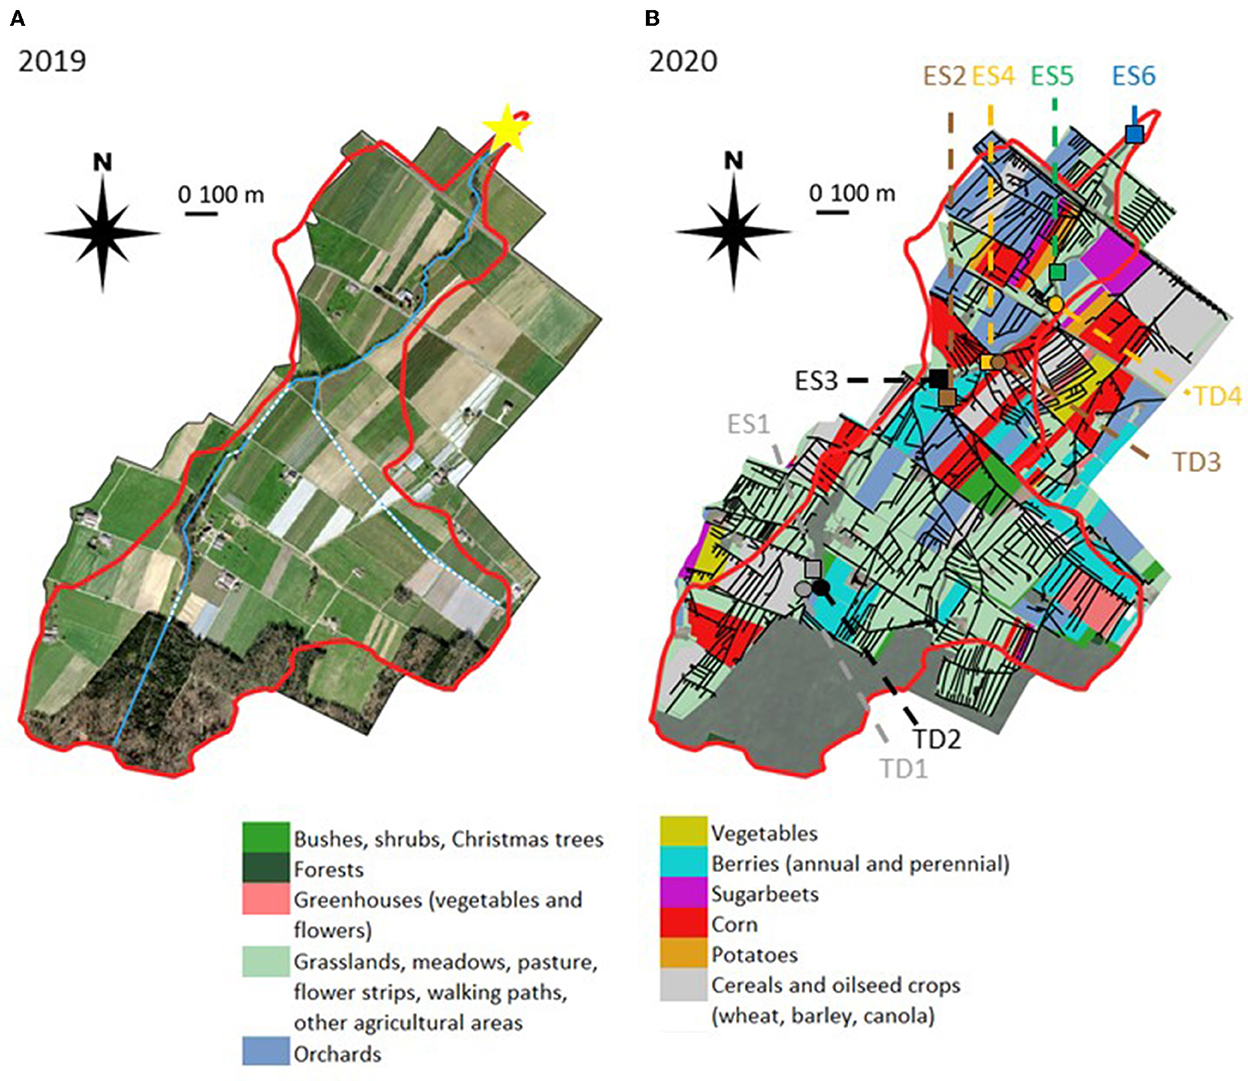
Figure 1. Visualization of the heavily-drained agricultural catchment located in the north-east of Switzerland studied in this research. (A) Aerial photo at 10 cm pixel resolution showing the presence of the riparian vegetation all along the open stream and of few greenhouses. Photo taken on March 29th 2019 available from the Swiss Federal Office of Topography. The red line depicted the topographical catchment. Stream as open flow covered by riparian vegetation in blue line and as culvert in dashed white-blue line. Sampling location at the catchment outlet as yellow star. (B) Landuse at parcel level in 2020 as color filled areas specified in the legend available from the Cantonal Office of “Inneres und Volkswirtschaft.” Dense drainage network as black line. Filled squares indicate the locations of surface water grab samples (label starting with “ES”), while filled circles represent the sampled tile drain outlets (label starting with “TD”). Background to depict non-agricultural lands (i.e., forests, riparian trees, and urban areas) was the true color image from Sentinel-2 at 10 m pixel resolution sensed on August 12th, 2020.
2.2. Meteo-hydrological data
Water level was gauged by the cantonal environmental office at the outlet every 15 min. Rainfall data at 10 min resolution was obtained from the SwissMeteo measuring station “GUT” 1.8 km from the outlet. In this research, we focused on dry periods referred to as days with no rainfall and a daily standard deviation of water levels smaller than 0.5 cm (to avoid falling levels of previous rainfalls).
2.3. Monitoring campaigns
We carried out two water quality assessment campaigns in the study area, one in 2019 and one in 2020. Between May 27th and July 7th in 2019 (41 days), we measured PPPs concentrations at high frequency (20 min) with MS2Field at the catchment outlet during wet and dry conditions (Table 1). The wet conditions are analyzed in la Cecilia et al. (2021).
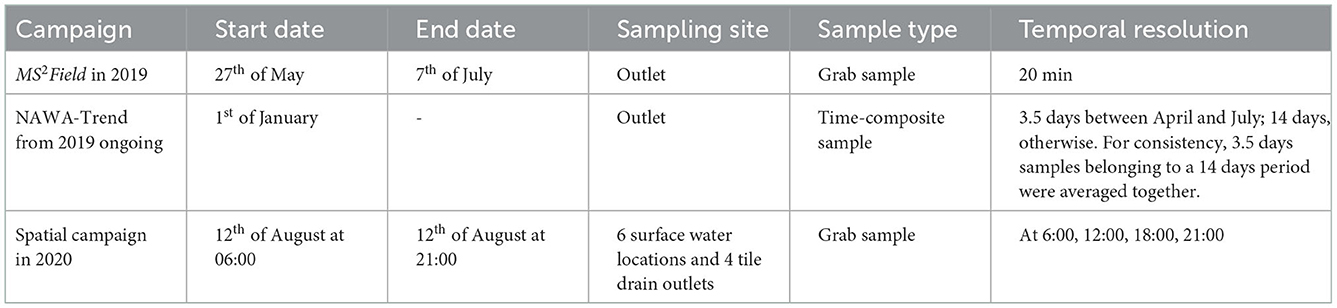
Table 1. Overview of the sampling campaigns detailing the monitored time window, the location of the sampling, the type of sample collected and the temporal resolution of the campaign.
In this research, we discuss the dry periods and expand the analysis of the national low-frequency long-term monitoring (NAWA-Trend) to highlight the seasonality and long-term temporal patterns of PPPs and TPs (Table 1).
The spatial campaign occurred on August 12th, 2020 (Table 1). Grab samples were taken every 6 h at six locations along the stream network (filled squares with the label “ES” in Figure 1B, where “ES” is an identifier of the monitored stream) as well as from four tile drain outlets (filled circles with the label “TD,” which is the abbreviation of tile drain, in Figure 1B). One “ES” location coincided with the catchment outlet sampled in 2019. Pictures of the sampling locations are in Supplementary Figure S2.
2.2.1. MS2Field in 2019
The fully automated mobile unit MS2Field was used to collect and analyse water samples at the catchment outlet by means of high-resolution mass spectrometry with limits of quantification in the low range of ng/l at 20 min time resolution. The workflow and further analytical aspects are explained in Stravs et al. (2021). MS2Field allows for target and non-target screening and target compounds typically differ from site to site depending on the expected contamination sources (e.g., agriculture, industry, cities). The MS2Field campaign covered part of the growing season of 2019, spanning from May 27th to July 7th, collecting 41 days of observations. This application resulted in 2,560 samples, which were analyzed for 60 compounds, of which 32 were measured in concentrations above the corresponding limit of quantification (LOQ). The PPPs and TPs dynamics relative to wet conditions are described in a companion article (la Cecilia et al., 2021). Hereby, we focused on novel PPPs dynamics observed in dry conditions.
2.2.2. National low-frequency long-term monitoring (NAWA-Trend)
The catchment outlet in our study area was part of the Swiss National Surface Water Quality Monitoring Network (Doppler et al., 2020). In the program NAWA-Trend, 3.5-days time-composite samples are collected during the spraying season between April-July (overlapping with the MS2Field campaign in 2019) and 14-days time-composite samples otherwise. Samples are collected with a MAXX sampler with cooling unit. After the composite sample is collected, it is stored in insulated boxes with freeze-packs and transported to the laboratory in Schaffhausen (INTERKANTONALES LABOR) for chemical analysis. Details on the chemical analyses are reported in the Supporting Information of la Cecilia et al. (2021) in Supplementary Section S2.
2.2.3. Spatial campaign in 2020
On August 12th 2020, we carried out a sampling campaign on a dry day, 4 days after the last rainfall, with the stream in low flow conditions. During the campaign, we collected water samples at 06:00, 12:00, 18:00 and at 21:00 (not 24:00 because a summer storm was approaching) at six different locations along the stream as well as from four outlets of active tile drains discharging into the stream. During the day, samples were kept at 4°C in an electric cooler and containing ice packs for 10% of the box volume. Within a few hours after the field campaign, samples were stored at −18 °C for 2 months until chemical analysis.
2.3. Chemical analysis of grab samples collected in 2020
The grab samples collected during the spatial campaign of 2020 were analyzed using direct injection liquid chromatography coupled to high-resolution mass spectrometry. The target list included 14 PPPs and two TPs (Supplementary Table S2). The compounds were selected based on three considerations. First, we targeted the PPPs and TPs that showed novel dynamics in the 2019's MS2Field campaign to verify whether they were reoccurring phenomena. Second, we included few other PPPs withdrawn from the Swiss market to assess their potential risk as legacy contaminants. Third, we targeted the TP of fluopyram, the latter being a persistent fungicide in this catchment to shed light on their environmental fate.
Standards of the target analytes were purchased and combined in a standard solution. The calibration standards (10–5,000 ng/l) were prepared by spiking the standard solution in nanopure water.
The frozen samples were thawed at room temperature. To homogenize the samples, they were swirled around and shaken. Then, 1.5 ml of each sample were transferred into 2 ml measurements vials. Each sample was centrifuged for 5 min at 4,800 rpm and 600 μl of supernatant was transferred into another measurement vial.
To compensate for loss of substance during preparation and measurement, all samples and calibration standards were spiked with 30 μl of a solution containing isotopically labeled internal standards (ISTD) at a concentration of 500 ng/l. Compounds and their corresponding ISTD have a very similar structure and are affected by potential degradation processes in the same way. The ratio of the signal of the target compound and the corresponding ISTD are therefore used for quantification. To account for matrix effects and assess relative recovery of the analytes, randomly selected samples were spiked with 50 or 500 ng/l of the standard solution.
Centrifugation, transfer, spiking of ISTD and standard solution were performed by a fully automated workflow (PAL RTC, CTC). Laboratory blanks and laboratory blinds were included in the measurement sequence to monitor instrument carry-over and contamination.
An injection volume of 100 μl was used and chromatographic separation was performed on a reversed-phase C18 column (Atlantis T3, 3 μm particle size, 3.0 × 150 mm inner diameter, Waters), applying a water-methanol gradient (both containing 0.1% formic acid). The measurements were performed on a hybrid quadrupole-orbitrap mass spectrometer (Lumos Fusion, Thermo Scientific). Quantification of the target compounds was performed using the TraceFinder Software (Thermo Scientific). The samples were injected three times and the relative standard deviation was calculated for each sample for quality assurance. The software used for quantification returned an error message instead of the concentration value for few injections. These no values were neglected from the calculation of the mean concentration and standard deviation of the few affected samples. The relative standard deviation was lower than 10% for 217 triplicates out of 240 from surface water and for 132 triplicates out of 140 from tile drain outlets (Supplementary Table S3). Relative standard deviations >10% almost always concerned triplicates with concentrations close to the corresponding LOQ.
LOQs were in the range of 5–20 ng/l and relative recoveries for 13 out 15 compounds were in the range of 73–112%, while fluopyram had a relative recovery of 42% and diazinon of 69%.
2.4. Determination of the correlation between PPPs concentrations and water levels
We calculated the Pearson correlation coefficient (r) between the concentration (C) time series, and the water level (WL) time series as to include a lag time Δt between the time-series.
3. Results and discussions
In 2019 we identified two dry periods lasting in total 14 days (Figure 2). The first period spanned from June 2nd to June 8th, the second from June 25th to June 30th. Very low rainfall occurred in the 7 days before each of the two dry periods, summing to 6.9 mm and 4.9 mm, respectively.
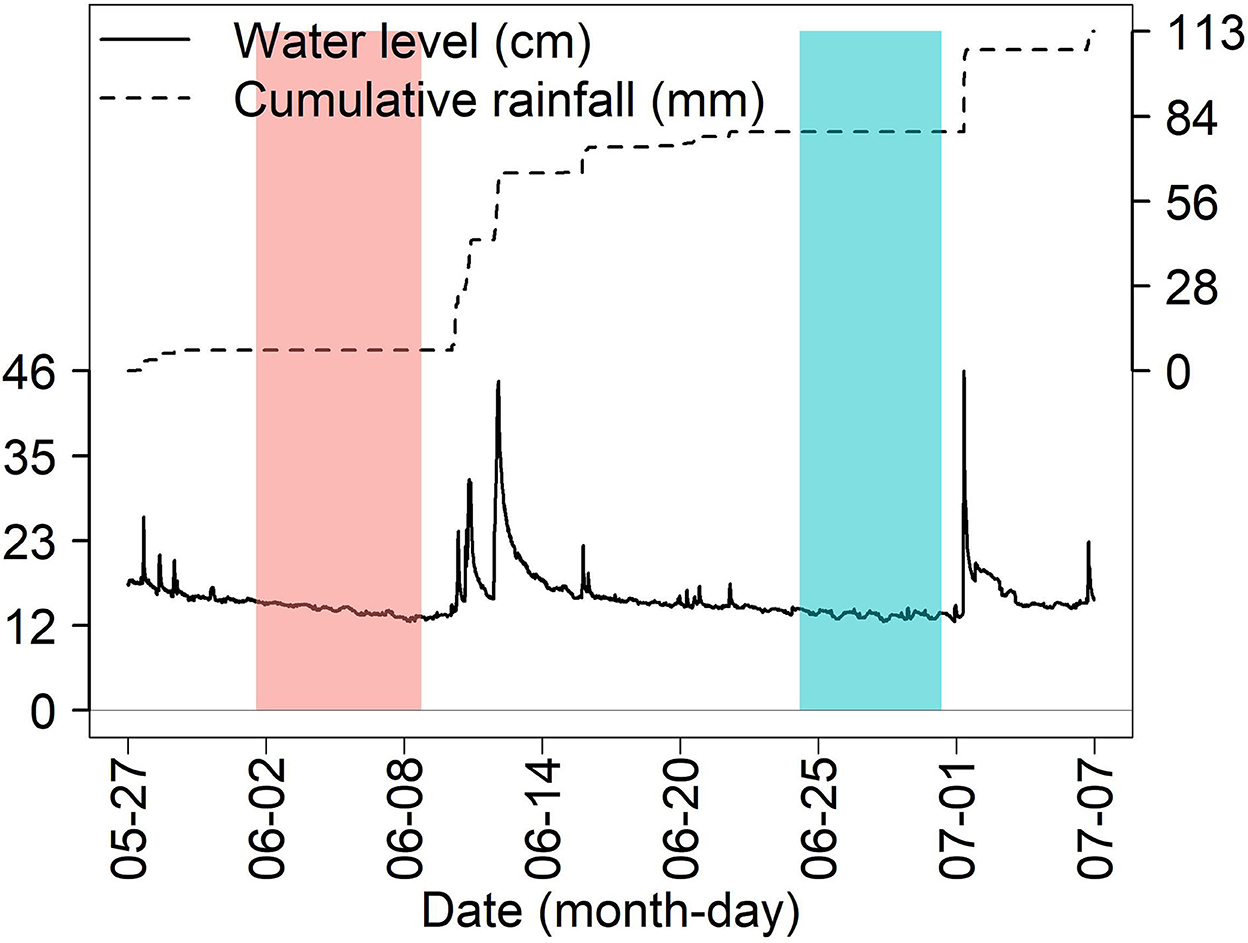
Figure 2. Time series of water levels (solid black line) and cumulated rainfall (dashed line) showing the occurrence of the two dry periods analyzed in this research. The rectangle in salmon highlighted the first dry period and the rectangle in light blue depicted the second dry period.
In the next subsections, we first present the overall picture of the measured concentrations with MS2Field during the dry periods in 2019. Using the same dataset, we show novel concentration dynamics captured for few PPPs and TPs visible only with continuous high-frequency monitoring. For completeness, in Supplementary Section S4, we reported the dynamics of all PPPs and TPs having a concentration above their corresponding LOQ during dry conditions.
We analyse the continuous long-term NAWA-Trend data, which span over the years 2019, 2020 and 2021. The NAWA-Trend dataset allows for gaining further insights on the short-term high-frequency campaign of 2019. Finally, we present the results from the dry-day spatial campaigns of 2020.
3.1. Contaminant concentration magnitudes at high-frequency monitoring
Among the sixty target compounds, 19 exceeded their LOQ in these dry periods. The measured concentrations ranged from few ng/l values to 1,530 ng/l, covering three orders of magnitude (Figure 3). The PPPs, grouped by class, with the highest concentrations were the fungicide fluopyram (1,530 ng/l), the herbicide napropamide (740 ng/l) and the insecticide clothianidin (36 ng/l). Clothianidin is also a major TP of thiamethoxam. Azoxystrobin free acid (i.e., azoxystrobin's TP) was measured at 830 ng/l. The high levels observed during dry periods persisted until the following rain event. These concentration ranges confirmed earlier findings revealing high levels of fluopyram for example at the same location in 2015 (Spycher et al., 2018). We also found the fungicide oxadixyl at high concentrations throughout the dry periods with a maximum of 230 ng/l. Oxadixyl was withdrawn from the Swiss market in 2005, 14 years before this study. The mean concentration of 13 compounds out of 19 increased from the first dry period to the second one (Figure 3). However, the mean water level did not substantially decrease being 13.7 ± 0.7 cm in the first dry period and 13.0 ± 0.4 cm in the second one. This indicated that the increase in concentrations were consequent to more recent PPPs applications rather than poorer dilution capacity.
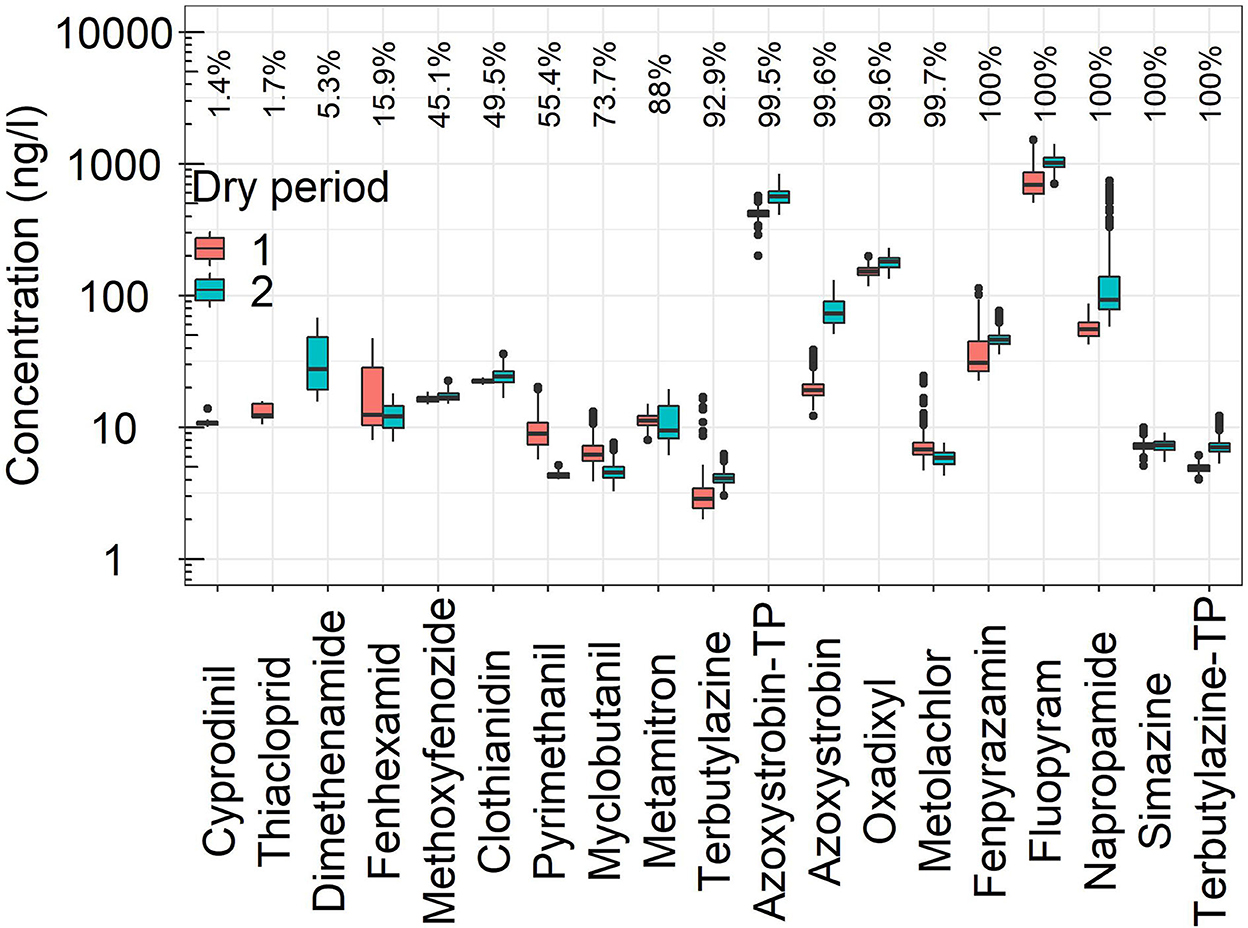
Figure 3. Boxplots of concentration values measured with MS2Field grouped by compound and dry period. The first dry period spanned between June 2nd to June 8th, in salmon. The second dry period spanned between June 25th and June 30th, in light blue. Azoxystrobin-TP stands for azoxystrobin free acid and terbutylazine-TP stands for terbutylazine-desethyl. The percentages refer to detection percentages per compound over the dry periods. Data gaps due to the maintenance of MS2Field from 09:25 to 14:00 of June 3rd, from 22:21 of June 4th to 02:42 of June 6th, and from 06:11 to 10:12 of June 27th were not included. Concentrations below LOQ were removed.
3.2. Novel diel concentration fluctuations captured with the high-frequency monitoring
The high-frequency data demonstrated that few compounds underwent novel diel concentration patterns, lagging daily water level fluctuations by 6 to 8 h (Figure 4). We highlight that not all PPPs and TPs showed diel concentration fluctuations, thus implying that the patterns were not an artifact of MS2Field (e.g., clothianidin in Supplementary Figure S3F, dimethenamid in Supplementary Figure S4B, metolachlor in Supplementary Figure S5F, oxadixyl in Supplementary Figure S6D and terbutylazine in Supplementary Figure S7B, among others). The concurrent and pronounced diel fluctuations of some PPPs and TPs persisted until the next rain event. Concentrations were higher at night and lower during the day. The highest intra-daily ratios between maximum and minimum concentrations over the second dry period ranged between 1.5 and 8.7 (Table 2). For compounds like napropamide, azoxystrobin, fluopyram and azoxystrobin-TP the fluctuations corresponded to changes of several hundreds ng/l between day and night. The concentrations of the fungicides azoxystrobin, fluopyram and fenpyrazamin fluctuated around a constant value, while the fluctuations of the herbicide napropamide dampened over the 1-week-long dry period. The concentrations of azoxystrobin-TP showed a pronounced increasing trend. One reasonable explanation is that azoxystrobin was undergoing degradation to its TP, and the latter was building up in soil before reaching surface water.
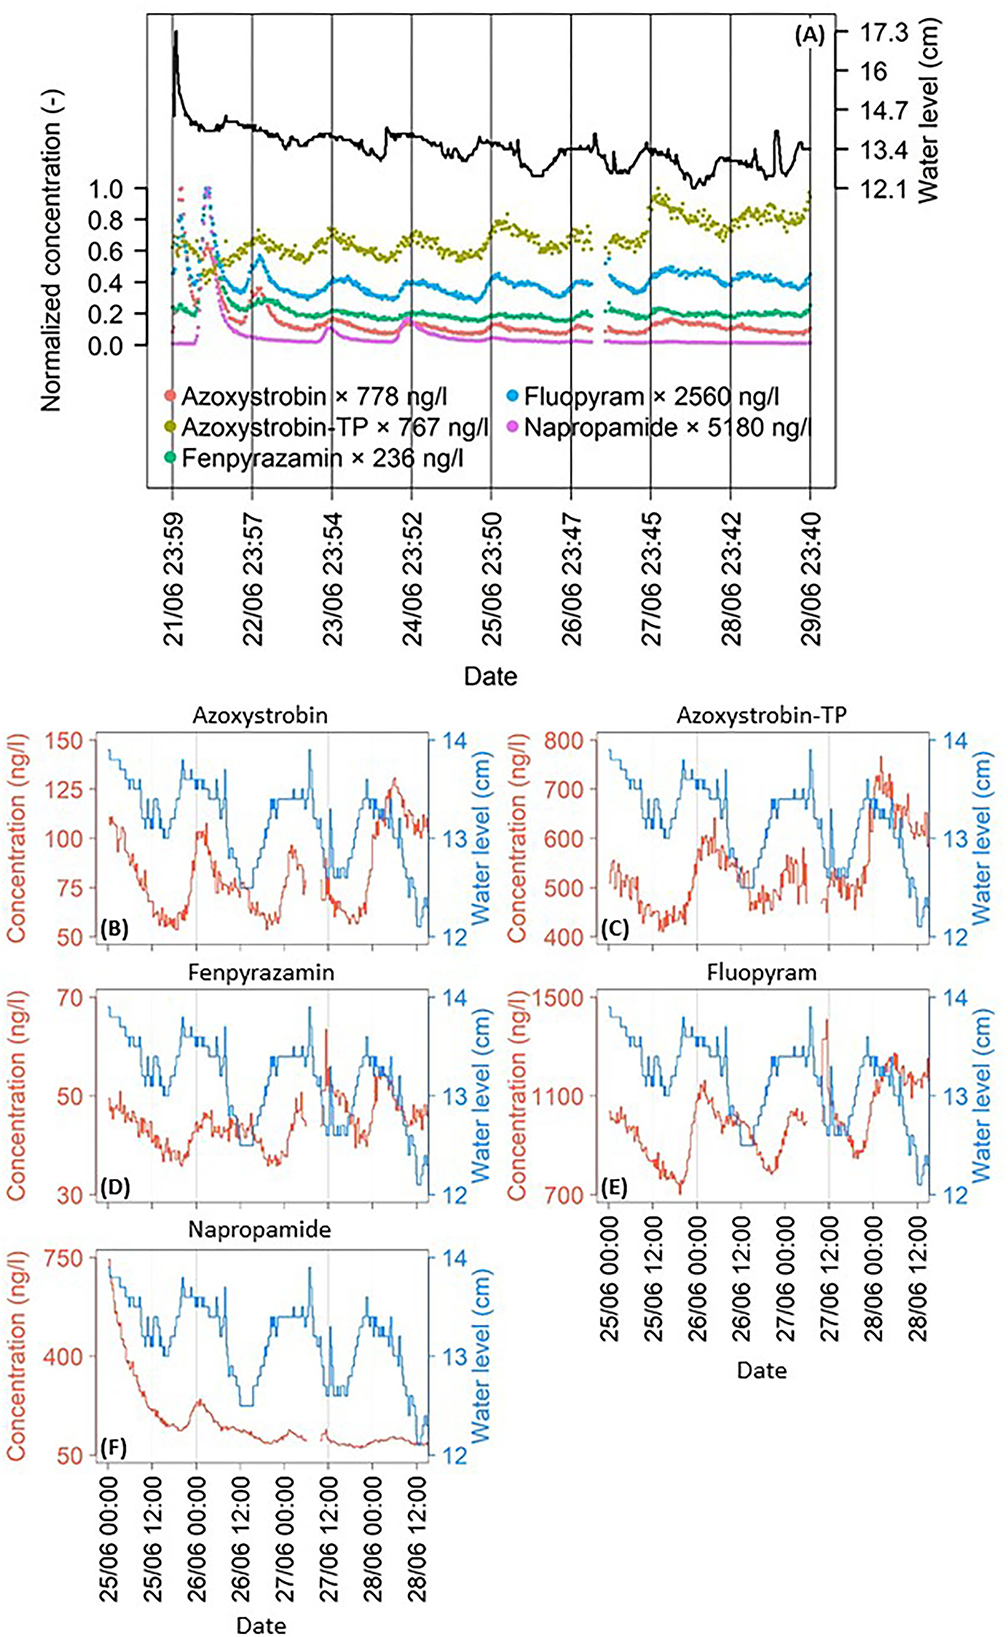
Figure 4. (A) Time series of PPPs and TPs normalized concentrations that showed diel fluctuations. Concentrations to be multiplied by the corresponding maximum value in the legend. The dash black line depicts the water level. No measurements on June 27th from 06:11 to 10:12 because the solution containing isotope-labeled internal standards had to be replenished. Concentrations below LOQ are not shown. Peaks in water levels and concentrations on June 22nd are the result of a small rain event (further details on this event are provided in la Cecilia et al., 2021). Subpanels B–F depict the zoom in on panel A to highlight the temporal shift in daily minima and maxima between water levels and concentrations in the time window from June 25th to June 28th. Water levels shown in the right y-axis. (B) Azoxystrobin. (C) Azoxystrobin free acid. (D) Fenpyrazamin. (E) Fluopyram. (F) Napropamide.
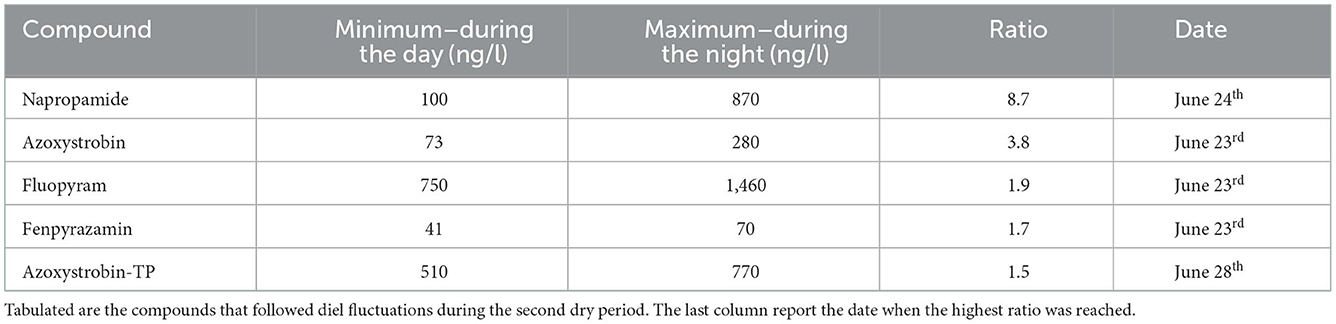
Table 2. Minimum and maximum concentrations in a 24-h period that resulted in the highest ratio between maximum and minimum during the second dry period.
We analyzed in detail the timing of minima and maxima of water levels and concentration levels of those PPPs and TPs showing diel fluctuations in the dry period. We chose the time window between June 25th and June 28th because the diel water level fluctuations were less affected by short-living water level peaks, which may be caused by other processes. Minimum water levels were measured between 15:15 and 17:00, while maxima from 20:15 and 22:15, with water levels increasing by about 1.8 mm per hour from the minima to the maxima (Table 3). Minimum concentration levels of PPPs occurred between 18:16 and 22:20, while maxima were measured from 00:59 to 06:03. The minimum r value (negative correlation) achieved a value of −0.80 (p < 0.05) given a lag time Δt ≈ 8 h for azoxystrobin-TP (Table 3). In these circumstances, the time series of water levels and chemical concentrations were almost in opposite phase (panels B in Supplementary Figures S8–S12). The maximum r value (positive correlation) was equal to 0.59 (p < 0.05) given a lag time Δt ≈ 20 h for azoxystrobin (Table 3). In this case, the time series of water levels and chemical concentrations were almost synchronous.
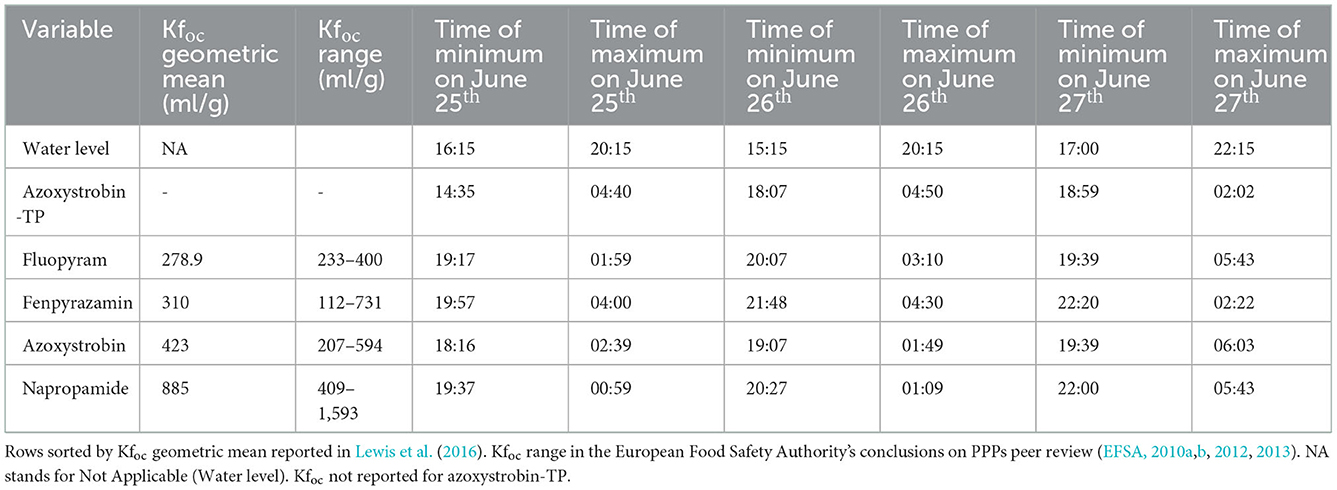
Table 3. Timing of minima and maxima of water levels and of concentrations of those PPPs and TPs that showed diel fluctuations analyzed in the time window from June 25th to June 28th.
The diel concentration fluctuations of some PPPs were probably the most surprising result. Diel patterns have also been observed for stream water quality parameters, such as pH and dissolved chemical species including oxygen, carbon, nitrogen due to diel changes in interplaying physical and biogeochemical cycles and processes (e.g., sunlight, respiration, photosynthesis, etc.) (Nimick et al., 2011). Instream geochemical processes including redox reactions and reversible adsorption could possibly explain the diel fluctuations of heavy metals in streams during low flows (Nimick et al., 2003). However, diel concentration fluctuations have not been reported for PPPs in streams not impacted by daily industrial discharges (e.g., wastewater treatment as in Stravs et al., 2021). We analyzed whether reported causes for diel fluctuations (Nimick et al., 2011) could explain our measurements. Napropamide as the PPP with the largest concentration fluctuations observed in Figure 4 could undergo fast photolytic degradation with a DT50 of 1.5 days (Lewis et al., 2016), but fenpyrazamin had the smallest concentration fluctuations despite a similar photolytic DT50 of 1.6 days. In addition, the daily timing and the well developed riparian vegetation rendered photolytic degradation a not very plausible reason for the diel fluctuations. Often the concentration started to decrease around midnight and well before sunrise. We hypothesized that the diel fluctuations of water levels and of PPPs and TPs concentrations were causally linked. Discharge and hence water level are known to vary due to evapotranspiration in the hillslope or in the riparian vegetation (Burt, 1979; Bren, 1997; Bond et al., 2002; Szeles et al., 2018; Harmon et al., 2020; Kirchner et al., 2020). We compared the water level observations against numerical simulations for the studied catchment using a state-of-the-art fully integrated surface-subsurface hydrological model (i.e., CATHY by Camporese et al., 2010). The model achieved a satisfactory accuracy in capturing the streamflow dynamics over the 41-day-long monitoring period, with the Kling-Gupta efficiency index of 0.68, Nash-Sutcliffe model efficiency coefficient of 0.68, Willmott index of agreement of 0.88 and Root Mean Square Error of 0.04 (la Cecilia and Camporese, 2022). The results support the hypothesis that the sources of the diel streamflow fluctuations are transferred from the first meter of shallow groundwater to the stream, and that they are regulated by evapotranspiration in this small tile-drained agricultural stream during dry periods. Upon estimating the occurrence of two daily irrigation events to balance the water deficit between rainfall and evapotranspiration for all agricultural lands, with the first event at 7 a.m. and the second at 5 p.m., the simulations also reproduce the observed small short-living water level peaks (black line in Figure 4).
The results implied that the diel concentration fluctuations were caused by fluctuating fluxes from groundwater to surface water. We investigated whether PPPs with increasing sorption coefficient values resulted in increasing peaks arrival times. The data presented in Table 3 showed that to increasing Kfoc values did not correspond an increasing arrival time of the peak concentration at night due to a stronger retardation effect. Yet, the order of the peaks timing among the target compounds changed during the 3 days considered in the analysis. This result indicated that sorption was not a predictor for the peaks arrival time. We then analyzed whether sorption could play a role in the lag time Δt needed to achieve the highest correlation, in magnitude. The data presented in Table 4 did not suggest the presence of a relationship between the four PPPs and the lag time Δt. While we acknowledged that more PPPs were needed to perform a robust analysis, we became more convinced that the peak arrival times were predominantly driven by other two predominant factors. One factor was the distance of the critical source areas from the outlet. The second factor was the temporal activation of the connectivity of the flowpath delivering contaminated groundwater to surface water. As a consequence, we suggest that knowledge on where these PPPs were applied would be key to pinpoint the critical source areas and where to further our understanding of transport processes as well as to suggest cost-effective risk management actions. In this sense, it would be crucial that research institutions have access to geo- and time-referenced PPPs application data to enhance the efficiency, effectiveness and scope of field studies.
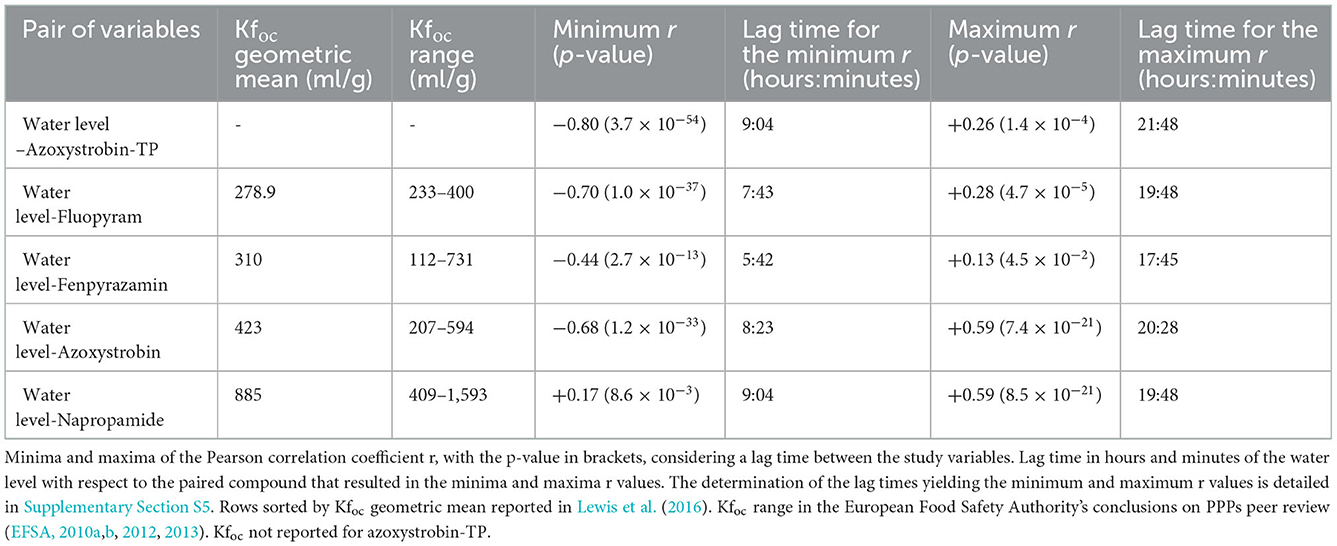
Table 4. Correlations between time series of water level and compounds that showed diel concentrations fluctuations during the second dry period.
3.3. Insights and outlooks from the continuous long-term monitoring
The monitoring opportunities achievable with MS2Field were unprecedented. In fact, MS2Field acquired a continuous high-frequency dataset of PPPs and TPs concentrations in dry conditions. However, it was neither the scope nor realistic to continue the high-frequency monitoring for months or years. And so, the NAWA-Trend program allowed for gaining further insights into our measurements thank to its continuous low-frequency monitoring.
The diel fluctuations (Figure 4) were not observed for all compounds during both dry periods. For example, such fluctuations were observed for the fungicide azoxystrobin in the second dry period only, while those of pyrimethanil in the first dry period (Supplementary Figure S3B and Supplementary Figure S6E, respectively). NAWA-Trend indicated that the diel patterns were evident in the periods of higher concentrations for the compounds of interest (Figures 5A, B). Very likely, the strength of the diel signal depended on the magnitude (contaminant mass) available at the critical source, the occurrence of the driving force (i.e., evapotranspiration) and the mixing with “contaminant-free” water contributed by other parts of the catchment.
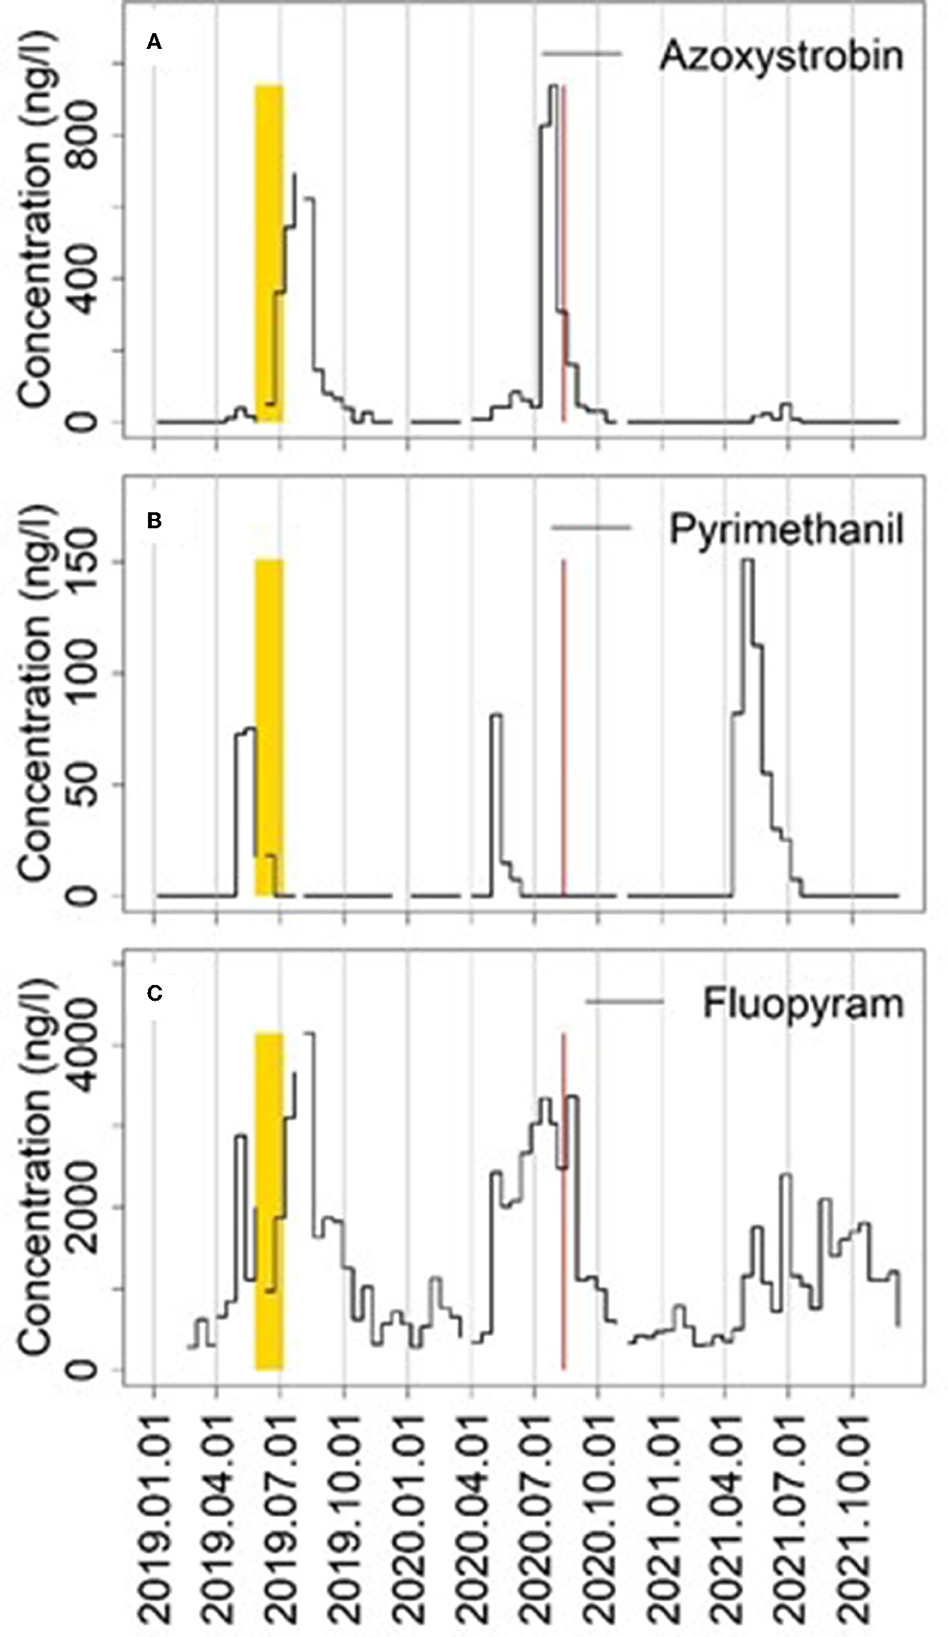
Figure 5. Time series of the concentrations of selected PPPs measured by NAWA-Trend at 14 days resolution. The continuous low-frequency monitoring allowed for understanding the seasonal patterns of target PPPs. The yellow background highlighted the relatively short time-window covered by the high-frequency monitoring campaign with MS2Field in 2019. The red background visualized the period of the dry-day sampling campaign of August 12th, 2020 (thickness cover 3 days rather than 1 day for visualization purposes). (A) Fungicide azoxystrobin, (B) fungicide pyrimethanil, and (C) fungicide fluopyram.
NAWA-Trend revealed concentrations of the fungicide fluopyram exceeding 100 ng/l also in the winter season (Figure 5C); all other PPPs concentrations decreased below such level. This finding sparked the questioning of why fluopyram was continuously found in the stream. The first possible reason is that the physical-chemical properties are indicative of environmental persistence. This is based on high adsorption (KfOC = 278.9 ml g−1) and poor dissipation (DT50 of 309 days) parameters (Lewis et al., 2016). A second reason why fluopyram was detected at high levels also in winter may be grounded on its approved use in greenhouses as well as in apple orchards up to 1 week before harvest. In the studied catchment, variants of strawberries were grown early in the year below plastic tunnels, which could have required early treatments. Of course, the two reasons are not mutually exclusive.
The indication of a widespread and extended use all over the year of fluopyram in the catchment comes from application data (shared by farmers with the cantonal environmental office who kept the data confidential). The identified reasons for this widespread use are driven by the fungicide's low toxicity against tested organisms under the current regulatory framework and its diverse use on crops grown in the catchment. The food supply chain also recommended to their consortium farmers to use the same PPP, which in this case was fluopyram, in order to avoid the multi-residue risk of PPPs in food and food commodities. And pip fruit growers did treat their apples before harvest (in autumn) to mitigate the risk of fruit rotting during storage, and therefore, secure their income up to the point of sale to any array of buyers. Because the choices for widespread fluopyram use grounded on local factors, such as expert recommendations, personal preferences and agricultural practices, it was the responsibility of the whole food value chain to undertake actions to reduce the use of PPPs in a more general context (as described in Möhring et al., 2020).
3.4. Dry-day field campaign in 2020
In 2020, NAWA-Trend was still measuring high levels of those PPPs that were measured at high concentrations and underwent diel concentration fluctuations in 2019. The dry-day campaign on August 12th 2020 generated three answers. First, it corroborated the previous findings of 2019 in terms of daily variability of concentration values. Second, it provided quantitative information on the spatial variability of concentration levels. Third, it assessed the contribution of tile drains to surface water contamination.
3.4.1. Surface water
Seven PPPs and two TPs exceeded their LOQ out of the 16 target compounds in the stream (Supplementary Figure S13). The concentrations at the outlet were in line with the measurements of 2019 (blue filled circles in Figure 6 and Supplementary Figure S13 representing the location ES6). Along the stream, concentrations ranged from below LOQ to 3,300 ng/l, the latter being the maximum value measured for the fungicide fluopyram (Figure 6A). These measurements corroborated the high levels observed during dry periods of the previous years. Maximum concentrations were generally reached in the two most upstream sampled locations, with the right branch (brown filled circles in Figure 6 and Supplementary Figure S13 representing ES2) being more contaminated than the left one (gray and black filled circles in Figure 6 and Supplementary Figure S13 representing ES1 and ES3, respectively). This may be explained by the larger cultivated area draining into the right branch (Figure 1). Note that the right branch is a culvert before reaching the junction with the left branch, and it is fed by a dense drainage network. Therefore, the spatial campaign could also allow for retrospectively distinguishing the contamination sources coming from the left and right branches. Importantly, oxadixyl concentrations were below its LOQ in the left branch of the stream and decreased along the stream from the right branch to the outlet (Figure 6C).
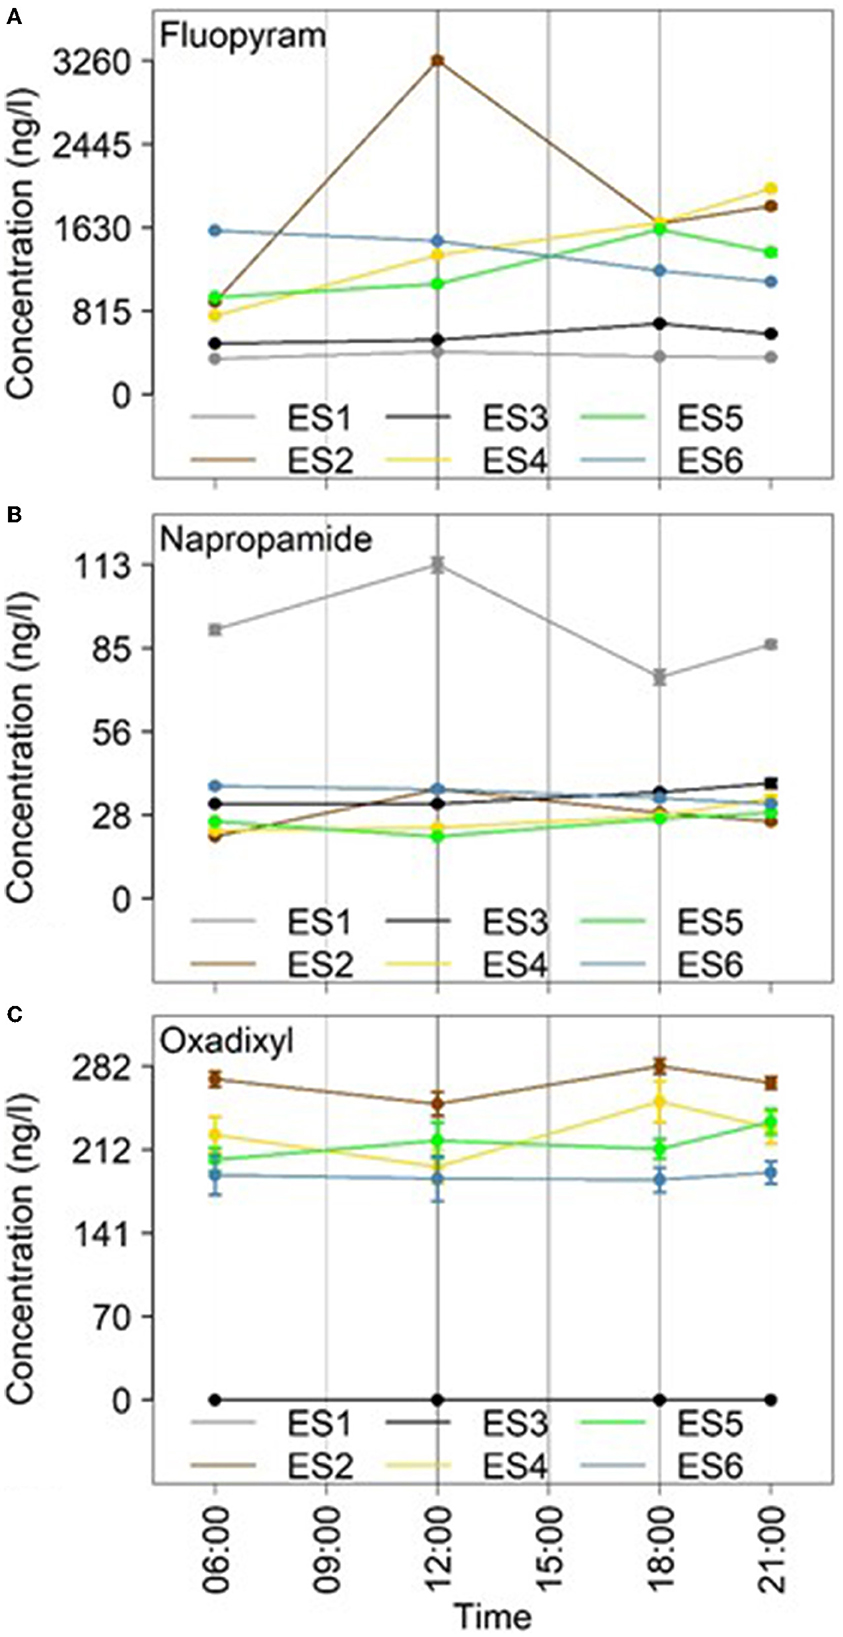
Figure 6. Time series of concentrations in surface water for selected PPPs measured during the dry-day campaign across the catchment on August 12th 2020. Data points are grouped by compound, colored by location and depicted over time. The vertical bars indicated the standard deviation of the measurements (mean concentration of 3 injections of the same sample). (A) Fungicide fluopyram, (B) herbicide napropamide, and (C) fungicide oxadixyl withdrawn from the Swiss market in 2005.
The different PPPs reached their maximum concentrations in different locations and at different times (Supplementary Figures S14, S15). The ratio between the maximum and minimum concentration for a single PPP measured at the same time but at different locations reached a factor of 17, with a mean value > 4 among the PPPs. The ratio between the maximum and minimum concentrations for a single PPP at one location over the day exceeded a factor of 4, with a mean value of 1.6 among the PPPs. For example, azoxystrobin concentrations ranged between a minimum of 10 ng/l to a maximum of 120 ng/l at 6:00 across the catchment as well as ranged between a minimum of 49 ng/l at 6:00 to a maximum of 200 ng/l at 12:00 at the same location. These results confirmed that concentrations can vary during the day at all locations during low flow conditions. This variability could be due to land management practices triggering contamination sources and transport (i.e., PPPs applications, irrigation, etc.) but also due to natural diel fluctuations as shown in this research.
The measurement of a few grab samples spatially distributed proved to be an agile, efficient and effective strategy to narrow down influential contamination sources. Successful results for sources identification by means of non-intensive spatial monitoring are also obtained by Warner et al. (2021). Our monitoring relying upon previous knowledge about diel fluctuations in dry periods further revealed the large variability per compound depending on the time of the day. Some PPPs reached very high concentration levels. The most extreme case was fluopyram, which high concentrations corroborate earlier findings from the study area (Spycher et al., 2018) but are way beyond what has been reported in the limited literature reporting fluopyram concentrations (Sjerps et al., 2019; Pinasseau et al., 2020). What the grab sampling though clearly demonstrated was the occurrence of fluopyram in the entire length of the open stream and in several tile drains. Thus, the transport pathway had to be widespread across the catchment, which was in agreement with our discussion on fluopyram use in Section Insights and outlooks from the continuous long-term monitoring. Due to confidentiality, we could not study the relationship between PPPs applications and their detections in the stream. It is known that PPPs applications, environmental drivers and timing of sampling are important factors for explaining PPPs detections in water (Materu et al., 2021; Schönenberger et al., 2022). Yet, mitigation measures may be effective at reducing water pollution by attenuating the mobilization and transport of PPPs (Chow et al., 2020). In this catchment, the reduced use of persistent PPPs is suggested for avoiding long-term contamination of the stream, such as in the case of oxadixyl. In fact, very likely the high concentrations of the legacy compound oxadixyl reflects the impact of lateral flow of a fungicide intensively used in the past. While fluopyram was not yet a concern for surface water due to its low acute toxicity profile (against the tested organisms), it posed a risk to groundwater where the safety threshold was more stringent and equal to 100 ng/l. The aquatic ecotoxicological assessment revealed no exceedances by the approved PPPs of the corresponding acute quality standards (AQS) listed in the Swiss legislation. However, for azoxystrobin-TP and fluopyram-TP we did not have their corresponding AQS. If we were to use the AQS of the corresponding parent compound, then azoxystrobin-TP poses a risk to the aquatic environment. In fact, we calculated a mean concentration over the day and over the sampling locations of 706 ng/l, which is greater than the AQS of azoxystrobin equal to 550 ng/l. Fluopyram-TP concentrations did not exceed the AQS of fluopyram, and therefore, is supposed not to pose a risk to aquatic organisms. For oxadixyl, there is a published ad-hoc ecotoxicological standard (Maximum Tolerable Risk or MTR) value of 109 μg/l (Beek et al., 2008). The MTR value of oxadixyl is about three orders of magnitude higher than the measured concentrations. We concluded that oxadixyl does not pose a risk to the aquatic environment.
3.4.2. Diel fluctuations
At the catchment outlet (ES6), those PPPs with concentrations showing diel fluctuations in 2019, were again measured at higher concentrations at 6:00 and lower concentrations at 21:00 in 2020 (fluopyram in Figure 6A and azoxystrobin together with their corresponding TPs in Figure 7). This result demonstrated that diel fluctuations were a re-occurring phenomenon in this catchment. The data from 2020 further showed that also fluopyram-TP followed diel fluctuations, which was not analyzed in 2019.
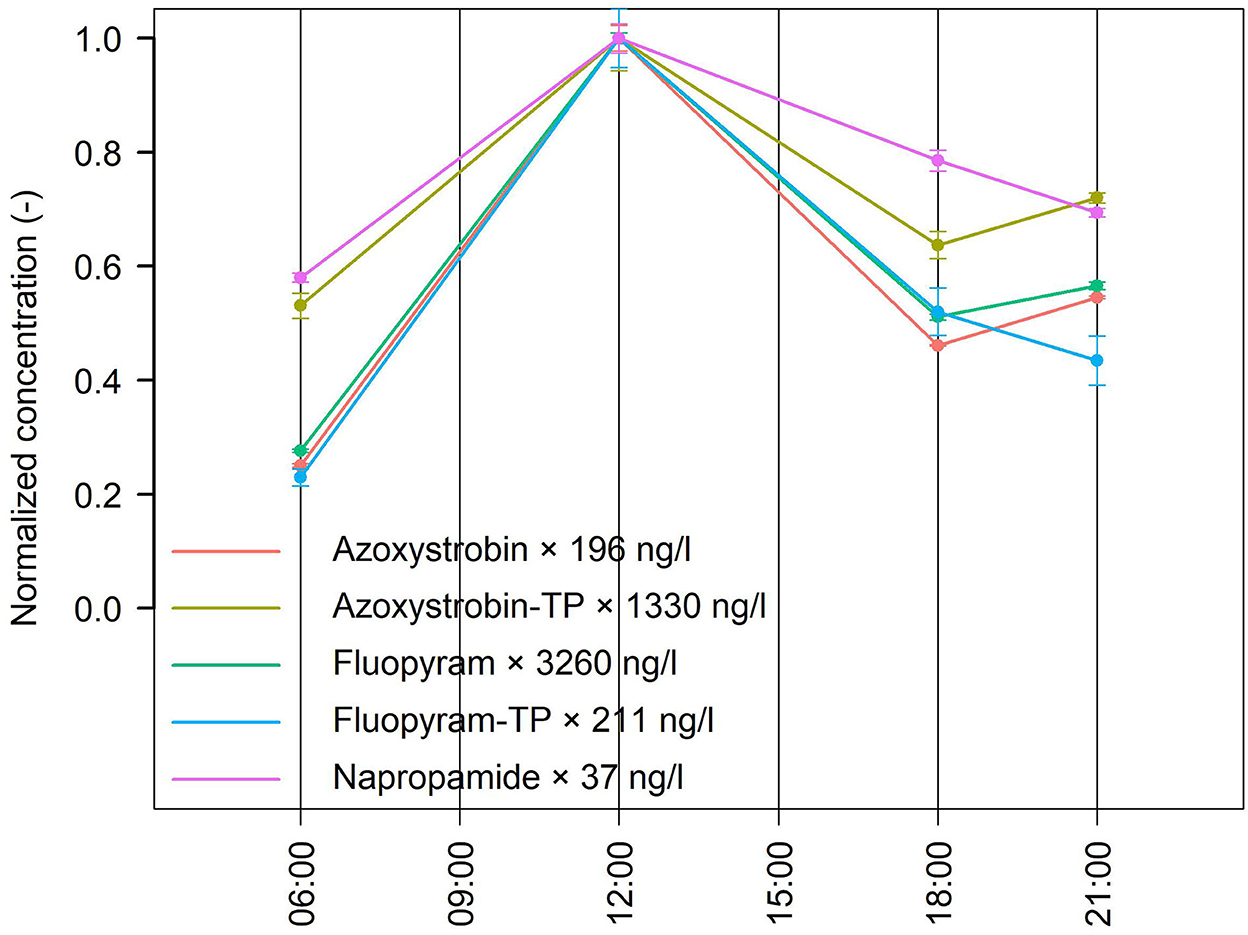
Figure 7. Time series of normalized concentration values for selected compounds measured during the dry-day campaign on August 12th 2020 at the upstream right location ES2. Concentration values normalized by the daily maximum concentration of the corresponding compound. Vertical bars indicated the standard deviation of the three injections per sample divided by the daily maximum concentration of the corresponding compound.
In the right branch (ES2), we observed a clear peak for fluopyram, azoxystrobin and their TPs at 12:00, with concentrations 2 to 4 times higher than the concentrations measured at 6:00 or 18:00 (fluopyram in Figure 6A and azoxystrobin together with their corresponding TPs in Figure 7), with the lack of meteorological drivers. However, it seemed not plausible that the branch ES2 is the source of the diel fluctuations given the long travel time of 12 h for the peaks measured at 12:00 to reach the outlet at night (only 1 km downstream).
An insightful analysis resulted from the calculation of normalized concentrations with respect to the maximum concentration relative to each compound. Interestingly, the slopes of the changes in normalized concentrations for azoxystrobin and fluopyram were identical over the day (Figure 7). Because this would indicate an identical mixing ratio at different times, we inferred that they were delivered by the same source. A similar result was found for fluopyram-TP although in the last sample the slope was negative for fluopyram-TP in contrast with the positive slope for azoxystrobin and fluopyram. The slopes of the changes for azoxystrobin and fluopyram were aligned with the ones of azoxystrobin-TP, but azoxystrobin-TP normalized concentrations varied less than the former PPPs, which may suggest the steadier mobilization of azoxystrobin-TP from its source and flowpath than azoxystrobin and fluopyram. The initial slope of the changes for napropamide was identical to azoxystrobin-TP but differed in the following times.
3.4.3. Tile drains
The tile drain samples confirmed results observed in the stream: some compounds were found at elevated concentrations despite the dry conditions. Concentrations achieved for example a maximum value of 490 ng/l by fluopyram (Table 5; Supplementary Figure S16).
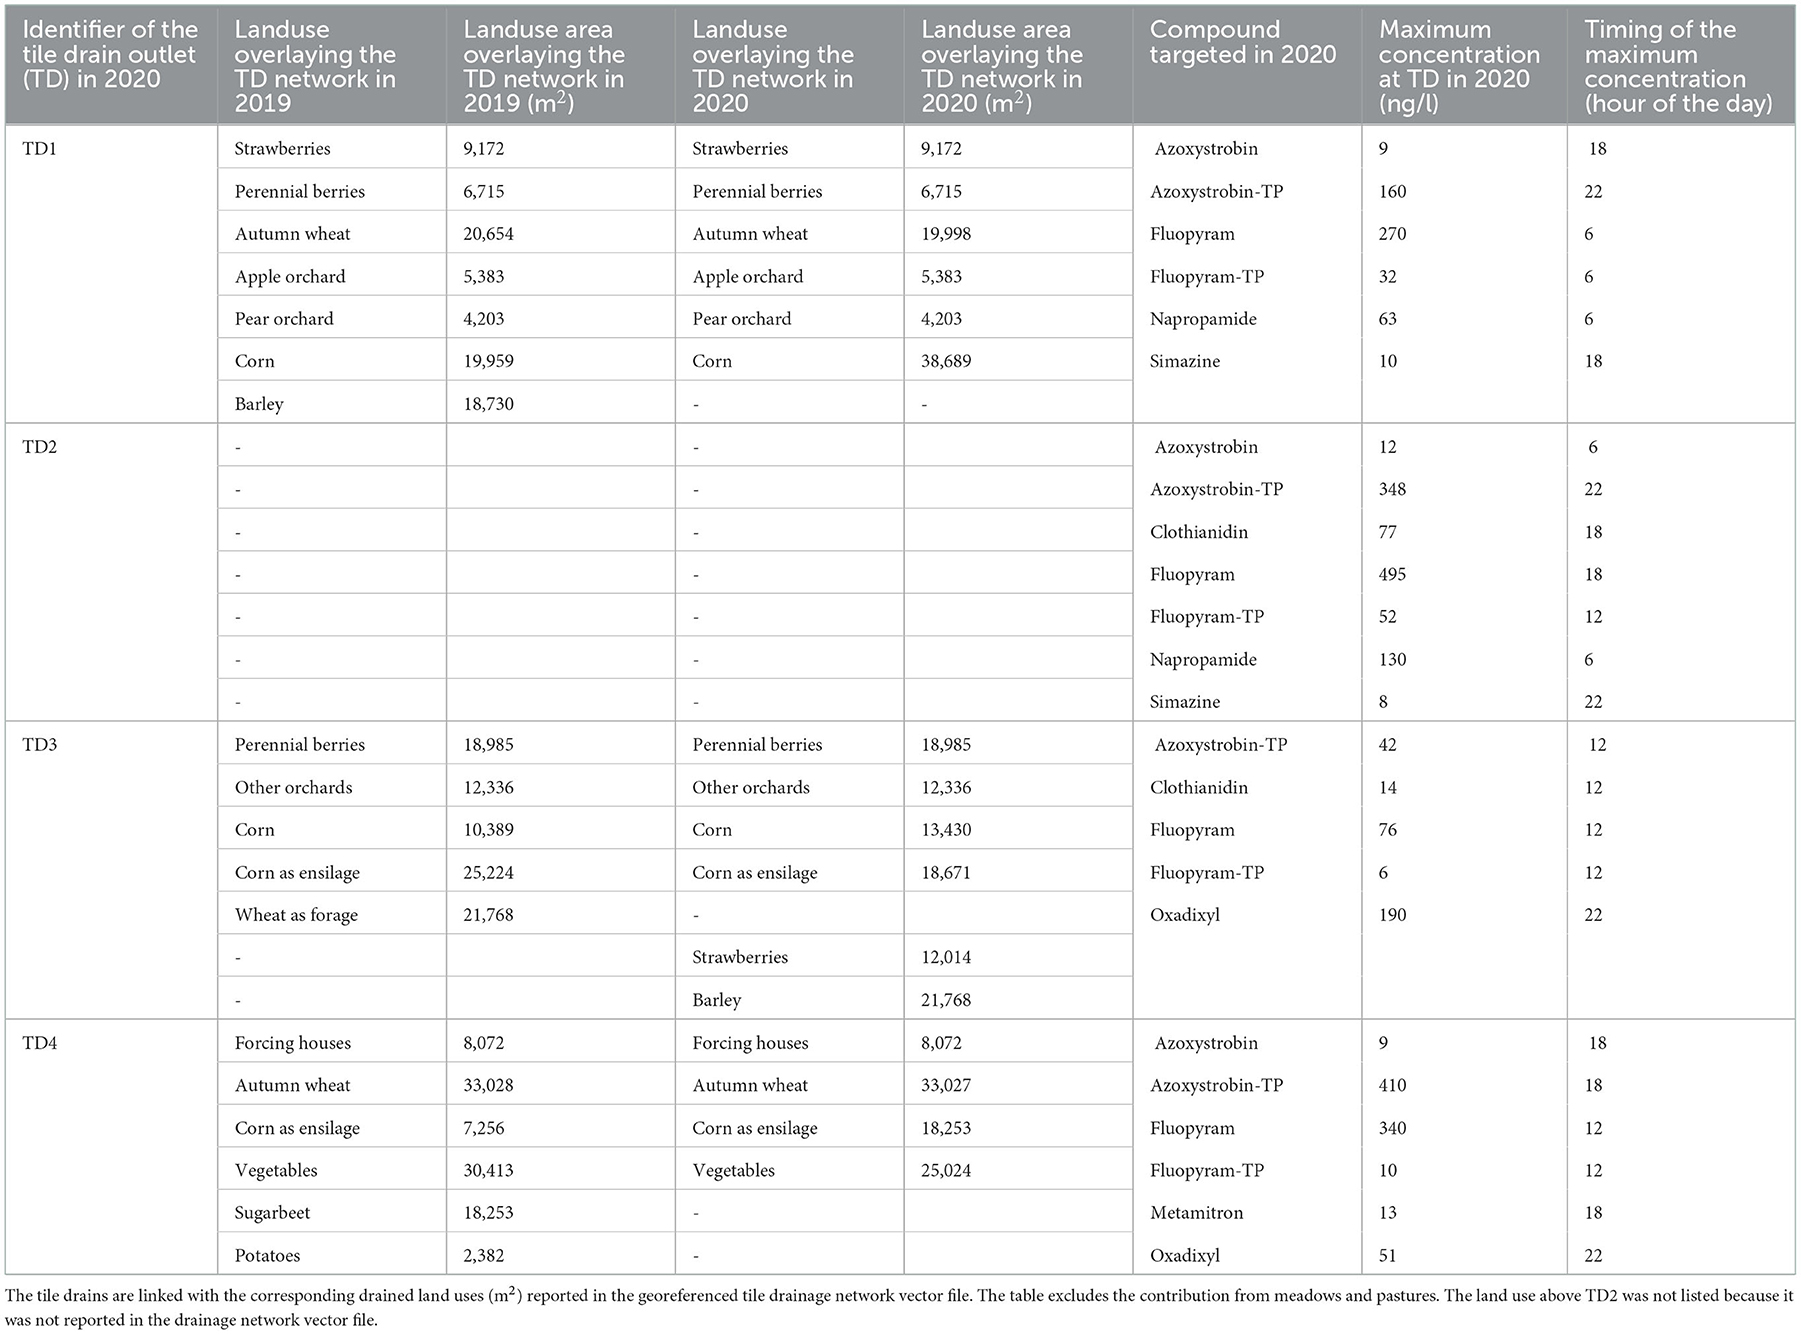
Table 5. Maximum concentrations of the target compounds measured at the tile drain outlets during the dry-day campaign in 2020.
By overlaying the drainage network map with the high-resolution land use maps of 2019 and 2020, we could verify that the measured substances in TD1 matched with the PPPs allowed for use in the previous or current year on the drained areas according to the Swiss legislation (Table 5). However, we could not use the land use data to confidently shortlist the PPPs to measure at the outlets of drainage networks. This is because often tens of PPPs are approved for the same land use, intercropping within a year or crop rotations between years can be a management practice and the drainage network can encompass many land uses. The second outlet was not recorded in the acquired georeferenced vector file of the drainage network (black lines in Figure 1B; Source: Planimpuls.ch). Therefore, we could not carry out the same matching procedure.
Through the inspection of the tile drain outlets, we observed that branches of the stream network were active in dry conditions only thanks to the contribution of culverts fed by tile drains. In particular, the left branch of the stream was formed by three tile drains, and two of them (TD1 and TD2) were active during the campaign. Thus, assuring good water quality in tile drains can be relevant for the ecological status of small streams.
Downstream of the junction between the left branch and the right one, we found two additional active tile drains, TD3 upstream and TD4 downstream. Interestingly, TD3 and TD4 also drained areas outside the topographic catchment. In TD4, the external area extended to 6.6 ha. We measured higher concentrations in TD4 than in TD3. This result stressed the fact that processes occurring outside the topographic catchment can be relevant to understand water quality issues in small streams. Also in this case, the measured PPPs matched with the approved PPPs for the land uses drained by TD3 and TD4 (Table 5).
4. Conclusions
Water quality protection and improvement of the aquatic ecosystem is urged worldwide. As the likelihood of dry conditions in agricultural streams is increasing due to climate change, it is important to close the knowledge gap on the dynamics of plant protection products (PPPs) and their transformation products (TPs) under these conditions. By analyzing the novel continuous, high-frequency and multi-compound monitoring dataset gained by means of MS2Field, this study revealed diel concentration fluctuations for some PPPs and TPs over extended periods, with maximum concentrations occurring at night. Crucially, grab sampling is not typically carried out at night, when concentrations can be higher than during the day in dry conditions. Very likely, the diel patterns originated from evapotranspiration-driven diel fluctuations in groundwater flow into surface water. This suggests that PPPs and TPs persisted in the shallow groundwater. Groundwater level and quality data above and below the tile drain network would be important to better understand the mechanisms involved in the generation of the diel fluctuations. In case the systemic contaminants were to be found within the root zone, it would also be likely that plants took them up stored them in their tissues such as leaves.
A knowledge-based non-intensive spatially-distributed grab sampling campaign of surface water was effective to corroborate the diel fluctuations of concentrations, demonstrate the widespread occurrence of high concentrations of some fungicides in the catchment as well as narrow down persistent contamination sources. Adding the sampling of tile drains allowed for identifying where this flowpath was relevant for water quality issues, which corroborated the widespread contamination of the shallow groundwater by some fungicides.
Open land use data explained the PPPs measured in the below tile drains. However, land use data were not suitable to shortlist the PPPs to measure at the outlets of drainage networks given that often tens of PPPs are approved for the same land use, crops can be rotated, farmers can have intercrops and the drainage network can encompass many land uses.
To address the issue of the generality of the findings, more evidence is needed to understand the drivers of the persistent contamination sources that led to the unexpected dynamics in low flow conditions. Technology is delivering data of unprecedented quality in terms of continuity and frequency. However, accurate insights from such innovative campaigns is dependent on complementary evidence resulting from stakeholder's decision-making and activities, which information may be difficult to acquire. Thus, it is crucial to foster collaborative monitoring initiatives among stakeholders to achieve safer PPPs risk management, when alternative pest management solutions not relying on synthetic chemicals would not be effective.
Data availability statement
Data presented in this article is available at https://opendata.eawag.ch/group under the project NAWA-Flowpath. The MS2Field data is published as open data on the Eawag digital repository with the doi: 10.25678/0007BD.
Ethics statement
Written informed consent was obtained from the author DC for the publication of any potentially identifiable images or data included in this article.
Author contributions
HE, MK, HS, and CS contributed to conception and design of the MS2Field study. DC, MK, HS, and CS contributed to conception and design of the grab sampling campaign. HE and MK maintained active exchanges with local stakeholders. AD performed the chemical analyses and wrote sections of the manuscript. DC and AD organized the database. DC performed the data analysis and wrote the first draft of the manuscript. HS and CS substantially contributed to shaping the manuscript until its final version. All authors contributed to manuscript revision, read, and approved the submitted version.
Funding
DC was supported with funding by the Swiss Federal Office for the Environment. The research was funded by Eawag, Thermo Fisher and CTC Analytics. Open access funding provided by Eawag-Swiss Federal Institute of Aquatic Science and Technology.
Acknowledgments
The authors acknowledge their colleagues who helped with the placement of MS2Field in the field: Philipp Longree, Christoph Ort, Benedikt Lauper and Michele Stravs. The colleagues Reynold Chow and Birgit Beck contributed to the dry day campaign in 2020. We thank Tobias Doppler from VSA for providing the PPDB database and the NAWA-Trend data. We thank Rosi Siber of SIAM-Eawag for providing the land use database. We thank Planimpuls AG Bauingenieure SIA for providing the georeferenced vector file of the drainage network. We thank the visiting Eawag Partnership Programme Fellow Emma Davies from Stellenbosch University for her suggestions to improve clarity in some parts of the manuscript.
Conflict of interest
The authors declare that the research was conducted in the absence of any commercial or financial relationships that could be construed as a potential conflict of interest.
Publisher's note
All claims expressed in this article are solely those of the authors and do not necessarily represent those of their affiliated organizations, or those of the publisher, the editors and the reviewers. Any product that may be evaluated in this article, or claim that may be made by its manufacturer, is not guaranteed or endorsed by the publisher.
Supplementary material
The Supplementary Material for this article can be found online at: https://www.frontiersin.org/articles/10.3389/frwa.2022.1062198/full#supplementary-material
References
Beek, M., ten Hulscher, D., Heugens, E., and Janssen, P. (2008). Afleiding van 41 ad hoc MTR's 2007. Rijkswaterstaat Waterdienst. 1–240.
Belles, A., Alary, C., Rivière, A., Guillon, S., Patault, E., Flipo, N., et al. (2019). Transfer pathways and fluxes of water-soluble pesticides in various compartments of the agricultural catchment of the canche river (Northern France). Water. 11, 1428. doi: 10.3390/w11071428
Biggs, J., von Fumetti, S., and Kelly-Quinn, M. (2016). The importance of small waterbodies for biodiversity and ecosystem services: implications for policy makers. Hydrobiologia. 793, 3–39. doi: 10.1007/s10750-016-3007-0
Bond, B. J., Jones, J. A., Moore, G., Phillips, N., Post, D., and McDonnell, J. J. (2002). The zone of vegetation influence on baseflow revealed by diel patterns of streamflow and vegetation water use in a headwater basin. Hydrol. Process. 16, 1671–1677. doi: 10.1002/hyp.5022
Bren, L. (1997). Effects of slope vegetation removal on the diurnal variations of a small mountain stream. Water Resour. Res. 22, 321–331. doi: 10.1029/96WR02648
Burt, T. P. (1979). Diurnal variations in stream discharge and throughflow during a period of low flow. J. Hydrol. 41, 291–301. doi: 10.1016/0022-1694(79)90067-2
Camporese, M., Paniconi, C., Putti, M., and Orlandini, S. (2010). Surface-subsurface flow modeling with path-based runoff routing, boundary condition-based coupling, and assimilation of multisource observation data. Water Resour. Res. 46, W02512. doi: 10.1029/2008WR007536
Chow, R., Scheidegger, R., Doppler, T., Dietzel, A., Fenicia, F., and Stamm, C. (2020). A review of long-term pesticide monitoring studies to assess surface water quality trends. Water Res. X. 9,100064, doi: 10.1016/j.wroa.2020.100064
Doppler, T., Dietzel, A., Wittmer, I., Grelot, J., Rinta, P., and Kunz, M. (2020). Mikroverunreinigungen im gewässermonitoring–Ausbau von NAWA TREND und erste resultate 2018. Aqua and GAS, 7/8, 1–10.
Doppler, T., Camenzuli, L., Hirzel, G., Krauss, M., Lück, A., and Stamm, C. (2012). Spatial variability of herbicide mobilisation and transport at catchment scale: insights from a field experiment. Hydrol. Earth Syst. Sci. 16, 1947–1967. doi: 10.5194/hess-16-1947-2012
EC (2013). Directive 2013/39/EU of the European Parliament and of the Council of 12 August 2013 amending Directives 2000/60/EC and 2008/105/EC as regards priority substances in the field of water policy Text with EEA relevance (OJ L 226 24.08.2013, p. 1, ELI: http://data.europa.eu/eli/dir/2013/39/oj
EFSA (2010a). Conclusion on the peer review of the pesticide risk assessment of the active substance azoxystrobin. EFSA J. 8, 1542. doi: 10.2903/j.EFSA.2010.1542
EFSA (2010b). Conclusion on the peer review of the pesticide risk assessment of the active substance napropamide. EFSAJ. 8, 1565. doi: 10.2903/j.efsa.2010.1565
EFSA (2012). Conclusion on the peer review of the pesticide risk assessment of the active substance fenpyrazamine. EFSAJ. 10, 2496. doi: 10.2903/j.efsa.2012.2496
EFSA. (2013). Conclusion on the peer review of the pesticide risk assessment of the active substance fluopyram. EFSA J. 11, 3052. doi: 10.2903/j.efsa.2013.3052
Englert, D., Bakanov, N., Zubrod, J. P., Schulz, R., and Bundschuh, M. (2017). Modeling remobilization of neonicotinoid residues from tree foliage in streams-A relevant exposure pathway in risk assessment? Environ. Sci. Technol. 51, 1785–1794. doi: 10.1021/acs.est.6b05213
Giuliano, S., Alletto, L., Deswarte, C., Perdrieux, F., Dayd,é, J., and Debaeke, P. (2021). Reducing herbicide use and leaching in agronomically performant maize-based cropping systems: an 8-year study. Sci. Total Environ. 788, 147695. doi: 10.1016/j.scitotenv.2021.147695
Halbach, K., Moder, M., Schrader, S., Liebmann, L., Schafer, R. B., Schneeweiss, A., et al. (2021). Small streams-large concentrations? Pesticide monitoring in small agricultural streams in Germany during dry weather and rainfall. Water Res. 203, 117535. doi: 10.1016/j.watres.2021.117535
Harmon, R., Barnard, H. R., and Singha, K. (2020). Water table depth and bedrock permeability control magnitude and timing of transpiration-induced diel fluctuations in groundwater. Water Resour. Res. 56, 22. doi: 10.1029/2019WR025967
Kirchner, J. W., Godsey, S. E., Solomon, M., Osterhuber, R., McConnell, J. R., and Penna, D. (2020). The pulse of a montane ecosystem: coupling between daily cycles in solar flux, snowmelt, transpiration, groundwater, and streamflow at Sagehen Creek and Independence Creek, Sierra Nevada, USA. Hydrol. Earth Syst. Sci. 24, 5095–5123. doi: 10.5194/hess-24-5095-2020
Koch, U., and Prasuhn, V. (2021). Risikokarten für den Eintrag von Pflanzenschutzmitteln in Oberflächengewässer auf Einzugsgebietsebene. Agroscope Science. 126, 85. doi: 10.34776/as126g
Kreuger, J. (1998). Pesticides in stream water within an agricultural catchmentin southern Sweden, 1990-1996. Sci. Total Environ. 216, 227–251. doi: 10.1016/S0048-9697(98)00155-7
la Cecilia, D., and Camporese, M. (2022). Resolving streamflow diel fluctuations in a small agricultural catchment with an integrated surface-subsurface hydrological model. Hydrol. Process. 36, e14768. doi: 10.1002/hyp.14768
la Cecilia, D., Dax, A., Ehmann, H., Koster, M., Singer, H., and Stamm, C. (2021). Continuous high-frequency pesticide monitoring to observe the unexpected and the overlooked. Water Res. X. 13, 100125. doi: 10.1016/j.wroa.2021.100125
la Cecilia, D., Porta, G. M., Tang, F. H. M., Riva, M., and Maggi, F. (2020). Probabilistic indicators for soil and groundwater contamination risk assessment. Ecol. Indic. 115, 106424. doi: 10.1016/j.ecolind.2020.106424
Le Cor, F., Slaby, S., Dufour, V., Iuretig, A., Feidt, C., Dauchy, X., et al. (2021). Occurrence of pesticides and their transformation products in headwater streams: contamination status and effect of ponds on contaminant concentrations. Sci. Total Environ. 788, 147715. doi: 10.1016/j.scitotenv.2021.147715
Lefrancq, M., Jadas-Hecart, A., La Jeunesse, I., Landry, D., and Payraudeau, S. (2017). High frequency monitoring of pesticides in runoff water to improve understanding of their transport and environmental impacts. Sci. Total Environ. 587–588, 75–86. doi: 10.1016/j.scitotenv.2017.02.022
Leu, C., Singer, H., Stamm, C., Müller, S. R., and Schwarzenbach, R. P. (2004). Variability of herbicide losses from fields to surface water within a small catchment after a controlled herbicide application. Environ. Sci. Technol. 38, 3835–3841. doi: 10.1021/es0499593
Lewis, K. A., Tzilivakis, J., Warner, D., and Green, A. (2016). An international database for pesticide risk assessments and management. Human and Ecological Risk Assessment: An Iqnternational Journal. 22, 1050–1064. doi: 10.1080/10807039.2015.1133242
Maggi, F., la Cecilia, D., Tang, F. H. M., and McBratney, A. (2020). The global environmental hazard of glyphosate use. Sci. Total Environ. 717, 137167. doi: 10.1016/j.scitotenv.2020.137167
Materu, S. F., Heise, S., and Urban, B. (2021). Seasonal and spatial detection of pesticide residues under various weather conditions of agricultural areas of the kilombero valley ramsar site, Tanzania. Front. Environ. Sci. 9, 16. doi: 10.3389/fenvs.2021.599814
Messing, P., Farenhorst, A., Waite, D., and Sproull, J. (2013). Influence of usage and chemical-physical properties on the atmospheric transport and deposition of pesticides to agricultural regions of Manitoba, Canada. Chemosphere. 90, 1997–2003. doi: 10.1016/j.chemosphere.2012.10.071
Möhring, N., Ingold, K., Kudsk, P., Martin-Laurent, F., Niggli, U., Siegrist, M., et al. (2020). Pathways for advancing pesticide policies. Nature Food. 1, 535–540. doi: 10.1038/s43016-020-00141-4
Moschet, C., Vermeirssen, E. L., Singer, H., Stamm, C., and Hollender, J. (2015). Evaluation of in-situ calibration of chemcatcher passive samplers for 322 micropollutants in agricultural and urban affected rivers. Water Res. 71, 306–317. doi: 10.1016/j.watres.2014.12.043
Neumann, M., Schulz, R., Schäfer, K., Müller, W., Mannheller, W., and Liess, M. (2002). The significance of entry routes as point and non-point sources of pesticides in small streams. Water Res. 36, 835–842. doi: 10.1016/S0043-1354(01)00310-4
Nimick, D. A., Gammons, C. H., Cleasby, T. E., Madison, J. P., Skaar, D., and Brick, C. M. (2003). Diel cycles in dissolved metal concentrations in streams: occurrence and possible causes. Water Resour. Res. 39, 17. doi: 10.1029/2002WR001571
Nimick, D. A., Gammons, C. H., and Parker, S. R. (2011). Diel biogeochemical processes and their effect on the aqueous chemistry of streams: a review. Chem. Geol. 283, 3–17. doi: 10.1016/j.chemgeo.2010.08.017
Pinasseau, L., Wiest, L., Volatier, L., Mermillod-Blondin, F., and Vulliet, E. (2020). Emerging polar pollutants in groundwater: Potential impact of urban stormwater infiltration practices. Environ. Pollut. 266, 115387. doi: 10.1016/j.envpol.2020.115387
Popp, J., Pet,o, K., and Nagy, J. (2012). Pesticide productivity and food security. A review. Agron. Sustain. Dev. 33, 243–255. doi: 10.1007/s13593-012-0105-x
Rasmussen, J. J., Wiberg-Larsen, P., Baattrup-Pedersen, A., Cedergreen, N., McKnight, U. S., Kreuger, J., et al. (2015). The legacy of pesticide pollution: An overlooked factor in current risk assessments of freshwater systems. Water Res. 84, 25–32. doi: 10.1016/j.watres.2015.07.021
Reichenberger, S., Bach, M., Skitschak, A., and Frede, H. G. (2007). Mitigation strategies to reduce pesticide inputs into ground- and surface water and their effectiveness; a review. Sci. Total Environ. 384, 1–35. doi: 10.1016/j.scitotenv.2007.04.046
Salo, T., Stamm, C., Burdon, F. J., Räsänen, K., and Seppäl,ä, O. (2017). Resilience to heat waves in the aquatic snail Lymnaea stagnalis: additive and interactive effects with micropollutants. Freshw. Biol. doi: 10.1111/fwb.12999
Sanford, M., and Prosser, R. S. (2020). High-frequency sampling of small streams in the agroecosystems of Southwestern Ontario, Canada, to characterize pesticide exposure and associated risk to aquatic life. Environ. Toxicol. Chem. 39, 2570–2587. doi: 10.1002/etc.4884
Schönenberger, U., Beck, B., Dax, A., Vogler, B., and Stamm, C. (2022). Pesticide concentrations in agricultural storm drainage inlets of a small Swiss catchment. Environ. Sci. Pollut. Res. 29, 43966–43983. doi: 10.1007/s11356-022-18933-5
Schönenberger, U., and Stamm, C. (2021). Hydraulic shortcuts increase the connectivity of arable land areas to surface waters. Hydrol. Earth Syst. Sci. 25, 1727–1746. doi: 10.5194/hess-25-1727-2021
Schulz, R. (2001). Comparison of spray drift- and runoff-related input of azinphos-methyl and endosulfan from fruit orchards into the Lourens Rivers, South Africa. Chemosphere. 45, 543–551. doi: 10.1016/S0045-6535(00)00601-9
Schulz, R. (2004). Field studies on exposure, effects, and risk mitigation of aquatic nonpoint-source insecticide pollution: a review. J. Environ. Qual. 33, 419–448. doi: 10.2134/jeq2004.4190
Silva, V., Montanarella, L., Jones, A., Fernandez-Ugalde, O., Mol, H. G. J., Ritsema, C. J., et al. (2018). Distribution of glyphosate and aminomethylphosphonic acid (AMPA) in agricultural topsoils of the European Union. Sci. Total Environ. 621, 1352–1359. doi: 10.1016/j.scitotenv.2017.10.093
Sjerps, R. M. A., Kooij, P. J. F., van Loon, A., and Van Wezel, A. P. (2019). Occurrence of pesticides in Dutch drinking water sources. Chemosphere. 235, 510–518. doi: 10.1016/j.chemosphere.2019.06.207
Spycher, S., Mangold, S., Doppler, T., Junghans, M., Wittmer, I., Stamm, C., et al. (2018). Pesticide risks in small streams-how to get as close as possible to the stress imposed on aquatic organisms. Environ. Sci. Technol. 52, 4526–4535. doi: 10.1021/acs.est.8b00077
Stehle, S., and Schulz, R. (2015). Agricultural insecticides threaten surface waters at the global scale. Proc. Natl. Acad. Sci. USA. 112, 5750–5755. doi: 10.1073/pnas.1500232112
Stravs, M. A., Stamm, C., Ort, C., and Singer, H. (2021). Transportable automated HRMS platform “MS2field” enables insights into water-quality dynamics in real time. Environ. Sci. Technol. Lett. 8, 373–380. doi: 10.1021/acs.estlett.1c00066
Szeles, B., Broer, M., Parajka, J., Hogan, P., Eder, A., Strauss, P., et al. (2018). Separation of scales in transpiration effects on low flows: a spatial analysis in the hydrological open air laboratory. Water Resour. Res. 54, 6168–6188. doi: 10.1029/2017WR022037
Szocs, E., Brinke, M., Karaoglan, B., and Schafer, R. B. (2017). Large scale risks from agricultural pesticides in small streams. Environ. Sci. Technol. 51, 7378–7385. doi: 10.1021/acs.est.7b00933
Thomas, I. A., Mellander, P. E., Murphy, P. N. C., Fenton, O., Shine, O., Djodjic, F., et al. (2016). A sub-field scale critical source area index for legacy phosphorus management using high resolution data. Agric. Ecosyst. Environ. 233, 238–252. doi: 10.1016/j.agee.2016.09.012
Warner, W., Zeman-Kuhnert, S., Heim, C., Nachtigall, S., and Licha, T. (2021). Seasonal and spatial dynamics of selected pesticides and nutrients in a small lake catchment - Implications for agile monitoring strategies. Chemosphere. 281, 130736. doi: 10.1016/j.chemosphere.2021.130736
Welch, E. M., Dulai, H., El-Kadi, A., and Shuler, C. K. (2019). Submarine groundwater discharge and stream baseflow sustain pesticide and nutrient fluxes in faga'alu bay, American samoa. Front. Environ. Sci. 7, 17. doi: 10.3389/fenvs.2019.00162
Keywords: pesticides, water quality, legacy contaminants, high-frequency monitoring, high resolution mass spectrometry, catchment, dry period, diel fluctuations
Citation: la Cecilia D, Dax A, Ehmann H, Koster M, Singer H and Stamm C (2023) Continuous high-frequency pesticide monitoring in a small tile-drained agricultural stream to reveal diel concentration fluctuations in dry periods. Front. Water 4:1062198. doi: 10.3389/frwa.2022.1062198
Received: 05 October 2022; Accepted: 02 December 2022;
Published: 04 January 2023.
Edited by:
Shai Arnon, Ben-Gurion University of the Negev, IsraelReviewed by:
Marianne Stenrød, Norwegian Institute of Bioeconomy Research (NIBIO), NorwayJörg Lewandowski, Leibniz-Institute of Freshwater Ecology and Inland Fisheries (IGB), Germany
Copyright © 2023 la Cecilia, Dax, Ehmann, Koster, Singer and Stamm. This is an open-access article distributed under the terms of the Creative Commons Attribution License (CC BY). The use, distribution or reproduction in other forums is permitted, provided the original author(s) and the copyright owner(s) are credited and that the original publication in this journal is cited, in accordance with accepted academic practice. No use, distribution or reproduction is permitted which does not comply with these terms.
*Correspondence: Daniele la Cecilia,  ZGFuaWVsZS5sYWNlY2lsaWFAZWF3YWcuY2g=
†Present address: Daniele la Cecilia, Eawag: Swiss Federal Institute of Aquatic Science and Technology, Water Resources and Drinking Water, Dübendorf, Switzerland