 Alhossin A. Alsadi
 John C. Matthews
- Trenchless Technology Center at Louisiana Tech University, Ruston, LA, United States
With increasing attention to global warming and greenhouse gas (GHG) emissions and providing a better environment for coming generations, there is a critical need to quantify and decrease the environmental impact. Underground construction projects are one of the biggest constructions in North America; consequently, it is one of the GHG emissions' primary sources. This research focused on optimizing the carbon dioxide (CO2) emissions for a 91 cm (36 in) diameter sewer pressure pipe with 3 m (10 ft) depth and 30 m (100 ft) length, operating at 690 kPa (100 psi) during the commonly used pipeline materials' life cycle: Cured-in-Place Pipe (CIPP), Pre-stressed Concrete Cylinder Pipe (PCCP), High-density polyethylene (HDPE) pipe, and Polyvinyl Chloride (PVC) pipe. The life operations for this study were considered 100-years. The four phases of a pipeline life cycle included in this study are fabrication, installation, operation, and disposal phases. Life cycle assessment (LCA) is a methodology to evaluate the environmental impacts of products or service systems throughout the complete life cycle from the cradle to the grave. The study results show that the CO2 emissions have been reduced by 16% on the PCCP pipe, 4% on PVC pipe, 1% on HDEP pipe, and by 3.2% and 2.0% on CIPP lining (50 years and 100 years life expectancy, respectively). It is recommended that field studies be conducted in future research to obtain the necessary data to overcome the dependence on assumptions made in this study. Also, I recommended including the direct and social costs, which will make the decision easier for engineers and decision-makers to choose the right choice.
Introduction and Background
The sewer pipeline system is the basic urban infrastructure for public sanitation. The United States (US) has 1.93 million kilometers (1.2 million miles) of water supply mains, and there are nearly an equal number of sewer pipes, 26 kilometers of sewer pipe for every kilometer of interstate highway (Bartlett et al., 2017). More than one million pipes in the U.S. need to be replaced (American Water Works Association, 2014a). Now, as a system across the country requires critical repairs and upgrades, no one can argue the importance of water and sewer services in maintaining public health, protecting the environment, and promoting economic development (Alsadi et al., 2020b). Urban water and wastewater system are fundamental infrastructures in the development of new residential and commercial area, and as well are very important for high quality of life and strong urban economy. New pipelines are typically installed using open-cut technology or trenchless technology (i.e., pipe jacking, horizontal drilling, horizontal auger boring, etc.) or rehabilitated with trenchless methods such as cured-in-place pipe (CIPP), slip-lining, or pipe bursting. Force mains are pipelines that carry wastewater under pressure from the discharge side of a pump to a discharge point. Force mains are built from various materials and come in a wide range of diameters. The factors that impact the choice of the pipe material are operating pressure and pipe properties such as strength and corrosion resistance. Pipe size and wall thickness are determined by wastewater flow, operation, pressure, and trench conditions. The use of a pressure pipe can significantly reduce the size and depth of the sewer lines compared to gravity sewer lines and reduce the overall costs of sewer system construction [Environmental Protection Agency (EPA), 2000]. As the world moves toward providing a better and cleaner environment for future generations, there is significant need to quantify and reduce the carbon emissions footprint of industries. The construction industry, which emits a large amount of CO2, is one of targeted industries to decrease these emissions. The construction sector accounts for nearly 40% of global GHG emissions, and the construction phase is typically assumed to account around a 1/10 of the overall emissions (Säynäjoki et al., 2012). Which researchers point to evaluate proper alternative construction methods and materials to reduce emission. Climatologists believe that increasing atmospheric concentration of CO2, and other greenhouse gas (GHG) released by human activities are warming the earth. The human activities have changed the chemical composition of the atmosphere through the buildup of greenhouse gases primarily. These gases in the atmosphere act like the glass of a greenhouse, allowing the sunlight in and blocking heat from escaping (Latake et al., 2015). The common three GHG are CO2, methane (CO4), and nitrous oxide (N2O). CO2 is the GHG responsible for the greatest amount of warming. CO2 accounted for 82% of all human GHG emissions in the US in 2013 (Rudolph and Harrison, 2016).
According to the synthesis report published by Intergovernmental Panel on Climate Change (IPCC) in 2014, there is no doubt that humanity has affected the climate system, and recent contrived greenhouse gas (GHG) emissions have reached the top in history. As a result, the world average surface temperature was increased by 0.85°C from 1880 to 2012. Over the past 1,400 years, these 30 years have been demonstrated as the warmest period (Pachauri et al., 2014).
The US is already experiencing the impacts of climate change, and these impacts will be much worse without acting sharply to reduce our global warming emissions (Karl et al., 2009). The average US. temperature has already increased by 2°F over the last 50 years. It is expected to increase another 7–11°F under high emissions scenario by the end of this century, or 4–6.5 ÂřF under a low emissions scenario. Most of the US coast has seen rising sea levels over the past 50 years, and that rising will likely continue under a warming climate. These changes will have serious economic consequences for coastal communities (Karl et al., 2009). The carbon footprint has become a tremendously popular and widely used term over the last few years. With climate change, carbon footprint calculations are in strong demand. The carbon footprint is a measure of the exclusive total amount of CO2 emissions directly and indirectly caused by an activity or is accumulated over the life stage of a product. All direct CO2 emissions (on-site, internal) and indirect CO2 emissions (off-site, external, embodied) need to be considered (Wiedmann and Minx, 2008).
In the past, the open-cut pipeline installation method, involving the buries pipe excavation, was the only solution for replacing and renewing the pipeline. This procedure requires excavation to be performed very efficiently and accurately due to the existence of other utilities, including water pipes, cables, electrical power, gas pipes, and other obstacles adjacent to the wastewater pipe, which make the work time-consuming and difficult. This method, however, adversely impacts the day-to-day life and activities of people and businesses around the pipeline renewal project. These adverse impacts include breaking the road pavement, road closures, traffic delays, loss of access to businesses and homes, and unwanted noise and air pollution. The resulting traffic delays can cause air pollution and other environmental impacts (Kaushal et al., 2020).
Since the 1980s, various trenchless methods have been available that significantly reduce or eliminate the adverse problem. These methods involve replacing or installing a new pipe or renewing an existing failed pipe with minimal excavation and little or no surface and subsurface disruption. The North American Society for Trenchless Technology (NASTT) defines trenchless technology methods as a family of methods, materials, and equipment capable of installing new lines, replacing old pipes, or rehabilitating existing underground infrastructure with minimal disruption surface, business, and other activities. Trenchless technology methods have many advantages, such as:
• Minimal disruption to existing residential, business areas, and environment.
• Lower risk of interfering with existing pipeline and utilities.
• Safer working areas for both workers and the community because of less requirement of the openly exposed installation.
These methods help minimize social and environmental impacts, extend the pipe's service life, decrease operation and maintenance costs, increase productivity and workers' safety, and reduce overall costs (Monfared, 2018; Kaushal et al., 2020). According to the construction objectives, trenchless technology can be divided into trenchless installation and renewal technologies, while renewal technology can be subdivided into repair technology and replacement technology. Installation technologies include pipe ramming, pipe jacking, horizontal auger boring, horizontal directional drilling, and micro-tunneling. Repair techniques include slip lining, cured-in-place pipe, deformed, and reformed. The only replacement technology is pipe bursting (Lu et al., 2020).
Objectives of the Study
This research aims to look at the reduction of CO2 emissions through the life cycle of the pipeline. This study makes recommendations for saving energy consumption and make improvement in each phase to reduce the carbon emissions during the life cycle phases of the pipeline. These recommendations will help decision-makers and engineers in the future to choose (1) the more environmental materials to produce the pipe with least environmental impact; (2) the lowest environmental installation method for the environment; (3) and how to emit less carbon dioxide during the operation and disposal phases.
Methodology
Life cycle assessment (LCA) is a methodology to evaluate the environmental impacts of products or service systems throughout the complete life cycle from the cradle to the grave, including the extraction of raw materials, transport, production, and packaging of the product, as well as the reuse and disposal or recycling of waste. The LCA consists of four interrelated stages: goal and scope definition, inventory analysis, impact assessment, and interpretation of results (He et al., 2021). Life cycle costing (LCC) considers the sum of all expenses associated with the entire life cycle product. Worldwide studies using LCA or LCC to conduct green or gray infrastructure's environmental and economic assessment are widely conducted (Xu et al., 2021). The carbon footprint in pipeline construction is a specific amount of carbon dioxide emissions directly or indirectly generated during the life cycle of the pipeline (fabrication, installation, operation, disposal).
The life cycle can be classified into four phases: fabrication, installation, operation, and disposal as shown in Figure 1. This research focuses on four commonly used pipe and liners: PCCP, PVC, CIPP, and HDPE.

Figure 1. Life-cycle energy analysis and life stages.
Fabrication Phase
The fabrication phase includes all the energy consumption until the factory gate (material extraction, material production, and pipe fabrication), which is named the embodied energy. The embodied energy is the total of all the energy required to produce any goods or services. The concept can help determine the effectiveness of energy generating or energy-saving devices to decide whether a product contributes or mitigates global warming (Alsadi et al., 2020b).
The PCCP pipe fundamentally contains steel and concrete. At the fabrication phase of the PCCP pipe, the most CO2 emissions come from the steel. The CO2 emission from the steel is ~85% of the total PCCP pipe emissions (Alsadi et al., 2020b). The embodied energy for recycled steel is steel cylinder is 1.53 kWh/kg (0.69 kWh/lb), and Pre-stressing wire is 2.72 kWh/kg (1.24 kWh/lb) (Hommond and Jones, 2011). Utilizing recycled steel will save a considerable amount of energy. By following Table 1 and use the recycling embodied energy for recycled steel instead of virgin steel: the total CO2 emissions for the fabrication phase of the PCCP pipe are 4,881 kg (10,762 lb). In comparison, the CO2 emissions by using the virgin steel are 12,737 kg (28,080 lb), indicating 38% less CO2 emissions by using the recycled steel for producing the PCCP pipe.
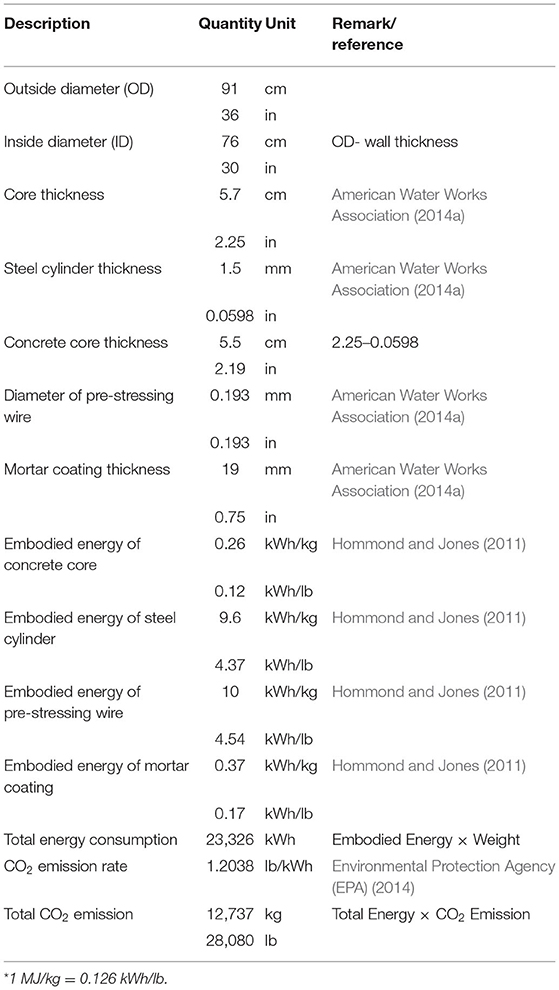
Table 1. Carbon emission for PCCP pipe.
It is estimated that 5–6% of all CO2 emissions generated by human activities originate from cement production (Lloyd and Rangan, 2009). Cement production needs high-temperature calcination, which is an energy-intensive process. Global cement production is expected to increase from 3.27 billion metric tons in 2010 to 4.83 billion metric tons in 2030 (Nath et al., 2018). It has been found the service life of concrete increased by 1.6 to 1.75 times more than traditional concrete by replacing 40% of the cement with fly ash (a small waste collected from the emissions liberated by coal-burning power stations). Around 36 to 43% of the CO2 emissions can be avoided for different concrete covers by substituting 40% of cement with fly ash (Nath et al., 2018). Geopolymer cement is manufactured differently compared to Portland cement. The Geopolymer cement does not need high-temperature ovens; neither do they need such large capital investment in production plants and equipment (Turner and Collins, 2013). The decrease of GHG emissions by using the geopolymer cement instead of ordinary Portland cement is 70 to 90% (Davidovits, 2015). Figure 2 presents the difference in CO2 emissions during the fabrication of the PCCP pipe when geopolymer concrete, Portland cement, and fly ash are used. The result discovered that 13% less CO2 emissions are made during the fabrication phase of the PCCP pipe by using the Geopolymer cement rather than Portland cement.
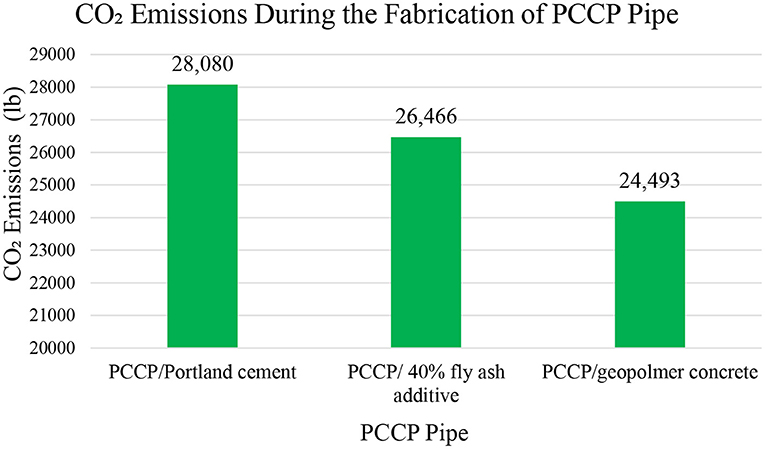
Figure 2. Comparing the carbon emissions by using geopolymer concrete, flay ash additive and portland cement during the fabrication phase of PCCP pipe.
For PVC and HDPE pipes, there is a significant saving in energy consumption during the fabrication phase by producing pipes from recycled material. Table 2 shows the CO2 emissions during the fabrication phase for PVC and HDPE pipe using virgin materials. The embodied energy for virgin materials for PVC and HDPE is 67.5 MJ/Kg and 84.4 MJ/Kg, while the embodied energy for recycled materials for PVC and HDPE pipe is 40 and 45 MJ/Kg (ImpEE Project., 2005; Hommond and Jones, 2011).
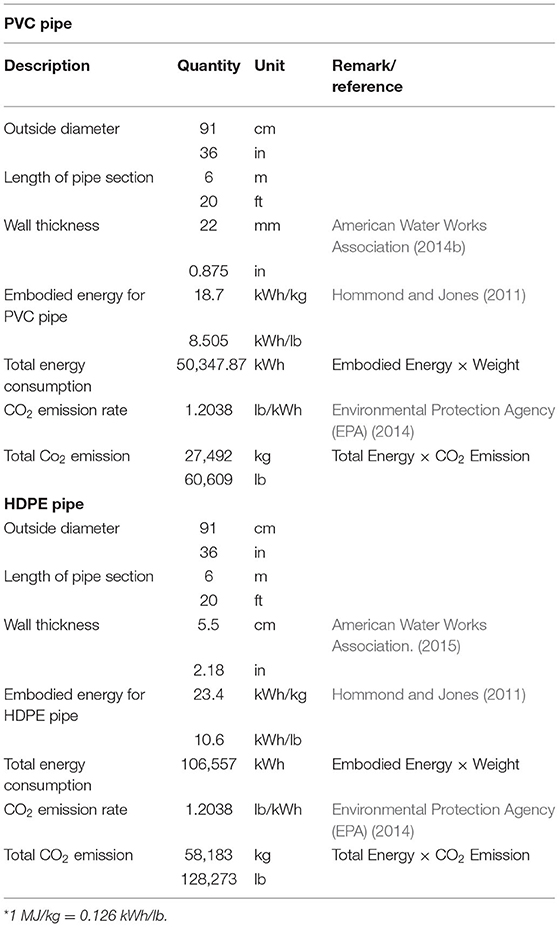
Table 2. Carbon emission of PVC and HDPE pipe.
Figure 3 shows the difference between manufacturing PVC and HDPE pipes from virgin materials vs. recycled materials. The results show the CO2 emissions have been reduced by 41% on PVC pipe and 43% on HDPE using recycled materials instead of virgin materials during the fabrication stage.
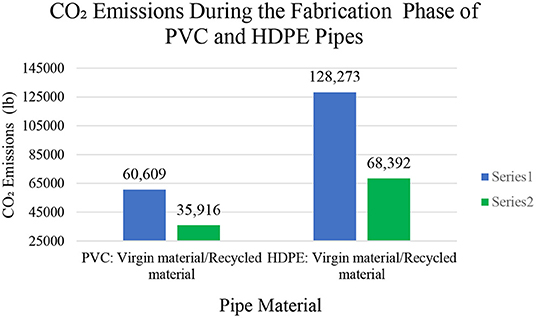
Figure 3. Comparing the carbon emissions between virgin VS. Recycled materials for PVC and HDPE pipes.
The CIPP pipe had the highest CO2 emission compared to other pipe materials during the fabrication phase; the epoxy resin is the main factor that increased the energy (Alsadi et al., 2020a). Choosing other resins can reduce carbon emissions and save more energy. The main types of resin used in CIPP applications are a vinyl ester, polyester, and epoxy (Matthews et al., 2014). Polyester resins most typically are qualified and specified for gravity and storm sewer pipe rehabilitation (National Liner Specifications, 2019). This study focuses on the pressure sewer line; therefore, it was recommended to use the epoxy or vinyl ester resin in the sewer pressure line application because the polyester resin cannot be used for pressure pipelines. The CO2 emission during the fabrication phase of the CIPP liner of 36 in diameter with 30 m (100 ft) length is 45,174 kg (99,591 lb), as shown in Table 3 (Alsadi et al., 2020b).
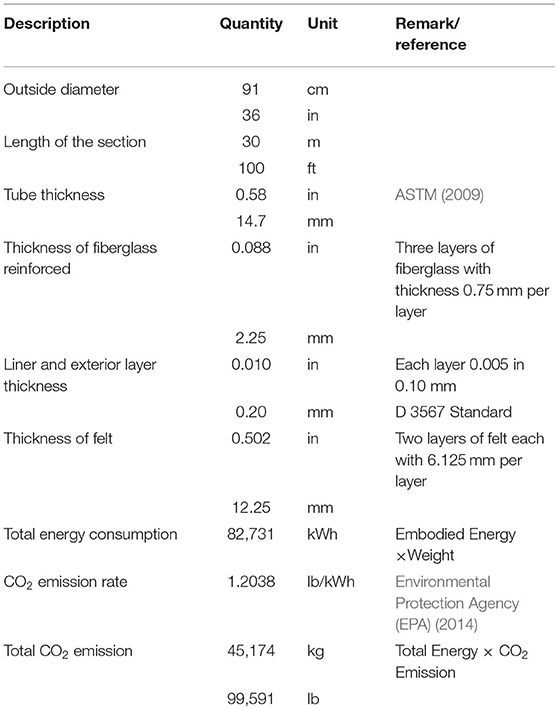
Table 3. Carbon emission of CIPP Pipe.
Based on Alsadi's study 2020, the weight of the resin in the CIPP pipe is almost two-thirds of the total weight of the CIPP lining, which means a small energy saving in producing the resin will help save energy in the fabrication phase of CIPP (Alsadi et al., 2020b). Resin choices are determined by the owner and contractor to achieve the final product properties desired. Epoxy resin and Vinyl ester resin's embodied energy is 137 and 119.3 MJ/kg, respectively (ICE version 2.0; EuCIA 2016). In this study, vinyl ester resin is used instead of epoxy resin, the total CO2 emissions for the fabrication phase for the CIPP lining using the polyester resin for a 30 m (100 ft) section with a 91 cm (36 in) diameter is 40,665 kg (89,650 lb), while it is 45,174 kg (99,591 lb) when using epoxy resin. The results found that the CO2 emission has been reduced by 10% by using the vinyl ester resin instead of the epoxy resin on the fabrication phase.
The conclusion of the optimizing CO2 emissions through the fabrication stage and compared the four pipe materials together (PCCP, PVC, HDPE, and CIPP) before and after the optimization. The results found that the savings in carbon emissions after the optimizing are 75% in PCCP pipe, 41% in PVC pipe, 47% in HDPE pipe, and 10% in CIPP pipe, as shown in Figure 4.
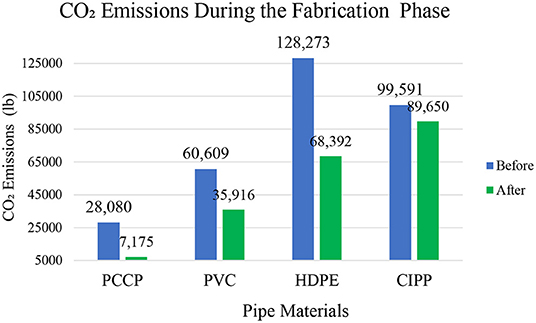
Figure 4. Shown the difference in carbon emissions through the fabrication phase of pipe materials before and after the optimizing.
Installation Phase
The installation stage's major construction activities are transporting pipes and equipment to a job site, excavation, loading, backfilling, compaction, and repaving. For this study, the pipeline installation analysis and consideration of CO2 emissions have been made for three different installation methods: open cut with PCCP, pipe bursting with PVC and HDPE, and CIPP lining. CO2 emissions in the installation phase vary from method to another depending on several factors such as the number of equipment, the time needed to finish the job, and the project's location.
The following considerations are used at this phase:
• The Emissions Calculation (e-calc) software is used to estimate and quantify the CO2 emissions.
• For the open-cut construction method, the length of the trench is 37 m (120 ft), the trench width is 3 m (10 ft), and the trench depth is 3 m (10 ft).
• For the pipe bursting construction method, the size of the two pits is 3.6 m (12 ft) long, 3 m (10 ft) wide, and 3 m (10 ft) deep.
• For CIPP, the size of the two pits is 2.4 m (8 ft) long, 2.4 m (8 ft) wide, and 3 m (10 ft) deep.
• The dump truck's capacity to haul the spoil is 11.5 cubic meters (15 cubic yards).
• The swell factor in this study is assumed to be 40% for moving spoil.
The installation phase is divided into three categories: transport pipe and equipment to jobsite, pipeline installation, and backfill and repaving. Alsadi did a study to compared and evaluated the CO2 emissions during the life cycle of different pipeline installation method (open cut, pipe bursting and CIPP) for a 30 m (100 ft) section with 91 cm (36 in) pipe diameter, and with 3 m (10 ft) depth, the result of the study found that; open cut installation method has the higher CO2 emissions compared to pipe bursting and CIPP installation method (Alsadi and Matthews, 2020). In this phase, most of the energy consumption comes from the production and transport of backfill materials, based on Alsadi's study; 75% of carbon emissions in the open cut construction method comes from the production and transportation of backfill materials, and the pipe bursting and the CIPP methods are 68 and 61%, respectively. The CO2 emissions from the backfill materials for the 30 m (100 ft) section with 3 m (10 ft) depth are: open cut method is 33,173 kg (73,134 lb), pipe bursting method is 5,578 kg (12,298 lb), and for CIPP lining is 2,972 kg (6,552 lb) (Alsadi and Matthews, 2020), as shown in Table 4. In case of using the same backfill materials, instead of new backfill, a significant saving on CO2 emissions can be made.
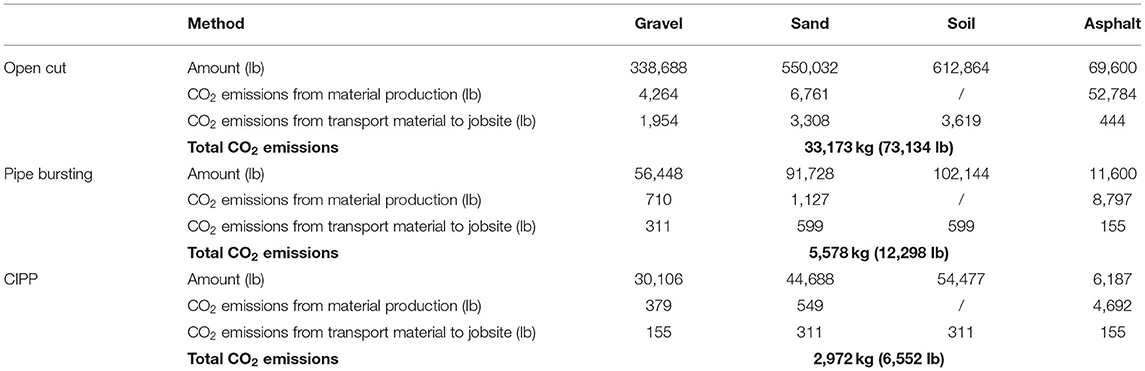
Table 4. CO2 Emissions from Backfill Materials.
The energy consumed in the trench repaving is depended on the trench's size, type of pavement (concrete/ asphalt), and the pavement's thickness. The trench repaving is a significant energy consumption activity. In this study, the depth of the trench in the three methods is 3 m (10 ft): the first 0.6 m (2 ft) is gravel as a foundation, 1.2 m (4 ft) of sand surrounds the pipe, and the last 1.2 m (4 ft) is soil. Thickness of the pavement is assumed to be 10 cm (4 in). Most of the project owners and decision-makers look only at the direct cost and go with the asphalt option because it is cheaper than concrete. Asphalt pavement is more inexpensive compared to concrete pavement, but the asphalt has higher carbon emissions (Alsadi and Matthews, 2020). The open-cut construction method needs a large trench to install the pipeline. That means that the open-cut method consumes more energy in repaving than other methods.
Asphalt has higher embodied energy 1.4 kWh/kg (0.63 kWh/lb.) compared to reinforced concrete 0.2 kWh/kg (0.0945 kWh/lb.) (ICE, 2011). In the open-cut method, in using the concrete pavement, the CO2 emissions are 3,096 kg (6,826 lb); however, when the asphalt pavement is used for repaving the surface, the CO2 emissions are 23,942 kg (52,784 lb). When the asphalt is used for repaving the surface in the pipe bursting method, the CO2 emissions are 3,990 kg (8,797 lb), whereas they are only 619 kg (1,365 lb) when using reinforced concrete. For the CIPP method, when the asphalt is used for repaving, CO2 emissions are 2,128 kg (4,692 lb), and when concrete is used, emissions are 330 kg (728 lb) (Alsadi and Matthews, 2020).
In the installation phase, large reductions in CO2 emissions are made by using the same backfill materials and concrete pavement instead of new backfill materials and asphalt pavement, as shown in Figure 5, especially for open-cut construction method because of the big trench required to install the pipeline.
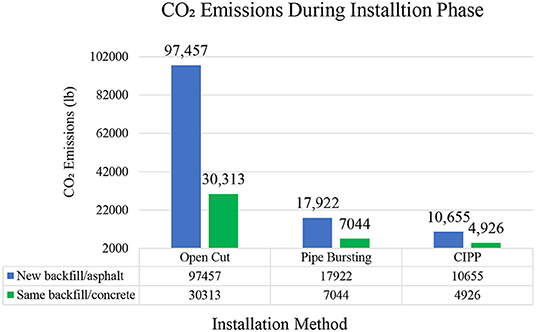
Figure 5. Comparing the carbon emissions between new backfill materials/asphalt pavement and same backfill materials/ concrete pavement during the installation phase.
The result of optimizing the CO2 emissions during the installation phase found that a significant reduction in CO2 emissions is made by using the same backfill materials and concrete pavement instead of new backfill materials and asphalt pavement, as shown in Figure 6. The reduction of the CO2 emissions are almost 70% in the open-cut method, 60% in the pipe bursting method and 44% in the cured-in-place method after same backfill materials and concrete pavement are used.

Figure 6. Different recycled percentage VS. Carbon emissions.
Operation Phase
The operation phase can be classified into three categories when accounting for the CO2 emissions: pumping energy, pipe cleaning, and pipe repair. For a pressure pipeline, wastewater needs to be pumped to a certain pressure and flow rate using pumps, which involve energy consumption and CO2 emissions. On the other hand, there is no need to pumping energy for a gravity pipeline; therefore, the energy consumption due to pumping for a gravity pipeline is zero over the pipe's life cycle. For pipeline cleaning, there are too many pipeline cleaning methods. In this study, the pig cleaning method is used. The pipeline requires repair and maintenance over the pipeline's life service. The pipe must be repaired or replaced within the estimated working life; this study considers the life expectancy for the pipeline is 100 years. Because the life expectancy for the CIPP liner is around 50 years, this study considers replacing the liner with a new one after 50 years of working life.
The most significant factors affecting the operation phase's energy consumption are the pump's size and the pipeline's roughness. The size of the pump depends on the pipe's diameter, flow volume, and roughness of the interior pipe face [Hazen-Williams's coefficient (C)] (Alsadi and Matthews, 2020). For the same outside pipe diameter with the same flow rate, a bigger inside diameter with a smaller wall thickness needs a smaller pump size. It is the opposite of a smaller inside pipe diameter with a thicker wall thickness. Therefore, in the same pipe diameter: a smaller wall thickness results in a smaller pump size, which will reduce the CO2 emissions during the operation phase. For a 91 cm (36 in) pipe diameter with a 30 m (100 ft) long section under 690 kPa (100 psi) pressure, PVC pipe emits the least carbon compared to HDPE, and that is due to the smaller wall thickness of the PVC pipe for the same diameters (Alsadi and Matthews, 2020).
PCCP pipe has the lowest C value compared to the PVC, HDPE, and CIPP pipe. Applying the epoxy coating on the interior face of the PCCP pipe can decrease the roughness and make it smoother from the inside. The industry recommended the minimum thickness of the coating is 3.3 mm (0.13 in) (Matthews et al., 2012).
The coating will reduce the pipeline's internal roughness, increase the C value, and reduce the CO2 emissions (Assard and Rosenberg, 2017). Table 5 presents the estimation of CO2 emissions of PCCP pipe through the operation phase after the epoxy coating is applied.
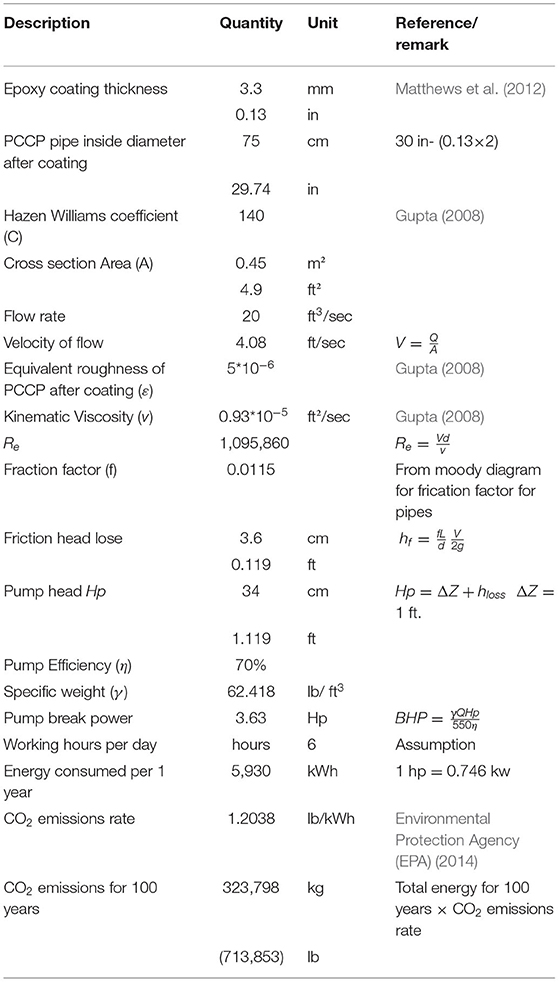
Table 5. Carbon emissions during the operation phase of PCCP pipe after the epoxy coating.
After the epoxy is applied, the PCCP interior surface is smoother. The pipeline with the epoxy coating is easier for cleaning than the pipeline with a rough interior surface, which means less water is needed for pipeline cleaning. Table 6 presents the CO2 emissions of PCCP pipe during the cleaning phase after the epoxy coating is applied through 100 years of operation. This study is considered a pipeline is cleaning once every 10 years of service (ten times during the 100 years of operation).
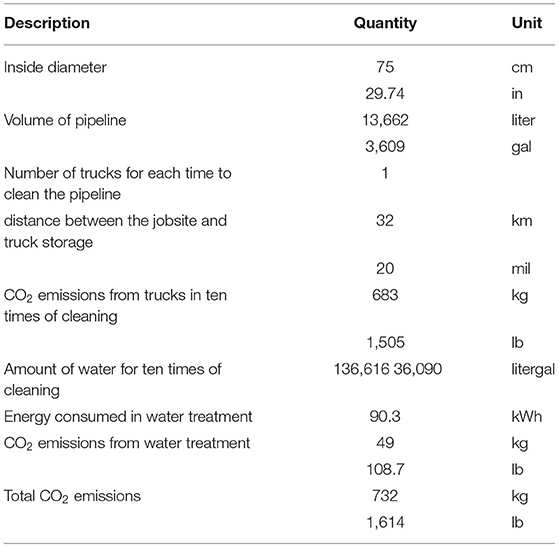
Table 6. Carbon emissions during the cleaning of PCCP pipe after the epoxy coating is used.
The PCCP pipe's operation phase is required to calculate the energy consumed during applying the coating and combine it with the total energy consumption for the PCCP pipe's operation phase. Suppose the total energy with the coating is less than the total energy without coating for the operation phase. In that case, the CO2 emissions can be mitigated by applying the epoxy coating. The CO2 emissions for applying the epoxy coating for a 30 m (100 ft) section are estimated to be 54 kg (120 lb) (Matthews et al., 2012). Table 7 presents the CO2 emissions of applying the epoxy coating.

Table 7. Total carbon emissions of the epoxy coating.
This study found that 25,459 kg (56,127 lb) of CO2 emissions can be saved by applying the epoxy coating for PCCP pipe during the 100 years of PCCP pipe operation for 30 m (100 ft) section 90 cm (36 in) diameter. This saving is around 7% of the total CO2 emissions. The CO2 emissions for the operation phase for PCCP without coating is 788,316 lb (Alsadi and Matthews, 2020) and with the coating is 732,189 lb.
In this study, the operation of life is assumed to be 100 years. The life expectancy for PCCP, PVC, and HDPE pipes are 100 years (Bueno, 2010). CIPP pipe has been in service for more than 40 years, and the life design for CIPP pipe is 50 years, but the actual is perhaps well beyond (Allouche et al., 2012). If we assume that CIPP pipes will last for 100 years, the CO2 emission during the life cycle of CIPP pipes with the epoxy resin used in the fabrication phase for 50 years and 100 years lifespans are 972,581 and 846,525 lb, respectively.
Disposal Phase
At the end of the service life of the pipeline, the pipeline is either recycled, abandoned, or disposed of. Energy is needed for both options: recycling or disposing of (Alsadi and Matthews, 2020). Recycling provides the opportunity to decrease energy consumption during the fabrication of new pipes using recyclable/ reusable materials instead of virgin materials. Although the disassembly, collection, sorting, and processing of materials into new products also require significant energy consumption, recycling is still considered environmental (Gao et al., 2001).
Environmental and recyclable materials are the key to reducing the high CO2 emissions during the pipeline's life cycle and improving the pipeline's materials' environmental impact. In the disposal phase, minimizing the CO2 emissions can be done by increasing the percentage of recycled materials and reducing the disposal materials at the end of the pipeline's service life.
In this study, 3.5% of the fabrication energy is used to dispose of the materials that cannot be recycled (ImpEE Project, 2005). The embodied energy for recycling materials of PCCP pipe are steel cylinder is 1.5 kW/kg (0.693 kWh/lb), concrete core is 5 kWh/kg (2.27 kWh/lb), mortar coating is 4.1 kWh/kg (1.89 kWh/lb), the pre-stressing wire is 2.7 kWh/kg (1.235 kWh/lb), and for PVC and HDPE as shown in Table 5 (Ashby, 2009; Hommond and Jones, 2011). Table 8 presents the energy consumed during the disposal phase for a 30 m (100 ft) section long with 91 cm (36 in) pipe diameter four different pipe materials: PCCP, PVC, HDPE, and CIPP.
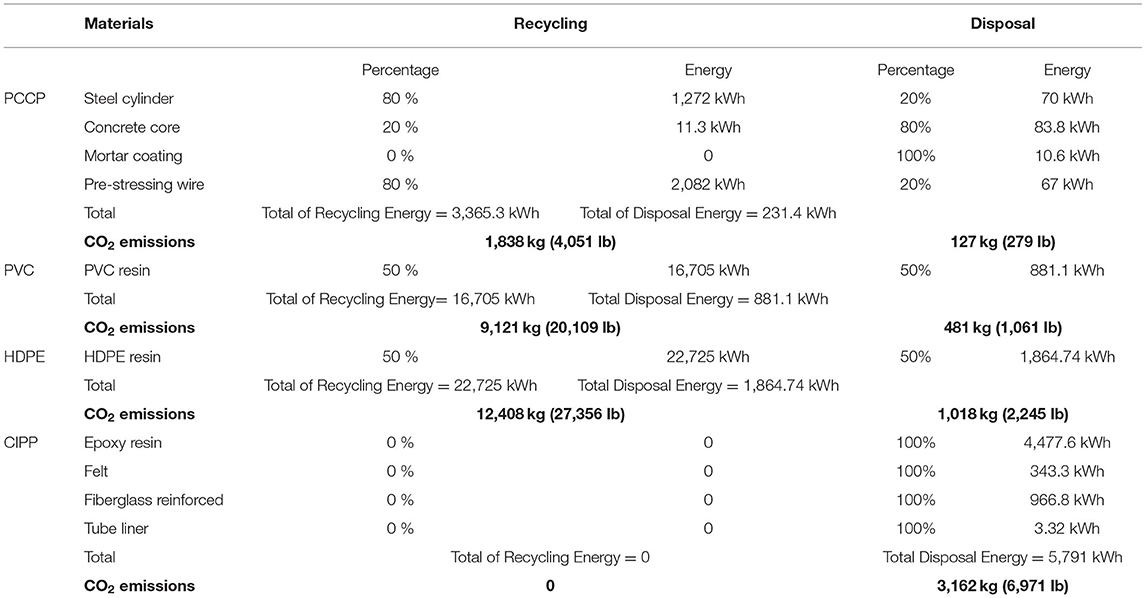
Table 8. Energy consumed for disposal phase.
Figure 6 presents an example of how the percentage of recycling materials changes the CO2 emissions during the disposal phase for a 30 m (100 ft) long with 91 cm (36 in) diameter. The example is showing the difference between the recycling percentage in PCCP. The example shows two cases, case one presented the low recycling percentage and the case 2 presented the high recycling percentage: increasing recycling percentage in steel cylinder and pre-stressing wire from 80% (case 1) to 90% (case 2) and concrete from 20% (case 1) to 50% (case 2), and for PVC and HDPE increasing the percentage of recycling from 50% (case 1) to 80% (case 2). The study found that CO2 emissions can be reduced by 43% in the PCCP pipe, and 60% for PVC and HDPE. CIPP cannot be recycled because of the epoxy resin, which is mean CIPP is made from 100% virgin materials.
Results and Discussions
This study gives guidance to decrease CO2 emissions and helps engineers and decision-makers to choose the most environmentally friendly pipe materials and installation methods. Table 9 summarizes the reduction in CO2 emissions in each phase of the pipeline's life cycle in the study.
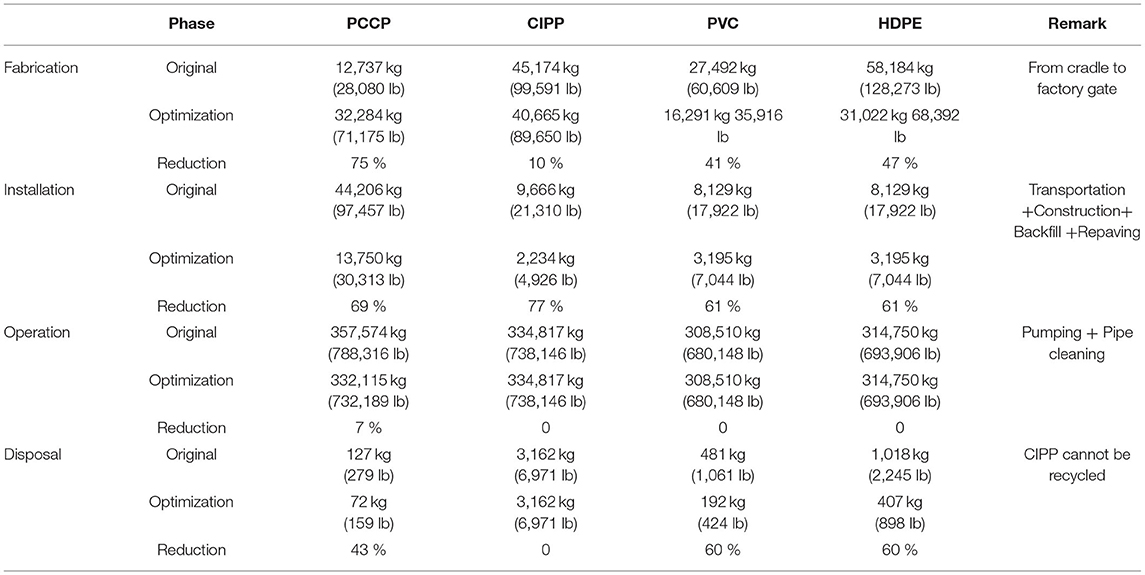
Table 9. Carbon emissions during the life cycle of pipeline before and after optimization.
Figure 7 shows and compares the pipe materials' life cycle before (the data source is Alsadi's study 2020) and after the optimization and shows a significant saving in CO2 emissions during the life-cycle phases are possible.
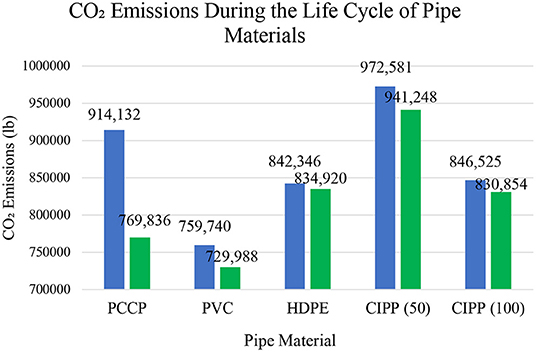
Figure 7. The difference between the carbon emissions during the life cycle of pipeline materials before and after optimization, CIPP: the first two columns are presenting a 50-years life expectancy, while the last two columns are presenting a 100-years life expectancy.
As shown in Figure 7, the PVC pipe is the most environmentally friendly pipe among all the other pipe materials evaluated due to the smaller wall thickness and the smoother interior surface. Smaller wall thickness will help save carbon emissions during the fabrication and operation phase; the smoother interior surface will also help save energy during the operation phase. PCCP pipe had less carbon emits to the environment during the life cycle compared to HDPE and CIPP because of the significant saving on the carbon emissions during the installation when the same backfill materials are used and coating the interior surface of the pipe will help to make the pipe smooth and reduce the C value, which will help to save consuming energy during the operation phase. HDPE pipe has the highest carbon emissions among the other pipe materials due to the wall thickness of the pipe. Thicker wall thickness increases the carbon emissions during fabrication and operation in the case of a pressure pipeline. In the case of 100 years' life expectancy, CIPP is the better option than HDPE regarding the environmental impact. And in the case of 50 years' life expectancy, the CIPP pipe has the highest carbon emits compared to other pipes.
Conclusion and Limitations
This study analyzed and focused on the optimizing of carbon emissions during the life cycle phases of the pipeline. This study presents recommendations to reduce the carbon emissions that will help decision-makers and engineers to choose (1) the more environmental materials to produce the pipe with lease environmental impact; (2) the lowest environmental installation method for the environment; (3) and how to emit less carbon dioxide during the operation and disposal phase.
The results of the study found that the CO2 has been reduced by 16% on the PCCP pipe, 4% on PVC pipe, 1% on HDEP pipe, and by 3.2% on CIPP lining (50 years life expectancy), and for the 100 years life expectancy is 2%. The study also found that the relationship between carbon emissions and the pipeline length is linear during a pipeline's life cycle except for the installation phase. In the installation phase's the CO2 emissions vary from one method to another depending on different factors such as the amount of equipment, the time needed to finish the job, and the project's location.
This study's limitations are: (1) The embodied energy database used in this study represents the UK average and may vary from location to location. (2) The waste materials in the fabrication phase are assumed to be negligible. (3) Due to the lack of data and information, this study did not include carbon emissions of repair and maintenance pipelines during the operation. The energy needed for maintenance and repair is assumed to be negligible in this study except for the energy used to reline the new CIPP pipe after 50 years of operation.
Recommendations for Future Research
For future research, it is recommended that field studies be conducted to obtain the necessary data to overcome the dependence on assumptions made in this study. In the fabrication phase, it is recommended to include the energy consumed in the waste materials in a future study. Moreover, for the operation phase, it is recommended to include the energy for maintenance and repair. For embodied energy, it is recommended in future studies to use the database present in the location where the study is done because the embodied energy varies from one location to another. Also, it is recommended to include the direct and social costs in a future study, which will help the engineers and decision-makers to make the right choice.
Data Availability Statement
The original contributions presented in the study are included in the article/supplementary materials, further inquiries can be directed to the corresponding author/s.
Author Contributions
AA wrote and analyzed the manuscript under the supervision of JM. All authors contributed to manuscript revision, read, and approved the submitted version.
Conflict of Interest
The authors declare that the research was conducted in the absence of any commercial or financial relationships that could be construed as a potential conflict of interest.
Publisher's Note
All claims expressed in this article are solely those of the authors and do not necessarily represent those of their affiliated organizations, or those of the publisher, the editors and the reviewers. Any product that may be evaluated in this article, or claim that may be made by its manufacturer, is not guaranteed or endorsed by the publisher.
Abbreviations
GHG, greenhouse gases; NASTT, North American Society for Trenchless Technology; CO2, carbon dioxide; CO4, methane; N2O, nitrous oxide; CIPP, Cured-in-Place Pipe; PCCP, Pre-stressed Concrete Cylinder Pipe; HDPE, High-density polyethylene; PVC, Polyvinyl Chloride; IPCC, Intergovernmental Panel on Climate Change; LCA, Life cycle assessment; LCC, Life cycle costing; AWWA, American Water Works Association; ASTM, American Society for Testing and Materials; ICE, Inventory of Carbon and Energy; e-calc, Emissions Calculation; EPA, Environmental Protection Agency.
References
Allouche, E., Alam, S., Simicevic, J., Sterling, R., Condit, W., Headington, B., et al. (2012). A Retrospective Evaluation of Cured-in-Place Pipe (CIPP) Used in Municipal Gravity Sewers. Environmental Protection Agency.
Alsadi, A., Matthews, J. C., and Abdulkareem, O. A. (2020a). “Optimize the carbon emissions of prestressed concrete cylinder pipe during the life cycle,” in Pipelines 2020 (Reston, VA: American Society of Civil Engineers), 326–335. doi: 10.1061/9780784483213.036
Alsadi, A., Matthews, J. C., and Matthews, E. (2020b). Environmental impact assessment of the fabrication of pipe rehabilitation materials. J. Pipeline Syst. Eng. Pract. 11, 05019004. doi: 10.1061/(ASCE)PS.1949-1204.0000395
Alsadi, A. A., and Matthews, J. C. (2020). Evaluation of carbon footprint of pipeline materials during installation, operation, and disposal phases. J. Pipeline Syst. Eng. Pract. 11, 04020005. doi: 10.1061/(ASCE)PS.1949-1204.0000422
American Water Works Association. (2014a). Design Prestressed Concrete Pressure Pipe, Steel Cylinder Type. ANSI/ AWWA C301−14. Denver, CO: American Water 113 Works Association.
American Water Works Association. (2014b). Standard for Design Polyvinyl Chloride (PVC) Pressure Pipe and Fabricated Fittings, 14In. Through 48 In. ANSI/AWWA C905−10. Denver, CO: American Water Works Association.
American Water Works Association. (2015). POLYETHYLENE (PE) PRESSURE PIPE AND FITTINGS, 4 IN. THROUGH 65 IN. (100 MM THROUGH 1,650 MM). ANSI/AWWA C906−15. Denver, CO: American Water Works Association.
Assard, L., and Rosenberg, D. (2017). “Epoxy Coating and Cement Mortar Lining,” Fort Worth, TX, UCT Conference.
ASTM. F. (2009). “Standard practice for rehabilitation of existing pipelines and conduits by the inversion and curing of a resin-impregnated tube,” in American Society for Testing and Materials (West Conshohockem, PA American National Standard).
Bartlett, S., Cisneros, H., Decker, P., Heartwell, G., Warnock, A., Nellenbach, M., et al. (2017). Executive Council on Infrastructure Water Task Force. Washington, DC: Bipartisan Policy Center.
Bueno, S. M. (2010). Choosing Your Pipe. Trenchless Technology Pipe Selection Guide. Trenchless Technology Magazine.
Davidovits, J. (2015). “False values on CO2 emission for geopolymer cement/concrete published in scientific papers,” in Technical Paper 24.
Environmental Protection Agency (EPA). (2000). Wastewater Technology Fact Sheet Pipe Construction and Materials. Washington, DC: Environmental Protection Agency.
Environmental Protection Agency (EPA). (2014). eGRID2014 US Grid Intensity. Washington, DC: Environmental Protection Agency.
Gao, W., Ariyama, T., Ojima, T., and Meier, A. (2001). Energy impacts of recycling disassembly material in residential buildings. Energy Buildings 33, 553–562. doi: 10.1016/S0378-7788(00)00096-7
Hammond, G., and Jones, C. (2011). Inventory of Carbon and Energy (ICE), Version 2.0. Sustainable Energy Research Team. Department of Mechanical Engineering, University of Bath, Bath, United Kingdom.
He, Y., Zhu, L., Fan, J., Li, L., and Liu, G. (2021). Life cycle assessment of CO2 emission reduction potential of carbon capture and utilization for liquid fuel and power cogeneration. Fuel Process. Technol. 221, 106924. doi: 10.1016/j.fuproc.2021.106924
Karl, T. R., Melillo, J. M., Peterson, T. C., and Hassol, S. J. (Eds.). (2009). Global Climate Change Impacts in the United States. Cambridge University Press.
Kaushal, V., Najafi, M., and Serajiantehrani, R. (2020). Environmental impacts of conventional open-cut pipeline installation and trenchless technology methods: state-of-the-art review. J. Pipeline Syst. Eng. Pract. 11, 03120001. doi: 10.1061/(ASCE)PS.1949-1204.0000459
Latake, P. T., Pawar, P., and Ranveer, A. C. (2015). The greenhouse effect and its impacts on environment. Int. J. Innov. Res. Creative Technol. 1, 333–337.
Lloyd, N., and Rangan, V. (2009). “Geopolymer concrete-sustainable cementless concrete,” in Proceedings of Tenth ACI International Conference (American Concrete Institute), 33–53.
Lu, H., Matthews, J., and Iseley, T. (2020). How does trenchless technology make pipeline construction greener? A comprehensive carbon footprint and energy consumption analysis. J. Clean. Prod. 261, 121215. doi: 10.1016/j.jclepro.2020.121215
Matthews, J., Condit, W., Wensink, R., Lewis, G., and Sterling, R. (2012). Performance Evaluation of Innovative Water Main Rehabilitation Spray-on Lining Product. Washington, DC: US Environmental Protection Agency, Office.
Matthews, J. C., Selvakumar, A., Sterling, R. L., and Condit, W. (2014). Innovative rehabilitation technology demonstration and evaluation program. Tunnell. Underground Space Technol. 39, 73–81. doi: 10.1016/j.tust.2012.02.003
Monfared, M. A. N. (2018). Comparison of Trenchless Technologies and Open Cut Methods in New Residential Land Development. University of Alberta.
Nath, P., Sarker, P. K., and Biswas, W. K. (2018). Effect of fly ash on the service life, carbon footprint and embodied energy of high strength concrete in the marine environment. Energy Buildings 158, 1694–1702. doi: 10.1016/j.enbuild.2017.12.011
National Liner Specifications. (2019). Available online at: https://www.nationalliner.com/Portals/0/PDF/national-liner-specifications.pdf.
Pachauri, R. K., Allen, M. R., Barros, V. R., Broome, J., Cramer, W., Christ, R., et al. (2014). “Climate change 2014: synthesis report,” in Contribution of Working Groups I, II and III to the Fifth Assessment Report of the Intergovernmental Panel on Climate Change (IPCC) (Geneva), 151.
Rudolph, L., and Harrison, C. (2016). A Physician's Guide to Climate Change, Health and Equity. Oakland, CA: Public Health Institute.
Säynäjoki, A., Heinonen, J., and Junnila, S. (2012). A scenario analysis of the life cycle greenhouse gas emissions of a new residential area. Environ. Res. Lett. 7, 034037. doi: 10.1088/1748-9326/7/3/034037
Turner, L. K., and Collins, F. G. (2013). Carbon dioxide equivalent (CO2-e) emissions: a comparison between geopolymer and OPC cement concrete. Construct. Building Mater. 43, 125–130. doi: 10.1016/j.conbuildmat.2013.01.023
Wiedmann, T., and Minx, J. (2008). A definition of ‘carbon footprint'. Ecol. Econ. Res. Trends 1, 1–11
Keywords: life cycle analysis (LCA), carbon emissions, embodied energy, trenchless technology (TT), sustainable pipe materials
Citation: Alsadi AA and Matthews JC (2022) Reduction of Carbon Emission Is Optimized During the Life Cycle of Commonly Used Force Main Pipe Materials. Front. Water 4:735519. doi: 10.3389/frwa.2022.735519
Received: 02 July 2021; Accepted: 26 April 2022;
Published: 19 May 2022.
Edited by:
Subhankar Karmakar, Indian Institute of Technology Bombay, IndiaReviewed by:
Maciej Dzikuć, University of Zielona Góra, PolandEmad Yousif, Nahrain University, Iraq
Copyright © 2022 Alsadi and Matthews. This is an open-access article distributed under the terms of the Creative Commons Attribution License (CC BY). The use, distribution or reproduction in other forums is permitted, provided the original author(s) and the copyright owner(s) are credited and that the original publication in this journal is cited, in accordance with accepted academic practice. No use, distribution or reproduction is permitted which does not comply with these terms.
*Correspondence: Alhossin A. Alsadi, YWxob3NlbnNhZGVAZ21haWwuY29t