 Davide Cotti1*
 Mostapha Harb1
 Abdessamad Hadri2Mohammed Aboufirass2Khalid Rkha Chaham3
 Andrea Libertino4Lorenzo Campo4Eva Trasforini4Elke Krätzschmar5
 Felicitas Bellert5
 Michael Hagenlocher1
- 1United Nations University, Institute for Environment and Human Security (UNU-EHS), Bonn, Germany
- 2Ressources Ingénierie (RESING), Marrakech, Morocco
- 3Department of Geology, Faculty of Sciences-Semlalia, DLGR Laboratory Marrakech, Cadi Ayyad University, Marrakech, Morocco
- 4Centro Internazionale in Monitoraggio Ambientale Foundation (CIMA) Foundation, Savona, Italy
- 5Industrieanlagen-Betriebsgesellschaft mbH (IABG mbH), Ottobrunn, Germany
Multi-risk assessments are being increasingly proposed as a tool to effectively support policy-makers in reducing impacts from natural hazards. The complexity of multi-risk requires assessment approaches capable of capturing multiple components of risk (e.g., different hazards, exposed elements, and dimensions of vulnerability) in a coherent frame of reference, while at the same time providing an intuitive entry point to allow participation of relevant stakeholders. Contributing to the emerging multi-risk literature, we carried out a multi-risk assessment for the Marrakech-Safi region (Morocco)—an important economic and demographic hub in the country that is prone to multiple natural hazards, most notably floods and droughts. Through multiple consultations with local experts and stakeholders, a multi-risk assessment framework was constructed based on a set of single-risks related to flood and drought hazards. For each risk, spatial analysis was employed to assess the hazard exposure component of multi-risk, while a set of vulnerability indicators and stakeholder-informed weights were used to construct a composite indicator of vulnerability at the municipal level. For each municipality, the set of indicators and weights contributing to the composite indicator was designed to be dependent on the combination of risks the municipality is actually confronted with. The two components were aggregated using a risk matrix approach. Results show a significant proportion of municipalities (28%) reaching very high multi-risk levels, with a large influence of drought-related risks, and a prominent contribution of the vulnerability component on the overall multi-risk results. While the approach has allowed the exploration of the spatial variability of multi-risk in its multiple sub-components and the incorporation of stakeholders' opinions at different levels, more research is needed to explore how best to disentangle the complexity of the final multi-risk product into a tool capable of informing policy-makers in the identification of entry points for effective disaster risk governance.
Introduction
Disasters connected to hydrological hazards are a major concern to communities in both high and lower income countries, causing threats to lives, disrupting livelihoods and infrastructures, resulting in major societal impacts (Güneralp et al., 2015; Ward et al., 2020). In order to reduce these impacts, policy-makers need updated, reliable and comprehensive information to implement effective risk reduction measures (Hagenlocher et al., 2020). Risk assessments are an important component in the design of effective risk management strategies, as recognized by recent international policy agreements, such as the Sendai Framework for Disaster Risk Reduction 2015–2030 (SFDRR), the Paris Agreement (UNFCCC, 2015) and UNDRR's Global Assessment Report 2019 (UNDRR, 2019) among others. Moreover, the policy and the scientific community alike have been increasingly calling for the development of methodologies capable of capturing the complexities of risk (Garcia-Aristizabal et al., 2015; Adger et al., 2018), especially in the presence of multiple hazards (UNISDR, 2015), multiple types of assets or elements exposed (Hagenlocher et al., 2018b), and multiple types of vulnerabilities (Carpignano et al., 2009; Terzi et al., 2019). However, to date, the majority of risk assessments still focus on single hazards (Schneiderbauer et al., 2017; Ruiter et al., 2020), and methodologies for the assessment of more complex risks are yet not well-established (Zschau, 2017; Terzi et al., 2019; Gallina et al., 2020). Among available methods, composite indicators or indices have emerged as one of the most widely applied methodologies to explore risk and vulnerability to natural hazards (Beccari, 2016; Schneiderbauer et al., 2017; Hagenlocher et al., 2019; Sherbinin et al., 2019), and increasingly their use has been extended to multi-hazard risk (Kappes et al., 2012b; Wannewitz et al., 2016; Hagenlocher et al., 2018b) and multi-risk applications (Gallina et al., 2020). Although composite indicators are relatively simplistic model and come with amply-discussed limitations (Garschagen et al., 2021), they nonetheless are able to capture multiple dimension of complex phenomena such as vulnerability and risk, and offer an intuitive output which can support communication and adoption of results by non-specialists (Freudenberg, 2003; Hinkel, 2011; Rufat et al., 2019). In the context of multi-risk studies, Gallina et al. (2020) have used composite indicators for an integrated multi-risk assessment of coastal areas in the northeast of Italy, but limited the vulnerability sub-component to physical and environmental dimension only, while Galderisi and Limongi (2021) included a broader spectrum of vulnerability dimensions and weighted them according to their applicability to the hazards considered.
In this study, we performed a spatially-explicit, multi-risk assessment for the Marrakech-Safi region (Morocco), relying on a set of four single-risks (i.e., risks characterized by a specific impact of one hazard or stressor over one element of interest) connected to drought and flood hazards, and constructed a composite indicator to assess the sub-component of multi-risk vulnerability. Marrakech-Safi is one of Morocco's demographic and economic centers, and is prone to multiple hazards, notably floods, drought, storm surges and mass movements (Ezzine et al., 2016). The region participates in the country's current effort to shift toward a more proactive risk management (Louodyi et al., 2022), and over the past decade, a number of studies have addressed impacts and risks in relation to hydrological hazards in Marrakech-Safi, in particular drought and floods. However, the majority of these studies have focused on assessing changes in hazard or environmental conditions, such as precipitation regimes and temperatures under climate change (Choukrani et al., 2018; Hadri et al., 2021b), water availability (Rochdane et al., 2012), net primary production (Rochdane et al., 2014), or flood hazard (El Alaoui El Fels et al., 2018). Among examples of more integrated approaches, Karmaoui et al. (2021) developed a Mountain Flood Vulnerability Index (MFVI) integrating indicators of physical conditions and social dimensions alike, using it to perform a spatial assessment at the watershed level for five small basins in the mountainous areas of the region. Kahime et al. (2018), adapting the Environmental Vulnerability Index (EVI) methodology (Barnett et al., 2008), assessed environmental vulnerability at the regional level (with no further spatial disaggregation) using indicators for multiple hazards and pertaining to multiple sectors of interest. The most comprehensive study involving more than one hazard and multiple types of possible impacts, was carried out by the German Agency for International Cooperation (Messouli, 2015; Ezzine et al., 2016): the study addresses future projections of hazard intensity and possible impacts on natural resources of a diverse array of hazards through a country-wide probabilistic risk assessment model (Morocco natural hazards Probabilistic Risk Analysis—MnhPRA). However, to our knowledge no study has produced a comprehensive multi-risk assessment at the regional scale, including different hazards and multiple dimensions of vulnerability. As other experiences in the country have shown (Karmaoui et al., 2020), the participation of local experts and stakeholders can positively contribute to the identification of relevant environmental and societal challenges. In order to capitalize on the large local expertise, this study relied on consultations with local experts and stakeholders to guide the identification of drivers of risks and relative weights at the single-risks level. This in turn informed the construction of a weighted composite indicator to represent the vulnerability sub-component of multi-risk. The inclusion of stakeholders during the design of a multi-risk assessment is of prime importance, since, as noted by Gallina et al. (2020), multi-risk information must be “usable and easily understandable to stakeholders and decision-makers.” However, the complexity and level of abstraction involved in multi-risk compared to single-risk approaches might also generate challenges in its adoption for policy-makers, especially in local contexts, where resources and technical preparation can be a constraint (Pilone et al., 2019). To tentatively address this issue, in the present work the elicitation of stakeholders and experts' opinions was organized around very narrowly-defined single-risks, deemed more intuitive to conceptualize (especially in a time-constrained workshop setting), as they are more rooted in people's experiences.
The paper is structured as follows: Section Study Area: Marrakech-Safi Region introduces the Marrakech-Safi region, providing short background information on recent impacts from floods and drought hazards. Section Conceptualization of Multi-risk offers an overview of the conceptualization of multi-risk used for the study, in relation to existing literature. Section Conceptualization of Multi-risk details the multi-risk methodology adopted for the study, with detailed explanation on all its sub-components, aggregation approach and data sources. Section Results reports the main outputs of the spatial multi-risk analysis, in all its sub-components. Finally, Section Discussion, elaborate the findings in the light of pre-existing studies and provide a reflection on challenges and limitations of the multi-risk methodology based on experience from this case study.
Materials and Methods
Study Area: Marrakech-Safi Region
The region of Marrakech-Safi extends over a very diverse territory in central Morocco, for a total of 38,167 km2 (Haut Commissariat au Plan, 2020). The climate of the region is predominantly semi-arid. The Atlas mountain range is the source of a large number of oueds (i.e., seasonal creeks), the largest of which is the Tensift. Several plains, piedmont and lowlands areas occupy large extents of the region and are intensively utilized for agricultural production (irrigated and rain fed). The region is administratively divided into seven provinces—El Kelaa des Sraghna, Rehamna, Al Haouz, Chichaoua, Essaouira, Safi, Youssoufia—plus the prefecture of Marrakech. There are 251 municipalities in the region, with the municipality of Marrakech being further divided into five arrondissements (i.e., districts). The municipal level was chosen to define the spatial resolution of the current analysis, which consists therefore of 255 different units. With 4,520,569 inhabitants in 2014, Marrakech-Safi is the third most populated region in the country (Haut Commissariat au Plan, 2020). The city of Marrakech alone accounts for more than 20% of the region's population, while 57% of the inhabitants live in rural settlements (Haut Commissariat au Plan, 2020). More than 42% of the regional workforce is employed in agriculture (Haut Commissariat au Plan, 2020), and overall the region is responsible for up to 75% of national agricultural exports1. In recent decades, the region has experienced altered precipitation patterns and increased mean temperatures (Messouli, 2015; Fniguire et al., 2017; Choukrani et al., 2018), leading to several droughts, with progressively shorter intervals between events (Ezzine et al., 2016). Fniguire et al. (2017) showed that at higher time scales (12 and 24 months intervals), significant drought events (defined as rainfall deficiency) became more frequent and of longer duration after 1975. Analyzing agricultural yields, Messouli (2015) showed a correlation between meteorological droughts and reduced cereals output in the region between 2000 and 2015 (especially in the years 2006–2008). In particular, rain fed agricultural systems (which are mostly small scale subsistence farms, with little or no access to groundwater or reservoirs and low levels of technology and of market integration, World Bank, 2018) are characterized by an extreme sensibility to drought events of even short duration (Ezzine et al., 2014; Hadri et al., 2021a). The high seasonality of precipitation in the region is also a contributing factor to the occurrence of floodings. Ezzine et al. (2016) report that between 1982 and 2015 there have been at least 17 flood events that have caused severe human and material losses in the region, with at least one event per year since 2008. Arguably, the most devastating flood event occurred on August 17th 1995, when an exceptionally strong flash flood in the Ourika Valley (located in the High Atlas), claimed the lives of more than 200 people (Bennani et al., 2019). Figure 1 shows the main geographical features of the region, namely its land use-land cover and administrative divisions (A), and the superimpositions between flood and drought hazards extents and a set of assets of interest, namely population (B), road infrastructure (B), rain fed farmlands (C), and irrigated farmlands (D).
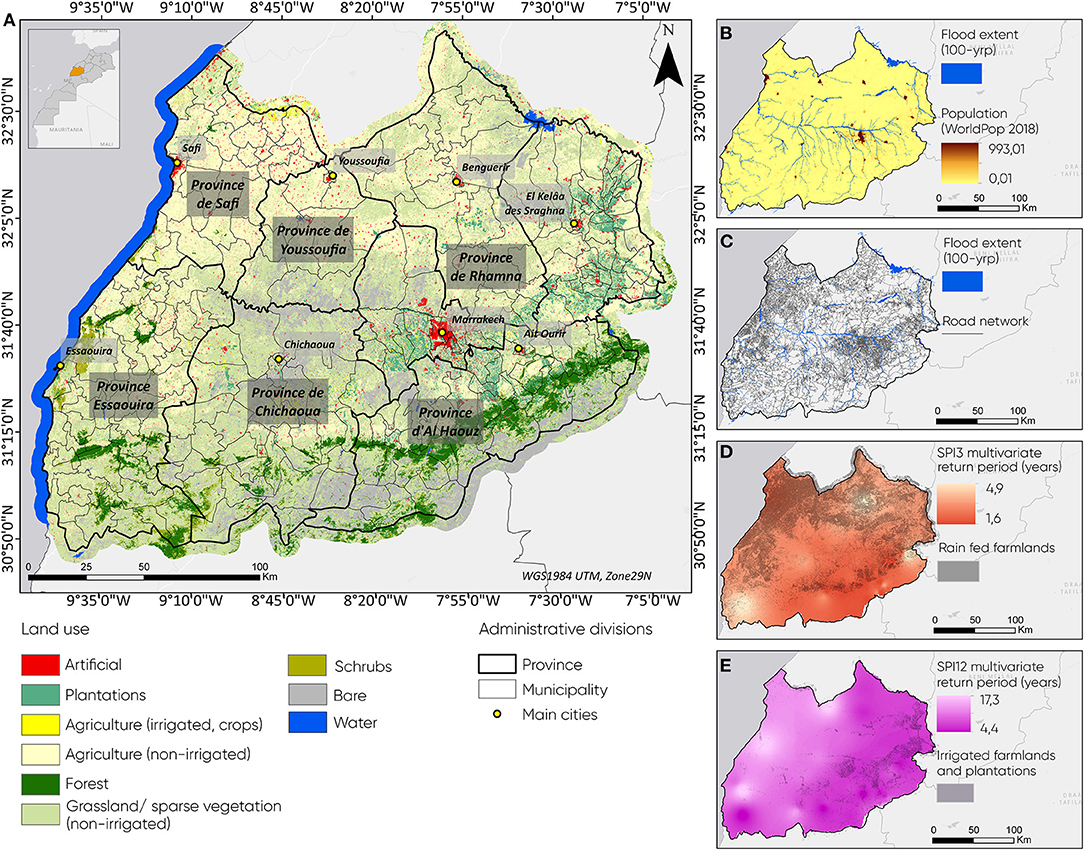
Figure 1. Marrakech-Safi region: land use-land cover (data source: Sentinel 2 monthly composite; reference year: 2018) (A), 100-yrp flood event over population distribution (B) and road infrastructure network (C), SPI12 multivariate drought event and irrigated farmlands and plantations (D), and SPI3 multivariate drought event and rain fed farmlands (E). Source: authors. For further information on data sources and processing please see Section Multi-risk Hazard Exposure.
Conceptualization of Multi-risk
The definition of the scope for a multi-risk assessment requires terminological clarification. In recent years, the risk science community has been widening the scope of risk assessments to accommodate for complex settings. For instance, under the umbrella term of “multi-hazard”, numerous studies have tackled risk in the context of multiple hazards, either in the sense of hazard interactions and cascades (Gill and Malamud, 2016) triggering hazards, i.e., hazards linked by causal relationships (Kappes et al., 2012a), compound hazards, i.e., two or more independent hazards occurring at the same time or in rapid succession (Zscheischler et al., 2020) or even interpreted as “cumulative” hazards, meaning all dependent and independent hazards potentially affecting a territory, also at times referred to as all-hazards-at-place approach (in reference to a concept introduced by Hewitt and Burton in 1971—Gill and Malamud, 2014). For more complete overviews of hazard interactions, see Pescaroli and Alexander (2018) and Gill and Malamud (2014). Somewhat evolving from and complementing the multi-hazard perspective, recent years have seen the introduction of the notion of “multi-risk” analysis, which shifts the focus from multiple hazards to the presence of multiple risks and related potential losses (Schmidt et al., 2011). However, agreement on a precise definition for multi-risk has yet to emerge (Gallina et al., 2016; Curt, 2020). Zschau (2017) reserves the term multi-risk only for assessments which adopt a multi-hazard risk framework that also consider all possible interactions and dynamics in the hazard and vulnerability components. Gallina et al. (2016) suggest that the concept of multi-risk should revolve around the sub-components of multi-hazard and multi-vulnerability, the latter being a measure of the different vulnerabilities of multiple exposed elements. Moreover, they introduce a distinction between “multi-hazard risk assessment” and “multi-risk assessment:” the first is a combination of a multi-hazard analysis on one side and the sum of existing vulnerabilities on the other, an example of which can be found in Depietri et al. (2018), where the vulnerability indicators considered are hazard-independent. The “multi-risk assessment” approach, on the other hand, explores interactions between hazards and vulnerabilities at the single risk level before proceeding with the multi-risk aggregation. Despite the diversity of terminologies and methodological approaches, researchers insist on the usefulness of multi-risk assessments for policy-making: as remarked by Scolobig et al. (2017), governance of risk can benefit from the adoption of a multi-risk perspective since it can provide a holistic view of risks interactions and impacts. Moreover, a comprehensive understanding of all hazards and risks affecting a specific area is recognized as an essential prerequisite for effective risk management (UNDRR, 2019; Hagenlocher et al., 2020). In particular, in the specific case of drought and flood events, Ward et al. (2020) have shown how risks connected to these extremes of the hydrological cycle are linked not just in terms of hazard propagation, but also in the conditions of socio-economic vulnerability that can cascade from successive events. Therefore, effective risk management practices should acknowledge the relationships and dependencies between multiple hazards and risks, as hazard-specific Disaster Risk Reduction measures could potentially increase risks connected to other hazards, a condition that Ruiter et al. (2021) have termed “a-synergies.” In their assessment of urban exposure and vulnerabilities in multi-hazards environments, Galderisi and Limongi (2021) elaborate further on the role of multi-risk information for risk management, suggesting that it could provide a much needed input to overcome the structures in which risk management actors operate, often isolated in sector-specific silos with little opportunity of cross-information. Somewhat reminiscent of the all-hazards-at-a-place perspective, they posit that multi-risk analysis should be “spatial-centered,” i.e., focusing on a particular geographical unit of analysis and all possible risks it might be subjected to, rather than “hazard-centered” (which they argue implies skewed attention toward hazard' extent and magnitude as a parameter to define an area of interest).
For the current study, multi-risk is interpreted as a cumulative combination of relevant single-risks at the municipality level, and whose sub-components of hazard exposure and vulnerability are assessed through a semi-quantitative approach.
Multi-risk Assessment: Methodology and Datasets
The operationalization of the multi-risk assessment for the present study builds on the IPCC AR5 framework, which represents risk as the interaction between hazard, exposure and vulnerability (IPCC, 2014), a conceptualization that was recently confirmed in the IPCC AR6 report (IPCC, 2022). We first identified the most relevant risks connected to drought and floods in the study areas through a review of scientific literature and reports covering the impacts of past events. The literature review included peer-reviewed articles and international, national and local reports with a focus on flood and drought risk. The review was continuously expanded from a core set of studies identified through a systematic review on the Scopus database in April 2019 (37 sources; for additional information on systematic literature review see Supplementary Material), to which additional sources were added through snowball searches (46 sources). Table 1 reports the four types of single-risks that were found to be particularly relevant for the case study area.
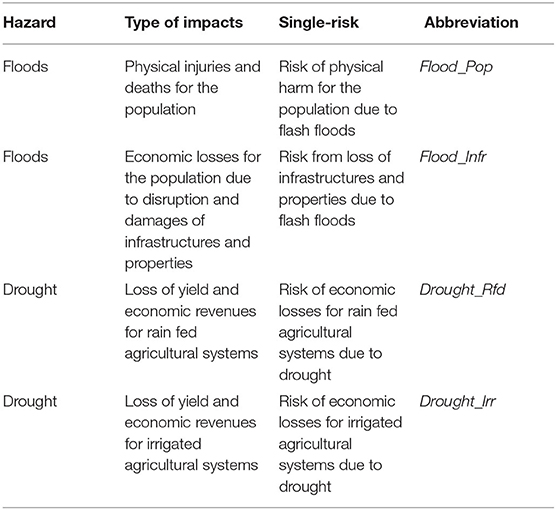
Table 1. Table of single-risks selected for the construction of the multi-risk assessment.
During the course of a dedicated workshop with 31 local experts and stakeholders (held in October 2019 in Marrakech), drivers of risk were discussed and identified for each single-risk, following the “impact chains” methodology (adapted from Fritzsche et al., 2014; Hagenlocher et al., 2018a; Zebisch et al., 2021). Impact chains are analytical tools designed to highlight the relational nature of drivers of risk through a participative process and have been increasingly used in climate risk assessments at various spatial scales in Europe (Buth et al., 2015; Greiving et al., 2015; Arabadzhyan et al., 2020; Lückerath et al., 2020), Benin (Wetzel et al., 2022), Bolivia (Zebisch et al., 2021), Burundi (Schneiderbauer et al., 2020), Pakistan (Zebisch et al., 2021), and Morocco alike (GIZ, 2014a,b). This exercise resulted in the creation of draft conceptual models describing the interrelationships between drivers of risk, which were subsequently complemented by additional literature research and bilateral consultations (Cotti et al., in progress): moreover, the models were used to inform the selection of indicators of hazard exposure and vulnerability for the multi-risk assessment (see Sections Multi-risk Hazard Exposure and Multi-risk Vulnerability). While a large number of drivers was identified (ranging from ecosystem services, socioeconomic factors and governance issues), spatial indicators for the semi-quantitative assessment at the desired level of analysis (i.e., municipalities or provinces) were only available for a subset of them. Table 2 summarizes the drivers of vulnerability and exposed elements which could be included in the assessment and their applicability to the four single-risks considered for the study. The full list of indicators (including data sources, spatial resolution, and reference year) is available in the Supplementary Material.
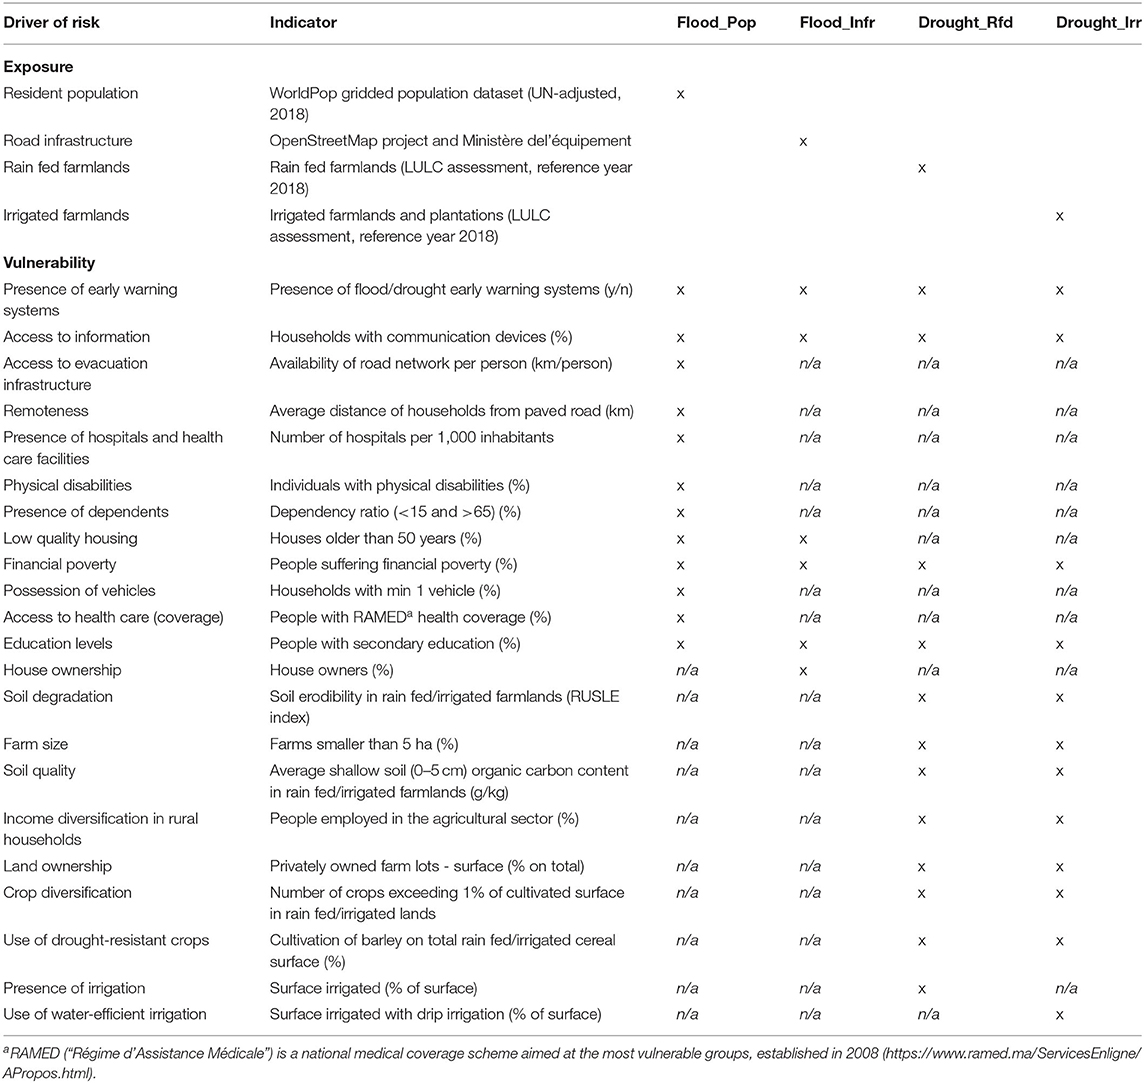
Table 2. Drivers and indicators of risk for the four single-risks considered in the study.
The spatial indicators of hazard exposure and vulnerability were collected and used to inform the aggregated sub-components of multi-risk hazard exposure and multi-risk vulnerability.
Multi-risk Hazard Exposure
The sub-component of multi-risk exposure is defined here as the combined effect of all applicable single-risk hazard exposures. As a first step, hazard exposure for each single risk was calculated through spatial analysis, considering the overlap between hazards extents with relevant assets of interest. For the flood hazard of Flood_Pop and Flood_Infr, a 100-year return period (yrp) riverine flood hazard map was modeled using a combination of “Continuum,” a fully distributed open-source hydrological model (Silvestro et al., 2013), with REFLEX, a hydro-morphological model suited for the analysis of large regions (Arcorace et al., 2019; Arcorace et al., in progress). Precipitations were simulated using regional climate models by the Coordinated Regional Climate Downscaling Experiment (CORDEX), and results were validated through a set of bilateral consultations with experts of the hydrological agency of the Tensift basin (ABHT). Given the focus on physical harm for the population in Flood_Pop, a gridded population dataset from WorldPop (UN-adjusted, 100 m spatial resolution, reference year 2018) was used to assess the exposure of the residents of Marrakech-Safi to a 100-yrp flood event. Since the hydrological model only provided information about water depth, a threshold of 1 m was applied when considering flood risk for the population, adapted from Wallingford (2006): the threshold is meant to represent a stability criteria, i.e., a level past which walking becomes dangerous for the population. Stability criteria are generally defined as dependent by water depth and water velocity (Martínez-Gomariz et al., 2016): in absence of the second parameter, only water depth could be considered for the present study. Results were aggregated at the municipal level to obtain the ratio of population exposed to flooding. For Flood_Infr, the regional road network was obtained from the OpenStreetMap project (https://www.openstreetmap.org) and updated through additional data obtained from Moroccan authorities (Ministère de l'Equipement) to represent infrastructure as the exposed asset. Exposure of road infrastructure to a 100-yrp flood was also calculated through spatial overlay and aggregated at the municipal level. In absence of shared assumptions on the critical levels of water for the different types of road infrastructures in the region, no threshold for water depth was applied in this case.
Exposure to drought was calculated for rain fed (Drought_Rfd) and irrigated farmlands (Drought_Irr). Drought hazard was assessed using the Standard Precipitation Index (SPI), due to its ease of computation and contained data requirement (Yihdego et al., 2019), which makes it especially useful in data-scarce environments (Svoboda and Fuchs, 2016). A 30-year (1988–2018) time series of precipitation data of 32 rain gage stations was obtained from the Agence Hydraulique de Bassin du Tensift and processed to produce a multivariate analysis for two time periods: SPI3 (i.e., deviations from the baseline in an accumulation period of 3 months) was used to characterize drought events affecting rain fed farmlands, while SPI12 (i.e., deviations from the baseline in an accumulation period of 12 months) was used for irrigated farmlands, due to their expected longer response time to precipitation deficits. The multivariate analysis of SPI was carried out using the copula method (Shiau, 2006), building on three variables: duration (i.e., the time span during which the SPI value remains negative), intensity or peak (minimum value reached by the SPI during the drought event) and severity (the sum of all negative SPI values during the drought event; Hayes et al., 2000). For the present analysis, the following thresholds were chosen based on existing literature and consultations with local experts: duration> 6 months; peak > 1.5; severity > 4. Results for both SPI3 and SPI12 were interpolated using the inverse distance weighted (IDW) method, so as to cover the entirety of the region, and subsequently downscaled to the land cover datasets of rain fed and irrigated farmlands, respectively. The land cover datasets were extracted from a regional land use-land cover (LULC) assessment based on Sentinel 2 data, realized especially for this analysis through a combination of supervised and unsupervised classification techniques (monthly mosaic; reference year: 2018; overall accuracy: 84,9%). Values of the multivariate SPI12 and SPI3 analysis were then transformed at the pixel level into exceedance probability values (defined as the inverse of the return period). Subsequently, the values were averaged at the municipal level. In order to incorporate a proxy of agricultural productivity (and therefore economic relevance) of rain fed and irrigated systems, for each assessment the scores were weighted by the ratio of the total municipal agricultural surface occupied by rain fed and irrigated farmlands respectively. Ultimately, the four single-risk exposure scores (i.e., population exposure to floods, infrastructure exposure to floods, rain fed farmlands exposure to drought, irrigated farmlands exposure to drought) were summed together through unweighted linear combination, thus yielding a simple measure of the municipal multi-risk exposure. The aggregation was performed without additional transformations, as the original scores were already all expressed in a relative form (i.e., varying between 0 and 1).
Multi-risk Vulnerability
For the construction of the composite indicator of multi-risk vulnerability, methodologies and guidelines were adapted from OECD (2008); Hagenlocher et al. (2018a), and Becker et al. (2019). First, indicators were checked for missing values across units (no imputation was required). Secondly, outliers were detected through exceedance of defined thresholds of skewness and kurtosis (2 and 3, 5, respectively) and treated through winsorization. All indicators were then normalized to a 0–1 range using a min-max approach, and then polarized to ensure that their values all correlate positively with the final score of the composite indicator. The resulting datasets was then checked for multicollinearity at the single-risk level, which led to the exclusion of one indicator in the Flood_Pop vulnerability dataset (see Supplementary Material for full reporting of multicollinearity diagnostics).
Indicators were then aggregated through a weighted linear aggregation, using a variable weighting scheme, derived from stakeholders' consultations. The aggregation was performed by selecting different sets of indicators for each unit of analysis (i.e., municipality): the applicability of the vulnerability indicators to each municipality was determined by the output of the hazard exposure analysis. In other words, the multi-risk vulnerability profile of each municipality is characterized by indicators that pertain to the risks the municipality is actually exposed to (according to our hazard exposure analysis' outputs). This was done to account for the wide differences at the regional scale in the spatial distribution of the hazards considered, which would have potentially penalized municipalities by considering dimensions of vulnerability that, according to the outputs of the hazards analysis, would not have the opportunity to materialize into an impact because of the absence of actual hazard exposure. Indicators common to two or more single-risks (see Table 2) were only included once to avoid double counting. Each municipality was coded according to which combination of hazard exposure types are applicable to its territory: given four types of risk, the number of hypothetical combinations applicable to a municipality are 15, as listed in Table 3.
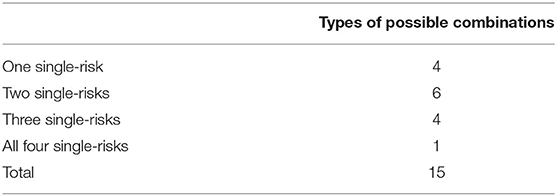
Table 3. List of possible combination of single-risks.
Similarly, the weighting scheme adopted for the multi-risk vulnerability index varied according to the combination of risks applicable to each unit. The weighting scheme was constructed by eliciting local and international experts' and stakeholders' opinions through four online surveys: for each type of risk, respondents were asked to express the degree of importance of all the drivers of vulnerability identified for that risk in a scale from 1 to 10. Overall, 36 responses were obtained across all four surveys (see Supplementary Material for full details). The values were then averaged across respondents and transformed so as to obtain a range of scores summing to 1 when considering all indicators of vulnerability, i.e., the combination in which all four risks apply. For all other combinations, the weight of each single indicator was standardized in relation to the four-risks combination: by so doing, the weighting schemes of all partial combinations of the four risks are rescaled to a common reference, thus producing a variable but coherent scheme, in which only the municipalities affected by all risks can reach the maximum sum of weights, i.e., 1. For indicators applicable to multiple risks, the maximum value across risks was retained.
Multi-risk Aggregation
To aggregate the sub-components of hazard exposure and vulnerability, a matrix-based approach was adopted. Matrices are qualitative frameworks used to compare classes for two variables, yielding an output classification. They are based on subjective assumptions of the interrelations between input classes (Albano et al., 2017), and the definition of the matrix scheme (i.e., the number of classes yielded) can be modified according to the resolution needed. The use of risk matrices is quite common in vulnerability and risk assessments, although it is in general more frequent for studies that approach vulnerability in the sense of evaluating potential physical damages (Albano et al., 2017). In Morocco, a hazard-vulnerability matrix has been used to assess flood risk for the National Flood Protection Plan (PNI; Louodyi et al., 2022). For the present study, the final scores of hazard exposure and vulnerability were reclassified into five categories (“very low,” “low,” “moderate,” “high,” and “very high”) using equal intervals from the max. The combination of the two components was done using a 5 × 5 matrix, yielding 25 output combinations, which were re-clustered into the five original classes, as illustrated in Figure 2 (for a similar approach, see Tung et al., 2019).
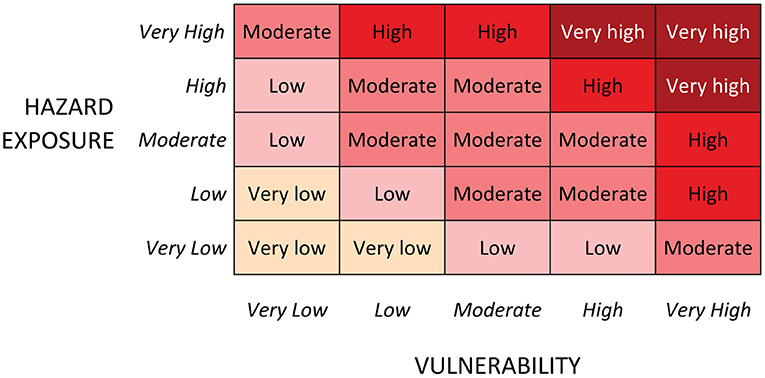
Figure 2. Risk matrix template for the current study.
Figure 3 summarizes the approach for the creation of the spatial multi-risk assessment: starting from the single risks identified, the left side of the figure depicts which specific hazard and exposure information were associated to create the four single-risk hazard exposure analysis. Similarly, the right side summarizes the process of identification of appropriate vulnerability indicators and relative weights which was employed to produce the four single-risks vulnerability assessments. Finally, the aggregation of these two components was performed to yield four single-risk assessments and one multi-risk assessment.
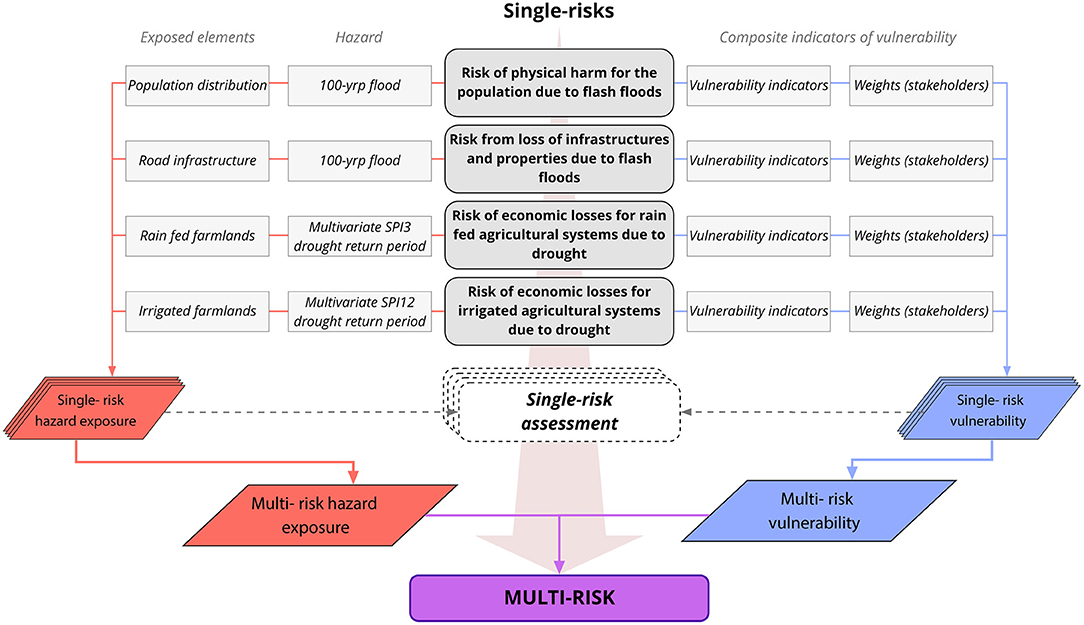
Figure 3. Operationalization of multi-risk assessment for the current study.
Results
The results of the hazard exposure analysis revealed that, of the 15 possible combinations of the four single risks considered, only four combinations actually occurred across the municipalities of Marrakech-Safi. In particular, 171 municipalities experience all four risks; 15 by the combination of Flood_Infr, Drought_Rfd and Drought_Irr; 15 municipalities are characterized by the combination of Flood_Pop, Drought_Rfd and Drought_Irr; one municipality by Flood_Pop, Flood_Infr, Drought_Rfd; 52 by the combination of both types of drought-related risks, while one municipality is characterized by only one risk, i.e., Drought_Rfd. All municipalities were found to be exposed to at least one risk. Figure 4 presents a breakdown of the occurrence of the combinations of risk per municipality for each of the eight provinces.
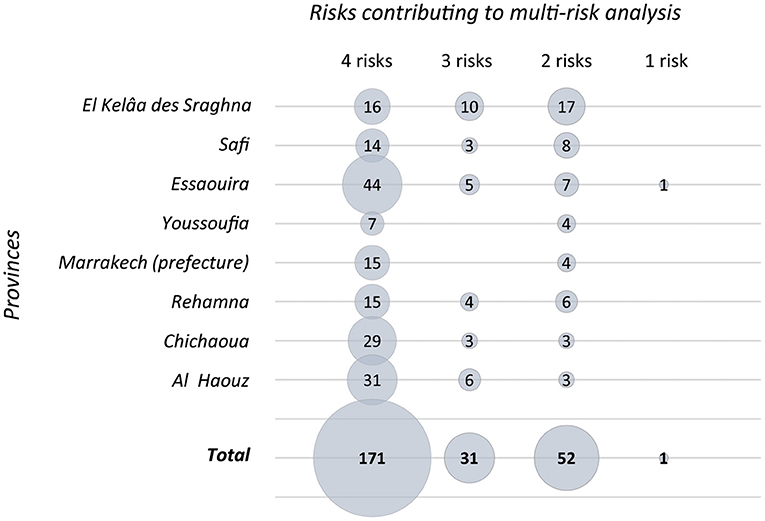
Figure 4. Number of municipalities per combination of single-risks combination (aggregated at the provincial level).
The analysis of the scores obtained by the municipalities shows an overwhelming contribution of rain fed farmlands' exposure to drought to the overall multi-risk hazard exposure score (as visible in Figure 5, aggregated at the provincial level). This occurs because of (1) the widespread presence of rain fed agriculture within the region (in accordance with the land-use-land-cover assessment used) and (2) the use of relative scores for all risks considered, which penalized exposures of assets less likely to reach very high values due to their intrinsic nature and the more concentrated spatial distribution of the hazard (e.g., percentage of population exposed to floods).
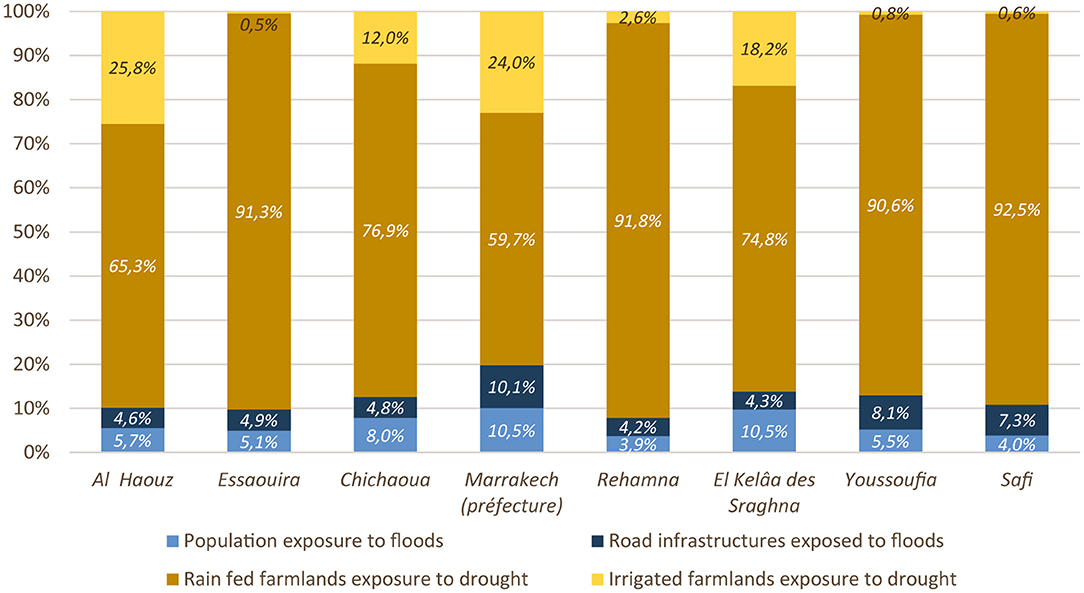
Figure 5. Average contribution (%) per province of single-risks hazard exposure scores to overall multi-risk hazard exposure score.
Overall, the region has low to very high levels of multi-hazard exposure, with 103 municipalities (40%) having high exposure and 19 (7%) having very high exposure. 113 (44%) register a moderate exposure, while 20 (8%) report low exposure. The results also show a relatively linear distribution of the output categories with the number of risks involved, meaning that a higher number of risks generally translated into higher scores of multi-risk hazard exposure.
As visible in Figure 6A, the geographical distribution of the hazard exposure classes show a large concentration of municipalities with “high” hazard exposure in the central and western provinces of the region. In particular, municipalities located along the course of the river Tensift (which separates the northern and southern provinces) show a continuity of classification: this is consistent with their concentration of assets at risk (i.e., population and road infrastructure) in proximity of the floodable areas of the 100-yrp flood event. In the south-eastern provinces of Al-Haouz and Chichaoua, multiple municipalities suffer from a “very high” hazard exposure, mainly due to the concurrent presence of hotspots of precipitation deficits for both rain fed and irrigated agricultural farmlands.
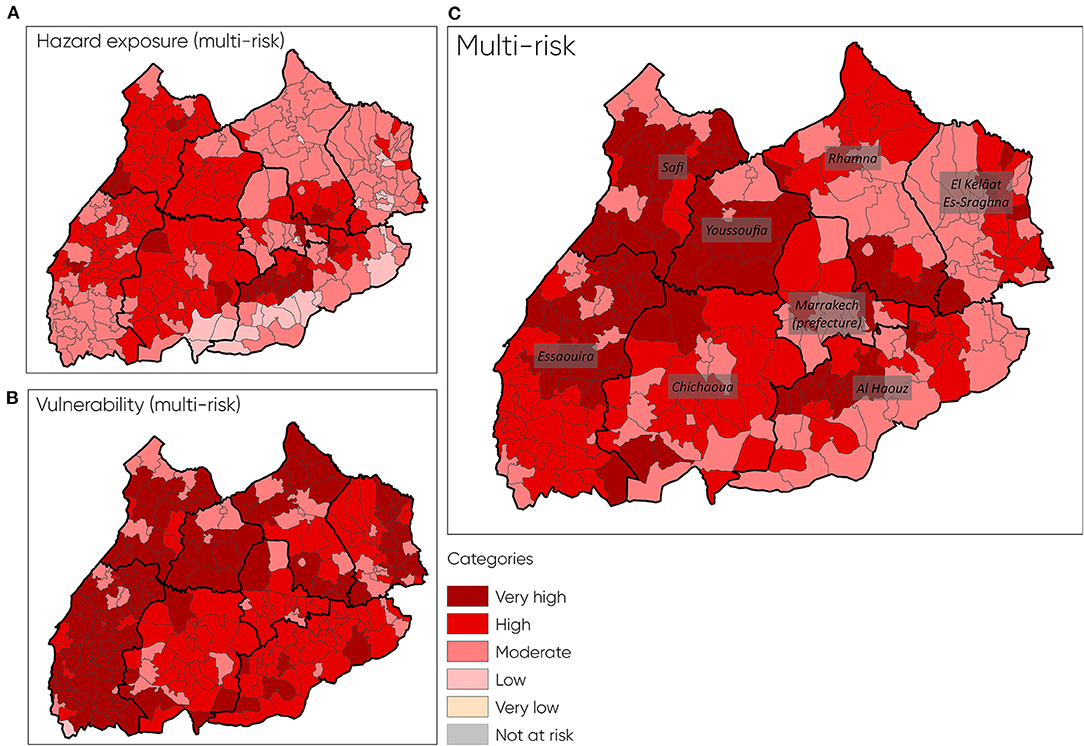
Figure 6. Results of the spatial assessment of multi-risk of Marrakech-Safi: multi-risk spatial exposure (A), multi-risk vulnerability (B), and overall multi-risk (C).
The multi-risk vulnerability index shows a strong occurrence of “very high” classes of vulnerability, with a stark concentration in the western provinces of the region (see Figure 6B). As visible in Table 4, the majority of the municipalities with “very high” multi-risk vulnerability scores expectedly receive a contribution from all four risk types (103 on 112), with only a minority (9) reaching this classification with only three risks. The distribution across risks of the 99 municipalities with high vulnerability is more varied, with 19 and 12% of the municipalities reaching this score by only three and two risks, respectively.
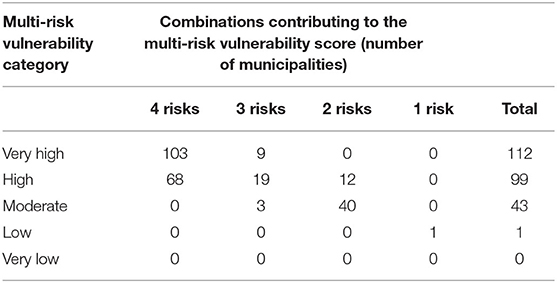
Table 4. Contribution of single-risk vulnerabilities combinations to multi-risk vulnerability—number of municipalities.
Given the highly aggregated structure of the multi-risk vulnerability index (whose weights and applicable indicators vary according to the combination of risks in each municipality), the determination of the contribution of each indicator to the final score requires to consider all combinations separately. On average, most weighted indicators were found to retain comparable ratios of contribution to the final score across risk types, with a 1% average variation. This indicates a level of consistency across risks, despite the variable weighting scheme and the variable number of indicators per type of risk. Only two indicators (“Number of crops exceeding 1% of cultivated surface in rain fed lands” and “Cultivation of barley on total irrigated cereal surface”) were found to vary more than 2% on average across risks, thus indicating a higher, although still contained, variability. It must also be noted that indicators were rewarded in terms of contribution to the final score when appearing in combinations of risks with lower number of indicators: for the two-risks combination, for example, indicators contributed on average 5.8% to the final score, compared to 3.7% for the all-risks combination (the former having only 20 indicators, while the latter 27)—see Supplementary Material for full table of comparison.
The aggregation via a matrix approach of the hazard exposure and vulnerability scores yielded a distribution of multi-risk classes across the municipalities of the region varying from moderate to very high. As visible in Figure 6C, clusters of very high multi-risk are found in the center-west of the region (especially in the provinces of Youssoufia, Safi, and Essaouira), and in the south-east (province of Al Haouz). Using the matrix classification framework to support the interpretation of the results. Figure 7 shows the number of municipalities that were classified for every combination of hazard exposure and vulnerability classes: from this visualization, it appears evident how the vulnerability component was responsible for driving the classification of multi-risk toward higher classes, suggesting that this component might need to be addressed with particular attention in the identification of risk reduction policies.
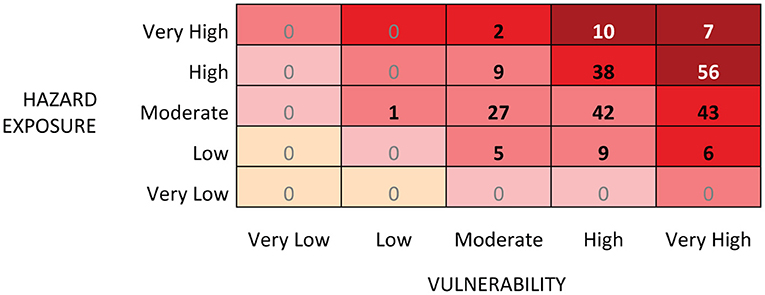
Figure 7. Results of the matrix classification. The number in the cells correspond to the number of municipalities that were classified in each combination of the hazard exposure and vulnerability sub-components.
Table 5 breaks down the total number of municipalities according to their multi-risk classification and the single-risks combinations that contributed to it. As visible in the table, a higher number generally coincides with higher multi-risk classifications.
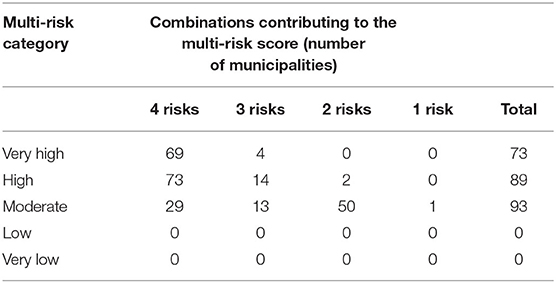
Table 5. Contribution of single-risk combinations to multi-risk—number of municipalities.
Discussion
Commonalities Between Drivers of Risks
The multi-risk spatial assessment is based on the single-risks drivers identified by the local stakeholders and complemented by literature review. Following this approach, a number of drivers were found to be common for all four single-risks considered: while the complete list of shared drivers is extensive (Cotti et al., in progress), for the current application we will discuss only those which could inform the spatial assessment (i.e., drivers that could be represented by spatially-explicit indicators), as per Table 2. Among these, the driver “presence of early warning systems” was recognized as relevant for both drought-related and flood-related risks. The importance of flood early warning systems was made apparent in the region after the Ourika flood of 1995 (see above), which lead to the installation of a Flood Forecasting and Warning System (FFWS) in the basin, later expanded to five additional neighboring watershed (Louodyi et al., 2022). Louodyi et al. (2022) report that the presence of the FFWS has positively affected the awareness of the local population toward floods. However, the system is currently not implemented for the remainder of the region. For drought-related risks, several public institutions in Morocco monitor different indicators of hazard (such as precipitation levels) or impacts (such as vegetation conditions), but the information thus produced is still not efficiently made available to farmers and stakeholders (World Bank, 2018). Related to this, the driver “access to information” was also found to be relevant for all types of risk, indicating that the production of timely information on hazards and risk on one side must be supported with the increase of people's access to it on the other. The remaining drivers shared across all risks hint at more deeply-rooted causes of socio-economic marginality, i.e., “financial poverty” and “education levels”: these can lead to increased vulnerability in relation to the different risks here considered, e.g., in terms of lower capacity to recover financially after a flood-related loss or the lack of knowledge about drought-effective agricultural practices for farmers. In fact, while Morocco has made important steps toward the eradication of poverty and social disparity in recent decades, multiple pockets of disparity are still present, especially in rural areas (World Bank Group, 2017).
Implications for Multi-risk Management in Marrakech-Safi
By incorporating data and information from a variety of different sectors and involving multiple stakeholders in the design phase, the multi-risk assessment here presented can support the efforts of creating a multi-sectoral approach to risk for Marrakech-Safi, the lack of which was identified by international analysts as one of the key limitations of current risk management practices in Morocco (World Bank, 2013; Kahime et al., 2018). The multi-risk analysis of the Marrakech-Safi region has shown that every municipality of the region is facing multiple risks associated with floods and droughts, but also that the contributing factors vary extensively across the territory. The various levels of disaggregation of the results by single-risks and by risk sub-components (i.e., hazard exposure and vulnerability) provide informative insights into the multi-risk profile of every municipality (see Supplementary Material for full results at the municipality level). The widespread presence of agricultural assets (i.e., farmlands) and the large extent of drought hazards determine a strong influence of drought-related risks on the overall multi-risk profile, and in particular on the hazard exposure component. This is a well-known challenge in assessments dealing with multiple hazards, each of which might be characterized by different spatial and temporal scales, and therefore assessed through different metrics (also in terms of related losses; Kappes et al., 2012a). In our study, while the influence of drought-related risks is dominating for the hazard exposure component, this is in line with the actual predominance of agricultural land uses in the regions (both rain fed and irrigated farming), whose loss or reduction in productivity due to the occurrence of drought would have severe economic consequences for the livelihoods of a consistent portion of the population. The predominance of rain fed agricultural systems in the region is reflected in their large share in shaping the overall multi-risk scores for the majority of municipalities. However, the influence of irrigated agricultural systems is notable for those parts of the region which host them (most notably, the provinces of Al Haouz and the prefecture of Marrakech): this is of particular interest as, according to the hazard analysis, similar return periods for a drought event capable of affecting irrigated systems (SPI12) can be expected in other areas of the region currently not developed for irrigated agriculture, such as the south-west (province of Essaouira). Conversion to irrigated agriculture has been heavily promoted and supported by the Moroccan government in the last decade, mainly through the Plan Maroc Vert (2008–2019), a strategic policy plan designed to address the multiple challenges facing agricultural and rural development in the country through the introduction of modern techniques and support for the creation of agricultural enterprises, with the overall goal of developing an export-oriented agriculture sector capable of leading the country's development (Faysse, 2015). Aiming to overcome the historical dualism between unequipped subsistence farming and modern agricultural exploitation, the plan has in fact been largely successful in increasing the number of agricultural enterprises using irrigation in Marrakech-Safi, increasing the total irrigated surface from 16,900 ha in 2008 to 99,983 in 20182. Paradoxically, however, this might have contributed to a further depletion of the country's groundwater resources, as overall water demand increased (Molle and Tanouti, 2017), against a consistent reduction of precipitations in the same period (Messouli, 2015).
Limitations to the Current Analysis
The results must also be interpreted in consideration of the limitations in the available datasets and methodology. A complete multi-risk assessment would theoretically follow an all-hazards and all-risks approach, i.e., taking into consideration all possible hazards and all risks (i.e., types of negative consequences) connected to them in a given territory. However, such comprehensive analysis was beyond the scope and possibilities of the current work. The availability of data is also a major potential hurdle to the development of a multi-risk assessment (Mignan et al., 2014): in our case, the necessity of performing a regional assessment constrained the analysis to datasets that offered completeness and coherency for the whole territory, thus limiting the possibility of representing all drivers identified as relevant by the stakeholders during the impact chain construction and focusing only on those who could be spatially quantified. Moreover, the vast scale implied at times renouncing to higher levels of details that might be available at more local level. In particular, the available meteorological data did not allow the consideration of flood events generated by intense, very localized and short-lived precipitation phenomena, which are the origin of flash flood events that have historically plagued the region. The flood hazard modeled for the current study is therefore more akin to a riverine downstream flood, i.e., large-scale events caused by precipitations of long duration increasing the runoff of tributary basins which in turn accumulate into a major and progressive rise in discharge of the mainstream water course (Keller et al., 2012). In the case of Marrakech-Safi, the Tensift river may be subject to this process, given its dependence on several tributaries and large downstream river bed (Louodyi et al., 2022). In the case of a 100-yr flood event, the model used in this analysis shows that this type of flood can potentially cause major effects on the growing urban settlements in the floodplains of the major watercourse of the region. However, the most destructive floods in the region have predominantly originated from intense precipitations occurring locally into narrow basins with extremely steep slopes, thus producing exceptionally fast accumulation of rainfall and large discharge (Daoudi and Saidi, 2008; Bennani et al., 2019; Louodyi et al., 2022). Furthermore, flood exposure results is also conditioned by the population distribution model used: in particular, Smith et al. (2019) warn that the use of the WorldPop dataset might generate overestimation of flood exposure, especially in rural areas, due to the fact that in the model built-up areas are not masked: this means that even pixels that do not belong to areas classified as urban will receive a population prediction, albeit very small, and no pixel will receive a value of zero (equal to absence of population; Smith et al., 2019). While this can create uncertainty, on the other hand a population distribution model that strictly confines the presence of people to the built environment may introduce an equally strong assumption on their exposure to flood, making it dependent on their proximity to buildings. This seems to be the case with historical flash floods in Marrakech-Safi: while injuries and physical harm have also been caused by collapses of houses and other buildings (Ezzine et al., 2016), the deadliest events concerned people gathered in outdoor areas such as in the tourist facilities in Ourika. These exposure dynamics are not captured by any population distribution model currently available for Marrakech-Safi, and their absence limits the ability of the risk assessment to exactly predict the extent of possible impacts.
Methodological Considerations and Future Research
The case study here presented provided also a testbed to explore the opportunities, benefits and challenges of expanding common methodologies for risk assessment toward multi-risk. While the selected approaches (i.e., spatial analysis for the hazard exposure components, construction of a composite indicator for the vulnerability component and matrix-based aggregation for risk) are common in the risk assessment literature, in this application they were employed to capture a more complex dimension of risk. In particular, our approach was aimed at constructing a framework in which both multi-risk and single-risks can be taken into account, by emphasizing the interaction of sub-components of risk at the single-risk level before proceeding to create the aggregated output. This approach has the advantage of offering a more detailed characterization of multi-risk for the units assessed. In particular, the use of combination-specific libraries of vulnerability indicators together with combination-specific weights offers a sophisticated angle to differentiate how vulnerability varies across space both in terms of relevant drivers (which ones apply in each unit?) and in terms of their relevant performance (which ones contribute the most to the final score?), thus providing a more layered set of information to policy-makers. Moreover, to compensate for this additional complexity, the choice of constructing the multi-risk assessment around a set of single-risks was deemed suitable also in terms of interactions with stakeholders: in fact, the single-risks perspective allowed experts to present their in-depth insights and local knowledge, and at the same time inform the underlying multi-risk framework without presenting an exceptionally abstract (and potentially alienating) framework of reference. This approach could be of particular interest from a policy perspective, as it offers the possibility of representing a multi-risk dimension while at the same time preserving the possibility of decomposing it back into the single-risks which are its constituents. In other words, it can offer to scientists and policy-makers the possibility of understanding single-risks under a wider framework, allowing comparison and therefore prioritization of risks, a characteristic considered an important added value by researchers and practitioners (Zschau, 2017). On the other hand, this approach did not allow to capture stakeholders' and experts' perception on the importance and priority of each single-risk against the others, which could offer additional insights on the construction of the multi-risk framework (Carpignano et al., 2009). From a policy perspective, the “cumulative” single-risks approach might also offer a practical entry point of interest, since policy-makers' mandates are often associated with defined administrative units. The use of composite indicators for the multi-risk vulnerability component, however, might prove quite complex to disentangle, especially in presence of variable weighting schemes: in fact, the comparison of the contribution of single-risk vulnerabilities to the final multi-risk vulnerability across municipalities can be more easily assessed when equal weights are applied, as it would only require to select the relevant indicators and compare their scores. However, weights are an important component of composite indicators (Becker et al., 2017), and especially so when they aim to capture the opinions of local experts and stakeholders, thus introducing a judgement value to the construction of the final composite indicator (Saltelli, 2007). It remains therefore an open question how best to match the complexity of single-risks combinations with experts' judgement in the context of multi-risk. In the field of indicator-based assessments, certain researchers even argue for avoiding the aggregation into a single output, and rather promoting the comparison between different components (Saltelli, 2007): for multi-risk applications, however, the multiple layers of aggregation involved could prevent from obtaining a synthetic overview based only the single, disaggregated components. An alternative path to explore, however, lies in the relational conceptual models constructed for the single-risks, i.e., the impact chains, which offer a map of interconnections between drivers of risks: in fact, the characteristics of multi-risk (including connections between drivers) are more fully represented in the conceptual models rather than in the spatial analysis, which is constrained by the non-relational nature of the index construction process. However, the weighting scheme employed for the index partially represents interactions by calculating different scores according the combination of risk (instead of for each risk separately). While for this application they only informed the selection of relevant indicators for the static composite indicator, future applications should explore modeling approaches to correctly represent the complex relationships between drivers of risk in a multi-risk context, expanding on recent efforts at the single-risk level (Wetzel et al., 2022).
Moreover, given the complexity of the scope of the multi-risk assessment in general, future applications should also consider additional interactions with experts and stakeholders in both the design and the validation phases of the analysis, so as to identify what output can best support the decision-making process.
The multi-risk assessment methodology applied for the Marrakech-Safi region has shown the potential benefits of employing a multi-risk framework based on a selection of relevant single-risks. Stakeholders and experts' consultations can draw on concepts close to local knowledge and experience, while at the same time contributing to a more complex all-encompassing framework. The semi-quantitative assessment is based on a simple methodology, replicable for other data-scarce environments. However, further research is required. In particular, additional stakeholders' validation of the final products (including the aggregation matrix used and potential prioritization between different risks) could provide additional fine-tuning of the results. Of extreme relevance, moreover, is an in-depth assessment of policy-makers understanding of the multi-risk framework and its actual utility in informing disaster risk reduction measures.
Data Availability Statement
The final aggregated risk data are included in the Supplementary Materials, further inquiries can be directed to the corresponding author.
Author Contributions
DC, MHag, and MHar drafted the original multi-risk research design. EK performed the land use—land-cover assessment. AH and MA carried out the drought hazard analysis. AL, LC, and ET performed the flood hazard assessment. DC conducted the literature review and analysis of hazard exposure, vulnerability, and risk under the supervision of MHar and MHag, organized and carried out the stakeholders' consultations with the support of AH, KC, and MA, and drafted the first version of the manuscript. All authors contributed to the interpretation of the results, the revision of the text, and approved the final manuscript.
Funding
This research has received funding through the ARIMA project (Grant No. 826542—ARIMA—UCPM-2018-PP-AG) funded by European Commission Directorate-General for European Civil Protection and Humanitarian Aid Operations (DG ECHO).
Conflict of Interest
AH and MA were employed by RESING, Marrakech, Morocco. AL, LC, and ET were employed by CIMA Foundation, Savona, Italy. EK and FB were employed by Industrieanlagen-Betriebsgesellschaft mbH (IABG mbH), Ottobrunn, Germany.
The remaining authors declare that the research was conducted in the absence of any commercial or financial relationships that could be construed as a potential conflict of interest.
Publisher's Note
All claims expressed in this article are solely those of the authors and do not necessarily represent those of their affiliated organizations, or those of the publisher, the editors and the reviewers. Any product that may be evaluated in this article, or claim that may be made by its manufacturer, is not guaranteed or endorsed by the publisher.
Acknowledgments
The authors would like to thank the participants in the stakeholder workshops for the valuable inputs, contributions, and feedback. Further, we would like to thank Saskia Werners for the valuable feedbacks on the structure and focus of the article, Elisaveta Gouretskaia for support in the initial phase of the study and Edward Sparkes for proofreading.
Supplementary Material
The Supplementary Material for this article can be found online at: https://www.frontiersin.org/articles/10.3389/frwa.2022.886648/full#supplementary-material
Footnotes
References
Adger, W. N., Brown, I., and Surminski, S. (2018). Advances in risk assessment for climate change adaptation policy. Philos. Trans. Ser. A Math. Phys. Eng. Sci. 376:2121. doi: 10.1098/rsta.2018.0106
Albano, R., Mancusi, L., and Abbate, A. (2017). Improving flood risk analysis for effectively supporting the implementation of flood risk management plans: the case study of “Serio” Valley. Environ. Sci. Pol. 75, 158–172. doi: 10.1016/j.envsci.2017.05.017
Arabadzhyan, A., Figini, P., García, C., González, M. M., Lam-González, Y. E., and León, C. J. (2020). Climate change, coastal tourism, and impact chains – a literature review. Curr. Iss. Tour. 13, 1–36. doi: 10.1080/13683500.2020.1825351
Arcorace, M., Masoero, A., Gabellani, S., Boni, G., and Basso, V. (2019). Evaluating a Novel 2D Hydro-Morphological Modelling Approach for a Rapid Estimation of Flood Extent and Water Depth: The REFLEX Model, 2019th edn. Vienna: Geophysical Research Abstract.
Barnett, J., Lambert, S., and Fry, I. (2008). The hazards of indicators: insights from the environmental vulnerability index. Ann. Assoc. Am. Geogr. 98, 102–119. doi: 10.1080/00045600701734315
Beccari, B. (2016). A comparative analysis of disaster risk, vulnerability and resilience composite indicators. PLoS Curr. 8:970. doi: 10.1371/currents.dis.453df025e34b682e9737f95070f9b970
Becker, W., Benavente, D., Dominguez-Torreiro, M., Moura, C., Neves, A., Saisana, M., et al. (2019). COIN Tool: User Guide. Luxembourg: Publications Office of the European Union.
Becker, W., Paruolo, P., Saisana, M., and Saltelli, A. (2017). “Weights and importance in composite indicators: mind the gap,” in Handbook of Uncertainty Quantification, eds R. Ghanem, D. Higdon and H. Owhadi (Cham: Springer International Publishing), 1187–1216. doi: 10.1007/978-3-319-12385-1_40
Bennani, O., Druon, E., Leone, F., Tramblay, Y., and Saidi, M. E. M. (2019). A spatial and integrated flood risk diagnosis. Disast. Prev. Manag. 28, 548–564. doi: 10.1108/DPM-12-2018-0379
Buth, M., Kahlenborn, W., Savelsberg, J., Becker, N., Bubeck, P., Kabisch, S., et al. (2015). Germany's Vulnerability to Climate Change Summary: Summary. Dessau-Roßlau: Umwelt Bundesamt.
Carpignano, A., Golia, E., Di Mauro, C., Bouchon, S., and Nordvik, J.-P. (2009). A methodological approach for the definition of multi-risk maps at regional level: first application. J. Risk Res. 12, 513–534. doi: 10.1080/13669870903050269
Choukrani, G., Hamimsa, A., Saidi, M. E., and Babqiqi, A. (2018). Diagnostic et projection future du changement climatique en zone aride. Cas de la region Marrakech-Safi (Maroc). Larhyss J. 15, 65–69.
Curt, C. (2020). Multirisk: what trends in recent works? - A bibliometric analysis. Sci. Tot. Environ. 2020:142951. doi: 10.1016/j.scitotenv.2020.142951
Daoudi, L., and Saidi, M. E. (2008). Floods in semi-arid zone: example of the Ourika (High Atlas of Marrakech, Morocco). Int. Sci. J. Alternat. Energy Ecol. 61:5.
Depietri, Y., Dahal, K., and McPhearson, T. (2018). Multi-hazard risks in New York City. Nat. Hazard. Earth Syst. Sci. 18, 3363–3381. doi: 10.5194/nhess-18-3363-2018
El Alaoui El Fels, A., Alaa, N., Bachnou, A., and Rachidi, S. (2018). Flood frequency analysis and generation of flood hazard indicator maps in a semi-arid environment, case of Ourika watershed (western High Atlas, Morocco). J. Afri. Earth Sci. 141, 94–106. doi: 10.1016/j.jafrearsci.2018.02.004
Ezzine, H., Bouziane, A., and Ouazar, D. (2014). Seasonal comparisons of meteorological and agricultural drought indices in Morocco using open short time-series data. Int. J. Appl. Earth Observ. Geoinform. 26, 36–48. doi: 10.1016/j.jag.2013.05.005
Ezzine, H., Messouli, M., and Krause, B. (2016). Analyse et cartographie de la vulnérabilité aux événements climatiques extrêmes et estimation des coûts de leurs impacts dans la région Marrakech Safi, GIZ and Royaume du Maroc - Ministère délégué auprès du Ministère de l'Énergie, des Mines, de l'Eau et de l'Environnement, Chargé de l'Environnement.
Faysse, N. (2015). The rationale of the Green Morocco Plan: missing links between goals and implementation. J. North Afri. Stud. 20, 622–634. doi: 10.1080/13629387.2015.1053112
Fniguire, F., Laftouhi, N.-E., Saidi, M. E., Zamrane, Z., El Himer, H., and Khalil, N. (2017). Spatial and temporal analysis of the drought vulnerability and risks over eight decades in a semi-arid region (Tensift basin: Morocco). Theoret. Appl. Climatol. 130, 321–330. doi: 10.1007/s00704-016-1873-z
Freudenberg, M. (2003). Composite Indicators of Country Performance: A Critical Assessment. OECD publishing, OECD Science, Technology and Industry Working Papers 2003/16.
Fritzsche, K., Schneiderbauer, S., Bubeck, P., Kienberger, S., Buth, M., Zebisch, M., et al. (2014). The Vulnerability Sourcebook: Concept and Guidelines for Standardised Vulnerability Assessments. GIZ, ADELPHI & EURAC. Available online at: https://www.adaptationcommunity.net/download/va/vulnerability-guides-manuals-reports/vuln_source_2017_EN.pdf.
Galderisi, A., and Limongi, G. (2021). A comprehensive assessment of exposure and vulnerabilities in multi-hazard urban environments: a key tool for risk-informed planning strategies. Sustainability 13:9055. doi: 10.3390/su13169055
Gallina, V., Torresan, S., Critto, A., Sperotto, A., Glade, T., and Marcomini, A. (2016). A review of multi-risk methodologies for natural hazards: consequences and challenges for a climate change impact assessment. J. Environ. Manag. 168, 123–132. doi: 10.1016/j.jenvman.2015.11.011
Gallina, V., Torresan, S., Zabeo, A., Critto, A., Glade, T., and Marcomini, A. (2020). A multi-risk methodology for the assessment of climate change impacts in coastal zones. Sustainability 12:3697. doi: 10.3390/su12093697
Garcia-Aristizabal, A., Gasparini, P., and Uhinga, G. (2015). “Multi-risk assessment as a tool for decision-making,” in Urban Vulnerability and Climate Change in Africa, eds S. Pauleit, A. Coly, S. Fohlmeister, P. Gasparini, G. Jørgensen, S. Kabisch, et al. (Cham: Springer International Publishing), 229–258. doi: 10.1007/978-3-319-03982-4_7
Garschagen, M., Doshi, D., Reith, J., and Hagenlocher, M. (2021). Global patterns of disaster and climate risk—an analysis of the consistency of leading index-based assessments and their results. Climat. Change 169, 1–2. doi: 10.1007/s10584-021-03209-7
Gill, J. C., and Malamud, B. D. (2014). Reviewing and visualizing the interactions of natural hazards. Rev. Geophys. 52, 680–722. doi: 10.1002/2013RG000445
Gill, J. C., and Malamud, B. D. (2016). Hazard interactions and interaction networks (cascades) within multi-hazard methodologies. Earth Syst. Dyn. 7, 659–679. doi: 10.5194/esd-7-659-2016
GIZ (2014a). Guide Relatif au montage du Système de Suivi-Evaluation de la Vulnérabilité et de l‘Adaptation au Changement Climatique dans les Régions du Souss Massa Draa et Marrakech Tensift Al Haouz, GIZ and Royaume du Maroc - Ministère délégué auprès du Ministère de l'Énergie, des Mines, de l'Eau et de l'Environnement, Chargé de l'Environnement.
GIZ (2014b). Système de suivi et évaluation de la vulnérabilité et de l'adaptation au changement climatique: Recueil des fiches-indicateurs et indications pour l'interprétation, GIZ and Royaume du Maroc - Ministère délégué auprès du Ministère de l'Énergie, des Mines, de l'Eau et de l'Environnement, Chargé de l'Environnement.
Greiving, S., Zebisch, M., Schneiderbauer, S., Fleischhauer, M., Lindner, C., Lückenkötter, J., et al. (2015). A consensus based vulnerability assessment to climate change in Germany. Int. J. Climate Change Strategies Manag. 7, 306–326. doi: 10.1108/IJCCSM-11-2013-0124
Güneralp, B., Güneralp, I., and Liu, Y. (2015). Changing global patterns of urban exposure to flood and drought hazards. Glob. Environ. Change 31, 217–225. doi: 10.1016/j.gloenvcha.2015.01.002
Hadri, A., Saidi, M. E. M., and Boudhar, A. (2021a). Multiscale drought monitoring and comparison using remote sensing in a Mediterranean arid region: a case study from west-central Morocco. Arab. J. Geosci. 14:2. doi: 10.1007/s12517-021-06493-w
Hadri, A., Saidi, M. E. M., Saouabe, T., and El Alaoui El Fels, A. (2021b). Temporal trends in extreme temperature and precipitation events in an arid area: case of Chichaoua Mejjate region (Morocco). J. Water Climate Change 12, 895–915. doi: 10.2166/wcc.2020.234
Hagenlocher, M., Meza, I., Anderson, C. C., Min, A., Renaud, F. G., Walz, Y., et al. (2019). Drought vulnerability and risk assessments: state of the art, persistent gaps, and research agenda. Environ. Res. Lett. 14:83002. doi: 10.1088/1748-9326/ab225d
Hagenlocher, M., Renaud, F. G., Haas, S., and Sebesvari, Z. (2018a). Vulnerability and risk of deltaic social-ecological systems exposed to multiple hazards. Sci. Tot. Environ. 631–632, 71–80. doi: 10.1016/j.scitotenv.2018.03.013
Hagenlocher, M., Schneiderbauer, S., Sebesvari, Z., Bertram, S., Renner, K., Renaud, F., et al. (2018b). Climate Risk Assessment for Ecosystem-based Adaptation: A Guidebook for Planners and Practitioners. GIZ, EURAC & UNU-EHS. Available online at: https://www.adaptationcommunity.net/wp-content/uploads/2018/06/giz-eurac-unu-2018-en-guidebookclimate-risk-asessment-eba.pdf.
Hagenlocher, M., Thieken, A., Schneiderbauer, S., Aguirre Ayerbe, I., Dobes, P., Donovan, A., et al. (2020). “Risk assessment,” in Science for Disaster Risk Management 2020: Acting Today, Protecting Tomorrow, eds A. Casajus Valles, M. Marin Ferrer, K. Poljanšek, K. Clark (Luxembourg: Publications Office of the European Union).
Haut Commissariat au Plan (2020). Monographie regionale - Region de Marrakech-Safi: Annee 2018. Available online at: https://www.hcp.ma/region-marrakech/MONOGRAPHIE-REGIONALE-DE-MARRAKECH-SAFI-2018_a426.html (accessed May 15, 2022).
Hayes, M. J., Svoboda, M. D., and Wilhite, D. A. (2000). Chapter 12 Monitoring Drought Using the Standardized Precipitation Index, University of Nebraska - Lincoln, Drought Mitigation Center Faculty Publications, 70.
Hinkel, J. (2011). “Indicators of vulnerability and adaptive capacity”: towards a clarification of the science–policy interface. Glob. Environ. Change 21, 198–208. doi: 10.1016/j.gloenvcha.2010.08.002
IPCC (2014). Climate Change 2014: Impacts, Adaptation and Vulnerability. Contribution of Working Group II to the Fifth Assessment Report of the Intergovernmental Panel on Climate Change. New York, NY: Cambridge University Press.
IPCC (2022). Impacts, Adaptation, and Vulnerability. Contribution of Working Group II to the Sixth Assessment Report of the Intergovernmental Panel on Climate Change. Cambridge University Press.
Kahime, K., Ben Salem, A., El Hidan, A., Messouli, M., and Chakhchar, A. (2018). Vulnerability and adaptation strategies to climate change on water resources and agriculture in Morocco: focus on Marrakech-Tensift-Al Haouz region. Int. J. Agri. Environ. Res. 4:1.
Kappes, M. S., Gruber, K., Frigerio, S., Bell, R., Keiler, M., and Glade, T. (2012a). The MultiRISK platform: the technical concept and application of a regional-scale multihazard exposure analysis tool. Geomorphology 151–152, 139–155. doi: 10.1016/j.geomorph.2012.01.024
Kappes, M. S., Keiler, M., Elverfeldt, K., von and Glade, T. (2012b). Challenges of analyzing multi-hazard risk: a review. Nat. Hazards 64, 1925–1958. doi: 10.1007/s11069-012-0294-2
Karmaoui, A., Moumane, A., and Akchbab, J. (2020). “Environmental hazards assessment at pre-saharan local scale,” in Decision Support Methods for Assessing Flood Risk and Vulnerability, ed A. Karmaoui (Hershey, PA, Engineering Science Reference), 250–267. doi: 10.4018/978-1-5225-9771-1.ch012
Karmaoui, A., Zerouali, S., Ayt Ougougdal, H., and Shah, A. A. (2021). A new mountain flood vulnerability index (MFVI) for the assessment of flood vulnerability. Sustain. Water Resour. Manag. 7:6. doi: 10.1007/s40899-021-00575-z
Keller, E. A., DeVecchio, D. E., and Blodgett, R. H. (2012). Natural Hazards: Earth's Processes as Hazards, Disasters, and Catastrophes, 3rd Edn. Upper Saddle River, NJ; Prentice Hall; London: Pearson Education.
Louodyi, D., Hasnaoui, M. D., and Fekri, A. (2022). “Flood risk management practices in Morocco: facts and challenges,” in Wadi Flash Floods, eds T. Sumi, S. A. Kantoush and M. Saber (Singapore: Springer Singapore), 2. doi: 10.1007/978-981-16-2904-4_2
Lückerath, D., Streberová, E., Bogen, M., Rome, E., Ullrich, O., and Pauditsová, E. (2020). “Climate change impact and vulnerability analysis in the city of bratislava: application and lessons learned,” in Critical Information Infrastructures Security, ed S. Nadjm-Tehrani (Cham: Springer International Publishing), 83–94. doi: 10.1007/978-3-030-37670-3_7
Martínez-Gomariz, E., Gómez, M., and Russo, B. (2016). Experimental study of the stability of pedestrians exposed to urban pluvial flooding. Nat. Hazards 82, 1259–1278. doi: 10.1007/s11069-016-2242-z
Messouli, M. (2015). Evaluation des impacts du changement climatique dans la Région Marrakech Safi: Elaboration d'un cadre orientation pour l'adaptation en vue d'une formation au bénéfice du Maroc et des pays subsahariens partenaires. GIZ.
Mignan, A., Wiemer, S., and Giardini, D. (2014). The quantification of low-probability–high-consequences events: part I. A generic multi-risk approach. Nat. Hazards 73, 1999–2022. doi: 10.1007/s11069-014-1178-4
Molle, F., and Tanouti, O. (2017). Squaring the circle: agricultural intensification vs. water conservation in Morocco. Agri. Water Manag. 192, 170–179. doi: 10.1016/j.agwat.2017.07.009
OECD (2008). Handbook on Constructing Composite Indicators: Methodology and User Guide. Paris: OECD Publications.
Pescaroli, G., and Alexander, D. (2018). Understanding compound, interconnected, interacting, and cascading risks: a holistic framework. Risk Anal. 38, 2245–2257. doi: 10.1111/risa.13128
Pilone, E., Demichela, M., and Baldissone, G. (2019). The multi-risk assessment approach as a basis for the territorial resilience. Sustainability 11:2612. doi: 10.3390/su11092612
Rochdane, S., Bounoua, L., Zhang, P., Imhoff, M., Messouli, M., and Yacoubi-Khebiza, M. (2014). Combining satellite data and models to assess vulnerability to climate change and its impact on food security in Morocco. Sustainability 6, 1729–1746. doi: 10.3390/su6041729
Rochdane, S., Reichert, B., Messouli, M., Babqiqi, A., and Khebiza, M. Y. (2012). Climate change impacts on water supply and demand in rheraya watershed (Morocco), with potential adaptation strategies. Water 4, 28–44. doi: 10.3390/w4010028
Rufat, S., Tate, E., Emrich, C. T., and Antolini, F. (2019). How valid are social vulnerability models? Ann. Am. Assoc. Geogr. 109, 1131–1153. doi: 10.1080/24694452.2018.1535887
Ruiter, M. C., Couasnon, A., Homberg, M. J. C., Daniell, J. E., Gill, J. C., and Ward, P. J. (2020). Why we can no longer ignore consecutive disasters. Earth's Future 8:114. doi: 10.1029/2019EF001425
Ruiter, M. C., de Bruijn, J. A., de Englhardt, J., Daniell, J. E., de Moel, H., and Ward, P. J. (2021). The asynergies of structural disaster risk reduction measures: comparing floods and earthquakes. Earth's Future 9:e2020EF001531. doi: 10.1029/2020EF001531
Saltelli, A. (2007). Composite indicators between analysis and advocacy. Soc. Indicat. Res. 81, 65–77. doi: 10.1007/s11205-006-0024-9
Schmidt, J., Matcham, I., Reese, S., King, A., Bell, R., Henderson, R., et al. (2011). Quantitative multi-risk analysis for natural hazards: a framework for multi-risk modelling. Nat. Hazards 58, 1169–1192. doi: 10.1007/s11069-011-9721-z
Schneiderbauer, S., Baunach, D., Pedoth, L., Renner, K., Fritzsche, K., Bollin, C., et al. (2020). Spatial-explicit climate change vulnerability assessments based on impact chains. Findings from a Case Study in Burundi. Sustainability 12:6354. doi: 10.3390/su12166354
Schneiderbauer, S., Callari, E., Eidsvig, U., and Hagenlocher, M. (2017). “The most recent view of vulnerability,” in Science for Disaster Risk Management 2017: Knowing Better and Losing Less, ed K. Poljanšek (Bélgica: European Commission).
Scolobig, A., Komendantova, N., and Mignan, A. (2017). Mainstreaming multi-risk approaches into policy. Geosciences 7:129. doi: 10.3390/geosciences7040129
Sherbinin, A., de Bukvic, A., Rohat, G., Gall, M., McCusker, B., Preston, B., et al. (2019). Climate vulnerability mapping: a systematic review and future prospects. Wiley Interdiscipl. Rev. 35:515. doi: 10.1002/wcc.600
Shiau, J. T. (2006). Fitting drought duration and severity with two-dimensional copulas. Water Resour. Manag. 20, 795–815. doi: 10.1007/s11269-005-9008-9
Silvestro, F., Gabellani, S., Delogu, F., Rudari, R., and Boni, G. (2013). Exploiting remote sensing land surface temperature in distributed hydrological modelling: the example of the Continuum model. Hydrol. Earth Syst. Sci. 17, 39–62. doi: 10.5194/hess-17-39-2013
Smith, A., Bates, P. D., Wing, O., Sampson, C., Quinn, N., and Neal, J. (2019). New estimates of flood exposure in developing countries using high-resolution population data. Nat. Commun. 2019:1814. doi: 10.1038/s41467-019-09282-y
Svoboda, M. D., and Fuchs, B. A. (2016). Handbook of Drought Indicators and Indices. Geneva: World Meteorological Organization. doi: 10.1201/b22009-11
Terzi, S., Torresan, S., Schneiderbauer, S., Critto, A., Zebisch, M., and Marcomini, A. (2019). Multi-risk assessment in mountain regions: a review of modelling approaches for climate change adaptation. J. Environ. Manag. 232, 759–771. doi: 10.1016/j.jenvman.2018.11.100
Tung, C.-P., Tsao, J.-H., Tien, Y.-C., Lin, C.-Y., and Jhong, B.-C. (2019). Development of a novel climate adaptation algorithm for climate risk assessment. Water 11:497. doi: 10.3390/w11030497
UNDRR (2019). Global Assessment Report on Disaster Risk Reduction. Geneva: United Nations Office for Disaster Risk Reduction.
UNFCCC (2015). Adoption of the Paris Agreement'. Available online at: https://unfccc.int/sites/default/files/english_paris_agreement.pdf (accessed February 27, 2022).
UNISDR (2015). Sendai Framework for Disaster Risk Reduction 2015 - 2030. Available online at: https://www.undrr.org/publication/sendai-framework-disaster-risk-reduction-2015–2030 (accessed May 15, 2022).
Wallingford, H. R. (2006). Flood Risks to People: The Flood Risks to People Methodology. Defra: Environment Agency. Available online at: https://assets.publishing.service.gov.uk/media/602bbc768fa8f50383c41f80/Flood_risks_to_people_-_Phase_2_The_flood_risks_to_people_methodology_technical_report.pdf (accessed May 15, 2022).
Wannewitz, S., Hagenlocher, M., and Garschagen, M. (2016). Development and validation of a sub-national multi-hazard risk index for the Philippines. GI_Forum 4, 133–140. doi: 10.1553/giscience2016_01_s133
Ward, P. J., Ruiter, M. C., de Mård, J., Schröter, K., van Loon, A., Veldkamp, T., et al. (2020). The need to integrate flood and drought disaster risk reduction strategies. Water Security 11:100070. doi: 10.1016/j.wasec.2020.100070
Wetzel, M., Schudel, L., Almoradie, A., Komi, K., Adounkpè, J., Walz, Y., et al. (2022). Assessing flood risk dynamics in data-scarce environments—experiences from combining impact chains with bayesian network analysis in the Lower Mono River Basin, Benin. Front. Water 4:27. doi: 10.3389/frwa.2022.837688
World Bank (2013). Building Morocco's Resilience: Inputs for an Integrated Risk Management Strategy. Washington, DC: World Bank Group.
World Bank (2018). Climate Variability, Drought, And Drought Management In Morocco's Agricultural Sector. World Bank Group.
World Bank Group (2017). Pauvreté et prospérité partagée au Maroc du troisième millénaire, 2001 - 2014. World Bank and Haut commissariat au Plan.
Yihdego, Y., Vaheddoost, B., and Al-Weshah, R. A. (2019). Drought indices and indicators revisited. Arab. J. Geosci. 12:452. doi: 10.1007/s12517-019-4237-z
Zebisch, M., Schneiderbauer, S., Fritzsche, K., Bubeck, P., Kienberger, S., Kahlenborn, W., et al. (2021). The vulnerability sourcebook and climate impact chains – a standardised framework for a climate vulnerability and risk assessment. Int. J. Climate Change Strategies Manag. 13, 35–59. doi: 10.1108/IJCCSM-07-2019-0042
Zschau, J. (2017). “Where are we with multihazards, multirisks assessment capacities?,” in Science for Disaster Risk Management 2017: Knowing Better and Losing Less, ed K. Poljanšek (Bélgica: European Commission), 2017.
Keywords: multi-risk, drought, floods, exposure, vulnerability, Morocco, risk assessment
Citation: Cotti D, Harb M, Hadri A, Aboufirass M, Chaham KR, Libertino A, Campo L, Trasforini E, Krätzschmar E, Bellert F and Hagenlocher M (2022) An Integrated Multi-Risk Assessment for Floods and Drought in the Marrakech-Safi Region (Morocco). Front. Water 4:886648. doi: 10.3389/frwa.2022.886648
Received: 28 February 2022; Accepted: 04 May 2022;
Published: 10 June 2022.
Edited by:
Hamed Moftakhari, University of Alabama, United StatesReviewed by:
Ahmed Karmaoui, Moulay Ismail University, MoroccoMarleen De Ruiter, VU Amsterdam, Netherlands
Copyright © 2022 Cotti, Harb, Hadri, Aboufirass, Chaham, Libertino, Campo, Trasforini, Krätzschmar, Bellert and Hagenlocher. This is an open-access article distributed under the terms of the Creative Commons Attribution License (CC BY). The use, distribution or reproduction in other forums is permitted, provided the original author(s) and the copyright owner(s) are credited and that the original publication in this journal is cited, in accordance with accepted academic practice. No use, distribution or reproduction is permitted which does not comply with these terms.
*Correspondence: Davide Cotti, Y290dGlAZWhzLnVudS5lZHU=