 Ehab Gnan1
 Carol J. Friedland2
 Md Adilur Rahim3*
 Rubayet Bin Mostafiz4,5
 Robert V. Rohli4,5
 Fatemeh Orooji6
 Arash Taghinezhad1,2
 Jasmin McElwee1
- 1Bert S. Turner Department of Construction Management, Louisiana State University, Baton Rouge, LA, United States
- 2LaHouse Resource Center, Department of Biological and Agricultural Engineering, Louisiana State University Agricultural Center, Baton Rouge, LA, United States
- 3Engineering Science Program, Louisiana State University, Baton Rouge, LA, United States
- 4Department of Oceanography and Coastal Sciences, Louisiana State University, Baton Rouge, LA, United States
- 5Coastal Studies Institute, Louisiana State University, Baton Rouge, LA, United States
- 6Architectural Science, Western Kentucky University, Bowling Green, KY, United States
Average annual loss (AAL) is traditionally used as the basis of assessing flood risk and evaluating risk mitigation measures. This research presents an improved implementation to estimate building-specific AAL, with the flood hazard of a building represented by the Gumbel extreme value distribution. AAL is then calculated by integrating the area under the overall loss-exceedance probability curve using trapezoidal Riemann sums. This implementation is compared with existing AAL estimations from flood risk assessment. A sensitivity analysis is conducted to examine the variability in AAL results based on depth-damage function (DDF) choice. To demonstrate the methodology, a one-story single-family residence is selected to assess the financial benefits of freeboard (i.e., increasing lowest floor elevations). Results show that 1 ft. of freeboard results in annual flood risk reduction of over $1,000, while 4 ft of freeboard results in annual flood risk reduction of nearly $2,000. The sensitivity result suggests that the DDF selection is critical, as a large proportion of flood loss is counted below the top of the first floor. The findings of this paper will enhance DDF selection, improve flood loss estimates, encourage homeowners and communities to invest in flood mitigation, and provide government decision-makers with improved information when considering building code changes.
Introduction
Average annual losses (AALs) from floods currently amount to $104 billion worldwide (Desai et al., 2015). These losses are projected to increase as a combined result of enhanced economic property value and increasing severity and frequency of extreme weather events (Evans et al., 2006; Kunreuther and Michel-Kerjan, 2007; Botzen and van den Bergh, 2008; Hino and Hall, 2017). Yet many individuals and communities continue to underestimate the possibility of flood losses. This suggests that flood frequency and possible losses are not understood clearly and that the potential benefits of mitigation measures are not communicated effectively (Burningham et al., 2008; Parker et al., 2009; Merz et al., 2015; Mol et al., 2020).
In the U.S., flood risk is typically understood in terms of whether a building is elevated above or below the 1% (i.e., 100-year) annual exceedance probability (AEP) flood event elevation [aka: base flood elevation (BFE)]. The BFE is often used as the design flood elevation (DFE). With no additional elevation for the first floor above the BFE (i.e., “freeboard”) to serve as added protection against flooding, the probability of the 1% APE event being exceeded in 70 years (i.e., the life expectancy of a house) is 50.3%. Thus, without freeboard, half of all houses in the special flood hazard area (SFHA; area of the 1% APE flood) built to the BFE are expected to flood at least once, with 15.6% expected to flood twice during their expected life span (Hawkesbury-Nepean Floodplain Management Steering Committee, 2006). These startling facts underscore the need for improved hazard management and communication of the hazard. In addition to the unnecessary danger to life, wise economic investment in buildings and communities should come with the expectation that far less than half will be flood-damaged during their life span.
Flood risk assessment is performed on different scales, ranging from macro- to micro-scale (i.e., single-residence building). At the macro-scale level, broader zones such as large cities, countries, and subcontinents are used in loss assessments (e.g., Hall et al., 2005; Lamb et al., 2010; Markus et al., 2010; Pandey et al., 2010; Hsu et al., 2011; Aerts et al., 2013; Ward et al., 2013; Winsemius et al., 2013; Koks et al., 2015; Olsen et al., 2015; Chen et al., 2016; Falter et al., 2016; Lorente, 2019; Shan et al., 2019). “Meso-scale” refers to local-level risk assessments such as towns, small communities, and neighborhoods (e.g., Ernst et al., 2010; Arrighi et al., 2013; Lüdtke et al., 2019; Shen et al., 2019). Although flood risk assessment has been investigated in numerous studies, only a few have been focused at the individual building level (e.g., Montgomery and Kunreuther, 2018; Armal et al., 2020). In addition, Bhola et al. (2020) have focused not only on the individual building level, but also on differentiating between uses of each building in order to better assess risk.
AAL, represented by the loss-exceedance probability curve, is the basis for flood risk quantification and evaluation of risk mitigation measures (Dalezios, 2017). Three primary AAL implementations have been used in flood risk assessment. The first uses available return period and flood depth data to calculate AAL as a piecewise product of the flood probability, with absolute losses calculated from a depth-damage function (DDF; FEMA, 2013). This technique typically yields coarse trapezoidal representations of the integrand, underestimating AAL and having limited utility for including losses from long-return-period floods. The second implementation uses a log-linear distribution to derive the linkage of loss with return periods, with absolute losses extrapolated to longer return periods and AAL estimated using the trapezoidal rule (Olsen et al., 2015). The implementation is suboptimal because it requires modeling the loss separately and then applying Riemann sum integration to obtain AAL. The third implementation uses a generalized extreme value distribution function, fitted with a Markov chain-based Monte Carlo (MCMC) method using annual maximum water level collected from river gauge stations to represent the area's flood characteristics (Zarekarizi et al., 2020). AAL is then calculated using the MCMC-derived extreme value parameters, DDF, and the building-to-river-gauge-station height difference, neglecting the horizontal distance, by computing the piecewise product of absolute loss and flood probability. In this implementation, structures with similar height difference from gauge stations have similar AAL estimates. These three methods are described in more detail in the next section.
To address the shortcomings of existing implementations, this paper introduces a refined implementation, in which flood AAL is calculated by fitting the Gumbel extreme value distribution function, which is well-suited to representing right-skewed functions (e.g., flood return periods), using available flood depth data, to model AEPs for the expected flood depths. A case study of a hypothetical one-story, single-family residence in Metairie, Louisiana, is used to demonstrate the implementation. AAL estimations are carried out for each half-foot increment of additional depth (i.e., freeboard), and is compared with the existing three AAL implementations. A sensitivity analysis is also conducted to examine the variability in AAL results based on DDF choice between United States Army Corps of Engineers USACE (2000), USACE (2006), and Nofal et al. (2020), as well as the depth-damage distribution data published by Wing et al. (2020). The contribution of this paper is the improvement of building-specific flood AAL estimation through more precise computational representation of the loss-AEP distribution and the use of building-specific flood characteristics using the Gumbel distribution, in addition to evaluation of the implications of DDF selection on AAL result.
Background: Existing AAL implementation methods
There are three primary AAL implementations in flood risk assessment field; AAL is calculated as piecewise of probability and loss using limited return periods, a piecewise approach with log-linear extrapolation, and a piecewise approach with generalized extreme value distribution. The computations of these three existing AAL implementations are described in Supplementary Document 1.
In the first implementation, AAL is calculated as the piecewise product of probability and loss using only the available return periods for the site (e.g., FEMA, 2013; Montgomery and Kunreuther, 2018; Armal et al., 2020). It is common practice in flood risk assessments to use only the available data of AEPs (oftentimes 10- 50- 100-, 500-year flood data), despite the fact that flood losses arise from all possible flood events (Oliver et al., 2019). To estimate AAL using this implementation, losses associated with the site's available return periods are calculated directly as piecewise product of probability and percentage of building value lost from depth-loss functions. Result of probability and loss products are integrated using the Riemann sum or FEMA (2013) equation to obtain the total AAL (Equation 1), where fi is the flood frequency (i.e., AEP) of the return period, and Li is the loss corresponding to return period i.
In the second implementation, a piecewise approach with log-linear extrapolation is used to extend the time range of the return periods (e.g., Olsen et al., 2015). AAL is calculated as the piecewise product of probability and absolute loss using limited return periods with Riemann sum integration. Trendlines obtained through regression analyses of the available data are used to derive multiple equations that represent losses from flood depths. Values of return periods are plotted against their expected losses to obtain the regression equation (Equation 2), where S represents the loss in $, R is the return period, and u, and α are the site-specific location and scale parameters, respectively.
From the derived equations, losses are extrapolated to a longer return period time range (Figure 1). The expected losses of all events with different AEPs are integrated using Riemann sums to estimate the overall AAL.
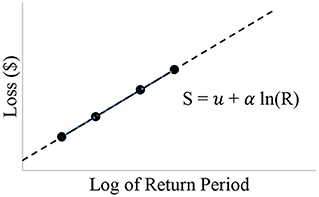
Figure 1. Log-linear Loss-Return Period Relationship.
The third implementation uses a generalized extreme value (GEV) distribution function to represent the flood hazard (Zarekarizi et al., 2020). The annual maximum water level from the nearest USGS river gauge station is used to fit the GEV. An MCMC method is used to fit the data to a GEV function to get the location, scale, and shape parameters. The AAL is calculated using the GEV parameters, DDF, and house initial stage, the latter of which is calculated by subtracting the elevation of the gauge station from that of the building. A piecewise product of flood probability estimated from GEV and flood loss calculated from the DDF is conducted to estimate the AAL.
Methods
AAL is calculated by modeling AEP for expected flood depths using the Gumbel extreme value distribution function. The structure-specific Gumbel parameters are used to generate flood events by flood depth and AEP. These depths are converted to losses using a DDF and the structure's first-floor height (FFH). AAL is calculated by integrating the area under the overall loss-AEP curve using trapezoidal Riemann sums. A sensitivity analysis is then performed using different DDFs to check the implications of DDF selection in AAL estimations.
Improved AAL implementation
In this implementation, the Gumbel distribution is fitted to determine the corresponding AEP for given flood depths. The relationship between flood depth and its expected loss is determined using the USACE DDFs. The AAL is determined through numerical integration of the flood AEP and loss functions. The following sections describe the AAL implementation in detail.
Characterizing flood hazard
An extreme value distribution function is needed to define the return periods and their corresponding flood depths. Driven by the right-skewed nature of flood return periods, AEPs for the expected flood depths are modeled using Gumbel distribution function (e.g., Kumar and Bhardwaj, 2015; Singh et al., 2018; Malakar, 2020; Patel, 2020). The Gumbel distribution provides the best fit among other extreme value distributions and it is effective for smaller sample sizes (Cunnane, 1989; Onen and Bagatur, 2017). The two-parameter Gumbel extreme value distribution is used here (Equation 3):
The cumulative distribution function (CDF) of the distribution (Equation 4) is the annual probability that a stochastic variable X is less than or equal to a flood event of depth D (annual non-exceedance probability), and is written as:
Solving for D yields the Gumbel inverse CDF (Equation 5), where flood depth D is obtained as a function of flood non-exceedance probability and Gumbel parameters:
where p = P(X ≤ D). The AEP of the flood event with depth D is (1−p).
In Equations (3–5), f(D) is the Gumbel PDF, F(D) is the CDF, and F−1(D) is the inverse CDF. The Gumbel distribution is fit using the flood depth data and corresponding annual non-exceedance probabilities (Equation 5) to estimate the site-specific location (u) and scale (α) parameters at the building location.
The site-specific u and α are corrected according to Mostafiz et al. (2021) so that the u parameter at each cell overlying the structure is negative. The u value should be negative for most residential buildings, as flood depth at lower return period flood event would only be possible for waterlogged terrain. For any cell in which the u value is positive, a 2-year return period flood depth threshold value of −0.05 feet is incorporated with other flood depth data for that cell. Because a double logarithmic transformation is used, 2 years is the lowest return period that can be considered. The Gumbel distribution is again fit using the additional 2-year return period flood depth data and the u value is checked. If the u value is still positive, the threshold value is decreased by increments of −0.05 until u becomes negative. The Python code for the improved AAL implementation including the correction procedure of Gumbel parameters are provided in Supplementary Document 2.
Depth-damage functions
The relationship between flood depth and loss (in terms of percentage of building value) is characterized using DDFs that have been developed based on post-flood surveys and expert elicitation (USACE, 2015). The USACE is considered the primary source of DDFs in the U.S. (Multihazard Mitigation Council, 2017). USACE depth-damage curves return the mean percentage of building and content loss that a residence is expected to encounter given a specific flood depth.
The flood depth above the first floor Dh, is determined from the predicted flood depth (D) less the FFH of the building (Equation 6).
USACE DDFs in general account for damage to the structure below the FFH by assigning loss at negative flood depths for buildings without a basement, as shown in Figure 2. This procedure accounts for the impacts to the floor structure and other structural elements, as well as to electrical, plumbing, and mechanical systems that may be located below the building's FFH.
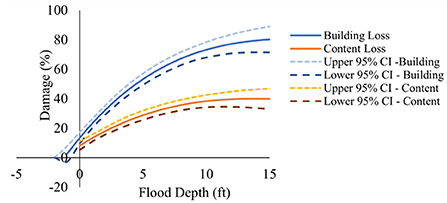
Figure 2. USACE (2000) DDF for a one-story home without basement.
AAL calculation using Riemann sum approach
AAL is generally calculated by integrating flood loss function L(P) across the range of flood probabilities (Equation 7), such that,
where Pmin corresponds to the lowest exceedance probability (flood event with longer return period) and the Pmax corresponds to the highest exceedance probability (flood event with shorter return period). The loss function L(P) is unique for a building and location combination. This function is derived from the DDF based on the relationship of flood depth above the ground (D), the calculated probability of that flood depth occurring (Equation 4), and the height of the home's first-floor above the ground (FFH). Beginning with the DDF damage initiation point (i.e., the depth relative to the first-floor height where damage starts; Dh = −2 feet for USACE, 2000), the corresponding DDF flood loss percentage is recorded and the flood depth above ground (D) is calculated using the relationship expressed in Equation 6. The corresponding AEP is calculated as (1–p), where p is calculated using Equation 4. This process is repeated for incrementally increasing values of Dh, and the loss function L(P)is constructed using the series of DDF loss percentages and corresponding probabilities. The AAL is estimated by solving the integral of Equation 7 using a trapezoidal Riemann sum approach. The area of each trapezoids is calculated as the average loss multiplied by the difference in probabilities and the AAL is estimated the sum of areas of all trapezoids as shown in Equation 8 (Meyer et al., 2008, 2009). Total AAL expressed as a percentage (AALT, %) is the summation of building (AALb, %) and contents (AALc, %) AAL percentages based on the building's value (Equation 9). Total AAL is calculated as a percentage of the building replacement value, which can then be converted to a dollar figure (Equation 10).
DDF sensitivity
DDFs are key components upon which loss assessments are based and are accepted worldwide as the standard method in estimating flood loss (Apel et al., 2009). However, variability in AAL results based on DDF is a primary concern in assessing losses (Wing et al., 2020). A sensitivity analysis is conducted in this study to examine the variability in AAL results based on DDF choice.
While other DDFs are available, USACE (2006) is selected for this sensitivity analysis as it is specific to the area where the case study is located. Nofal et al. (2020) and Wing et al. (2020) are selected for this sensitivity analysis as they are considered the most recent comprehensive work in the loss function area. Moreover, all these functions are comparable with the classification (e.g., occupancy type, number of stories, presence of a basement, measured by depth, loss as a percentage of building replacement cost) of the adopted USACE (2000) function. This ensures a consistent and effective comparison between the functions. It is noteworthy that Wing et al. (2020) consider only building loss, whereas all other functions used here consider both the building and content losses. While USACE (2000) and USACE (2006) separate building loss from content loss, Nofal et al. (2020) integrates both in one function. Although the damage initiation point of the Nofal et al. (2020) DDF is at −3 ft relative to FFH to provide a conservative measure, the function is truncated in the present study to begin calculating building losses with damage initiation at −2 ft. Wing et al. (2020) attributes no loss percentages below the building's first floor (damage initiation at 0 ft relative to FFH). The analysis considers DDF variability using damage initiation points at −2, −1, and 0 ft relative to FFH. The loss functions are provided in the Supplementary Document 3.
Case study
A case study was performed in Metairie, Louisiana, to demonstrate the scenario for new construction of a hypothetical one-story, single-family home with 1,800 ft2 of living area. The case study is located in the metropolitan New Orleans area within Jefferson Parish (County) at coordinates 29.994385°N, −90.168238°W. The ground elevation of the site is −7.0 ft. (NAVD88; North American Vertical Datum of 1988), determined by FEMA-developed Lidar. The site is located on NFIP Map Panel 22051C0185F within zone AE −4, indicating that the BFE is −4 ft. (NAVD 88), which corresponds to a 3.0 ft of FFH. Note that much of the metropolitan New Orleans area is protected by various flood protection systems, such as levees, pumping stations, and flood gates (Wilkins et al., 2008). In 2019, the average cost of constructing a single-family residence in the New Orleans area was $92.47 per square foot (Moselle, 2018), which yields an estimated construction cost for a 1,800 ft2 residence of $166,450.
Flood depth grids of Metairie used in the case study were developed by FEMA through the Risk Mapping, Assessment and Planning (Risk MAP) program (FEMA, 2022). Flood depths of the 10-, 50-, 100-, and 500-year return periods, with 0.1, 0.02, 0.01, and 0.002 AEPs, are 2.3-, 2.8-, 3.1-, and 3.6-ft. above local ground, respectively. The corresponding flood depths are shown in Table 1.
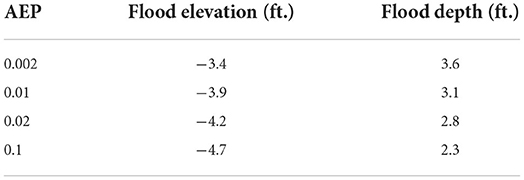
Table 1. Case study flood elevations and depths.
Results
AAL estimations are carried out for each half-foot increment of additional freeboard above the BFE up to 4.0 ft., to allow for loss comparison. The results are further contrasted with the three other implementations used for estimating the expected AAL of flooding. A sensitivity analysis is conducted to examine the variability in AAL results based on DDF choice.
Estimated AAL
A Gumbel distribution is fit using the flood depth data of the building. The Gumbel parameters u and α are estimated as −0.0108 and 0.658, respectively and are used to compute flood probabilities corresponding to various flood depths. The AAL is estimated using building-specific u, α, and FFH values and the USACE (2000) DDF. The Dh start at −2 ft above the ground and are increased in 0.1 ft increments to 24 ft (260 trapezoids). The results are summarized in Table 2, which show that total AAL is reduced with each additional 0.5 ft. of freeboard increase, with greater reduction occurring for smaller freeboard and the reduction decreasing gradually as freeboard increases. However, the cumulative reduction in AAL continues to increase with each additional freeboard increase.
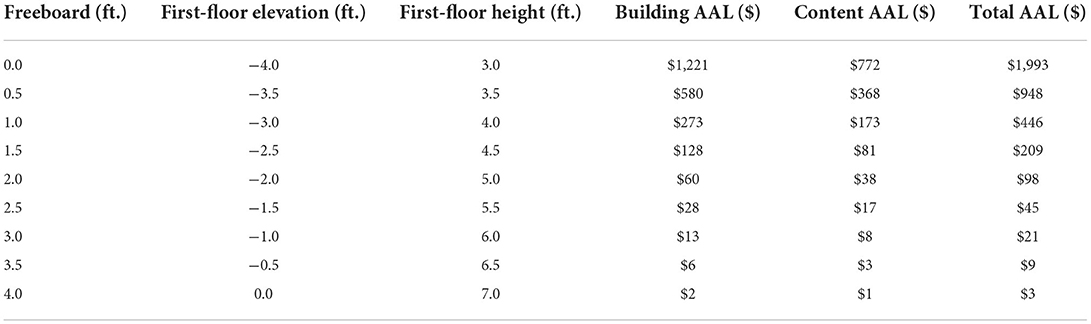
Table 2. AAL results for each freeboard scenario using USACE (2000) for Metairie, Louisiana, case study.
Constructing the single-family home with additional freeboard reduces flood risk in flooding events considerably. Adding a half-foot of freeboard decreases annual risk by 52% in this location-specific example. Similarly, increasing the freeboard by 1 and 2 ft. results in 78 and 95% of decreased annual risk, respectively.
Comparison with existing AAL implementations
The results of this study are contrasted with the three current implementations using the case study and summarized in Table 3.
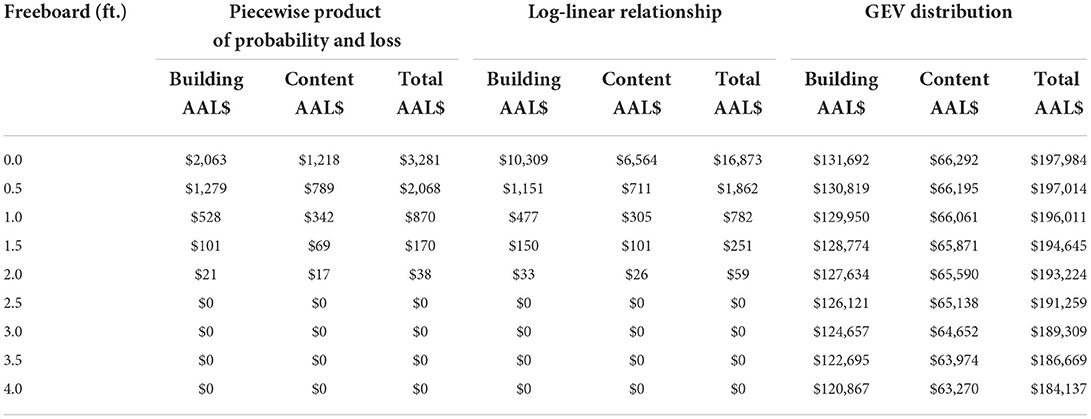
Table 3. Comparison of calculated building and content annual average loss by calculation method and freeboard amount for the Metairie, Louisiana, case study.
The comparison shows that the existing implementations provide higher estimates of AAL. The first implementation based on piecewise products uses only the available flood depth data of the building, which results in fewer and coarser trapezoidal intervals of return periods. The log-linear regression implementation shows considerably higher estimates than the first implementation. The third implementation provided the worst AAL estimates, which are very large. As mentioned earlier, the location is protected by a flood protection system, so the river gauge station data are not suitable for this location.
DDF sensitivity
Sensitivity analysis is carried out to examine the variability in AAL results based on DDF choice. AALs are further computed for each half-foot increment of additional freeboard increase using USACE (2006), and Nofal et al. (2020) functions, with damage initiation points at −2 and −1 ft relative to FFH (Tables 4, 5, respectively). The same three functions and the depth-damage distribution data from Wing et al. (2020) are compared for a damage initiation point of 0 ft relative to FFH (Table 6), to account for the Wing et al. (2020) attribution of losses starting at 0 ft relative to FFH.
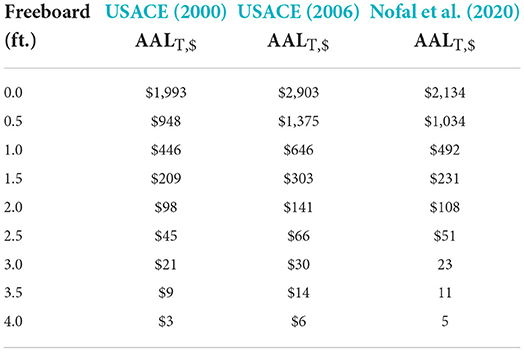
Table 4. AAL results using USACE (2000, 2006), and Nofal et al. (2020) at a damage initiation point of −2 ft relative to FFH.
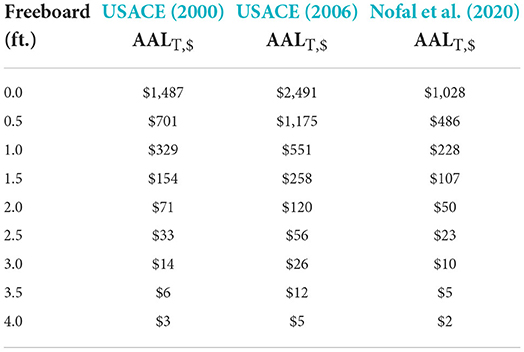
Table 5. As in Table 4, but for damage initiation point of −1 ft relative to FFH.
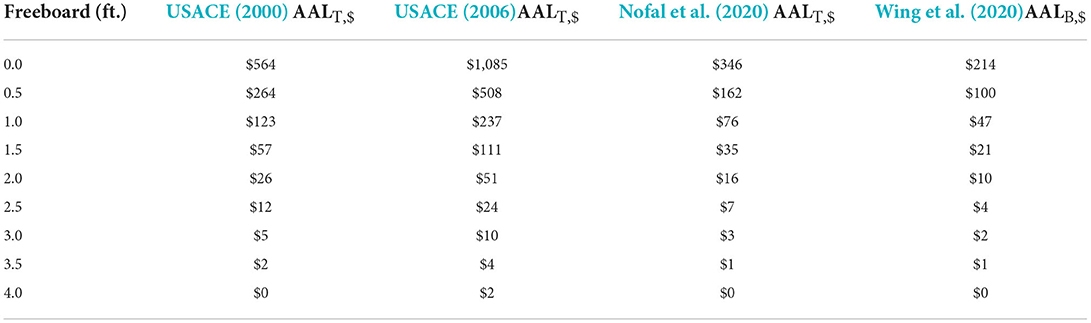
Table 6. As in Table 4, but for damage initiation point of 0 ft relative to FFH, and including Wing et al. (2020).
With respect to total AAL results of the functions, USACE (2000) and Nofal et al. (2020) estimates are very similar in all flood depths. However, the area-specific USACE (2006) function consistently results in a higher AAL compared to the generic USACE (2000) and Nofal et al. (2020) functions. The low AAL estimates from Table 6 are expected given that damage below FFH adds significantly to the AAL because of the higher probabilities of lower return period flood events. Not surprisingly, the Wing et al. (2020) AAL estimates are lower, as this function considers only the building loss.
Discussion
Flood loss reduction is an immediate benefit gained by increasing freeboard. Other benefits include savings on insurance premiums, less distress and suffering, faster disaster recovery, and ideally increased home value. The result of this work demonstrated that flood protection is often feasible and economically advantageous with added freeboard. Additionally, applying building-level assessments as a part of larger-scale risk estimations yield more detailed results.
In the first existing AAL implementation, the annual probabilities are based on available data without modeling the probability of different outcomes. Thus, relatively few and coarse trapezoidal intervals of return periods are used in the numerical integration process. However, the accuracy of the results improves as the number of the trapezoids increase and the intervals become finer (Supplementary Document 3). Also, this implementation excludes events that have an AEP of less than 0.02-percent (i.e., >500-year flood). Of course, in reality, severe flood events can be observed for floods exceeding the 500-year return period, and therefore, excluding longer return periods leads to suboptimal results. While longer return period events cause larger losses, their contribution to the total AAL is relatively small because of their low probability of occurrence, but their inclusion enhances results. In the second existing implementation, loss is modeled separately and Riemann sum integration is used to obtain AAL. This implementation requires separation of the relationship between depth and damage and instead represents flood loss in terms of absolute currency, making temporal or spatial adjustments impossible. In essence, the analysis must be done for every location and time period. The third existing implementation neglects the horizontal distance of the building from the river while estimating AAL. Thus, buildings with similar height difference from the corresponding gauge stations will have similar AAL estimates, although they have different flood hazards. This implementation is suitable for areas adjacent to the river gauge stations where multiple return period flood depths data are not available but is not suitable for low-lying, flood protected areas, such as the case study area. This shortcoming is likely to explain the extreme disagreement between output using this implementation compared with the others, as shown in Table 3.
The approach presented here overcomes the limitation of the first existing AAL implementation by including frequent (i.e., shorter return period) to rare (i.e., longer return period) flood events while estimating the flood loss. This implementation is also more mathematically elegant as it models the relationship between flood depth and AEP, then calculating the loss using depth damage functions where damage is represented as a percentage of building replacement value. It overcomes the limitation of the second existing AAL implementation where loss is not function of flood depth and building replacement value is not linked with flood loss from return periods. Building-specific multiple return period flood depth data were used to characterize the flood hazard. Thus, the flood hazard is represented more accurately at individual building locations. This implementation is suitable for any area whether it is located within a levee protected area or far from river gauge stations.
The sensitivity analysis is performed using different DDFs developed for the US. The degree to which the local conditions of the studied site influence the outcome of loss assessment is examined by comparing the results of the adopted generic USACE (2000) DDF to the results of a USACE (2006) DDF developed by USACE for southern Louisiana, which includes the study site. USACE (2000) is based on actual losses from flood victims' records using data collected from major flooding events that occurred across the U.S. between 1996 and 1998. By contrast, USACE (2006) is derived as average loss percentages from multiple freshwater DDFs with various hydrologic conditions and foundation types that are specific to that area. USACE (2006) was developed using local expert opinion estimates and interviews of the homeowner and commercial sector in southern Louisiana. The results of applying USACE (2000) are also contrasted with the results of recent research by Nofal et al. (2020) and Wing et al. (2020). Nofal et al. (2020) used expert-based data derived from literature and online sources. While Nofal et al. (2020) developed loss functions for multiple archetypes, the loss function corresponding to a one-story, single-family residential building on a crawlspace foundation is adopted here, as it is comparable with the other functions. Data from Wing et al. (2020) represent depth-damage distribution data derived from NFIP flood damage claims over the 1972 to 2014 period. This analysis examines the distribution of depth-damage for different depth increments developed by Wing et al. (2020). These summary statistics are not in the form of a loss function but provide context for more recently derived relationships between depth and damage.
The results of the sensitivity analysis for the location-specific case study demonstrating that AAL estimates vary due to DDF selection given a constant damage initiation point invites further consideration. The 70-year discounted present value of the AAL estimate by DDF and damage initiation point, for discounted rates of 7 and 3 percent are shown in Figures 3A,B, respectively, with a sloping line demarcating the freeboard construction cost estimated as a percentage of building replacement value (FEMA, 2008; Gnan et al., 2022). Curves from the various DDFs that fall above that line for a given freeboard amount indicate a beneficial cost/benefit ratio (i.e., under 1.0) while those below that line indicate an economically disadvantageous cost/benefit ratio (i.e., exceeding 1.0). This analysis will help homeowners in selecting the optimum freeboard for their homes.
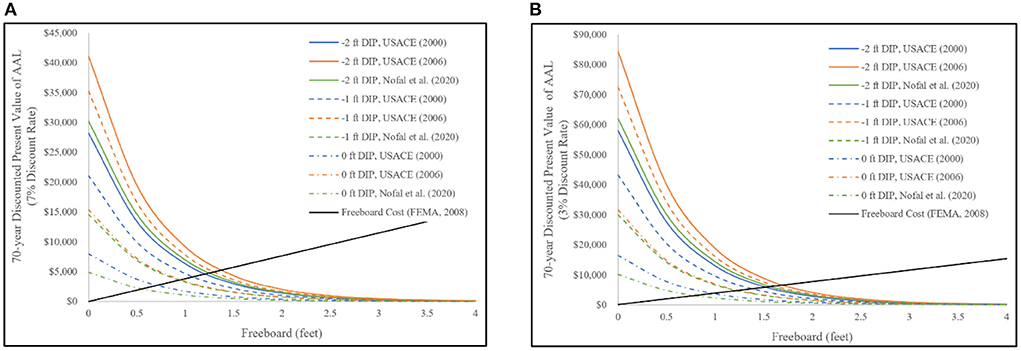
Figure 3. Variability of discounted present value of AAL with freeboard and damage initiation point of different DDF functions, for a 70-year expected building life using a (A) 7% discount rate, (B) 3% discount rate.
Future research should focus on developing building-specific DDFs and identifying the correct damage initiation point—ideally by foundation type. Due to the nature of the study, the risk assessment covered only direct economic losses and did not consider indirect economic losses (e.g., loss of working hours, mental health). To enhance the accuracy of flood loss estimates, more research should focus on estimating these indirect economic losses. Flood risk assessment models are highly constrained by flood data availability. While acknowledging the limitations, this research offers a refinement in flood risk modeling.
Summary and conclusions
Motivated by the increased need to improve loss assessment for flood hazards and flood mitigation, the aim of this research was to present an improved implementation that estimates AAL at the micro-scale level using the Gumbel extreme value distribution. Despite the benefits, many homeowners and communities fail to consider mitigation strategies, which suggests that the potential benefits are not communicated in an effective way. As a result, benefits are largely unrealized by many homeowners and communities.
The implementation assesses flood risk at a single-building level, using its specific flood exposure, as it allows for a more localized and accurate assessment. Micro-scale flood risk assessment is characterized by a higher degree of detail and accuracy. Such an approach supports customized decision-making by location, building configuration, and budget. AAL evaluations conducted on an aggregated spatial basis, in which a particular flood exposure (i.e., flood inundation depth) is applied to all properties in the area, leads to suboptimal results. As the flood depths may vary within one area, the risk assessment will rely on assumptions. The specific findings of this research are:
• The presented implementation is a more mathematically elegant solution than existing approaches, as the AEP is calculated for increasing flood depths above ground, which are correlated to flood depth above FFH and used to determine the relative flood loss.
• The presented implementation uses finer Riemann trapezoids that existing implementations and results in the calculation of lower flood risk than the other three existing methods for the case study home.
• For the case study home in Metairie, Louisiana, 1 ft of freeboard results in annual flood risk reduction of over $1,000, while 4 ft of freeboard results in annual flood risk reduction of nearly $2,000.
• Considerable difference was observed in flood risk results when using damage initiation points below FFH, with AAL values multiple times higher than results where damage was assumed to initiate at the FFH.
• Considerable difference was observed in flood risk results based on DDF, holding the damage initiation point constant. These final two findings underscore the need for more research on DDFs and damage initiation, especially based on foundation type.
These results provide additional support for informing existing flood management solutions, which currently rely on AAL estimates that often yield similar results but can now be compared against Gumbel extreme value-generated estimates. Moving forward, it is beneficial to integrate the life-cycle cost-benefit aspect with this risk assessment. In addition, while this model focused exclusively on single-property risk assessment, it is essential to undertake the same assessments on the community level by applying the risk implementation on a large number of buildings across space. A broader risk analysis could help in identifying potentially vulnerable areas within the targeted region, which could help prioritize future flood risk management strategies. Future work will emphasize the use of uncertainty measures (standard deviations) for loss functions and depth-damage observations. Future work may also consider the effects of climate change in this risk model by updating the predicted annual probability of flood events. Results of such additional work will provide needed information that can be used to further enhance resilience.
Data availability statement
The original contributions presented in the study are included in the article/Supplementary material, further inquiries can be directed to the corresponding author/s.
Author contributions
EG developed the methodology, analyzed the data, interpreted the findings, and drafted the manuscript. CF conceptualized the research idea, helped refine the methodology, and reviewed and edited the manuscript. MR developed the code, worked on the literature review, and edited the text. RM helped to select the study area, prepared the base flood data, organize the paper and edited the manuscript. RR reviewed and edited the manuscript. FO helped organize the paper and methodology. AT provided advice and contributed to the manuscript. JM initially worked on the paper. All authors contributed to the article and approved the submitted version.
Funding
This research was funded by the U.S. Department of Homeland Security (Award Number: 2015-ST-061-ND0001-01), the Louisiana Sea Grant College Program (Omnibus cycle 2020–2022; Award Number: NA18OAR4170098; Project Number: R/CH-03), the Gulf Research Program of the National Academies of Sciences, Engineering, and Medicine under the Grant Agreement number: 200010880. The New First Line of Defense: Building Community Resilience through Residential Risk Disclosure, and the U.S. Department of Housing and Urban Development (HUD; 2019–2022; Award No. H21679CA, Subaward No. S01227-1). Any opinions, findings, conclusions, and recommendations expressed in this manuscript are those of the author and do not necessarily reflect the official policy or position of the funders. The publication of this article is subsidized by the LSU Libraries Open Access Author Fund.
Conflict of interest
The authors declare that the research was conducted in the absence of any commercial or financial relationships that could be construed as a potential conflict of interest.
Publisher's note
All claims expressed in this article are solely those of the authors and do not necessarily represent those of their affiliated organizations, or those of the publisher, the editors and the reviewers. Any product that may be evaluated in this article, or claim that may be made by its manufacturer, is not guaranteed or endorsed by the publisher.
Supplementary material
The Supplementary Material for this article can be found online at: https://www.frontiersin.org/articles/10.3389/frwa.2022.919726/full#supplementary-material
References
Aerts, J. C., Lin, N., Botzen, W., Emanuel, K., and de Moel, H. (2013). Low-probability flood risk modeling for New York City. Risk Anal. 33, 772–788. doi: 10.1111/risa.12008
Apel, H., Aronica, G. T., Kreibich, H., and Thieken, A. H. (2009). Flood risk analyses—how detailed do we need to be? Nat. Hazards 49, 79–98. doi: 10.1007/s11069-008-9277-8
Armal, S., Porter, J. R., Lingle, B., Chu, Z., Marston, M. L., Wing, O. E., et al. (2020). Assessing property level economic impacts of climate in the US, new insights and evidence from a comprehensive flood risk assessment tool. Climate 8. doi: 10.3390/cli8100116
Arrighi, C., Brugioni, M., Castelli, F., Franceschini, S., and Mazzanti, B. (2013). Urban micro-scale flood risk estimation with parsimonious hydraulic modelling and census data. Nat. Hazards Earth Syst. Sci. 13, 1375–1391. doi: 10.5194/nhess-13-1375-2013
Bhola, P. K., Leandro, J., and Disse, M. (2020). Building hazard maps with differentiated risk perception for flood impact assessment. Nat. Hazards Earth Syst. Sci. 20, 2647–2663. doi: 10.5194/nhess-20-2647-2020
Botzen, W. J., and van den Bergh, J. C. (2008). Insurance against climate change and flooding in the Netherlands: present, future, and comparison with other countries. Risk Anal. Int. J. 28, 413–426. doi: 10.1111/j.1539-6924.2008.01035.x
Burningham, K., Fielding, J., and Thrush, D. (2008). ‘It'll never happen to me': Understanding public awareness of local flood risk. Disasters 32, 216–238. doi: 10.1111/j.1467-7717.2007.01036.x
Chen, A. S., Hammond, M. J., Djordjević, S., Butler, D., Khan, D. M., Veerbeek, W., et al. (2016). From hazard to impact: Flood damage assessment tools for mega cities. Nat. Hazards, 82, 857–890. doi: 10.1007/s11069-016-2223-2
Cunnane, C. (1989). Statistical distributions for flood frequency analysis. World Meteorological Organization Operational Hydrology Report, No. 33, Geneva. Available online at: https://library.wmo.int/doc_num.php?explnum_id=1695 (accessed June 30, 2022.)
Dalezios, N. R. (2017). Environmental Hazards Methodologies for Risk Assessment and Manage.. London: IWA Publishing. doi: 10.2166/9781780407135_0002
Desai, B., Maskrey, A., Peduzzi, P., De Bono, A., and Herold, C. (2015). Making Development Sustainable: The Future of Disaster Risk Manage.. Global Assessment Report on Disaster Risk Reduction. Geneva, Switzerland: United Nations Office for Disaster Risk Reduction (UNISDR). Available online at: https://archive-ouverte.unige.ch/unige:78299 (accessed November 5, 2021.).
Ernst, J., Dewals, B. J., Detrembleur, S., Archambeau, P., Erpicum, S., Pirotton, M., et al. (2010). Micro-scale flood risk analysis based on detailed 2D hydraulic modelling and high resolution geographic data. Nat. Hazards 55, 181–209. doi: 10.1007/s11069-010-9520-y
Evans, E., Hall, J., Penning-Rowsell, E., Sayers, P., Thorne, C., Watkinson, A., et al. (2006). Future flood risk management in the UK. Proc. Inst. Civil Eng. Water Manage. 159, 53–61. doi: 10.1680/wama.2006.159.1.53
Falter, D., Dung, N. V., Vorogushyn, S., Schröter, K., Hundecha, Y., Kreibich, H., et al. (2016). Continuous, large-scale simulation model for flood risk assessments: Proof-of-concept. J. Flood Risk Manage. 9, 3–21. doi: 10.1111/jfr3.12105
FEMA (2008). 2008 supplement to the 2006 evaluation of the national flood insurance program's building standards. Retrieved from: https://www.wbdg.org/ffc/dhs/criteria/fema-2008-supp-2006-eval-nfip-stand
FEMA (2013). Multi-hazard Loss Estimation Methodology: Flood Model Hazus-MH Technical Manual. Washington, DC: Department of Homeland Security, Federal Emergency Management Agency, Mitigation Division. Available online at: https://www.fema.gov/flood-maps/tools-resources/flood-map-products/hazus/user-technical-manuals (accessed November 5, 2021.).
FEMA (2022). Risk Mapping, Assessment and Planning (Risk MAP). Available online at: https://www.fema.gov/flood-maps/tools-resources/risk-map (accessed April 12, 2022).
Gnan, E., Friedland, C. J., Mostafiz, R. B., Rahim, M. A., Gentimis, T., Taghinezhad, A., et al. (2022). Economically optimizing elevation of new, single-family residences for flood mitigation via life-cycle benefit-cost analysis. Front. Environ. Sci. Water Wastewater Manage. doi: 10.1002/essoar.10510798.3
Hall, J. W., Sayers, P. B., and Dawson, R. J. (2005). National-scale assessment of current and future flood risk in England and Wales. Nat. Haz. 36, 147–164. doi: 10.1007/s11069-004-4546-7
Hawkesbury-Nepean Floodplain Management Steering Committee (2006). Managing flood risk through planning opportunities: guidance on land use planning in flood prone areas. New South Wales: Metro Graphics Group Pty Ltd. Available online at: https://flooddata.ses.nsw.gov.au/flood-projects/hawkesbury-nepean-floodplain-Manage.-strategy-implementation (accessed November 5, 2021).
Hino, M., and Hall, J. W. (2017). Real options analysis of adaptation to changing flood risk: structural and nonstructural measures. ASCE-ASME J. Risk Uncertain. Eng. Syst, Part A: Civil Eng. 3, 04017005. doi: 10.1061/AJRUA6.0000905
Hsu, W. K., Huang, P. C., Chang, C. C., Chen, C. W., Hung, D. M., Chiang, W. L., et al. (2011). An integrated flood risk assessment model for property insurance industry in Taiwan. Nat. Haz. 58, 1295–1309. doi: 10.1007/s11069-011-9732-9
Koks, E. E., Bočkarjova, M., de Moel, H., and Aerts, J. C. (2015). Integrated direct and indirect flood risk modeling: development and sensitivity analysis. Risk Anal. 35, 882–900. doi: 10.1111/risa.12300
Kumar, R., and Bhardwaj, A. (2015). Probability analysis of return period of daily maximum rainfall in annual data set of Ludhiana, Punjab. Indian J. Agric. Res. 49, 160–164. doi: 10.5958/0976-058X.2015.00023.2
Kunreuther, H. C., and Michel-Kerjan, E. O. (2007). Climate change, insurability of large-scale disasters and the emerging liability challenge. Univ. Penn. Law Rev. 155, 1795–1842. doi: 10.3386/w12821
Lamb, R., Keef, C., Tawn, J., Laeger, S., Meadowcroft, I., Surendran, S., et al. (2010). A new method to assess the risk of local and widespread flooding on rivers and coasts. J. Flood Risk Manage. 3, 323–336. doi: 10.1111/j.1753-318X.2010.01081.x
Lorente, P. (2019). A spatial analytical approach for evaluating flood risk and property damages: Methodological improvements to modelling. J. Flood Risk Manage. 12, e12483. doi: 10.1111/jfr3.12483
Lüdtke, S., Schröter, K., Steinhausen, M., Weise, L., Figueiredo, R., Kreibich, H., et al. (2019). A consistent approach for probabilistic residential flood loss modeling in Europe. Water Resour. Res. 55, 10616–10635. doi: 10.1029/2019WR026213
Malakar, K. D. (2020). Flood frequency analysis using Gumbel's method: a case study of Lower Godavari River Division, India. J. Sci. Comput. 2, 33–51.
Markus, A. A., Courage, W. M. G., and van Mierlo, M. C. L. M. (2010). A computational framework for flood risk assessment in the Netherlands. Sci. Programm. 18, 93–105. doi: 10.1155/2010/782402
Merz, B., Vorogushyn, S., Lall, U., Viglione, A., and Blöschl, G. (2015). Charting unknown waters—On the role of surprise in flood risk assessment and management. Water Resour. Res. 51, 6399–6416. doi: 10.1002/2015WR017464
Meyer, V., Haase, D., and Scheuer, S. (2009). Flood risk assessment in European river basins—concept, methods, and challenges exemplified at the Mulde river. Integr. Environ. Assess. Manage. 5, 17–26. doi: 10.1897/IEAM_2008-031.1
Meyer, V., Scheuer, S., and Haase, D. (2008). A multicriteria approach for flood risk mapping exemplified at the Mulde river, Germany. Nat. Hazards, 48, 17–39. doi: 10.1007/s11069-008-9244-4
Mol, J. M., Botzen, W. W., Blasch, J. E., and de Moel, H. (2020). Insights into flood risk misperceptions of homeowners in the Dutch River Delta. Risk Anal. 40, 1450–1468. doi: 10.1111/risa.13479
Montgomery, M., and Kunreuther, H. (2018). Pricing storm surge risks in Florida: Implications for determining flood insurance premiums and evaluating mitigation measures. Risk Anal. 38, 2275–2299. doi: 10.1111/risa.13127
Moselle, B. (2018). 2019 National Building Cost Manual. 43rd Edn. Carlsbad, CA: Craftsman Book Company. Available online at: https://www.craftsman-book.com/media/static/previews/2019_NBC_book_preview.pdf (accessed November 5, 2021).
Mostafiz, R. B., Friedland, C., Rahim, M. A., Rohli, R., and Bushra, N. (2021). A data-driven, probabilistic, multiple return period method of flood depth estimation. In Am. Geophys. Union Fall Meet. 2021. doi: 10.1002/essoar.10509337.1
Multihazard Mitigation Council (2017). Natural Hazard Mitigation Saves 2017 Interim Report: an Independent Study. Washington: National Institute of Building Sciences. Available online at: https://epdmroofs.org/wp-content/uploads/2018/04/ms2_2017interim-report.pdf (accessed November 5, 2021).
Nofal, O. M., van de Lindt, J. W., and Do, T. Q. (2020). Multi-variate and single-variable flood fragility and loss approaches for buildings. Reliab. Eng. Syst. Saf. 202, 106971. doi: 10.1016/j.ress.2020.106971
Oliver, J., Qin, X. S., Madsen, H., Rautela, P., Joshi, G. C., Jorgensen, G., et al. (2019). A probabilistic risk modelling chain for analysis of regional flood events. Stochastic Environ. Res. Risk Assess. 33, 1057–1074. doi: 10.1007/s00477-019-01681-3
Olsen, A. S., Zhou, Q., Linde, J. J., and Arnbjerg-Nielsen, K. (2015). Comparing methods of calculating expected annual damage in urban pluvial flood risk assessments. Water 7, 255–270. doi: 10.3390/w7010255
Onen, F., and Bagatur, T. (2017). Prediction of flood frequency factor for Gumbel distribution using regression and GEP model. Arab. J. Sci. Eng. 42, 3895–3906. doi: 10.1007/s13369-017-2507-1
Pandey, A. C., Singh, S. K., and Nathawat, M. S. (2010). Waterlogging and flood hazards vulnerability and risk assessment in Indo Gangetic plain. Nat. Hazards, 55, 273–289. doi: 10.1007/s11069-010-9525-6
Parker, D. J., Priest, S. J., and Tapsell, S. M. (2009). Understanding and enhancing the public's behavioural response to flood warning information. Meteorol. Appl. 16, 103–114. doi: 10.1002/met.119
Patel, M. B. (2020). Flood frequency analysis using Gumbel distribution method at Garudeshwar Weir, Narmada Basin. Int. J. Trend Res. Dev. 1, 36–38.
Shan, X., Wen, J., Zhang, M., Wang, L., Ke, Q., Li, W., et al. (2019). Scenario-based extreme flood risk of residential buildings and household properties in Shanghai. Sustainability 11. doi: 10.3390/su11113202
Shen, D., Qian, T., Chen, W., Chi, Y., and Wang, J. (2019). A quantitative flood-related building damage evaluation method using airborne LiDAR data and 2-D hydraulic model. Water 11. doi: 10.3390/w11050987
Singh, P., Sinha, V. S. P., Vijhani, A., and Pahuja, N. (2018). Vulnerability assessment of urban road network from urban flood. Int. J. Dis. Risk Reduc. 28, 237–250. doi: 10.1016/j.ijdrr.2018.03.017
USACE (2000). Economic Guidance Memorandum (EGM) 01-03, Generic Depth Damage Relationships. Washington, DC: US Army Corps of Engineers. Available online at: https://planning.erdc.dren.mil/toolbox/library/EGMs/egm01-03.pdf (accessed November 5, 2021.).
USACE (2006). Depth-Damage Relationships for Structures, Contents, and Vehicles and Content-to-Structure Value Ratios (CSVR) in Support of the Donaldsville to the Gulf. Louisiana, Feasibility Study. Washington, DC: US Army Corps of Engineers. Available online at: https://www.mvn.usace.army.mil/Portals/56/docs/PD/Donaldsv-Gulf.pdf (accessed November 5, 2021.)
USACE (2015). North Atlantic Coast Comprehensive Study: Resilient Adaptation to Increasing Risk. Washington, DC: US Army Corps of Engineers. Available online at: https://www.nad.usace.army.mil/Portals/40/docs/NACCS/10A_PhysicalDepthDmgFxSummary_26Jan2015.pdf (accessed November 5, 2021.)
Ward, P. J., Jongman, B., Weiland, F. S., Bouwman, A., van Beek, R., Bierkens, M. F. P., et al. (2013). Assessing flood risk at the global scale: Model setup, results, and sensitivity. Environ. Res. Lett. 8, 044019. doi: 10.1088/1748-9326/8/4/044019
Wilkins, J. G., Emmer, R. E., Hwang, D., Kemp, G. P., Kennedy, B., Mashriqui, H., et al. (2008). Louisiana Coastal Hazard Mitigation Guidebook. Baton Rouge: Louisiana Sea Grant College Program. Available online at: https://tamug-ir.tdl.org/handle/1969.3/28993 (accessed November 5, 2021.).
Wing, O. E., Pinter, N., Bates, P. D., and Kousky, C. (2020). New insights into US flood vulnerability revealed from flood insurance big data. Nat. Commun. 11, 1–0. doi: 10.1038/s41467-020-15264-2
Winsemius, H. C., Van Beek, L. P. H., Jongman, B., Ward, P. J., and Bouwman, A. (2013). A framework for global river flood risk assessments. Hydrol. Earth Syst. Sci. 17, 1871–1892. doi: 10.5194/hess-17-1871-2013
Keywords: flood risk assessment, average annual loss, exceedance probability, freeboard, depth damage function, Gumbel distribution
Citation: Gnan E, Friedland CJ, Rahim MA, Mostafiz RB, Rohli RV, Orooji F, Taghinezhad A and McElwee J (2022) Improved building-specific flood risk assessment and implications of depth-damage function selection. Front. Water 4:919726. doi: 10.3389/frwa.2022.919726
Received: 10 May 2022; Accepted: 21 July 2022;
Published: 10 August 2022.
Edited by:
Hamed Moftakhari, University of Alabama, United StatesReviewed by:
Jorge Leandro, University of Siegen, GermanyK. S. Kasiviswanathan, Indian Institute of Technology Roorkee, India
Copyright © 2022 Gnan, Friedland, Rahim, Mostafiz, Rohli, Orooji, Taghinezhad and McElwee. This is an open-access article distributed under the terms of the Creative Commons Attribution License (CC BY). The use, distribution or reproduction in other forums is permitted, provided the original author(s) and the copyright owner(s) are credited and that the original publication in this journal is cited, in accordance with accepted academic practice. No use, distribution or reproduction is permitted which does not comply with these terms.
*Correspondence: Md Adilur Rahim, bXJhaGltNkBsc3UuZWR1