 Hannah Greenwald1,2
 Lauren C. Kennedy1,2,3
 Aliya Ehde1,2,4Yanghua Duan1,2Christopher I. Olivares1,5
 Rose Kantor1,2†
 Kara L. Nelson1,2*†
- 1Department of Civil and Environmental Engineering, University of California, Berkeley, Berkeley, CA, United States
- 2National Science Foundation Engineering Research Center for Re-Inventing the Nation's Urban Water Infrastructure, Stanford, CA, United States
- 3Department of Civil and Environmental Engineering, Stanford University, Stanford, CA, United States
- 4Division of Environmental and Ecological Engineering, Purdue University, West Lafayette, IN, United States
- 5Department of Civil and Environmental Engineering, University of California, Irvine, Irvine, CA, United States
Drinking water stagnation can lead to degradation of chlorine residual, bacterial growth (including of opportunistic pathogens and nitrifiers), and metals release from plumbing materials; however, few studies have characterized building water quality and bacterial communities during the extended stagnation periods that occurred during COVID-19 pandemic-related building closures. Additionally, despite a lack of evidence-based guidance, flushing fixtures has been recommended to restore building water quality. We aimed to evaluate the impacts of reduced building occupancy (>2 months) and weekly restorative flushing on drinking water quality, bacterial communities, and the occurrence of undesirable microorganisms in three university buildings. Reduced occupancy led to diminished chloramine and elevated intact cell counts, but values remained stable after additional weeks of limited water use. Flushing temporarily improved water quality, with chlorine and cell counts remaining stable for at least 1 day but returning to levels measured prior to flushing within 1 week. Alpha diversity was lower under more stagnant conditions, and fixture identity, not flushing, was the most influential factor on bacterial community composition, suggesting a strong influence from local biofilm. Although Mycobacterium, Legionella, Pseudomonas, Nitrosomonas, and Nitrospira were detected in samples via amplicon sequencing, concentrations measured via qPCR of M. avium complex, L. pneumophila, P. aeruginosa, and ammonia-oxidizing bacteria were very low or were undetected, supporting that stagnation alone did not lead to high occurrence of undesirable microorganisms. Findings from this study contribute to our understanding of the effects of stagnation on building water microbiomes and the efficacy of flushing to improve water quality. Under the conditions of this case study, repeated flushing on a weekly timescale during low occupancy periods was not sufficient to maintain chlorine residual and prevent bacterial growth in fixtures. Building managers need to weigh the temporary water quality benefits of flushing against the labor and water resources required considering local context.
Introduction
Although intermittent short-term drinking water stagnation occurs on a regular basis in continuously-supplied building water systems (e.g., overnight or weekend stagnation), extended stagnation (on the time scale of weeks to months) is less common but still occurs during holidays on campuses, construction, and evacuations during natural disasters. In spring 2020, to prevent the spread of COVID-19, students and workers in many sectors were placed under shelter-in-place orders and shifted to schooling or working from home as a part of social distancing measures. This population shift within cities led to significant changes in drinking water use patterns and decreases in water demand in many non-residential areas (Poch et al., 2020), including college campuses. Previous research has indicated that stagnation of drinking water can be associated with increased chemical and microbial contaminants, such as plumbing metals (e.g., lead, copper), disinfection byproducts, nitrifying organisms, and opportunistic pathogens (e.g., Legionella pneumophila, non-tuberculous mycobacteria, Pseudomonas aeruginosa; Lytle and Schock, 2000; Council, 2006; Rhoads et al., 2016; CDC, 2020; Nisar et al., 2020). These elevated chemical and microbial contaminants can result from physicochemical changes caused by increased water age, including disinfectant residual decay, temperatures trending toward ambient, destabilization of corrosion scale and biofilm, release of metals, and changes in the composition and concentration of bioavailable nutrients (Ling et al., 2018; Chen et al., 2020). Poor water quality is a particular concern in building plumbing compared to pipes within distribution systems because of longer water age and higher surface-area-to-volume ratios, which may lead to increased metal leaching from pipe materials, enhanced biofilm formation, and greater decay rates of disinfection residuals (Zlatanović et al., 2017). Building plumbing characteristics are also highly complex and variable across buildings, making it difficult to predict where water quality may be a concern. For example, recent studies have found that contaminant levels had high spatial variability across fixtures within the same building (Völker et al., 2016; Salehi et al., 2018) and across buildings within the same distribution system (Dowdell et al., 2022). More research is needed to unravel how particular building plumbing characteristics and water usage patterns affect water quality.
Although many studies have used targeted approaches to study specific opportunistic pathogens in building water (Bargellini et al., 2011; Springston and Yocavitch, 2017; Haig et al., 2018; Aw et al., 2022; Dowdell et al., 2022), a holistic understanding of microbial communities in building water is lacking, which could provide insight into how to control the growth of microbial contaminants, especially during disturbances in operation (Proctor et al., 2022). Opportunistic pathogens (e.g., Legionella pneumophila, Mycobacterium avium, Pseudomonas aeruginosa) have become the leading cause of waterborne disease in the United States and other industrialized countries (Ashbolt, 2015; Falkinham et al., 2015, p. 201; Proctor et al., 2022), costing the United States $2.39 billion annually (Collier et al., 2021). In addition to pathogen occurrence during stagnation, growth of bacteria may lead to aesthetic issues and proliferation of other problematic microorganisms, such as nitrifiers. Nitrification can accelerate the decay of chloramine disinfectants, elevate nitrate levels in drinking water, and cause localized pH depressions that increase corrosion (Odell et al., 1996; Zhang and Edwards, 2009). Previous water microbiome studies have shown that stagnation as short as 8 h is a significant driving force for shifts in building water bacterial communities and that fixtures can present different communities than more central plumbing (Lautenschlager et al., 2010; Ji et al., 2015, 2017; Ling et al., 2018). However, a better understanding is needed of how factors related to building water system design and operation influence the water microbiome at the point of use.
During the COVID-19 pandemic, fears of health risks from exposure to stagnated water in low-occupancy or newly-reopened buildings led to calls for intensive remedial actions, but evidence-based guidance regarding many elements of building water management are lacking (Singh et al., 2020). Multiple protocols were published that recommended extensive flushing of fixtures to replace stagnant water with water from the distribution system (Bates and Root, 2020; CDC, 2020; Proctor et al., 2020; Rhoads and Hammes, 2020; United States Environmental Protection Agency, 2020; EPA, 2021a,b; United States Centers for Disease Control Prevention, 2021, p. 20). However, recommendations in these protocols may be prohibitively difficult to implement without sufficient knowledge of plumbing system design, access to water quality testing, and designated labor resources. As there are no requirements for monitoring microbial targets in building water systems, we have a limited understanding of how effective these strategies are—including when not performed optimally—at reducing occurrence of microbial contaminants and how repeated flushing may alter microbial communities. In a recent study, flushing after 2 months of stagnation restored chloramine residual and decreased bacterial gene targets to building main concentrations within 30 min, but concentrations rebounded to stagnation levels after 6–7 days (Hozalski et al., 2020). More research is needed to determine how long and how often flushing should be conducted and in which circumstances a flushing program may effectively restore water quality, in order to create clear consensus guidelines for building managers on how to maintain or restore water quality after building closures.
COVID-19 shutdowns created a unique opportunity to study the effects of prolonged stagnation in building plumbing on drinking water quality and take preventative measures. The objectives of this study were to evaluate the impacts of reduced building occupancy and weekly restorative flushing on: (i) drinking water quality, (ii) bacterial communities, and (iii) occurrence of undesirable microorganisms. Water quality in three full-scale buildings was monitored from May to July 2020, beginning at least 2 months after occupancy was reduced. Samples were analyzed for total and intact cell counts, and bacterial community composition was characterized using 16S rRNA gene amplicon sequencing. To better understand the presence of nitrifiers and opportunistic pathogens, a subset of samples were cultured for L. pneumophila, and qPCR was conducted targeting ammonia-oxidizing bacteria, L. pneumophila, M. avium complex, and P. aeruginosa. To contextualize microbial data, we measured general water quality parameters (chlorine, temperature, pH, dissolved oxygen, conductivity), plumbing metals (Pb, Cu, Fe, Zn), and nitrogen species. Results from this study provide insights into factors influencing the building water microbiome and approaches for responding to future disruptions in building water system operation.
Materials and methods
Study site characteristics and conditions
The San Francisco Bay Area shelter-in-place order took effect on March 17, 2020 leading to the closure of academic buildings on the University of California, Berkeley campus to all but essential activities. In the residence halls, occupancy was reduced to 2–3% in April 2020 and 0% by May 17, 2020. One academic building (Building D) and two residence halls (Buildings S and B) were monitored in this study. After March 17, 2020, water usage decreased to 7% of pre-pandemic levels by April 2020 in Building D due to limited occupancy (custodial services and essential research). Laboratories in Building D reopened at reduced occupancy on June 30, 2020. We partnered with facilities staff to flush the building on a weekly basis beginning June 4, 2020 (more details in Section Fixture flushing). No intentional flushing was performed in the residence halls during the study period, although some maintenance work was conducted (the last custodial service was performed 2 weeks after move-out). The study site was in a warm-summer Mediterranean climate region with average outdoor air temperatures ranging from 8 to 23°C during the study period (Weather averages Berkeley, California, 2022).
All buildings studied were served by the same drinking water treatment facility, with surface water as the source and chloramine as the secondary disinfectant. Most drinking fountains (“fountains;” D3F, D6F, B1F, S0F) sampled in the study had point-of-use treatment via activated carbon filters (ELKAY WaterSentry Plus, Part No. 51300C for EWF3000). Water heaters were set to 71°C with tempering valves to reduce the temperature to 49°C. Additional details on the sampling timeline, building characteristics, sampled fixture characteristics, building water usage, and assays performed at each sampling event are included in Figure 1, Table 1, and Supplementary Tables S1–S3, respectively. Fixture IDs used throughout the manuscript and figures are written as the building (D, S, B), floor number (1–7), and fixture type (H = hot/mixed faucet, L = laboratory faucet, F = drinking fountain, C = cold faucet). Temperature categories refer to the plumbing system from which samples originated (cold, hot, or industrial) and are not necessarily indicative of the measured water temperature.
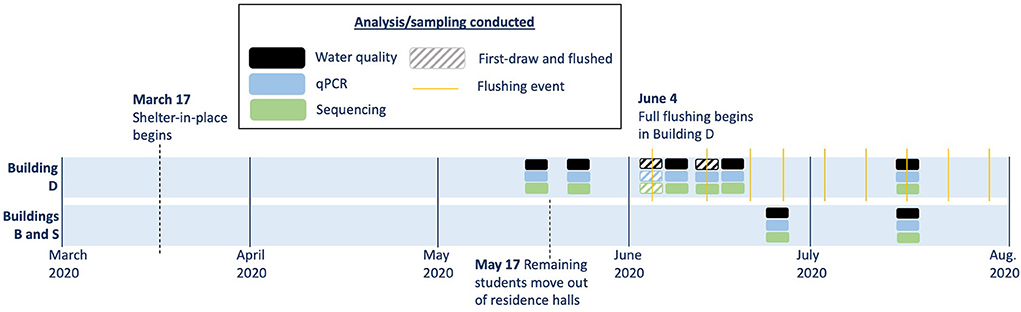
Figure 1. Timeline of sampling in the three study buildings. Solid boxes indicate sampling conducted only prior to flushing, and hashed boxes indicate paired sampling events before and after flushing.
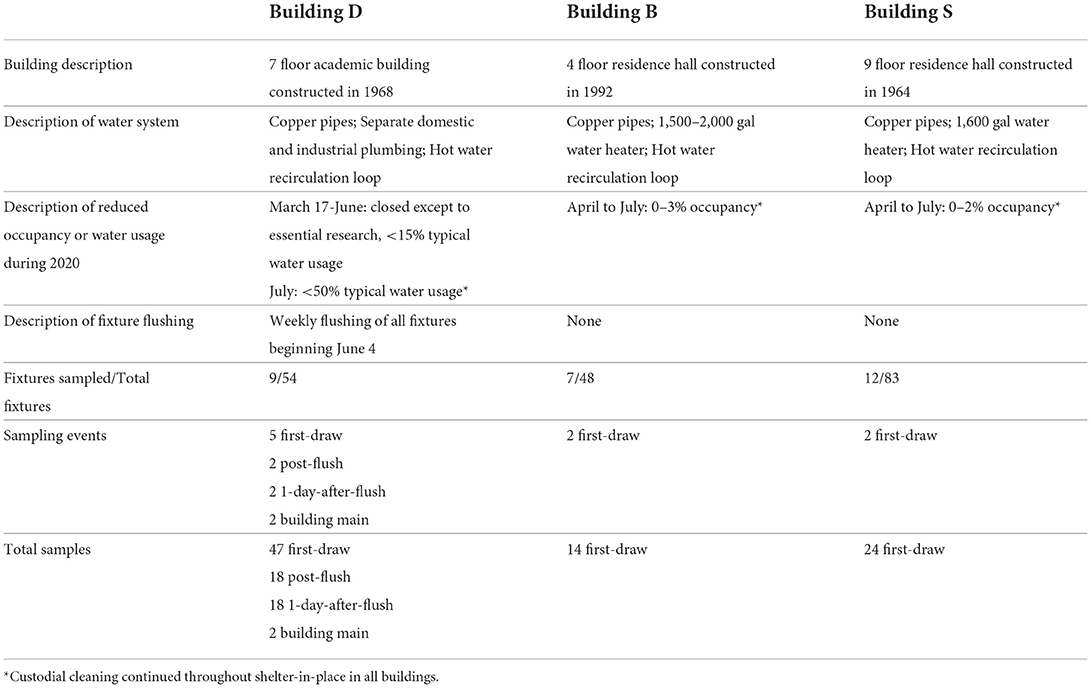
Table 1. Descriptions of study buildings, conditions, and sampling events.
Fixture flushing
In building D, weekly full-building flushing was performed beginning June 4, 2020 (Figure 1). Many guidance documents recommend volume- or water-quality-based flushing of the full building water system (Bates and Root, 2020; United States Environmental Protection Agency, 2020; United States Centers for Disease Control Prevention, 2021), and flushing on a weekly timescale has been proposed for infrequently-used or dead-end plumbing (United States Centers for Disease Control Prevention, 2021). Volume-based flushing could not be performed due to the absence of as-builts or updated plumbing diagrams for this building. During flushing on June 4, fixtures were flushed until the temperature stabilized to <1°C/min or up to 10 min on each water line. However, moderate ambient temperatures as well as thermal mixing valves at some fixtures made the distinction between fresh and stagnant water ambiguous and limited the ability to conduct temperature-based flushing. During subsequent weeks, time-based flushing was performed, with fixtures opened to their full flow rate (without the removal of aerators or other flow-reduction devices) for 10 min on cold or mixed (if a thermal mixing valve was present) followed by 10 min on hot (if a hot water line was present). The flush times (20 min at most fixtures) were based on comparisons with previous time-based flushing guidance of 5–30 min (Lautenschlager et al., 2010; Lipphaus et al., 2014; Louisville Water Company, 2020) as well as time limitations of building staff, which is likely to be a limiting factor in many buildings. Flushing was conducted one floor at a time, starting with the lowest floor, closest to the water main. An estimated 2,100 L was flushed during each building event based on flow rate measurements of each type of fixture, the number of fixtures flushed, and the duration flushed. On May 14, 2020 and May 21, 2020, partial flushing was performed where only fixtures on the top two floors were flushed for 10 min total (hot and cold valves were opened simultaneously if both were present). Fixture flushing was not performed in buildings S and B during the study period.
Sample collection and storage
“First-draw” samples were defined as samples collected at least 7 days after a flushing event or recorded usage, although most were longer. “Post-flush” samples were collected within 6 h of an intentional flushing event at that fixture. “One-day-after-flush” samples were collected 22–26 h after an intentional flushing event at that fixture. The building influent (“main”) samples were collected from an outlet connected to the water meter after flushing for 10 min. Each first-draw, 1-day-after-flush, and main sample consisted of collecting the first two liters into a sterile container and then splitting onsite into subsamples for further analyses. Consistent first-draw sample volumes are important because cell counts in subsequent building plumbing water samples have been shown to vary greatly (Ling et al., 2018). Post-flush samples, where water quality was not expected to vary significantly across consecutive volumes, generally consisted of 500 mL, but the full 2 L was collected for some samples on June 4 to provide sufficient volumes for molecular analysis. Samples were immediately aliquoted onsite for chemical measurements. Chlorine was quenched in the remaining water sample using excess sodium thiosulfate for downstream flow cytometry, culture, and molecular analysis. Samples were kept in coolers on ice during transport to the lab, stored at 4°C, and processed within 24 h.
Chemical water quality
Total chlorine and free chlorine were measured onsite with DPD Hach methods 8167 and 8021, respectively, both with a limit of detection (LoD) of 0.02 mg/L as Cl2. Temperature, pH, conductivity, and dissolved oxygen were measured onsite with a Thermo Scientific STAR A326 Portable Meter. Dissolved oxygen was likely higher than conditions within the plumbing because the point of measurement was after fixture aerators and after aliquoting the sample for multiple assays. Ion chromatography was utilized to measure nitrate (n = 109), nitrite (n = 109), and ammonium (n = 95) in triplicate on a Dionex ICS 1100 ion exchange chromatograph (LoD: nitrate = 0.06 mg/L, nitrite = 0.13 mg/L, ammonium = 0.5 mg/L). Metals (i.e., Pb, Cu, Mn, Fe, Zn) were analyzed in most samples (n = 124) using an Agilent 7700 Series Inductively Coupled Plasma-Mass Spectrometer (ICP-MS) with assay limits of detection in Supplementary Table S4. Values below the LoD were substituted with the LoD for that run divided by the square root of two. Prior to ICP-MS analysis, water samples (1 mL) were acidified with 4 mL of 1% HNO3 and 0.5% HCl. Samples were analyzed for total organic carbon (TOC) on a Shimadzu TOC-V analyzer.
Cell counts by flow cytometry
Total and intact cell concentrations were measured following methods previously described in Miller et al. (2020) and Kennedy et al. (2020) using an Accuri™ C6 flow cytometer (BD Biosciences). In brief, triplicate 500 μL sample aliquots were stained with SYBR Green I (Sigma Aldrich) to identify total cells (TCC) or were stained with both SYBR Green I and propidium iodide (Life Technologies) to distinguish cells with intact membranes (ICC). Measurements were performed at the “fast” flow rate of 66 μL per min on sample volumes of 50 μL with an excitation wavelength of 488 nm and threshold of 800 on the green fluorescence channel. Microbial cell signals were distinguished and enumerated from background and instrument noise on density plots of green (FL1; 533 ± 30 nm) and red (FL3; >670 nm) fluorescence using gate templates previously developed for water samples (Gatza et al., 2013). The lower limits of quantification were determined for intact cell count (22 cells/mL) and total cell count (12 cells/mL) by Miller et al. (2020). For a negative control, 0.22 μm filtered, Millipore Milli-Q water was used. The ratio of intact cells was calculated by dividing ICC by TCC.
DNA concentration and extraction
DNA collection and extraction followed methods previously described (Vosloo, 2019). Briefly, biomass from water samples (1.5 L) was filter-concentrated on the day of sampling using peristaltic pumps, autoclaved silicone tubing, and in-line 0.2 um PES filters (Millipore Sterivex). Filters were stored at −80°C until extraction. DNA extraction was conducted using a modified DNeasy PowerWater kit (Qiagen) protocol which involves physical, chemical, and enzymatic lysis steps (Brandt and Albertsen, 2018; Vosloo, 2019). In brief, filters were cut with a scalpel, inserted into tubes with lysozyme (Thermo Fisher) and Tris EDTA, and incubated shaking at 37°C for 60 min. Next, kit reagent PW1 (Qiagen) and Proteinase K (Life Technologies) were added followed by incubation with shaking at 56°C for 30 min. Chloroform/isoamyl alcohol (Acros Organics) was added, and then samples underwent bead beating for 40 s in lysing matrix E tubes (Thomas Scientific). After centrifugation, the aqueous phase was transferred to new tubes, and the PowerWater kit was used following manufacturer protocols. DNA was quantified using the Qubit dsDNA HS assay (Life Technologies) and then stored at −80°C until downstream analyses. An extraction negative control (unused filter) was included in every batch. Dilutions of a commercially available mock community (ZymoBIOMICS Microbial Community Standard; cat. 6300) were extracted as positive controls.
qPCR and culture for targets of interest
Culturable Legionella pneumophila was measured via the Legiolert kit (IDEXX) following manufacturer protocols for 100 mL of potable water on a subset of 28 samples (Supplementary Table S3). Residual disinfectant in water samples was quenched using sodium thiosulfate prior to testing. Hardness supplement was added as per manufacturer instructions for low hardness samples, after testing for hardness using dip strips supplied as part of the Legiolert Supplement kit. Positive (Legionella pneumophila ATCC 33152) and negative (Enterococcus faecalis ATCC 29212) controls were included according to manufacturer recommendations.
For 104 samples (Supplementary Table S3), quantitative real-time PCR (qPCR) was performed on a QuantStudio3 Real-Time PCR System qPCR machine (Thermo Fisher) for four targets of interest: the bacterial ammonia monooxygenase gene of ammonia-oxidizing bacteria (amoA; Rotthauwe et al., 1997), the macrophage infectivity potentiator gene of L. pneumophila (mip; Nazarian et al., 2008), polymorphic regions of ITS sequences of Mycobacterium avium complex (MACF/MACR; Whiley et al., 2014), and the oprL gene of Pseudomonas aeruginosa (oprL; Feizabadi et al., 2010). Reactions consisted of 1 μL template in a 10 μL reaction, except for amoA in which 5 μL of template was included in a 20 μL reaction (Supplementary Table S5). The mip and oprL assays were probe-based and used TaqMan Environmental Master Mix 2.0 (Applied Biosystems) while amoA and MACF/MACR assays used PowerUp Sybr Green Master Mix (Applied Biosystems). Sequences of primers, probes, and amplicons are provided in Supplementary Table S6. Cycling conditions followed master mix manufacturer recommendations but were optimized for individual laboratory conditions (Supplementary Table S6). Each plate contained no-template controls (PCR water) and a standard curve consisting of synthetic DNA (gBlock, IDT) of known concentrations spanning 5 to 105 gene copies (gc) per reaction. All samples, standards, and controls were analyzed in technical triplicate. Standard curve efficiencies ranged from 89.5 to 114.6% with R2 of 0.971 to 0.998 (Supplementary Table S7). None of the no-template controls (NTCs) amplified throughout the study.
Minimum Information for Publication of Quantitative Real-Time PCR Experiments (MIQE) and Environmental Microbiology Minimum Information (EMMI) guidelines were followed (Bustin et al., 2009; Borchardt et al., 2021). To determine the limit of detection (LoD) and limit of quantification (LoQ), 12 replicates of standard material were run across at least three plates. The LoD was defined as the interpolated gene copy number where 95% of standard technical replicates amplified, and the LoQ was defined as the interpolated gene copy number where the coefficient of variation of standard technical replicates was 35% (Borchardt et al., 2021; Supplementary Table S8). Samples were classified as detectable if at least two of three replicate wells amplified and as positive if the average concentration was also above the LOD. Inhibition was assessed by spiking a subset of DNA extract with standard materials and measuring the target at four dilutions. Any dilution with a measured Cq that deviated more than 1 Cq from expected was considered inhibited. No assay inhibition was detected (Supplementary Table S9).
Library preparation and amplicon sequencing
All extracted samples underwent library preparation for 16S rRNA gene amplicon sequencing of the v4 hypervariable region using a previously optimized protocol (Kozich et al., 2013) with slight modifications. In brief, a single PCR was performed followed by a bead cleanup (Ampure XP, Beckman Coulter, ratio of 1.8 ×) and an additional bead cleanup for size selection (ratio of 0.9 ×). Amplicon lengths were confirmed with an E-Gel™ Double Comb Agarose Gels with SYBR™ Safe DNA Gel Stain, 1% (Thermo Fisher Scientific) with an E-Gel Low Range Quantitative DNA Ladder (Thermo Fisher Scientific). Libraries were pooled based on quantification with Qubit with an HS dsDNA kit and verified using a nano kit on an Illumina MiSeq run, then repooled. The final pool was quantified using fragment analysis and qPCR, and paired-end sequencing was performed on an Illumina MiSeq v3 (600 cycles) at the Vincent J. Coates Genomics Sequencing Laboratory at the University of California, Berkeley.
Data analysis
Data analysis was conducted using R version 4.1.3. As water quality data were non-normal (Shapiro–Wilk's, R function shapiro.test, p < 0.001), hypothesis testing was conducted using Kruskal–Wallis (R function kruskal.test) followed by the non-parametric pairwise Wilcoxon rank sum test (“Mann–Whitney,” R function wilcox.test) with a significance threshold of 0.05, and correlations were computed using rank-based Kendall's tau-b (R function cor) to account for tied values.
The 16S rRNA gene amplicon sequences were curated using the DADA2 pipeline (v1.16; Callahan et al., 2016) and phyloseq (v1.38) in R. Taxonomy classification of amplicon sequence variants (ASVs) was conducted using the Silva database (v138.1; https://zenodo.org/record/4587946; McLaren and Callahan, 2021). Decontamination and differential gene abundance analysis were performed using DESeq2 (v1.34; Love et al., 2014). Rarefaction curves for all samples plateaued, suggesting sufficient sequencing depth (Supplementary Figure S1). Because of the absence of singletons after the DADA2 pipeline, Shannon Index was chosen to estimate alpha diversity because it does not give additional weight to rare ASVs, such as singletons (Chiarello et al., 2022). Dissimilarity matrices of environmental variables were constructed using Euclidean distances, while dissimilarity matrices of bacterial abundance were constructed using Aitchison distances (Euclidean distance after a clr transformation) due to the compositional nature of the data (Gloor et al., 2017). Non-parametric, permutational ANOVA (PERMANOVA) was used to test differences in community composition using the adonis function in vegan (v2.5-7; Oksanen, 2007). Using the Best Subset of Environmental Variables with Maximum Rank Correlation with Community Dissimilarities analysis (bioenv, v2.4-2), we selected the most influential variables on the Aitchison dissimilarity of ASV abundance from the following measured quantitative parameters: total chlorine, free chlorine, conductivity, temperature, pH, DO, TOC, Cu, Fe, Zn, Mn, ammonium, and nitrate. Variables were then narrowed down to only those that were significant to the redundancy analysis (RDA; envfit in vegan). Principal components analysis (PCA) ordination was performed using the selected, significant environmental variables (prcomp in stats v3.6.2). Redundancy analysis (RDA) ordination was performed using both Aitchison dissimilarity of community composition data and the selected, significant environmental variables (ordinate in phyloseq).
Figures were curated using ggplot2 (3.3.5). The full R pipeline and associated data are available on GitHub (https://github.com/hannahgreenwald/COVID19-building-water). Sequencing data were deposited in NCBI SRA (BioProject PRJNA836918).
Results
This study consisted of 121 drinking water samples collected from buildings experiencing reduced occupancy on the University of California, Berkeley campus. In Building D, an academic building, 47 first-draw samples (defined as at least 7 days after a flushing event or normal occupancy) were collected from nine fixtures and the building main between May and July 2020, beginning 2 months after the start of shelter-in-place. An additional 18 post-flush samples (defined as <6 h after flushing) and 18 1-day-after-flush samples (defined as 22–26 h after flushing) were collected after two flushing events conducted in Building D. In two residence halls, 24 first-draw samples were collected from 12 fixtures in Building S, and 14 first-draw samples were collected from seven fixtures in Building B in June and July 2020 (Supplementary Table S3).
Water quality during extended reductions in building water usage and flushing
Total and intact cell counts were influenced by fixture type and chlorine during stagnation
In first-draw samples, intact cell counts (ICC) spanned four orders of magnitude, from 3.3 × 10² cells/mL to 1.1 × 10⁶ cells/mL, and total cell counts (TCC) ranged from 1.2 × 10³ cells/mL to 2.4 × 10⁶ cells/mL (Figure 2). The proportion of intact cells (ICC:TCC) ranged from 17 to 86%. Ranges in ICC and proportion of intact cells were similar for first-draw samples from all three buildings. Samples from the building D main represented the lowest end of ICC and TCC ranges (geometric mean ICC: 6.6 × 10² cells/mL, TCC: 8.0 × 10³ cell/mL; Figure 3) in the fixtures, with an even lower proportion intact (mean proportion intact: 4%). ICC across fixture types (cold faucet, hot/mixed faucet, shower, lab, drinking fountain) were significantly different (Kruskal–Wallis, p < 0.001; Supplementary Figure S2), with the highest concentrations in the fountains (geometric mean: 9.5 × 10⁴ cells/mL) and showers (geometric mean: 1.0 × 10⁵ cells/mL). Considering only residence halls (where all study showers were located), fountains had even higher intact cell ratios (B median: 59%, S median: 79%) than showers (B median: 49%, S median: 62%). In addition, fountains consistently had high proportions of intact cells even through flushing (median: 62–63%), suggesting that filters preceding fountains aided bacterial growth and seeded viable microorganisms into the water.
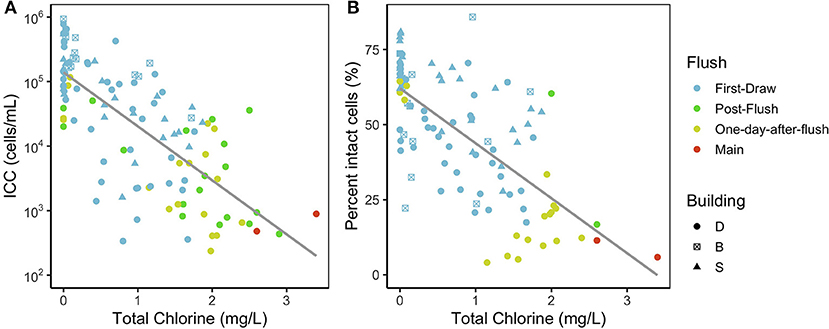
Figure 2. (A) Intact cell counts and (B) proportion of intact cells vs. total chlorine concentrations measured in each sample. Fewer points are plotted in panel B because TCC was not measured in most post-flush samples (Supplementary Table S3). The gray line is a linear regression plotted as a visual aid. ICC and the proportion of intact cells were both negatively correlated with chlorine (Kendall's tau-b of −0.52 and −0.53, respectively).
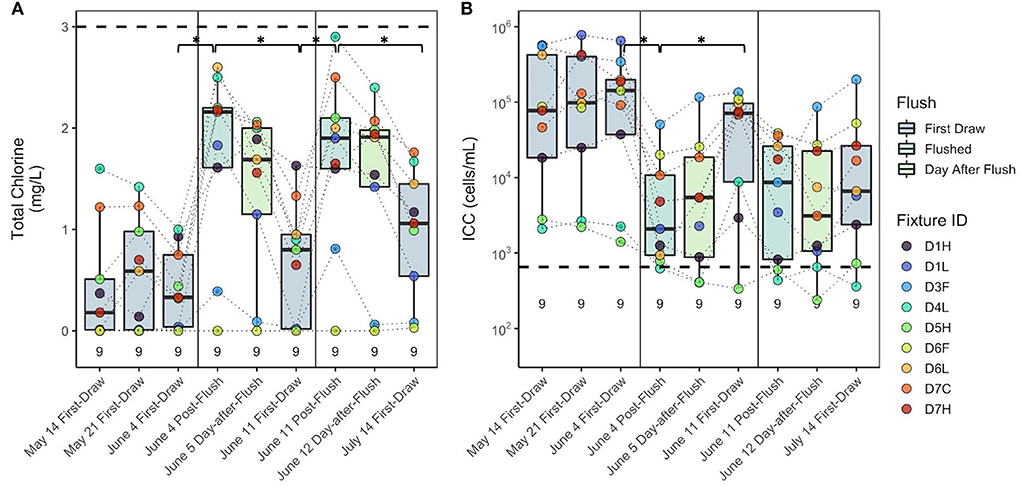
Figure 3. (A) Total chlorine and (B) intact cell counts before and after multiple flushing events in building D. Dashed lines represent the average value from the building main during this period. Values above the x axis represent sample count (n). Fixture IDs in the legend are written as the building (D), floor number (1–7), and fixture type (H, hot/mixed faucet; L, laboratory faucet; F, drinking fountain; C, cold faucet). Brackets with asterisks (*) indicate groups of samples that were significantly different (p < 0.05). Box edges correspond to the first quartile, median, and third quartile. Whiskers extend from the edge to the largest and smallest values no further than 1.5× the interquartile range from the edge. Data beyond the whiskers are considered outliers and plotted individually.
Of the physicochemical parameters, total chlorine correlated most strongly with ICC (Kendall's tau-b: −0.52, p < 0.001). Both ICC and the proportion of intact cells had a clear inverse relationship with chlorine concentration (Figure 2) that has been previously reported (Gillespie et al., 2014; Nescerecka et al., 2014; Kennedy et al., 2020). In first-draw samples, total chlorine ranged from 0 to 1.87 mg/L. Non-zero chlorine concentrations perhaps indicated leaks or water usage between sampling at some fixtures, but first-draw samples (more stagnant water) still had lower chlorine and higher intact cells than the other flush conditions (Figure 2). Water samples with lower chlorine—and presumably lower water use—tended to also have lower DO, lower pH, higher conductivity, and higher ICC (Supplementary Figure S3).
Water quality improved through the first building flushing event but rebounded on a weekly timescale
The impact of flushing on water quality was studied in building D following two flushing events on June 4 and June 11. In general, the highest cell counts and lowest chlorine were measured in first-draw samples, followed by 1-day-after-flush, post-flush, and then building main samples (Figure 2). Prior to the first all-fixture flushing event, total chlorine and ICC were not significantly different among the first-draw samples collected on May 14, May 21, and June 4 (Kruskal–Wallis, p = 0.90 and p = 0.95, respectively; Figure 3). After the first all-fixture flushing event on June 4, residual chlorine in fixtures was significantly higher (Wilcoxon, p = 0.015), and there was a 94% decrease in ICC (p = 0.005) from a geometric mean concentration of 6.2 × 10⁴ to 3.4 × 10³ cells/mL (Figure 3). After flushing, values of chlorine and ICC at fixtures were generally lower and higher, respectively, than at the building main (Figure 3). The chlorine concentrations 1 day after flushing were not different from immediately after flushing, but were significantly lower 1 week after flushing (p = 0.030). Cell counts again trended inversely with chlorine concentrations. There was no significant regrowth 1 day after flushing (p = 0.86), but ICC was 644% higher7days after flushing (June 4 to June 11, p = 0.031). After the June 11 flushing event, chlorine was significantly higher, but ICC was not significantly lower (p = 0.06). Again, chlorine and cell counts were not significantly different between post-flush and 1-day-after-flushing (p = 0.60 and p = 0.74, respectively). Median dissolved oxygen concentrations were higher after flushing on June 4 and remained stable for the duration of the study. Although high, outlier concentrations of metals occurred in individual samples, sometimes after flushing, concentrations at building fixtures are not regulated. For comparison, few samples had concentrations of metals and nitrogen species exceeding thresholds for drinking water distribution systems set by USEPA National Primary Drinking Water Regulations and Secondary Drinking Water Standards (Supplementary Table S10). Trends in conductivity and nitrate seemed to be a function of time and possibly the quality of distributed water rather than flushing (Supplementary Figure S4).
At the three fixtures with the lowest intact cell counts (Figure 3), evidence of water usage beyond flushing was observed, which could have contributed to the lessened impact of flushing on water quality. Fixture D5H (building D, fifth floor, hot water) was noted to be leaking at a slow drip prior to each sampling event. Although slight, this water flow may have been enough to maintain chlorine residuals and low cell counts throughout the study period, such that flushing had less of an impact at this fixture. When D5H was removed from earlier analyses, the decrease in cell counts during the June 11 flushing event became significant. The other fixtures with some observed water usage were D4L (building D, fourth floor, laboratory), where lab personnel maintained some activity, and D1H (building D, first floor, hot water), where signs of dishwashing were observed on later sampling dates. No known use occurred at other fixtures. These observations are in line with Lipphaus et al. (2014), in which cell counts increased most after stagnation in fixtures that were frequently used prior to stagnation and decreased most after flushing in fixtures that were used least.
In the residence halls, median total chlorine concentrations and ICC were not significantly different in samples from the two sampling events 3 weeks apart (Supplementary Figure S5). However, some of the concentrations at individual fixtures were higher or lower during the second sampling event. Other water quality parameters (e.g., temperature, dissolved oxygen, pH, and conductivity) also remained stable (Supplementary Figure S7).
Bacterial communities during extended reductions in building water usage and flushing
We explored changes to the bacterial community during stagnation and flushing using 16S rRNA gene amplicon sequencing. Of 91 samples sequenced, 73 were first-draw samples (38 from building D, 13 from building B, 22 from building S), three were post-flush (building D), 13 were 1-day-after-flush (building D), and two were from the building main (building D). A high proportion of sequenced DNA originated from intact cells (Figure 2B), especially in first-draw samples.
Across all sample types, bacterial families observed at the highest relative abundance included Comamonadaceae, Beijerinckiaceae, Caulobacteraceae, Sphingomonadaceae, Xanthobacteraceae, and Chitinophagaceae. The most abundant ASVs were classified within the genera Curvibacter, Microvirga, Phenylobacterium, and Mycobacterium. All these taxa have been previously identified in drinking water distribution systems (Shirey et al., 2012; Buse et al., 2014; Douterelo et al., 2014; Gomez-Alvarez et al., 2016; Wang et al., 2021; Lu et al., 2022).
Stagnation led to reductions in bacterial community diversity
Alpha diversity, calculated as Shannon Index (see Section Data analysis for metric selection) which incorporates richness and evenness, decreased in more stagnant water (building main > post-flush > 1-day-after-flush > first-draw; Figure 4). This trend was consistent when other alpha diversity metrics were considered (Supplementary Figure S7) and when only paired samples from each flush condition were included (Supplementary Figure S8). The Shannon Indices of first-draw samples were significantly lower than the other flush conditions (Wilcoxon, vs. post-flush: p = 0.013, vs. day-after-flush: p < 0.001, vs. main: p = 0.029). This lower alpha diversity indicates that microbial growth in building plumbing during stagnation selected for a subgroup of taxa. It should be noted that higher diversity in the building main samples could be a reflection of DNA from nonviable cells because these samples had lower intact cell ratios than the other flush conditions (Figure 2B). Alpha diversity in the first-draw samples of the residence halls (not flushed) and building D (flushed weekly) did not show a clear trend with time (Supplementary Figure S9).
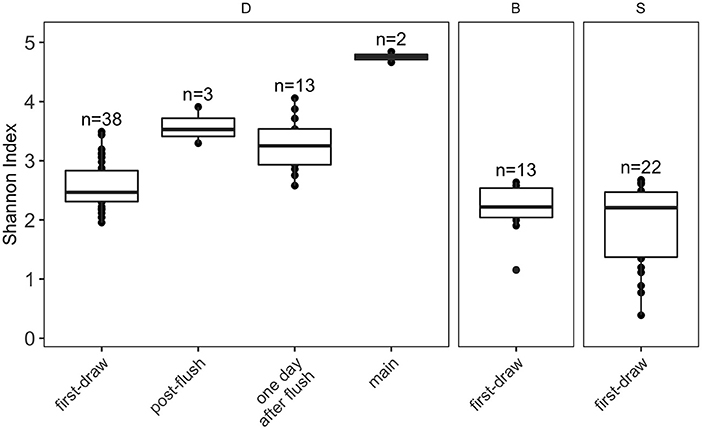
Figure 4. Boxplots of alpha diversity metric Shannon Index. Plots are faceted by buildings (D, academic; B and S, residence halls). Box edges correspond to the first quartile, median, and third quartile. Whiskers extend from the edge to the largest and smallest values no further than 1.5× the interquartile range from the edge. Data beyond the whiskers are considered outliers and plotted individually.
Bacterial communities diverged at the fixture level and remained consistent through flushing
Overall, we expected bacterial communities of post-flush samples to resemble the building main and to be similar across fixtures. However, even as cell counts drastically changed after flushing, bacterial community compositions appeared stable (Figures 5, 6B, Supplementary Figures S10–S13). Bacterial community composition was most significantly influenced by fixture identity (PERMANOVA R2 = 58%), followed by building (R2 = 12%) and sampling event (R2 = 8%, p < 0.001), but not fixture type (p = 0.61). When considering only building D and incorporating the added variable of flush condition, fixture identity remained the most important variable (R2 = 51%) followed by sampling event (R2 = 12%) and flush condition (R2 = 9%; p < 0.001), while fixture type was again not significant (p = 0.78).
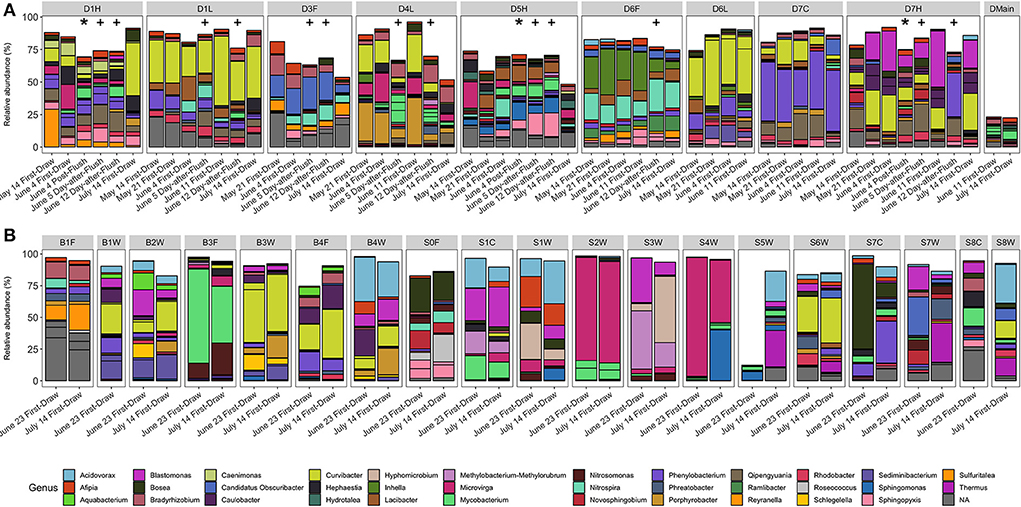
Figure 5. Relative abundance (%) of ASVs in (A) building D and (B) residence halls grouped by fixture. Segments are ASVs representing at least 5% of two samples, and colors are genera. Asterisks (*) indicate post-flush samples, and plus signs (+) indicate 1-day-after-flush samples. Facets are by fixture ID which are written as one letter indicating the building (D, B, S), followed by the floor number (0–7), followed by one letter indicating the fixture type (W, shower; L, laboratory faucet; F, drinking fountain; H, hot/mixed faucet; C, cold faucet).
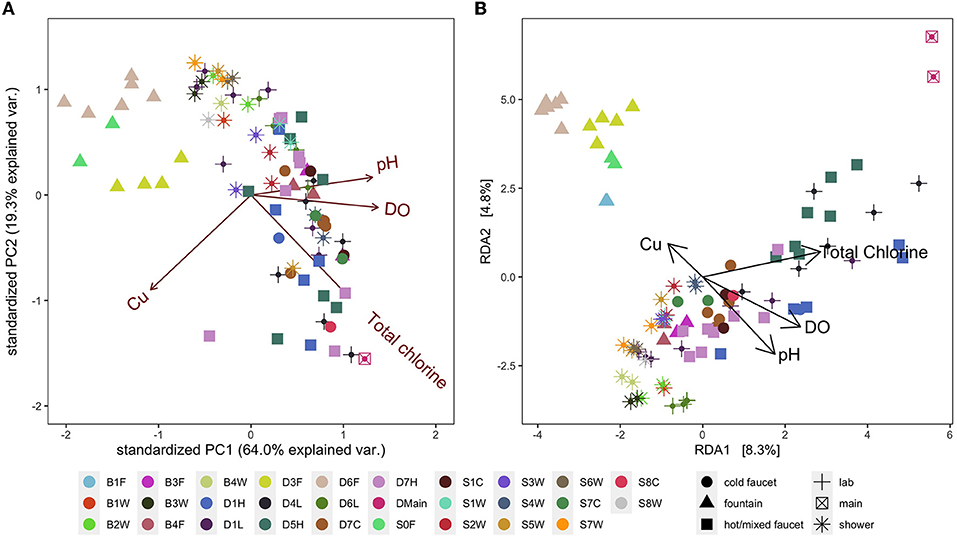
Figure 6. (A) Principal components analysis (PCA) biplot of selected, significant environmental variables. (B) Aitchison distance redundancy analysis (RDA) biplot illustrating the relationship between selected, significant environmental variables and bacterial community composition. Colors represent fixture ID which is written as one letter indicating the building (D, B, S), followed by the floor number (0–7), followed by one letter indicating the fixture type (W, shower; L, laboratory faucet; F, drinking fountain; H, hot/mixed faucet; C, cold faucet). Shapes represent fixture type for added visual clarity.
To further investigate whether any ASVs were enriched in each flush condition, we performed differential abundance analysis (DESeq2). We hypothesized that any unique ASVs in post-flush samples (not in building main or first-draw) were derived from biofilm detached during flushing; however, we were unable to identify any ASVs that were enriched in the post-flush samples over first-draw and samples from the building main. Some ASVs were enriched at the fixture level relative to the building main (assigned to genera Qipengyuania, Phenylobacterium, Lacibacter, Rhodobacter, Methylophilus, and UTBCD1). Reyranella, a genus associated with growth in drinking water biofilms on copper pipes (Pagnier et al., 2011; van der Kooij et al., 2020), was significantly enriched in more stagnant conditions (first-draw > 1-day-after-flush > post-flush samples). Overall, the observation of consistent, fixture-specific bacterial communities suggests that localized biofilm communities could be contributing strongly to the bulk water communities recovered from each fixture.
Environmental factors explained a small percentage of variance in fixture bacterial communities
Similar to community composition data, water quality parameters (total chlorine, free chlorine, temperature, conductivity, pH, dissolved oxygen, TOC, ICC, Mn, Fe, Zn, Cu, ammonium, and nitrate) were significantly influenced by fixture identity (PERMANOVA R2 = 0.82) and building (R2 = 0.09) but not by sampling date or fixture type (p = 0.73 and p = 0.61, respectively), indicating a unique environment at each fixture (Figure 6A). Median values generally indicated typical water quality and are summarized in Supplementary Table S11; however, some samples had water quality values far outside the typical range (e.g., minimum DO of 3.02 mg/L despite a median of 8.49 mg/L).
In addition to the relevance of chemical water quality parameters to safety and aesthetics, chemical concentrations (e.g., TOC, Mn, Fe) can also impact microbial abundance and composition (Prest et al., 2016; Vosloo et al., 2022, p. 20). We examined which chemical parameters may be driving clustering of bacterial communities at the fixture level and found the best model (Best Subset of Environmental Variables with Maximum Rank Correlation with Community Dissimilarities analysis using bioenv) had eight parameters: DO, pH, total chlorine, Mn, Fe, conductivity, Cu, and ammonium. Redundancy analysis (RDA) using the selected variables and ASV abundance data indicated that the significant variables included total chlorine, Cu, pH, and DO (envfit, p < 0.001, p = 0.008, p < 0.001, p < 0.001, respectively). In the RDA ordination, bacterial communities in samples clustered by fixture identity along axes of the environmental variables; however, the axes of the RDA biplot constructed using these variables explained a fairly low percentage of the variance in community composition (Figure 6B). In addition, fixture type did not appear to impact clustering except for drinking fountains with point-of-use activated carbon filters (D3F, D6F, B1F, and S0F).
Targeted detection of opportunistic pathogens and nitrifiers during extended reductions in building water usage and flushing
Through amplicon sequencing, the presence of ASVs from genera containing opportunistic pathogens and nitrifiers was identified, including Legionella, Mycobacterium, Pseudomonas, Nitrosomonas, and Nitrospira. We used targeted detection of genes (qPCR for L. pneumophila, P. aeruginosa, Mycobacterium avium complex, and ammonia-oxidizing bacteria) or species-specific culture (Legiolert) to further explore whether undesirable microorganisms were present during this period of reduced water usage and elevated cell counts.
Detection of gene targets via qPCR was low, with the majority of samples (n = 99 of 104) below both the empirically-determined limits of quantification (LoQ; defined as maximum 35% coefficient of variation in standard replicates) and detection (LoD; defined as minimum 95% detection of standard replicates) for all assays, preventing quantitative analysis. However, because no amplification was observed in any no-template control, we extended our analysis to include samples in which amplification was observed with corresponding concentrations below the LoD (but with amplification in at least two wells). For these reasons, we present qPCR data in three groups of positivity: quantifiable (>LoQ), amplification at a concentration less than the LoD, and no amplification (no samples had mean concentration between the LoD and LoQ).
Opportunistic pathogen prevalence was low despite high cell counts and detection of associated genera
Although Legionella spp. seemed to be present in this system (Legionella spp. comprised 0.1% of ASVs), L. pneumophila was detected at very low levels via qPCR, close to or below the LoD (4.1 gc/reaction and ~820 gc/L; Supplementary Table S8). The majority of samples had no amplification, 20% amplified below the LoD, no samples had mean concentrations between the LoD and LoQ, and 3% were quantifiable (442–903 gc/L; Figure 7). Forty-three percent of fixtures with detectable L. pneumophila had detections at multiple time points. Interestingly, in fixture D1H, L. pneumophila was detected before flushing and then dissipated over time. There were no clear relationships between water quality parameters (e.g., ICC, chlorine, Mn, Fe) and L. pneumophila positivity (Supplementary Figure S14). Detection of P. aeruginosa was even lower than detection of L. pneumophila, with no detection in 94% of samples and 6% amplifying below the LoD (Figure 7). Pseudomonas spp. comprised 0.01% of ASVs across study samples. Similarly, 99% of samples had no detection of Mycobacterium avium complex (MAC), and 1% amplified below the LoD (Figure 7). Based on sequencing, Mycobacterium spp. comprised 5% of ASVs overall, so other species besides M. avium were present in the samples. Detection of Legionella, Mycobacterium, and Pseudomonas by sequencing had some but not complete overlap with detection of corresponding qPCR gene targets (Supplementary Figure S15).
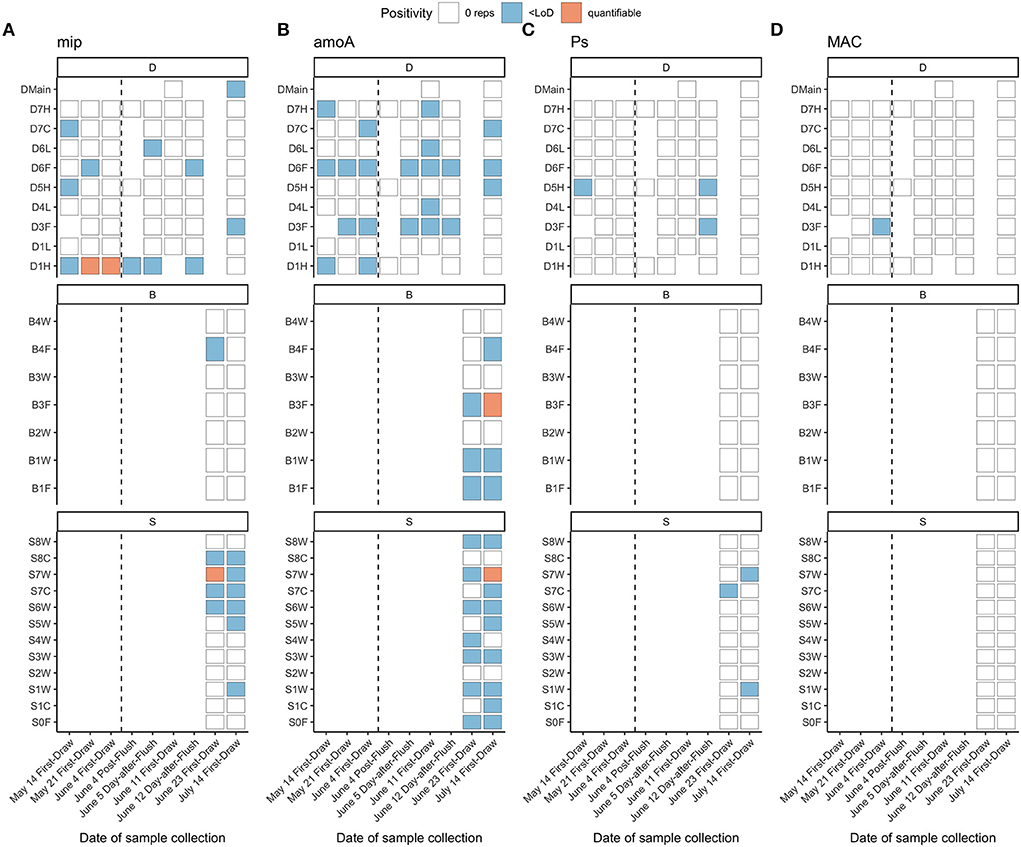
Figure 7. qPCR detection of (A) L. pneumophila (mip), (B) ammonia-oxidizing bacteria (amoA), (C) P. aeruginosa (oprL) and (D) MAC (MACF/MACR). Vertical dashed lines indicate a flushing event in building D separating two sample collection events on the same day. Sample S6W was positive for L. pneumophila via culture-based Legiolert on June 23, 2020. Fixture IDs are written as one letter indicating the building (D, B, S), followed by the floor number (0 to 7), followed by one letter indicating the fixture type (W, shower; L, laboratory faucet; F, drinking fountain; H, hot/mixed faucet; C, cold faucet).
Via culture, all samples were non-detects for L. pneumophila, except for one residence hall shower sample (Building SB, 6th floor) taken on June 23 (positivity n = 1 of 28 samples, 3.6%). The resulting concentration was 10 MPN/L, which is at the limit of detection for the Legiolert test kit (10 cells/L; Legiolert: Detection of Legionella pneumophila- IDEXX US [WWW Document], 2018). Although a false positive rate of 3–4% has previously been reported for this method (Hirsh et al., 2021; Lytle et al., 2021, p. 20; Monteiro et al., 2021), the corresponding detection of mip via qPCR (< LoD; Figure 7) supports that L. pneumophila was present in this sample.
There was evidence of nitrifiers but not nitrification within the building plumbing
Nitrosomonas spp., a genus with ammonia-oxidizing bacteria (AOB), was detected in many samples via amplicon sequencing (1.4% of overall ASVs), but detection did not fully align with qPCR detection of AOB (Supplementary Figure S15). AOB were not detected in 58% of samples, and 40% amplified below the LoD (Figure 7). Two samples from residence halls on July 14 were quantifiable with concentrations of 282 and 640 gc/L, after AOB had been detected but below the detection limit 3 weeks prior. Despite low concentrations of AOB, detection of AOB was fairly consistent across fixtures where it was present (64% of fixtures had detectable levels across multiple time points). All drinking fountains had detectable AOB at one or more time points.
Samples with detectable AOB (quantifiable and < LoD vs. non-detect) had higher intact cell counts and lower total chlorine (Wilcoxon, p < 0.001; Supplementary Figure S14), relationships that have been observed previously (Lipponen et al., 2002; Scott et al., 2015). However, there were no differences in nitrate or ammonium concentrations corresponding to flush condition nor AOB detection (Kruskal–Wallis, p > 0.05). Despite detection of AOB in multiple fixtures but not the building D main, nitrate was not higher at the fixtures than in the building main samples; instead, nitrate concentrations in the main and fixtures had similar trends over time. For example, both nitrate and ammonium were much higher in most fixtures and in the building D main on July 14 (Supplementary Figures S4, S6), despite no observable increases in AOB. The water utility operating the distribution system serving these buildings has regularly reported issues with nitrification, especially during warmer months (e.g., July). Together, these observations suggest that any meaningful nitrification activity may have occurred in the distribution system but not in building plumbing.
Discussion
Water quality during periods of reduced water usage
Bacterial growth was likely limited by chlorine and then substrate
The pandemic provided an opportunity to study building plumbing stagnation (both complete stagnation and reduced usage) on the timescale of months, whereas previous studies have focused on shorter time frames. Here, the highest concentrations of ICC exceeded the highest concentrations previously reported in the literature both in distribution systems (Gillespie et al., 2014; Nescerecka et al., 2014; Prest et al., 2016; Kennedy et al., 2020) and in stagnant building water (Lipphaus et al., 2014). Surprisingly, increases in cell counts 1 day after flushing were not significant, although prior studies on overnight building water stagnation have reported increases (Lautenschlager et al., 2010). Meanwhile, the increase in cell counts 1 week after flushing aligns with previous studies (Lautenschlager et al., 2010; Lipphaus et al., 2014; Hozalski et al., 2020; Zhang et al., 2021).
Chlorine concentrations clearly suppressed bacterial concentrations when present (Figure 2), but once the disinfectant residual had decayed, substrate limitations determined the ultimate bacterial abundance. Decay of disinfectant residual has often been associated with an increase in bacterial abundance at long residence times (Niquette et al., 2001; Nescerecka et al., 2014); however, in distribution systems without residual disinfectant, previous studies report that bacterial abundance has not necessarily increased and has sometimes decreased with residence time, likely due to substrate limitations (van der Wielen and van der Kooij, 2010). In this study, the timescale to reach the carrying capacity for microorganisms was on the order of days to weeks, based on various lines of evidence. First, the timescale was <3 months of stagnation (the time between building closures and the first sampling event in the residence halls) because ICC in the residence halls was stable between the two sampling events, despite diminished chlorine and an additional 3 weeks of stagnation. Second, the timescale was <2 months of stagnation (the time between building closures and the first sampling event in building D) because ICC was consistent until the first flushing event on June 4. Last, the return of ICC to first-draw levels within a week of flushing suggests that a limit to cell growth had been reached in that timescale.
Microbial hazards after stagnation appeared low
Chloramine as a residual disinfectant has been shown to be more effective than free chlorine at suppressing L. pneumophila (Kool et al., 1999; Flannery et al., 2006; Wang et al., 2012; Lytle et al., 2021), even in stagnant conditions or when the residual disinfectant is no longer detectable (Hozalski et al., 2020; Dowdell et al., 2022), which is consistent with our findings. The lower positivity rate for Legiolert compared to qPCR (despite Legiolert having a lower limit of detection) indicates that the DNA detected via qPCR likely came from either viable but not culturable (VBNC) cells, which could still present a health hazard (Alleron et al., 2013; Dietersdorfer et al., 2018), or non-viable cells. Detections of members of the genus Legionella via amplicon sequencing could also have come from an array of other species that may or may not be pathogenic (e.g., L. anisa and L. rubilucens; UK PHE, 2022). These low abundance results do not contradict prior studies that have shown stagnation to increase levels of L. pneumophila and increased flow to reduce levels (Nisar et al., 2020). Rather, this study shows that stagnation alone may not be enough to lead to colonization. Other stochastic ecological effects, such as whether L. pneumophila has been introduced to the building system, and physicochemical effects, such as disinfectant type, likely play key roles.
Given the low detection of pathogenic gene targets in this study, the primary negative consequence of reduced occupancy on microbial water quality seemed to be the increase in bulk bacterial concentrations. Although not a health hazard, excessive microbial activity can lead to deterioration in aesthetic quality (e.g., taste, odor and discoloration; Chowdhury, 2012), which represents up to 80% of consumer complaints to water utilities (Polychronopolous et al., 2003; Vreeburg and Boxall, 2007). Although detection of opportunistic pathogens via qPCR was low (3% of samples had quantifiable targets), risk varies based on the immune status of individual occupants in the building and the level of exposure, and this level of hazard could become significant in other buildings, such as a residential healthcare facility.
Another explanation for low overall detection of undesirable microorganisms could be the small sample volume (1 L) that was filtered to collect biomass for downstream molecular analysis. For example, the L. pneumophila qPCR assay had a detection limit of 820 gc/L, which [depending on the conversion from gene copies to colony-forming units (CFU)] would likely be sufficient to rule out unacceptable risk at faucets (1.02 × 10⁵ CFU/L) and showers (1,400 CFU/L) based on thresholds proposed using a 10−4 disability adjusted life year per person per year target (Hamilton et al., 2019). Future studies should consider analyzing larger sample volumes to achieve a lower LoD, despite the trade-off of diluting high cell counts in primary first-draw volumes. More work is needed to standardize sampling for opportunistic pathogens and determine risk tolerance.
The building water microbiome during reduced water use and flushing
Prior work (Lipphaus et al., 2014; Dowdell et al., 2022) has suggested that water quality management during stagnation events should focus on risk factors at the building scale that can influence opportunistic pathogen growth. Our results further show that individual fixtures within buildings present distinct bacterial communities which may be of more or less concern. We expected flushing to change bacterial community composition (Ling et al., 2018); however, the effect of fixture identity influenced the community composition more strongly than flush condition, supporting the importance of historical contingency in building water microbial community assembly (Zhou and Ning, 2017). Furthermore, fixtures of the same type were not more closely related than fixtures of different types. Fixtures have been proposed to influence microbial community composition due to the additional materials to which microorganisms are exposed (Neu and Hammes, 2020). We note that because of the uneven sample counts (i.e., only three post-flush samples were successfully sequenced), the findings related to flush condition should be interpreted with caution.
We attempted to link bacterial communities at each fixture to deterministic physicochemical factors but found only weak associations with the significant parameters of total chlorine, dissolved oxygen, pH, and copper. A similar recent investigation (Vosloo et al., 2022) found that variability in bacterial community composition was significantly explained by site type as well as temperature, dissolved oxygen, total chlorine, ammonium, Mn, and Zn. The inability to sufficiently explain factors driving community composition in this study could be due to insufficient sample counts, other parameters that were not considered (e.g., water age at the fixture level, pressure zone; Haig et al., 2020), or stochastic or autogenic effects (Douterelo et al., 2017; Zhou and Ning, 2017).
Previous building water microbiome studies have suggested that bacterial growth through stagnation (Vosloo et al., 2022) and low-flow conditions on copper pipes (Lu et al., 2014) reduces alpha diversity, as was observed in this study. As shear forces dissipated, bulk communities may have become more similar to the biofilm, which has lower diversity than bulk water (Huang et al., 2021) and decreases in diversity through repeated flushing (Douterelo et al., 2016). Under stagnant conditions, biofilm has been shown to become more loosely attached (Liu and Tay, 2002). Large contributions of bacteria from biofilms near the fixture outlet could explain the consistent communities from each fixture sample. Future studies should investigate the interaction of biofilm and bulk water communities under typical flow conditions in building plumbing when biofilms may be more stable due to more consistent shear forces and chlorine concentrations.
Fixture flushing as an approach to maintain or restore water quality
The weekly timed-flushing approach applied here successfully reduced cell counts and increased chlorine concentrations; however, based on the 7-day rebound of chlorine and cell counts to stagnation levels in this study and elsewhere (Hozalski et al., 2020), flushing would need to be repeated at an even higher frequency (e.g., daily) throughout a low-occupancy period for sustained benefits. The possible water quality benefits of repeated flushing must be weighed against the practical drawbacks, including labor and water use. Prescribing overly cautious, burdensome guidance may also lead to non-compliance. For example, most buildings in a recent survey did not comply with existing hot water system temperature guidance for opportunistic pathogen control (Singh et al., 2020). A holistic approach is needed to manage building water systems (Proctor et al., 2022) such that building managers can successfully comply with guidance. Therefore, under these conditions, given the labor and water resource limitations, the population being served, and the limited water quality benefits, regular flushing to maintain water quality during this low occupancy period was likely unjustified, but building managers should weigh costs and benefits given their local context. A more feasible approach in some circumstances may be a single flushing event prior to building reopening.
In addition, fixture flushing may not provide any water quality benefits if (i) flushing is not frequent or expansive enough, (ii) factors other than stagnation are contributing to building water quality problems such that more extreme remediation (e.g., shock chlorination) is warranted, or (iii) water quality was not diminished during stagnation. In this study, although cell counts were elevated, opportunistic pathogen prevalence was low, and although we did not conduct formal risk analysis, there was no evidence that stagnation led to increased health hazard. In addition, bacterial cell counts and communities stabilized during stagnation, prior to flushing. It should be noted that the stagnation period in this study could be short relative to other situations (e.g., dead-end pipes), and even the low occupancy and use of some fixtures in this study could have helped maintain water quality. Nevertheless, other contaminants and aesthetics also need to be considered in water management plans, and making generalized recommendations for building water management is complicated, especially without sufficient and timely water quality testing. Although water quality testing after operational disturbances would be advantageous in making decisions regarding whether to flush fixtures, testing for pathogens in real-time is unfeasible in most buildings. Chlorine is relatively easy to measure and was a good indicator for elevated cell counts, but absence of chlorine did not necessarily indicate presence of health-relevant undesirable microorganisms, similar to observations in recent studies (Hozalski et al., 2020; Dowdell et al., 2022). Identifying buildings at risk for opportunistic pathogen growth under regular occupancy could provide guidance for which buildings are a concern under extended low occupancy conditions.
Data availability statement
The datasets presented in this study can be found in online repositories. The names of the repository/repositories and accession number(s) can be found in the article/Supplementary material.
Author contributions
HG and LK contributed to conception and design of the study. HG, LK, AE, YD, and CO contributed to sample collection and processing. HG, RK, and KN contributed to data analysis and interpretation. HG wrote the first draft of the manuscript. All authors contributed to manuscript revision and approved the submitted version.
Funding
Sample analysis was supported by the National Science Foundation through the Engineering Research Center for Reinventing the Nation's Urban Water Infrastructure under Grant No. EEC-1028968. HG and LK were supported by the National Science Foundation (NSF) Graduate Research Fellowship under Grant No. DGE-1752814. Publication made possible in part by support from the Berkeley Research Impact Initiative (BRII) sponsored by the UC Berkeley Library.
Acknowledgments
We thank Jacqueline Garcia, Cruz Carlos, Negassi Hadgu, Lance Laird, and Michael Cupp for their work on water management and assistance in data collection in study buildings. We also thank Alma Bartholow for assisting with sample extractions and Gabriel Lobo for assisting with sampling.
Conflict of interest
The authors declare that the research was conducted in the absence of any commercial or financial relationships that could be construed as a potential conflic of interest.
Publisher's note
All claims expressed in this article are solely those of the authors and do not necessarily represent those of their affiliated organizations, or those of the publisher, the editors and the reviewers. Any product that may be evaluated in this article, or claim that may be made by its manufacturer, is not guaranteed or endorsed by the publisher.
Supplementary material
The Supplementary Material for this article can be found online at: https://www.frontiersin.org/articles/10.3389/frwa.2022.958523/full#supplementary-material
References
Alleron, L., Khemiri, A., Koubar, M., Lacombe, C., Coquet, L., Cosette, P., et al. (2013). VBNC Legionella pneumophila cells are still able to produce virulence proteins. Water Res. 47, 6606–6617. doi: 10.1016/j.watres.2013.08.032
Ashbolt, N. J. (2015). Microbial contamination of drinking water and human health from community water systems. Curr. Environ. Health Rpt. 2, 95–106. doi: 10.1007/s40572-014-0037-5
Aw, T. G., Scott, L., Jordan, K., Ra, K., Ley, C., and Whelton, A. J. (2022). Prevalence of opportunistic pathogens in a school building plumbing during periods of low water use and a transition to normal use. Int. J. Hygiene Environ. Health 241, 113945. doi: 10.1016/j.ijheh.2022.113945
Bargellini, A., Marchesi, I., Righi, E., Ferrari, A., Cencetti, S., Borella, P., et al. (2011). Parameters predictive of Legionella contamination in hot water systems: association with trace elements and heterotrophic plate counts. Water Res. 45, 2315–2321. doi: 10.1016/j.watres.2011.01.009
Bates, J., and Root, P. (2020). Water management best practices during and after low or no occupancy. ASHRAE J. 62, 72–74. Available online at: https://www.proquest.com/docview/2415481171?pq-origsite=gscholar&fromopenview=true
Borchardt, M. A., Boehm, A. B., Salit, M., Spencer, S. K., Wigginton, K. R., and Noble, R. T. (2021). The environmental microbiology minimum information (EMMI) guidelines: qPCR and dPCR quality and reporting for environmental microbiology. Environ. Sci. Technol. 55, 10210–10223. doi: 10.1021/acs.est.1c01767
Brandt, J., and Albertsen, M. (2018). Investigation of detection limits and the influence of DNA extraction and primer choice on the observed microbial communities in drinking water samples using 16S rRNA gene amplicon sequencing. Front. Microbiol. 9, 2140. doi: 10.3389/fmicb.2018.02140
Buse, H. Y., Lu, J., Lu, X., Mou, X., and Ashbolt, N. J. (2014). Microbial diversities (16S and 18S rRNA gene pyrosequencing) and environmental pathogens within drinking water biofilms grown on the common premise plumbing materials unplasticized polyvinylchloride and copper. FEMS Microbiol. Ecol. 88, 280–295. doi: 10.1111/1574-6941.12294
Bustin, S. A., Benes, V., Garson, J. A., Hellemans, J., Huggett, J., Kubista, M., et al. (2009). The MIQE guidelines: minimum information for publication of quantitative real-time PCR experiments. Clin. Chem. 55, 611–622. doi: 10.1373/clinchem.2008.112797
Callahan, B. J., McMurdie, P. J., Rosen, M. J., Han, A. W., Johnson, A. J. A., and Holmes, S. P. (2016). DADA2: high-resolution sample inference from Illumina amplicon data. Nat. Methods 13, 581–583. doi: 10.1038/nmeth.3869
CDC (2020). Guidance for Reopening Buildings After Prolonged Shutdown or Reduced Operation [WWW Document]. Centers for Disease Control and Prevention. Available online at: https://www.cdc.gov/coronavirus/2019-ncov/php/building-water-system.html (accessed June 23, 2021).
Chen, X., Wang, Y., Li, W., Zhao, X., Lu, Y., Yu, Y., et al. (2020). Microbial contamination in distributed drinking water purifiers induced by water stagnation. Environ. Res. 188, 109715. doi: 10.1016/j.envres.2020.109715
Chiarello, M., McCauley, M., Villéger, S., and Jackson, C. R. (2022). Ranking the biases: the choice of OTUs vs. ASVs in 16S rRNA amplicon data analysis has stronger effects on diversity measures than rarefaction and OTU identity threshold. PLoS ONE 17, e0264443. doi: 10.1371/journal.pone.0264443
Chowdhury, S. (2012). Heterotrophic bacteria in drinking water distribution system: a review. Environ. Monit. Assess. 184, 6087–6137. doi: 10.1007/s10661-011-2407-x
Collier, S. A., Deng, L., Adam, E. A., Benedict, K. M., Beshearse, E. M., Blackstock, A. J., et al. (2021). Estimate of burden and direct healthcare cost of infectious waterborne disease in the United States. Emerg. Infect. Dis. J. CDC 27, 140. doi: 10.3201/eid2701.190676
Council, N. R. (2006). Drinking Water Distribution Systems: Assessing and Reducing Risks. New York, NY: National Academies Press.
Dietersdorfer, E., Kirschner, A., Schrammel, B., Ohradanova-Repic, A., Stockinger, H., Sommer, R., et al. (2018). Starved viable but non-culturable (VBNC) Legionella strains can infect and replicate in amoebae and human macrophages. Water Res. 141, 428–438. doi: 10.1016/j.watres.2018.01.058
Douterelo, I., Husband, S., and Boxall, J. B. (2014). The bacteriological composition of biomass recovered by flushing an operational drinking water distribution system. Water Res. 54, 100–114. doi: 10.1016/j.watres.2014.01.049
Douterelo, I., Husband, S., Loza, V., and Boxall, J. (2016). Dynamics of biofilm regrowth in drinking water distribution systems. Appl. Environ. Microbiol. 82, 4155–4168. doi: 10.1128/AEM.00109-16
Douterelo, I., Jackson, M., Solomon, C., and Boxall, J. (2017). Spatial and temporal analogies in microbial communities in natural drinking water biofilms. Sci. Total Environ. 581–582, 277–288. doi: 10.1016/j.scitotenv.2016.12.118
Dowdell, K. S., Greenwald, H. D., Joshi, S., Grimard-Conea, M., Pitell, S., Song, Y., et al. (2022). Legionella pneumophila occurrence in reduced-occupancy buildings in 11 cities during the COVID-19 pandemic. medRxiv doi: 10.1101/2022.06.28.22277022
Falkinham, J. O., Hilborn, E. D., Arduino, M. J., Pruden, A., and Edwards, M. A. (2015). Epidemiology and ecology of opportunistic premise plumbing pathogens: Legionella pneumophila, Mycobacterium avium, and Pseudomonas aeruginosa. Environ. Health Perspect. 123, 749–758. doi: 10.1289/ehp.1408692
Feizabadi, M. M., Majnooni, A., Nomanpour, B., Fatolahzadeh, B., Raji, N., Delfani, S., et al. (2010). Direct detection of Pseudomonas aeruginosa from patients with healthcare associated pneumonia by real time PCR. Infect. Genet. Evolut. 10, 1247–1251. doi: 10.1016/j.meegid.2010.08.008
Flannery, B., Gelling, L. B., Vugia, D. J., Weintraub, J. M., Salerno, J. J., Conroy, M. J., et al. (2006). Reducing Legionella colonization of water systems with monochloramine. Emerg. Infect. Dis. 12, 588–596. doi: 10.3201/eid1204.051101
Gatza, E., Hammes, F., and Prest, E. I. (2013). Assessing Water Quality With the BD AccuriTM C6 Flow Cytometer. BD Biosci.
Gillespie, S., Lipphaus, P., Green, J., Parsons, S., Weir, P., Juskowiak, K., et al. (2014). Assessing microbiological water quality in drinking water distribution systems with disinfectant residual using flow cytometry. Water Res. 65, 224–234. doi: 10.1016/j.watres.2014.07.029
Gloor, G. B., Macklaim, J. M., Pawlowsky-Glahn, V., and Egozcue, J. J. (2017). Microbiome datasets are compositional: and this is not optional. Front. Microbiol. 8, 2224. doi: 10.3389/fmicb.2017.02224
Gomez-Alvarez, V., Pfaller, S., and Revetta, R. P. (2016). Draft genome sequence of two sphingopyxis sp. strains, dominant members of the bacterial community associated with a drinking water distribution system simulator. Genome Announc. 4, e00183–e00116. doi: 10.1128/genomeA.00183-16
Haig, S.-J., Kotlarz, N., Kalikin, L. M., Chen, T., Guikema, S., LiPuma, J. J., et al. (2020). Emerging investigator series: bacterial opportunistic pathogen gene markers in municipal drinking water are associated with distribution system and household plumbing characteristics. Environ. Sci. Wat. Res. Technol. 6, 3032–3043. doi: 10.1039/D0EW00723D
Haig, S.-J., Kotlarz, N., LiPuma, J. J., and Raskin, L. (2018). A high-throughput approach for identification of nontuberculous mycobacteria in drinking water reveals relationship between water age and Mycobacterium avium. mBio 9, e02354–e02317. doi: 10.1128/mBio.02354-17
Hamilton, K. A., Hamilton, M. T., Johnson, W., Jjemba, P., Bukhari, Z., LeChevallier, M., et al. (2019). Risk-based critical concentrations of Legionella pneumophila for indoor residential water uses. Environ. Sci. Technol. 53, 4528–4541. doi: 10.1021/acs.est.8b03000
Hirsh, M., Baron, J. L., Mietzner, S., Rihs, J. D., and Stout, J. E. (2021). Cross-reactivity of the IDEXX Legiolert method with other Gram-negative bacteria and waterborne pathogens leads to false-positive assay results. Lett. Appl. Microbiol. 72, 750–756. doi: 10.1111/lam.13469
Hozalski, R. M., LaPara, T. M., Zhao, X., Kim, T., Waak, M. B., Burch, T., et al. (2020). Flushing of stagnant premise water systems after the COVID-19 shutdown can reduce infection risk by Legionella and Mycobacterium spp. Environ. Sci. Technol. 54, 15914–15924. doi: 10.1021/acs.est.0c06357
Huang, C. K., Weerasekara, A., Bond, P. L., Weynberg, K. D., and Guo, J. (2021). Characterizing the premise plumbing microbiome in both water and biofilms of a 50-year-old building. Sci. Total Environ. 798, 149225. doi: 10.1016/j.scitotenv.2021.149225
Ji, P., Parks, J., Edwards, M. A., and Pruden, A. (2015). Impact of water chemistry, pipe material and stagnation on the building plumbing microbiome. PLoS ONE 10, e0141087. doi: 10.1371/journal.pone.0141087
Ji, P., Rhoads, W. J., Edwards, M. A., and Pruden, A. (2017). Impact of water heater temperature setting and water use frequency on the building plumbing microbiome. ISME J. 11, 1318–1330. doi: 10.1038/ismej.2017.14
Kennedy, L. C., Miller, S. E., Kantor, R. S., and Nelson, K. L. (2020). Effect of disinfectant residual, pH, and temperature on microbial abundance in disinfected drinking water distribution systems. Environ. Sci. Water Res. Technol. 7, 78–92. doi: 10.1039/D0EW00809E
Kool, J. L., Carpenter, J. C., and Fields, B. S. (1999). Effect of monochloramine disinfection of municipal drinking water on risk of nosocomial Legionnaires' disease. Lancet 353, 272–277. doi: 10.1016/S0140-6736(98)06394-6
Kozich, J. J., Westcott, S. L., Baxter, N. T., Highlander, S. K., and Schloss, P. D. (2013). Development of a dual-index sequencing strategy and curation pipeline for analyzing amplicon sequence data on the MiSeq Illumina sequencing platform. Appl. Environ. Microbiol. 79, 5112–5120. doi: 10.1128/AEM.01043-13
Lautenschlager, K., Boon, N., Wang, Y., Egli, T., and Hammes, F. (2010). Overnight stagnation of drinking water in household taps induces microbial growth and changes in community composition. Water Res. Microbial Ecol. Drink. Water Waste Water Treatment Process. 44, 4868–4877. doi: 10.1016/j.watres.2010.07.032
Legiolert: Detection of Legionella pneumophila - IDEXX US [WWW Document]. (2018). Available online at: https://www.idexx.com/en/water/water-products-services/legiolert/ (accessed May 22, 2022).
Ling, F., Whitaker, R., LeChevallier, M. W., and Liu, W. T. (2018). Drinking water microbiome assembly induced by water stagnation. ISME J. 12, 1520–1531. doi: 10.1038/s41396-018-0101-5
Lipphaus, P., Hammes, F., Kötzsch, S., Green, J., Gillespie, S., and Nocker, A. (2014). Microbiological tap water profile of a medium-sized building and effect of water stagnation. Environ. Technol. 35, 620–628. doi: 10.1080/09593330.2013.839748
Lipponen, M. T. T., Suutari, M. H., and Martikainen, P. J. (2002). Occurrence of nitrifying bacteria and nitrification in Finnish drinking water distribution systems. Water Res. 36, 4319–4329. doi: 10.1016/S0043-1354(02)00169-0
Liu, Y., and Tay, J.-H. (2002). The essential role of hydrodynamic shear force in the formation of biofilm and granular sludge. Water Res. 36, 1653–1665. doi: 10.1016/S0043-1354(01)00379-7
Louisville Water Company (2020). Flushing the Water Lines. Available online at: https://www.youtube.com/watch?v=3D_rtLrkLMA
Love, M. I., Huber, W., and Anders, S. (2014). Moderated estimation of fold change and dispersion for RNA-seq data with DESeq2. Genome Biol. 15, 550. doi: 10.1186/s13059-014-0550-8
Lu, J., Buse, H.y, Gomez-Alvarez, V., Struewing, I., Santo Domingo, J., et al. (2014). Impact of drinking water conditions and copper materials on downstream biofilm microbial communities and Legionella pneumophila colonization. J. Appl. Microbiol. 117, 905–918. doi: 10.1111/jam.12578
Lu, Z., Jing, Z., Huang, J., Ke, Y., Li, C., Zhao, Z., et al. (2022). Can we shape microbial communities to enhance biological activated carbon filter performance? Water Res. 212, 118104. doi: 10.1016/j.watres.2022.118104
Lytle, D. A., Pfaller, S., Muhlen, C., Struewing, I., Triantafyllidou, S., White, C., et al. (2021). A comprehensive evaluation of monochloramine disinfection on water quality, Legionella and other important microorganisms in a hospital. Water Res. 189, 116656. doi: 10.1016/j.watres.2020.116656
Lytle, D. A., and Schock, M. R. (2000). Impact of stagnation time on metal dissolution from plumbing materials in drinking water. J. Water Supply Res. Technol. Aqua 49, 243–257. doi: 10.2166/aqua.2000.0021
McLaren, M. R., and Callahan, B. J. (2021). Silva 138.1 prokaryotic SSU taxonomic training data formatted for DADA 2. doi: 10.5281/zenodo.4587955
Miller, S. E., Rodriguez, R. A., and Nelson, K. L. (2020). Removal and growth of microorganisms across treatment and simulated distribution at a pilot-scale direct potable reuse facility. Environ. Sci. Water Res. Technol. 107, 36. doi: 10.1039/C9EW01087D
Monteiro, S. N., Robalo, A. M., and Santos, R. J. (2021). Evaluation of LegiolertTM for the detection of legionella pneumophila and comparison with spread-plate culture and qPCR methods. Curr. Microbiol. 78, 1792–1797. doi: 10.1007/s00284-021-02436-6
Nazarian, E. J., Bopp, D. J., Saylors, A., Limberger, R. J., and Musser, K. A. (2008). Design and implementation of a protocol for the detection of Legionella in clinical and environmental samples. Diagn. Microbiol. Infect. Dis. 62, 125–132. doi: 10.1016/j.diagmicrobio.2008.05.004
Nescerecka, A., Rubulis, J., Vital, M., Juhna, T., and Hammes, F. (2014). Biological instability in a chlorinated drinking water distribution network. PLoS ONE 9, e96354. doi: 10.1371/journal.pone.0096354
Neu, L., and Hammes, F. (2020). Feeding the building plumbing microbiome: the importance of synthetic polymeric materials for biofilm formation and management. Water 12, 1774. doi: 10.3390/w12061774
Niquette, P., Servais, P., and Savoir, R. (2001). Bacterial dynamics in the drinking water distribution system of Brussels. Water Res. 35, 675–682. doi: 10.1016/S0043-1354(00)00303-1
Nisar, M. A., Ross, K. E., Brown, M. H., Bentham, R., and Whiley, H. (2020). Water stagnation and flow obstruction reduces the quality of potable water and increases the risk of legionelloses. Front. Environ. Sci. 8, 611611. doi: 10.3389/fenvs.2020.611611
Odell, L. H., Kirmeyer, G. J., Wilczak, A., Jacangelo, J. G., Marcinko, J. P., and Wolfe, R. L. (1996). Controlling nitrification in chloraminated systems. J. Am. Water Works Assoc. 88, 86–98. doi: 10.1002/j.1551-8833.1996.tb06587.x
Oksanen, J. (2007). vegan: Community Ecology Package. R package version 1.8-5. Available online at: http://www.cran.r-project.org (accessed May 11, 2022).
Pagnier, I., Raoult, D., and La Scola, B. (2011). Isolation and characterization of Reyranella massiliensis gen. nov., sp. nov. from freshwater samples by using an amoeba co-culture procedure. Int. J. Syst. Evolut. Microbiol. 61, 2151–2154. doi: 10.1099/ijs.0.025775-0
Poch, M., Garrido-Baserba, M., Corominas, L., Perelló-Moragues, A., Monclús, H., Cermerón-Romero, M., et al. (2020). When the fourth water and digital revolution encountered COVID-19. Sci. Total Environ. 744, 140980. doi: 10.1016/j.scitotenv.2020.140980
Polychronopolous, M., Dudley, K., Ryan, G., and Hearn, J. (2003). Investigation of factors contributing to dirty water events in reticulation systems and evaluation of flushing methods to remove deposited particles. Water Supply 3, 295–306. doi: 10.2166/ws.2003.0117
Prest, E. I., Hammes, F., van Loosdrecht, M. C. M., and Vrouwenvelder, J. S. (2016). Biological stability of drinking water: controlling factors, methods, and challenges. Front. Microbiol. 7, 00045. doi: 10.3389/fmicb.2016.00045
Proctor, C., Garner, E., Hamilton, K. A., Ashbolt, N. J., Caverly, L. J., Falkinham, J. O., et al. (2022). Tenets of a holistic approach to drinking water-associated pathogen research, management, and communication. Water Res. 211, 117997. doi: 10.1016/j.watres.2021.117997
Proctor, C. R., Rhoads, W. J., Keane, T., Salehi, M., Hamilton, K., Pieper, K. J., et al. (2020). Considerations for large building water quality after extended stagnation. AWWA Water Sci. 2, e1186. doi: 10.1002/aws2.1186
Rhoads, W. J., and Hammes, F. (2020). Growth of Legionella during COVID-19 lockdown stagnation. Environ. Sci. Water Res. Technol. 7, 10–15. doi: 10.1039/D0EW00819B
Rhoads, W. J., Pruden, A., and Edwards, M. A. (2016). Survey of green building water systems reveals elevated water age and water quality concerns. Environ. Sci. Water Res. Technol. 2, 164–173. doi: 10.1039/C5EW00221D
Rotthauwe, J. H., Witzel, K. P., and Liesack, W. (1997). The ammonia monooxygenase structural gene amoA as a functional marker: molecular fine-scale analysis of natural ammonia-oxidizing populations. Appl. Environ. Microbiol. 63, 4704–4712. doi: 10.1128/aem.63.12.4704-4712.1997
Salehi, M., Abouali, M., Wang, M., Zhou, Z., Nejadhashemi, A. P., Mitchell, J., et al. (2018). Case study: fixture water use and drinking water quality in a new residential green building. Chemosphere 195, 80–89. doi: 10.1016/j.chemosphere.2017.11.070
Scott, D. B., Van Dyke, M. I., Anderson, W. B., and Huck, P. M. (2015). Influence of water quality on nitrifier regrowth in two full-scale drinking water distribution systems. Can. J. Microbiol. 61, 965–976. doi: 10.1139/cjm-2015-0375
Shirey, T. B., Thacker, R. W., and Olson, J. B. (2012). Composition and stability of bacterial communities associated with granular activated carbon and anthracite filters in a pilot scale municipal drinking water treatment facility. J. Water Health 10, 244–255. doi: 10.2166/wh.2012.092
Singh, R., Hamilton, K. A., Rasheduzzaman, M., Yang, Z., Kar, S., Fasnacht, A., et al. (2020). Managing water quality in premise plumbing: subject matter experts' perspectives and a systematic review of guidance documents. Water 12, 347. doi: 10.3390/w12020347
Springston, J. P., and Yocavitch, L. (2017). Existence and control of Legionella bacteria in building water systems: a review. J. Occup. Environ. Hyg. 14, 124–134. doi: 10.1080/15459624.2016.1229481
UK PHE (2022). NEWSLETTER MARCH 2022 Post Lockdown Positivity [WWW Document]. Available online at: https://www.legionellacontrol.org.uk/news/127/ (accessed April 22, 2022).
United States Centers for Disease Control Prevention (2021). Reopening Buildings After Prolonged Shutdown or Reduced Operation. Available online at: https://www.cdc.gov/coronavirus/2019-ncov/php/building-water-system.html
United States Environmental Protection Agency (2020). Maintaining or Restoring Water Quality in Buildings with Low or No Use.
van der Kooij, D., Veenendaal, H. R., and Italiaander, R. (2020). Corroding copper and steel exposed to intermittently flowing tap water promote biofilm formation and growth of Legionella pneumophila. Water Res. 183, 115951. doi: 10.1016/j.watres.2020.115951
van der Wielen, P. W. J. J., and van der Kooij, D. (2010). Effect of water composition, distance and season on the adenosine triphosphate concentration in unchlorinated drinking water in the Netherlands. Water Res. Microbial Ecol. Drink. Water Waste Water Treatment Process. 44, 4860–4867. doi: 10.1016/j.watres.2010.07.016
Völker, S., Schreiber, C., and Kistemann, T. (2016). Modelling characteristics to predict Legionella contamination risk: surveillance of drinking water plumbing systems and identification of risk areas. Int. J. Hyg. Environ. Health 219, 101–109. doi: 10.1016/j.ijheh.2015.09.007
Vosloo, S. (2019). Modified DNeasy PowerWater Kit® protocol for DNA extractions from drinking water samples. Water Res. 10, 100123. doi: 10.17504/protocols.io.66khhcw
Vosloo, S., Huo, L., Chauhan, U., Cotto, I., Gincley, B., Vilardi, K. J., et al. (2022). Systematic recovery of building plumbing-associated microbial communities after extended periods of altered water demand during the COVID-19 pandemic. Cell 181, 281–292. doi: 10.1101/2022.01.17.22269440
Vreeburg, I. J. H. G., and Boxall, J. B. (2007). Discolouration in potable water distribution systems: a review. Water Res. 41, 519–529. doi: 10.1016/j.watres.2006.09.028
Wang, C., Wei, Z., Liu, R., Bai, L., Jiang, H., and Yuan, N. (2021). The sequential dewatering and drying treatment enhanced the potential favorable effect of microbial communities in drinking water treatment residue for environmental recycling. Chemosphere 262, 127930. doi: 10.1016/j.chemosphere.2020.127930
Wang, H., Masters, S., Hong, Y., Stallings, J., Falkinham, J. O., Edwards, M. A., et al. (2012). Effect of disinfectant, water age, and pipe material on occurrence and persistence of Legionella, mycobacteria, Pseudomonas aeruginosa, and two amoebas. Environ. Sci. Technol. 46, 11566–11574. doi: 10.1021/es303212a
Weather averages Berkeley California [WWW Document]. (2022). Available online at: https://www.usclimatedata.com/climate/berkeley/california/united-states/usca0087 (accessed July 19, 2022).
Whiley, H., Keegan, A., Fallowfield, H., and Bentham, R. (2014). Detection of Legionella, L. pneumophila and mycobacterium avium complex (MAC) along potable water distribution pipelines. Int. J. Environ. Res. Public Health 11, 7393–7405. doi: 10.3390/ijerph110707393
Zhang, H., Xu, L., Huang, T., Yan, M., Liu, K., Miao, Y., et al. (2021). Combined effects of seasonality and stagnation on tap water quality: changes in chemical parameters, metabolic activity and co-existence in bacterial community. J. Hazard. Mater. 403, 124018. doi: 10.1016/j.jhazmat.2020.124018
Zhang, Y., and Edwards, M. (2009). Accelerated chloramine decay and microbial growth by nitrification in premise plumbing. J. AWWA 101, 51–62. doi: 10.1002/j.1551-8833.2009.tb09990.x
Zhou, J., and Ning, D. (2017). Stochastic community assembly: does it matter in microbial ecology? Microbiol. Mol. Biol. Rev. 81, e00002–17. doi: 10.1128/MMBR.00002-17
Keywords: stagnation, building plumbing systems, opportunistic pathogen, flushing, amplicon sequencing, drinking water quality, water microbiome, flow cytometry
Citation: Greenwald H, Kennedy LC, Ehde A, Duan Y, Olivares CI, Kantor R and Nelson KL (2022) Is flushing necessary during building closures? A study of water quality and bacterial communities during extended reductions in building occupancy. Front. Water 4:958523. doi: 10.3389/frwa.2022.958523
Received: 31 May 2022; Accepted: 02 August 2022;
Published: 30 August 2022.
Edited by:
Raymond M. Hozalski, University of Minnesota Twin Cities, United StatesCopyright © 2022 Greenwald, Kennedy, Ehde, Duan, Olivares, Kantor and Nelson. This is an open-access article distributed under the terms of the Creative Commons Attribution License (CC BY). The use, distribution or reproduction in other forums is permitted, provided the original author(s) and the copyright owner(s) are credited and that the original publication in this journal is cited, in accordance with accepted academic practice. No use, distribution or reproduction is permitted which does not comply with these terms.
*Correspondence: Kara L. Nelson, a2FyYW5lbHNvbkBiZXJrZWxleS5lZHU=
†These authors share last authorship