 Erika Osborne
 Emily Garner
- Wadsworth Department of Civil and Environmental Engineering, West Virginia University, Morgantown, WV, United States
Drinking water distribution systems are critical infrastructure that protect public health by ensuring safe water is transported from centralized treatment facilities to consumers. While growth of bacteria, such as opportunistic pathogens, in distribution system infrastructure is well established as a detriment to water quality, little is known about the role of sediment in conveying bacteria via biofilms throughout these systems. The objective of this study was to quantify the abundance of particle-associated bacteria in a rural drinking water distribution system with a chlorine disinfectant residual. The role of hydraulic and physicochemical factors in influencing the spatiotemporal loading of particle-associated bacteria in the system was also examined. The concentration of particle-associated bacteria averaged 1.28 log10 gene copies per mL, while total bacteria averaged 2.16 log10 gene copies per mL, demonstrating that biofilms formed on the surface of sediment represent a substantial portion of overall loading in the studied distribution system. Total suspended solids concentrations were correlated with particle-associated bacteria, but not total bacteria. Pipe diameter was found to be an important factor associated with the abundance of both total and particle-associated bacteria, as well as total chlorine concentration. Velocity, Reynold's number and the flow regime were also found to be important, as they were associated with both sediment and total bacteria, but not particle-associated bacteria. The results of this study indicate that particle-associated bacteria and total bacteria concentrations often followed disparate trends, demonstrating that their abundance is differentially influenced by a complex combination of physicochemical and hydraulic factors. These findings help to establish sediment as an important conduit for microbial loading in a chlorinated drinking water distribution system.
Introduction
Drinking water distribution systems represent a complex engineered environment where water quality can shift markedly as water travels from the treatment plant to the consumer's tap. Dissipation of chlorine residuals, growth of microorganisms, corrosion, and the formation of disinfection byproducts are all critically important processes that shape water quality in distribution systems (Smith and Alspach, 2019). Bacterial growth is detrimental to water quality in a wide variety of ways, including by accelerating decay of disinfectant residual, facilitating formation of disinfection byproducts, promoting corrosion of pipes, and releasing compounds contributing to taste, odor, and water discoloration (Abokifa et al., 2016; Liu et al., 2016). In particular, pathogenic microorganisms in distribution systems can be problematic and have been linked to multiple past outbreaks of waterborne disease (Yoder et al., 2008; Beer et al., 2015; Benedict et al., 2017). Bacterial growth can occur among planktonic cells suspended in the bulk water, as biofilms attached to pipe walls and sediment, or as loose biofilm deposits (U. S. Environmental Protection Agency, 2002b; Liu et al., 2014; Proctor and Hammes, 2015). The presence of biofilms can facilitate persistence and growth of pathogenic microorganisms by shielding them from chlorine disinfectant residuals (Falkinham et al., 2015). While biofilms associated with pipe walls are widely recognized as a potential problem in distribution systems (U. S. Environmental Protection Agency, 2002b; Batte et al., 2003; Liu et al., 2016; Friedman et al., 2017), less is known about biofilms that form on sediment surfaces and the associated impacts to water quality. Sediment in distribution systems and associated water discoloration is a cause of frequent customer complaints to their water provider, but sediment can be detrimental to water quality in a variety of ways. Sediment can create a source of chlorine demand, and it can provide a large surface area that is conducive to biofilm growth (Semanuik et al., 2017; Zhu et al., 2020). Sediment can also contain nutrients that promote the growth of biofilms and pathogens (Vacs Renwick et al., 2019). In areas where sediment accumulates, associated biofilms become buried and are particularly well protected from residual disinfectant, creating an ideal environment for the growth of pathogens (Semanuik et al., 2017). Previous research has demonstrated that distribution system sediment has a distinct bacteriological composition relative to bulk water (Douterelo et al., 2014; Liu et al., 2014), and the biofilms that grow on pipe surfaces and sediment may have a greater impact on microbial quality of tap water than the source water and treatment strategy (El-Chakhtoura et al., 2018). One previous study of an unchlorinated Dutch drinking water system conveying anoxic groundwater found that sediment in the drinking water system conveys active biomass, with small particles (<10 μm) associated with highest biological activity (van der Wielen and Lut, 2016). Sediment can also be an important source of a variety of chemical and even potentially radioactive contaminants that can become adhered to the surface (U. S. Environmental Protection Agency, 2015).
Sediment in drinking water distribution systems can originate from particles that escape the treatment process, erosion of pipes, intrusion of outside particles through leaks and cracks, and precipitation of compounds dosed for corrosion control (Vreeburg et al., 2008; Blokker and Schaap, 2015; Vacs Renwick et al., 2019). While particles may enter drinking water distribution systems via a variety of mechanisms, hydraulic fluctuations within the system are important in determining the fate and transport of these particles. Under normal flow conditions, particles typically accumulate and are removed from the channel of flow, but when flows are increased, mobilization of particles can result from scouring forces and shear stress to pipe walls (Vreeburg and Boxall, 2007). Zones where stagnation occurs within drinking water distribution systems are particularly susceptible to accumulation of particles (Pothof and Blokker, 2012). To combat sediment accumulation in drinking water distribution systems over time, routine flushing of the distribution system is often incorporated into the utility's plan for operation and maintenance (Friedman et al., 2002).
While sediment in drinking water distribution systems is recognized as a detriment to water quality, little is known about the extent to which sediment contributes to the overall microbial loading in these systems (Liu et al., 2013; Proctor and Hammes, 2015). Further, much of the research quantifying the loading of microorganisms associated with sediment in drinking water distribution systems has focused on unchlorinated systems (Liu et al., 2014; van der Wielen and Lut, 2016; Chen et al., 2022). The objective of this study was to quantify particle-associated bacteria in a rural drinking water distribution system with a chlorine residual. In addition, the impacts of distribution system and hydraulic characteristics (i.e., pipe diameter, pressure, velocity, flowrate, flow regime, Reynold's number, and pipe distance from treatment plant) and physicochemical water quality [i.e., pH, temperature, conductivity, total organic carbon (TOC), metals, turbidity, and total suspended solids (TSS)] on the spatiotemporal distribution of particle-associated and total microbial loading were investigated.
Materials and methods
Site description, sample collection, and preservation
A rural drinking water distribution system located in West Virginia, USA was selected as the site of this study. The system serves 1,443 residential and 126 commercial/industrial/public customers, with a total population served of ~3,750 people. The distribution system consists of 65.2 miles of mains, primarily consisting of polyvinyl chloride (PVC) ranging from 2 to 12 inches in diameter. Piped water entering the distribution system originates from surface water and is treated by chemical coagulation, flocculation, sedimentation, filtration, and disinfection with free chlorine. This system was selected for this study because utility personnel communicated past challenges with sediment accumulation in the distribution system.
Bulk water samples were collected from 14 different sampling sites (Figure 1), including the treatment plant (site 1), a storage tank in the distribution system (site 2), and 12 distribution system sites (sites 3–14). Sampling sites supplied by the studied drinking water distribution system were located at established sampling locations used for coliform and other routine utility monitoring, and included cold water taps within buildings, fire hydrants, pump stations used to maintain adequate system pressure, or outside spigots, depending on the site. Samples were collected on four different dates: March 2021 (2 weeks before a week-long flushing campaign was initiated), April 2021 (1 week after the conclusion of the system flushing campaign), June 2021 (9 weeks after the system was flushed), and August 2021 (16 weeks after the system was flushed). Three separate containers of water were collected at each location for each sampling date: an autoclaved 3 L polypropylene bottle dosed with 48 mg sodium thiosulfate per liter of water to quench chlorine for culture and molecular analysis, a 250–500 mL amber glass bottle baked at 550°C to volatilize organics for organic carbon analysis, and an acid-washed 1 L bottle for water chemistry analysis. Before collecting samples, taps or sampling ports were thoroughly flushed for ~30 s (e.g., in the case of fire hydrants which are located in close proximity to the distribution system) to 5 min (e.g., for building taps) to eliminate water from the building plumbing and draw water from the distribution system, as indicated by stabilization of water temperature.
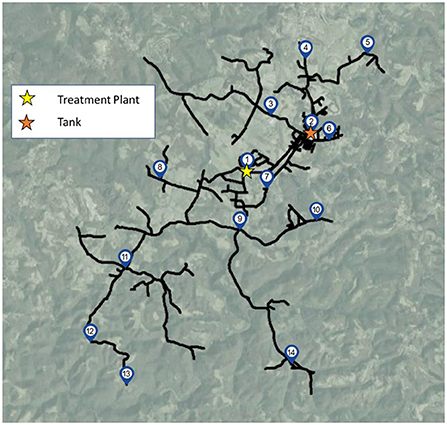
Figure 1. Sampling sites including the treatment plant (site 1), storage tank (site 2) and 12 additional sites throughout the distribution system.
Once collected, samples were kept on ice and transported to the lab within 4 h of sample collection. Upon return to the lab, samples used for molecular analysis were filter-concentrated onto two different types of filters: a 2 μm pore size polycarbonate membrane filter (MilliporeSigma) to capture bacteria associated with suspended solids and a 0.45 μm pore size mixed cellulose ester membrane filter (Fisher) to capture total bacteria. The 2 μm pore size was selected because the Standard Methods for the Examination of Water and Wastewater define suspended solids as those that are retained on a 2 μm filter (APHA, 2005) in method #2540, while the 0.45 μm pore size was selected because method #9215D (APHA, 2005) using the membrane filtration method for heterotrophic plate count recommends use of a 0.45 μm pore size, and should therefore be expected to capture a wide range of microorganisms. This approach was modeled after previously published work that utilized varied filter pore sizes to differentiate between planktonic and particle-associated microorganisms (Zhang et al., 2007; Chen et al., 2022). For each sample, up to 1,250 mL of water was passed through each kind of filter. Some exceptions were made because an excess of sediment limited the flow of water through the filter, so a smaller amount of water was filtered until clogging. Afterwards, the filters were aseptically folded and placed into tubes and stored at −20°C until DNA extraction. One filter of each size was processed along with samples and analyzed as negative controls.
Physicochemical water quality
Total chlorine concentration was measured onsite during sample collection using a Hach DR 900 colorimeter and the DPD Total Chlorine method (Hach Method #8167), and pH, temperature, and electrical conductivity were measured at each site using a Thermo Orion Star A329 multimeter. Turbidity was measured using a 2100P Turbidimeter by Hach using Standard Method 2130A (APHA, 2005). TSS concentration was measured by filtration and evaporation using Standard Method 2540D (APHA, 2005). TOC was measured using a Shimadzu Organic Carbon Analyzer according to Standard Method 5310B (APHA, 2005). Metals were measured using Atomic Absorption Spectroscopy. The heterotrophic plate count (HPC) of each sample was measured with plate cultures according to the Standard Method 9215 (APHA, 2005).
Quantification of 16S rRNA genes
DNA was extracted from each filter type for each site using a FastDNA SPIN Kit (MP Biomedicals). The universal bacterial 16S rRNA gene was quantified in triplicate reactions from DNA extracts using quantitative polymerase chain reaction (qPCR) with the previously published and validated primers, 1369F and 1492R (Suzuki et al., 2000), purchased from Integrated DNA Technologies, Inc. The following thermocycling conditions were used: 98°C for 2 min, 40 cycles of 98°C for 15 s and 55°C for 30 s, followed by a melt curve in which temperatures were increased from 65 to 95°C at 0.5°C increments. Reactions consisted of a final concentration of 1X PowerUp SYBR Green Mastermix (Life Technologies), 400 nM forward and reverse primers, 1 μl of template DNA extract, and water to a final volume of 10 μl. The DNA extracts were diluted 1:5 before being used in qPCR as this was determined through a trial with a subset of samples to minimize inhibition. When performing the qPCR, a negative control and standard curve of a synthetic positive control purchased from Integrated DNA Technologies, Inc., ranging from 102 to 108 gene copies (GC) per reaction, were created in triplicate and included in each run. The limit of quantification was established as the lowest standard that amplified in triplicate in each run but remained greater than any amplification observed in qPCR negative reactions on that plate. The limit of quantification was typically 8 GC/mL of sample, with higher LOQs recorded in samples where clogging prevented filter concentration of the maximum sample volume. Results for PCR and filter blank samples are presented in Supplementary Table 1.
Distribution system modeling
A model of the distribution system was created using KYPIPE software. The location of all pipes and elements was imported from the West Virginia Water Development Authority's Geographic Information System database. New construction not present in the database was entered into the distribution system from paper records and reviewed for final confirmation of accuracy by the utility staff. Demand was modeled using the automatic distribution demand function and typical residential water demand patterns (Bowen et al., 1993). An extended period simulation was conducted over the duration of 24 h. Minimum, maximum, and average values over the duration were determined for pressure, velocity, and flowrate. Flow regime was defined as high variable for sites where the magnitude of the flow range (maximum flow–minimum flow) was 75 gallons per minute (gpm) or higher, low variable when the range was between 7.5 and 75 gpm, and quasi steady state when little variation in flow was observed, as characterized by a range below 7.5 gpm. Reynold's number (Re) was calculated using equation 1, where u is flow velocity (m/s), dh is hydraulic diameter, and ν is kinematic viscosity at the measured water temperature (m2/s).
Statistics and data analysis
Statistical differences between data grouped according to categorical variables (i.e., pipe diameter, flow regime, sampling date) were assessed using a Kruskal-Wallis Rank Sum Test with post-hoc Wilcoxon Rank Sum test used to assess pairwise trends. Correlations between total or particle-associated bacteria and continuous water quality and hydraulic parameters were assessed using a non-parametric Spearman's Rank Sum Correlation Test and the correlation coefficient (ρ) and p-value were reported. All statistical tests were performed using the base stats package in R (R Core Team, 2020) and p-values were considered statistically significant when p-value < 0.05. Correlation plots were prepared using the corrplot (Wei and Simko, 2021) and Hmisc (Harrell, 2022) packages. R package ggplot2 (Wickham, 2016) was used in the preparation of bubble map plots and boxplots. Interactions between physicochemical and hydraulic variables were investigated using classification and regression tree analysis using the rpart (Therneau and Atkinson, 2022) and rpart.plot (Milborrow, 2022) packages in R.
Results
Total suspended solids
The spatiotemporal distribution of TSS concentration throughout the drinking water distribution varied widely (Figure 2). In pre-flush samples collected in March, TSS ranged from 0.0 to 4.2 mg/L, with an average of 0.7 ± 1.3 mg/L (Figure 2A). However, TSS levels were low in general ( ≤ 0.6 mg/L) with the exception of sites 2 (the storage tank; 4.2 mg/L) and 10 (3.4 mg/L). In samples collected 1 week after flushing in April, TSS ranged from 0.0 to 2.4 mg/L, with an average of 1.5 ± 0.7 mg/L (Figure 2B). Sediment appears to have been widely disturbed and redistributed throughout the system as a result of flushing, leading to this overall increase in average sediment measured and an increase in TSS at 11 of 14 sites from March to April. However, sediment concentrations widely decreased in samples collected 9 weeks after flushing in June, with TSS ranging from 0.0 to 1.0 mg/L, with an average of 0.4 ± 0.3 mg/L (Figure 2C). By 16 weeks after flushing in August, sediment had again returned to pre-flush levels or higher at most sites, with TSS ranging from 0.0 to 2.8 mg/L, with an average of 1.3 ± 1.2 mg/L (Figure 2D). Across sampling dates, site 10 averaged the highest TSS concentrations (2.0 ± 0.9 mg/L), followed by sites 8 (1.6 ± 1.6 mg/L) and 13 (1.5 ± 0.8 mg/L). Elevated sediment concentrations were also recorded from the storage tank, site 2 (1.5 ± 1.6 mg/L), though there was a substantial decrease observed at this site as a result of flushing the system. TSS concentration varied significantly according to date (Kruskal-Wallis, p = 0.001065). From March to April, the change in TSS abundance was not considered statistically significant (paired Wilcoxon, p = 0.05947), while shifts from April to June (p = 0.001629) and June to August (p = 0.005285) were significant.
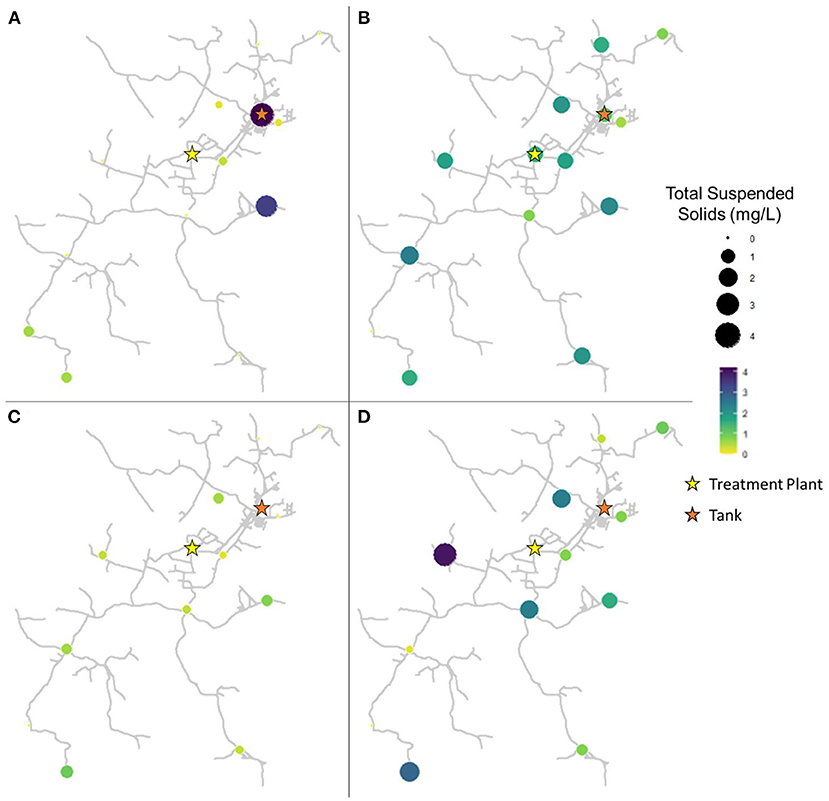
Figure 2. Total suspended solids in samples collected at all sites in (A) March (2 weeks before flushing), (B) April (1 week after flushing), (C) June (9 weeks after flushing), and (D) August (16 weeks after flushing).
Total and particle-associated bacteria
In pre-flush samples collected in March, total bacteria concentrations averaged 1.96 ± 0.85 log10 16S rRNA GC per mL (Figure 3A), while particle-associated bacteria averaged 1.07 ± 0.82 log10 16S rRNA GC per mL (Figure 4A). Notably, trends varied widely across the system, with particle-associated bacteria at sites 5, 9, 11, and 12 below detectable levels, whereas at sites 1, 3, and 4, nearly the entire total bacteria loading was composed of particle-associated bacteria (90.98–103.06%). In samples collected 1 week after flushing in April, total bacteria concentrations averaged 2.23 ± 1.38 log10 16S rRNA GC per mL (Figure 3B), while particle-associated bacteria averaged 1.64 ± 0.93 log10 16S rRNA GC per mL (Figure 4B). Similar to TSS, the abundance of particle-associated bacteria was not significantly higher in April compared to March (paired Wilcoxon test, p = 0.1563).
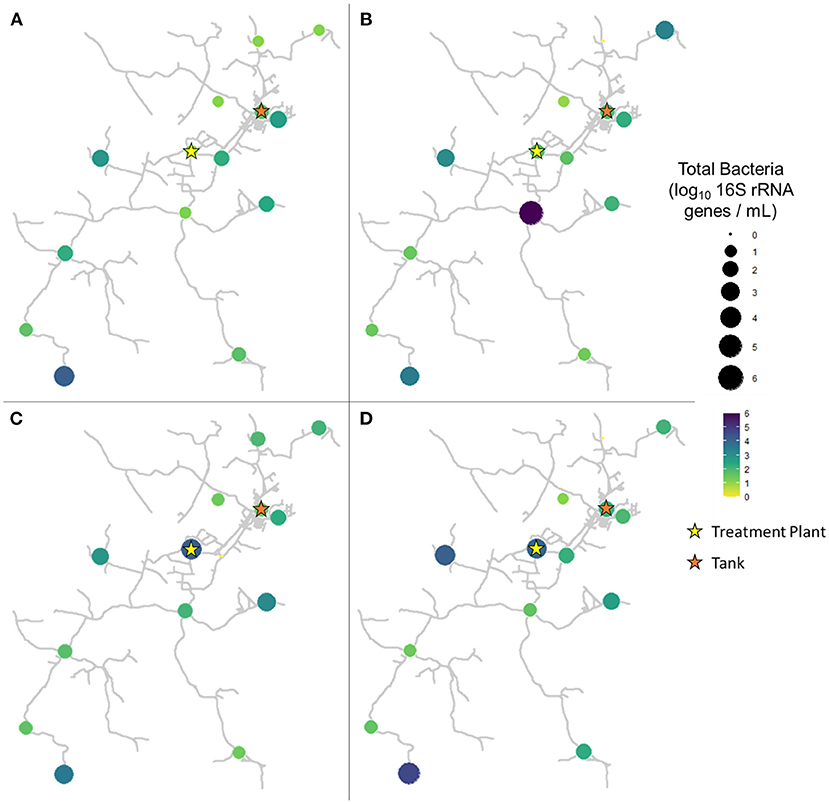
Figure 3. Total bacteria in samples collected at all sites in (A) March (2 weeks before flushing), (B) April (1 week after flushing), (C) June (9 weeks after flushing), and (D) August (16 weeks after flushing).
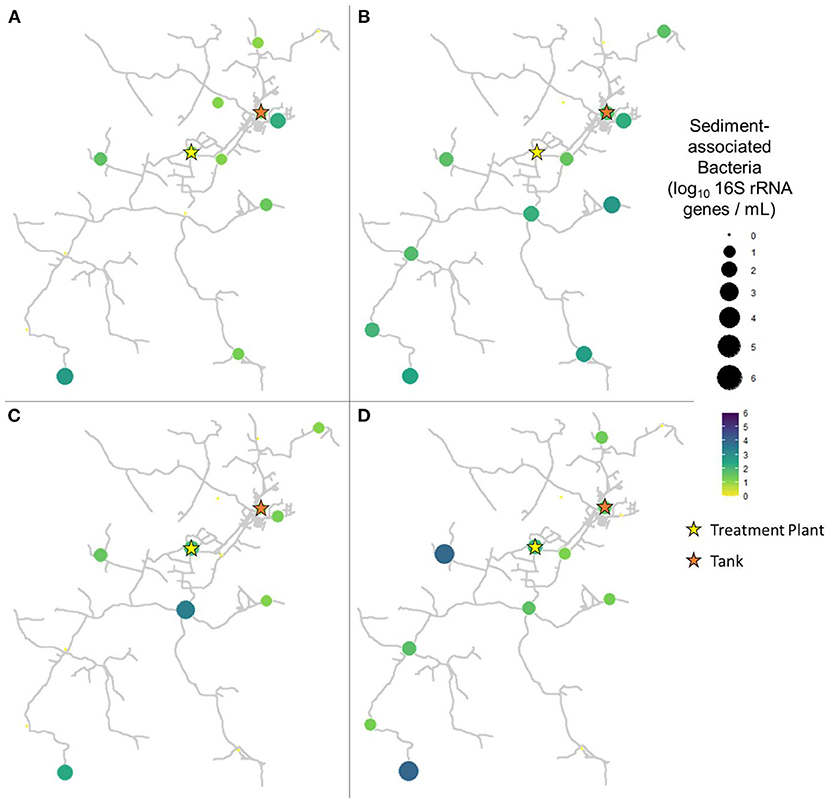
Figure 4. Particle-associated bacteria in samples collected at all sites in (A) March (2 weeks before flushing), (B) April (1 week after flushing), (C) June (9 weeks after flushing), and (D) August (16 weeks after flushing).
In samples collected 9 weeks after flushing in June, total bacteria concentrations averaged 2.16 ± 1.01 log10 16S rRNA GC per mL (Figure 3C), while particle-associated bacteria averaged 0.99 ± 1.04 log10 16S rRNA GC per mL (Figure 4C). In samples collected 16 weeks after flushing in August, total bacteria concentrations averaged 2.29 ± 1.16 log10 16S rRNA GC per mL (Figure 3D), while particle-associated bacteria averaged 1.44 ± 1.28 log10 16S rRNA GC per mL (Figure 4D). Total bacteria concentration, as indicated by detection of 16S rRNA genes, did not vary between sampling events (Kruskal-Wallis, p = 0.6733), but abundance of particle-associated bacteria did vary significantly across sampling dates (p = 0.03971). Across the dataset, total bacteria were elevated compared to particle-associated bacteria (paired Wilcoxon, p = 0.0001864). However, when comparing total vs. particle-associated bacteria within specific sampling dates, this trend only held true in March (p = 0.009766) and August (p = 0.02734). In April (p = 0.4161) and June (p = 0.1094), the lack of statistical difference between total and particle-associated bacteria suggests that microbial loading associated with sediment comprised a greater proportion of the overall microbial loading on these dates.
Concentration of TSS appears to be a key driver of particle-associated bacteria concentration throughout the surveyed distribution system, as indicated by the correlation between the two parameters (ρ = 0.3757624, p = 0.0184). However, TSS was not correlated with total bacteria (p = 0.1111).
Distribution system and hydraulic characteristics
The distribution system consists primarily of pipes made of PVC, ranging from 2 to 12 inches in diameter. By length, the distribution system consists primarily of 2″ (23.8%), 4″ (15.6%), 6″ (39.9%), 8″ (13.1%), and 10″ (2.7%) diameter pipe. All sampling sites were located on mains that ranged from 4″ to 10″ in diameter. Both total bacteria and particle-associated bacteria in the collected samples varied according to pipe diameter (Kruskal-Wallis, p = 0.04022, 0.04489) (Figure 5), however, TSS did not vary according to pipe diameter (p = 0.813).
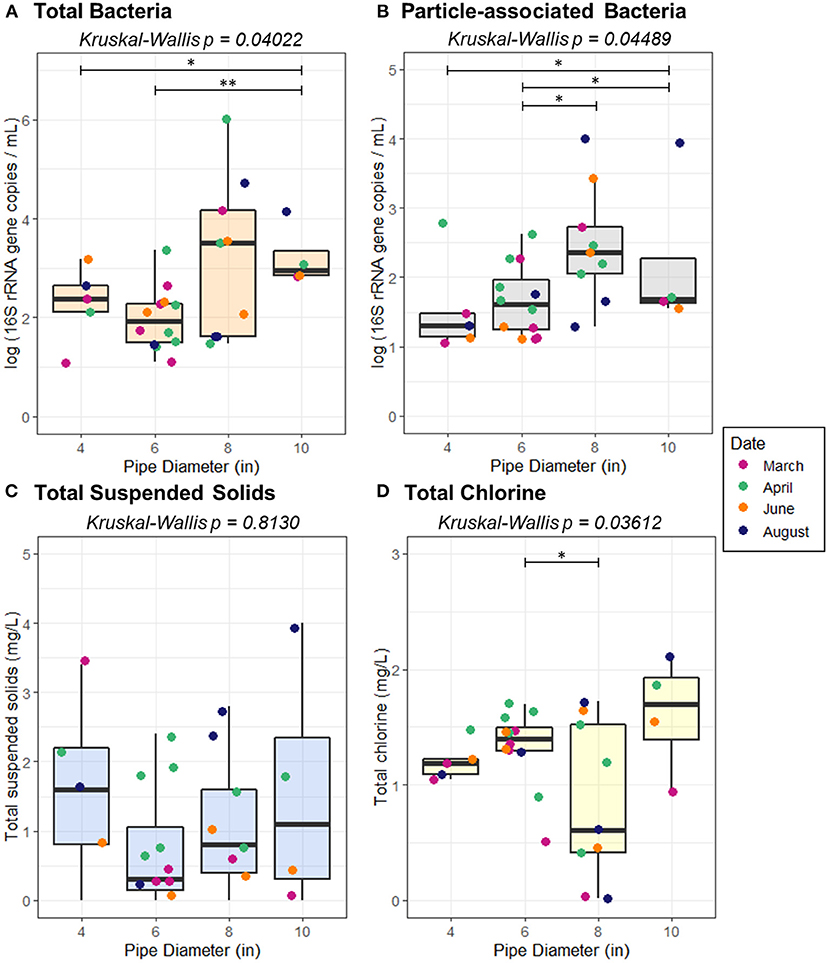
Figure 5. Abundance of (A) total bacteria (B) particle-associated bacteria, (C) total suspended solids, and (D) total chlorine as a function of pipe diameter. Pairwise statistical significance was assessed using a Wilcoxon Rank Sum Test; *p < 0.05, **p < 0.01.
Pressure and the pipe distance from the treatment plant were not correlated with TSS, total bacteria, or particle-associated bacteria (Figure 6). However, average velocity was negatively correlated with both total (Spearman, ρ = −0.4880, p = 0.0004334) and particle-associated bacteria (ρ = −0.3445, p = 0.01649). Average flow rate was negatively correlated with total bacteria (ρ = −0.3067, p = 0.03397), but not TSS or particle-associated bacteria (p ≥ 0.1429), as was the magnitude of flowrate variation (ρ = −0.3067, p = 0.03397). Average Reynold's number was also found to be an important factor associated with both the abundance of total (ρ = −0.4533, p = 0.001213) and particle-associated bacteria (ρ = −0.3834, p = 0.007152).
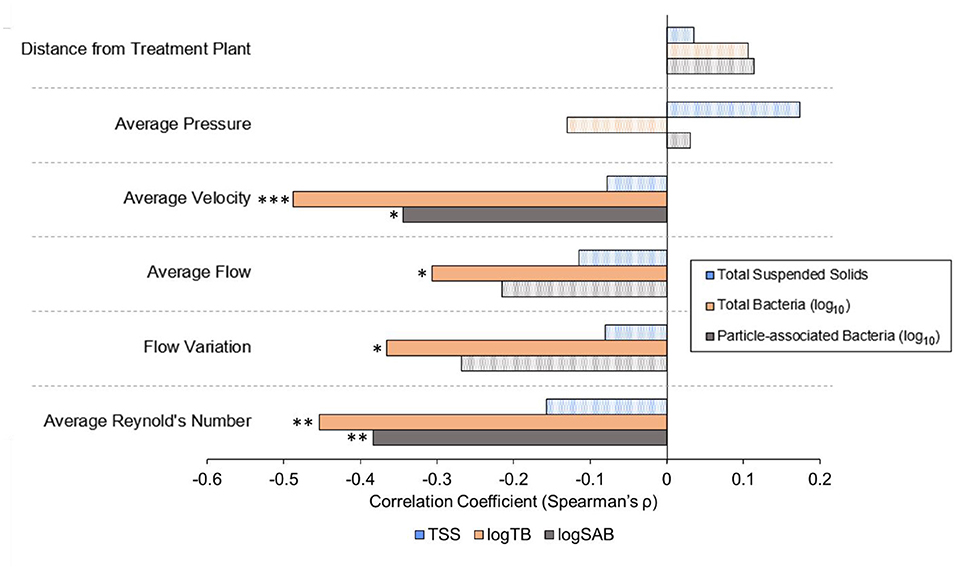
Figure 6. Spearman's rank sum correlation coefficients calculated between hydraulic or distribution system variables and key water quality data across all sampling dates. Solid bars represent statistically significant correlations (α = 0.05). Patterned bars are not statistically significant. P-values are indicated as * <0.05, ** <0.01, and ***0.001.
Flow regime was associated with total TSS (p = 0.03422) and total bacteria (p = 0.005709), but not sediment-associated bacteria (p = 0.1780; Figure 7). While a pairwise Wilcoxon test demonstrated that there was not a significant difference between high variable flow conditions and quasi steady state, quasi steady state conditions resulted in elevated TSS relative to low variable flow conditions (p = 0.01019). All pairwise comparisons between total bacteria abundance under varied flow regimes were significant; the greatest total bacteria concentration was present under quasi steady state conditions, followed by low variable flow, and high variable flow (p ≤ 0.03734). Average velocity, pressure, and flow rate all varied according to pipe diameter (p ≤ 0.00273). However, none of the examined distribution system characteristics (pipe diameter, pressure, velocity, flow, or pipe distance from the treatment plant) were correlated with the concentration of TSS (p ≥ 0.4119), suggesting that accumulation or transport of sediment alone is not the dominant driver of the bacterial distribution according to pipe diameter.
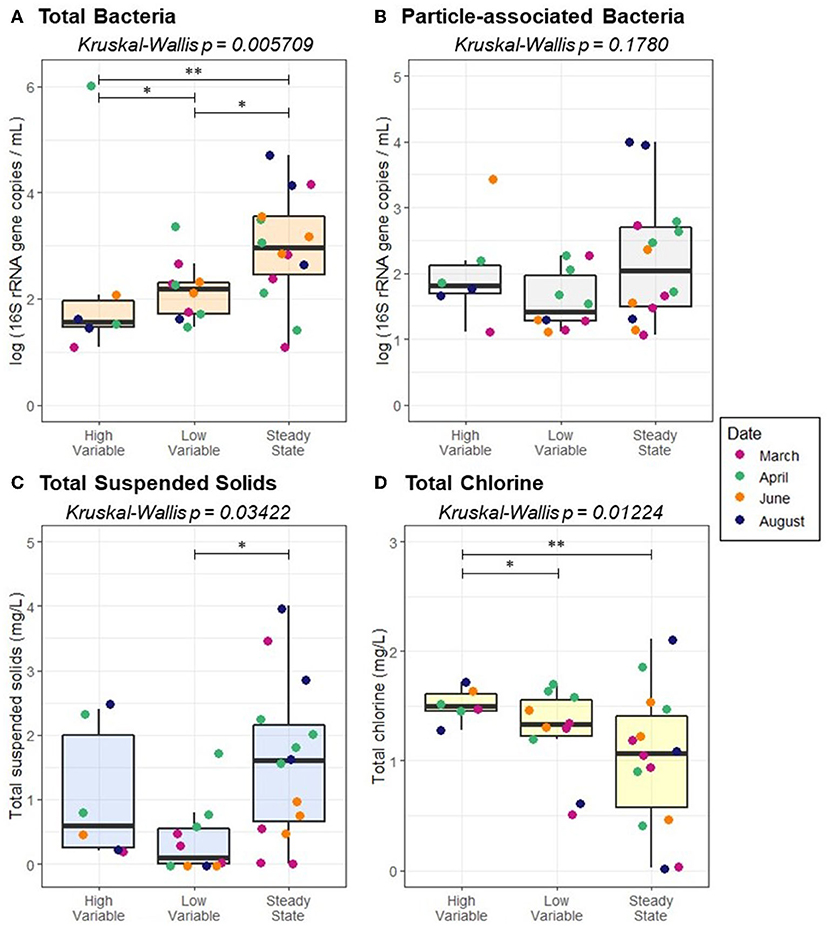
Figure 7. Abundance of (A) total bacteria (B) particle-associated bacteria, (C) total suspended solids, and (D) total chlorine as a function of flow regime. Pairwise statistical significance was assessed using a Wilcoxon Rank Sum Test; *p < 0.05, **p < 0.01.
Physicochemical water quality
Key physicochemical parameters were measured for each sample: total chlorine, pH, conductivity, temperature, turbidity, and TOC. Additionally, HPC was measured as an indicator of overall microbiological water quality. Results are summarized in Supplementary Tables 2–5. The water temperature increased with each sampling date, averaging 11.97 ± 2.35°C across all sites in March, 12.13 ± 1.64°C in April, 19.12 ± 0.80°C in June, and 23.7 ± 1.38°C in August. The average TOC across all sites was 8.35 ± 2.41 mg/L in March, 3.05 ± 0.44 mg/L in April, 8.54 ± 0.77 mg/L in June, and 13.51 ± 3.12 in August. TOC varied significantly across sampled dates (Kruskal-Wallis, p = 6.156e-9). This change was also observed in water leaving the treatment plant, suggesting this decrease was driven by changes in source water or treatment. However, temperature and TOC concentration were not correlated with concentrations of total or particle-associated bacteria (p ≥ 0.1790; Figure 8).
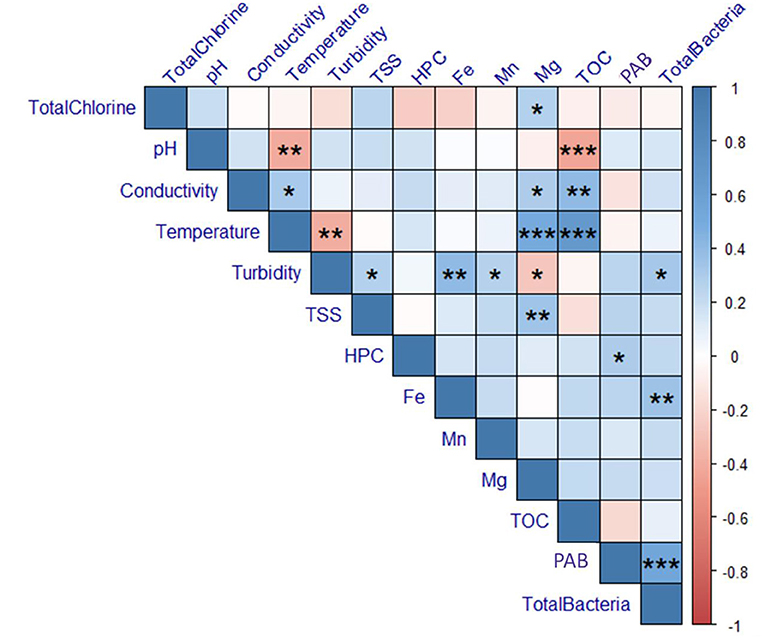
Figure 8. Correlations calculated for physicochemical and microbiological data for all sampling dates. Color indicates the magnitude of the Spearman's Correlation Coefficient (ρ). P-values are indicated as *0.05, **0.01, and ***0.001. Boxes that do not contain asterisks represent correlations that were not statistically significant (p-value > 0.05). TSS, total suspended solids; TOC, total organic carbon; HPC, heterotrophic plate count; PAB, particle-associated bacteria.
The total chlorine concentration across all sites averaged 1.24 ± 0.49 mg/L in March, 1.45 ± 0.37 mg/L in April, 1.26 ± 0.28 mg/L in June, and 1.39 ± 0.52 mg/L in August. With the exception of site 13, the total chlorine residual exceeded 0.5 mg/L in all samples across all sampling dates. However, samples collected from site 13 were consistently below 0.5 mg/L, with measurements at 0.03, 0.41, 0.46, and 0.02 mg/L during each sampling date, respectively. As expected, total chlorine was negatively correlated with pipe distance from the treatment plant (Spearman, ρ = −0.6149, p = 4.6170e-7), however, there was no relationship between total chlorine and total or particle-associated bacteria (p ≥ 0.4908). However, site 13, where chlorine was lowest, consistently exhibited among the highest concentrations of both total and particle-associated bacteria. When examining data from individual sampling dates alone (Supplementary Figures 1–4), total chlorine was negatively correlated with particle-associated bacteria in both March (ρ = −0.5774, p = 0.0306) and April (ρ = −0.6071, p = 0.0213).
Both turbidity and iron concentration were positively correlated with total bacteria (turbidity: ρ = 0.3225, p = 0.01533; iron: ρ = 0.3550, p = 0.007264). However, no physiochemical water quality parameters were correlated with particle-associated bacteria (p ≥ 0.059). While HPC was not associated with total bacteria, HPC was positively correlated with particle-associated bacteria (ρ = 0.2947, p = 0.02749).
Because pipe diameter was identified as a key distribution system characteristic that impacted both total and particle-associated bacteria concentrations, relationships between pipe diameter and physicochemical parameters were examined. Pipe diameter was associated with total chlorine (Kruskal-Wallis, p = 0.03612), but no other statistically significant correlations were identified. Flow regime was also found to influence total chlorine concentration (p = 0.01224; Figure 7D). Total chlorine was greater under high variable flow than both low variable flow and quasi steady state (p ≤ 0.02827).
Interactions between physicochemical and hydraulic variables were investigated using classification and regression trees. Results demonstrated that individual variables had the greatest impact on TSS and microbiological water quality compared to interactions of variables, but some nuanced interactions were found to exist (Supplementary Figures 5–7). For example, an iron concentration exceeding 0.17 mg/L resulted in a higher average TSS concentration of 2.2 mg/L on average (Supplementary Figure 5). At iron concentrations below 0.17 mg/L, TOC was identified as an important factor impacting TSS, with TOC concentrations >4.2 mg/L resulting in an average of 1.4 mg/L TSS. Total bacteria concentrations were highest when the maximum velocity observed during the 24-h extended period simulation remained below 0.05 m/s, averaging 3.6-log10 16S rRNA GC / mL (Supplementary Figure 6). At higher maximum velocities, high pH (>7.7) was associated with greater total bacteria concentrations (2.6-log10 16S rRNA GC/mL on average). At lower pH values, a high TOC concentration (>8.7 mg/L) was associated with greater total bacteria concentrations (2.0 vs. 1.3 log10 16S rRNA GC/mL). Particle-associated bacteria were also greatest when the maximum velocity remained below 0.05 m/s, averaging 2.6-log10 16S rRNA GC/mL (Supplementary Figure 7). For lower maximum velocities, a TOC concentration below 3.2 mg/L was associated with greater particle-associated bacteria (1.7-log10 16S rRNA GC/mL on average). At higher TOC concentrations, low pH (<7.5) was associated with 1.2-log10 16S rRNA GC/mL on average compared to 1.0 log10 16S rRNA GC/mL when iron exceeded 0.11 mg/L. While it is important to understand nuanced interactions of conditions that may drive abundance of TSS, total bacteria, and particle-associated bacteria, these results suggest that elevated iron concentration alone was associated with higher TSS concentrations, while maximum velocity alone was the greatest driver of elevated total and particle-associated bacteria.
Discussion
The results of this study demonstrate that particle-associated bacteria represent a substantial portion of the overall bacteria present in the studied distribution system. However, the dynamics between total and particle-associated bacteria in the distribution system varied widely, emphasizing the need to better understand this potentially important contributor to total microbial loading.
Routine flushing of drinking water distribution systems is often used as one component of an overall maintenance program. When conducted in conjunction with other preventative maintenance practices, flushing can help to remove accumulated sediment, reduce chlorine demand, reduce disinfection byproduct precursors, remove accumulated biofilm, prevent nitrification, and reduce compounds associated with taste and odor (Friedman et al., 2002). The concentration of TSS documented in this study (up to 4.2 mg/L) were greater than those observed in several previous studies, in which maximum detected TSS values ranged from 0.04 to 0.4 mg/L (Chen et al., 2020; Gauthier et al., 2001). Flushing resulted in a short-term increase in average concentration of TSS throughout the system, suggesting that flushing disturbed and redistributed accumulated sediment throughout the system, but eliminated hot spots of excessive sediment accumulation. While TSS concentration decreased by 9 weeks post-flushing, it had returned to pre-flush levels by 16 weeks post-flush. Therefore, it is important to recognize that flushing may have short-term impacts on water quality at some sites. This is consistent with previous research by Besner et al. (2007) that identified unidirectional flushing as a cause of both customer complaints and detection of HPC bacteria, but notes that flushing can still be an important part of a robust operation and maintenance plan. Long-term benefits and management of sites with particular water quality detriments should be carefully weighed with this information in mind.
Flushing of the system did effectively decrease TSS concentration in water collected from the storage tank, where it was previously detected at greater concentrations than any point sampled from the distribution system. This result, paired with the observed increase in sediment and particle-associated bacteria throughout the distribution system after flushing suggests that sediment accumulated in the tank may have been resuspended and redistributed into the distribution system as a result of flushing, consistent with the findings of previous work conducted by Ho et al. (2016). Careful management of sediment accumulated in storage tanks is critical, as demonstrated when one city in Massachusetts flushed several tanks containing 2″-6″ of accumulated sediment, resulting in widespread contamination of their distribution system with total coliform bacteria (U. S. Environmental Protection Agency, 2002a). Therefore, routine tank flushing is likely still beneficial despite the potential for resuspension of accumulated sediment.
In pre-flush samples, total bacteria concentration was elevated relative to particle-associated bacteria, but not in samples collected 9 or 16 weeks post-flush. This indicates that bacteria associated with sediment were a greater contributor to total microbial loading in bulk water post-flushing relative to before flushing. This suggests that particle-associated bacteria may be resuspended within the system as a result of flushing. However, the trend was not sufficient to affect the total microbial loading, as total bacteria concentration did not vary significantly according to sampling date. Similarly, TSS concentration was positively correlated with particle-associated bacteria, but not total bacteria, further emphasizing that sediment in the system may convey bacteria, but this is not the dominant driver of overall bacterial abundance in the system. El-Chakhtoura et al. (2018) found that flushing resulted in an increase in biomass within a distribution system due to biofilm sloughing and resuspension of loose deposits. The findings herein suggest that resuspension of particles and the associated biofilms may also be an important contributor to increased biomass as a result of flushing.
While many previous studies have examined the relationship between physicochemical water quality in distribution systems and microbial loading (Garner et al., 2018; Li et al., 2018; Perrin et al., 2019; Kennedy et al., 2021), distribution system characteristics and hydraulic factors have often been overlooked. In this study, distribution system characteristics such as distance from the treatment plant and pipe diameter were examined, along with hydraulic factors, such as pressure, velocity, flowrate, and flow regime. Pipe diameter was found to be an important factor driving the abundance of both total and particle-associated bacteria, as well as total chlorine concentration. None of the examined distribution system or hydraulic characteristics that are impacted by or vary in correlation with pipe diameter (distance from the treatment plant, pressure, velocity, flowrate, Reynold's number) were found to be associated with TSS. However, average velocity and Reynold's number were both found to be negatively correlated with total and particle-associated bacteria. This inconsistency between factors associated with TSS and bacteria suggests that accumulation or transport of sediment alone is not the dominant driver of the bacterial distribution.
Average flowrate was negatively correlated with total bacteria but not TSS or particle-associated bacteria. This is likely due to the fact that high flow rates are expected to prevent the accumulation of sediment. In contrast to these findings, Prest et al. (2021) previously found that fluctuations in hydraulic conditions were an important driver of particles and turbidity in a drinking water distribution system, but were not associated with changes in the concentration of suspended microbial cells. Other studies have found that increased flow rate is associated with a release of both TSS and microbial cells into the bulk water from pipe biofilms (Choi and Morgenroth, 2003; Husband et al., 2008; Paul et al., 2012). The association of total bacteria with lower flow rates observed in our findings may be explained by previous work that demonstrated that highly varied flow rates are associated with more compact biofilms, resulting in less sloughing of bacteria from pipe surfaces into the bulk water than under lower flow conditions (Douterelo et al., 2013). Therefore, both flow rate as well as the degree of routine variation of flow rate observed in a drinking water distribution system appear to have important implications for concentration of TSS, total bacteria, and particle-associated bacteria throughout the system.
Flow regime was associated with total chlorine concentration, with chlorine highest under high variable flow conditions, likely because such conditions result in a high rate of water turnover. As expected, quasi-steady state flow tended to occur at distal sites located farthest from the treatment plant. Given this is also where total chlorine levels are typically lowest, it is not surprising that total bacteria were greatest under quasi-steady state conditions. Though particle-associated bacteria were on average highest under quasi-steady state conditions, the trend was not statistically significant. This suggests that other factors are likely to have a greater influence on the abundance of total bacteria in the system other than contribution of biofilms adhered to sediment. For example, sloughing from biofilms or regrowth of planktonic bacteria may be key drivers of this trend relative to particle-associated bacteria. Douterelo et al. (2013) previously found that biofilms formed on drinking water pipe surfaces tended to have higher richness and diversity under highly varied flow conditions, and certain genera that contain human pathogens, such as Pseudomonas, were enriched under steady state and low variable flow conditions. Sharpe et al. (2012) demonstrated that biofilms conditioned under higher shear stress resulted in less sloughing of biomass during flushing. Vrouwenvelder et al. (2010) observed that biofilms conditioned with low shear stress in a membrane filtration system became easily mobilized into the water column during turbulence. Within the context of this past work, our findings suggest that biofilm characteristics impacted by flow conditions as well as renewal of high-chlorine treated water and the lack of accumulated sediment may contribute to low microbial loading under high variable flow conditions.
Management of sediment in drinking water distribution systems is important because sediments can promote biofilm growth, and biofilms can provide protection for pathogens against disinfectant residuals (U. S. Environmental Protection Agency, 2002b). A study by Lu et al. (2015) found that sediments collected from municipal drinking water storage tanks conveyed biofilms containing Legionella, Mycobacterium, Pseudomonas, and Acanthamoeba. van der Wielen and Lut (2016) found that drinking water distribution system sediment conveyed Pseudomonas aeruginosa, Aspergillus fumigatus, and Stenotrophomonas maltophilia. S. maltophilia was only found on sediment and was not present in pipe wall biofilms, demonstrating that particle-associated biofilms may provide a unique environment warranting further study. While this study establishes that microorganisms associated with sediment are prevalent throughout the studied drinking water distribution system, more work is needed to clarify whether these organisms represent potential health threats, such as coliforms and opportunistic pathogens.
Conclusion
This study demonstrated that particle-associated bacteria are widespread throughout the studied drinking water distribution system. Velocity and Reynold's number were found to be important variables negatively correlated with both total and particle-associated bacteria. Flowrate and flow regime were associated with total bacteria but not particle-associated bacteria. However, the concentration of TSS was not impacted by any of these variables. The results of this study indicated that TSS, total bacteria, and particle-associated bacteria concentrations often followed disparate trends, demonstrating that their abundance is differentially influenced by a complex combination of physicochemical and hydraulic factors. Additional research is needed to understand the key drivers of particle-associated bacterial loading in drinking water distribution systems. Such work would be most valuable if conducted in conjunction with the study of other matrices of microbial growth in distribution systems: biofilms on pipe walls, loose deposits, and planktonic bacteria. Further research should also focus on elucidating the types of bacteria that are conveyed on sediment surfaces to determine if they present an elevated risk to human health.
Data availability statement
The original contributions presented in the study are included in the article/Supplementary material, further inquiries can be directed to the corresponding author.
Author contributions
EO, MH, and EG collected samples and field measurements. EO and MH completed all lab analyses. EO and EG conducted data analysis and wrote the article. EG obtained funding. All authors contributed to the article and approved the submitted version.
Funding
This work was funded by a Faculty Research and Scholarship Advancement Grant from the West Virginia University Research Office.
Acknowledgments
We would like to thank Emily Kwiatkowski and the water utility staff for assistance collecting samples.
Conflict of interest
The authors declare that the research was conducted in the absence of any commercial or financial relationships that could be construed as a potential conflict of interest.
Publisher's note
All claims expressed in this article are solely those of the authors and do not necessarily represent those of their affiliated organizations, or those of the publisher, the editors and the reviewers. Any product that may be evaluated in this article, or claim that may be made by its manufacturer, is not guaranteed or endorsed by the publisher.
Supplementary material
The Supplementary Material for this article can be found online at: https://www.frontiersin.org/articles/10.3389/frwa.2022.959618/full#supplementary-material
References
Abokifa, A. A., Yang, Y. J., Lo, C. S., and Biswas, P. (2016). Investigating the role of biofilms in trihalomethane formation in water distribution systems with a multicomponent model. Water Res. 104, 208–219. doi: 10.1016/j.watres.2016.08.006
APHA (2005). Water Environmental Federation, Standard methods for the examination of water and wastewater. Washington, DC: Water Environment Federation; American Public Health Association.
Batte, M., Appenzeller, B. M. R., Grandjean, D., Fass, S., Gauthier, V., Jorand, F., et al. (2003). Biofilms in drinking water distribution systems. Rev. Environ. Sci. Bio/Technol. 2, 147–168. doi: 10.1023/B:RESB.0000040456.71537.29
Beer, K. D., Gargano, J. W., Roberts, V. A., Hill, V. R., Garrison, L. E., Kutty, P. K., et al. (2015). Surveillance for waterborne disease outbreaks associated with drinking water—United States, 2011–2012. Morbid. Mort. Weekly Rep. 64, 842–848. doi: 10.15585/mmwr.mm6431a2
Benedict, K. M., Reses, H., Vigar, M., Roth, D. M., Roberts, V. A., Mattioli, M., et al. (2017). Surveillance for waterborne disease outbreaks associated with drinking water—United States, 2013–2014. MMWR. 66, 1216–1221. doi: 10.15585/mmwr.mm6644a3
Besner, M. C., Gauthier, V., Trépanier, M., Martel, K., and Prévost, M. (2007). Assessing the effect of distribution system OandM on water quality. J. AWWA. 99, 77–91. doi: 10.1002/j.1551-8833.2007.tb08082.x
Blokker, E. J. M., and Schaap, P. G. (2015). Particle accumulation rate of drinking water distribution systems determined by incoming turbidity. Proc. Eng. 119, 290–298. doi: 10.1016/j.proeng.2015.08.888
Bowen, P. T., Harp, J. F., Baxter, J. W., and Shull, R. D. (1993). Residential Water Use Patterns. Washington, DC: American Water Works Association Research Foundation. Report No.: 418.
Chen, L., Li, X., van der Meer, W., Medema, G., and Liu, G. (2022). Capturing and tracing the spatiotemporal variations of planktonic and particle-associated bacteria in an unchlorinated drinking water distribution system. Water Res. 219, 118589. doi: 10.1016/j.watres.2022.118589
Chen, L., Ling, F., Bakker, G., Liu, W. T., Medema, G., van der Meer, W., et al. (2020). Assessing the transition effects in a drinking water distribution system caused by changing supply water quality: an indirect approach by characterizing suspended solids. Water Res. 168, 115159. doi: 10.1016/j.watres.2019.115159
Choi, Y. C., and Morgenroth, E. (2003). Monitoring biofilm detachment under dynamic changes in shear stress using laser-based particle size analysis and mass fractionation. Water Sci. Technol. 47, 69–76. doi: 10.2166/wst.2003.0284
Douterelo, I., Husband, S., and Boxall, J. B. (2014). The bacteriological composition of biomass recovered by flushing an operational drinking water distribution system. Water Res. 54, 100–114. doi: 10.1016/j.watres.2014.01.049
Douterelo, I., Sharpe, R. L., and Boxall, J. B. (2013). Influence of hydraulic regimes on bacterial community structure and composition in an experimental drinking water distribution system. Water Res. 47, 503–516. doi: 10.1016/j.watres.2012.09.053
El-Chakhtoura, J., Saikaly, P. E., van Loosdrecht, M. C. M., and Vrouwenvelder, J. S. (2018). Impact of distribution and network flushing on the drinking water microbiome. Front. Microbiol. 9, e02205. doi: 10.3389/fmicb.2018.02205
Falkinham, J. O., Pruden, A., and Edwards, M. (2015). Opportunistic premise plumbing pathogens: increasingly important pathogens in drinking water. Pathogens. 4, 373–386. doi: 10.3390/pathogens4020373
Friedman, M., Ashbolt, N., Hanson, A., Meteer, L., and Ureta, A. (2017). “Understanding and managing biofilm, coliform occurence, and the microbial community,” in Water Quality in Distribution Systems. 1st Edn. (Denver, CO: American Water Works Association). (Manual of water supply practices).
Friedman, M., Kirmeyer, G. J., and Antoun, E. (2002). Developing and implementing a distribution system flushing program. J. AWWA. 94, 48–56. doi: 10.1002/j.1551-8833.2002.tb09505.x
Garner, E., McLain, J., Bowers, J., Engelthaler, D. M., Edwards, M. A., Pruden, A., et al. (2018). Microbial ecology and water chemistry impact regrowth of opportunistic pathogens in full-scale reclaimed water distribution systems. Environ. Sci. Technol. 52, 9056–9068. doi: 10.1021/acs.est.8b02818
Gauthier, V., Barbeau, B., Millette, R., Block, J. C., and Prévost, M. (2001). Suspended particles in the drinking water of two distribution systems. Water Sci. Technol. Water Supp. 1, 237–245. doi: 10.2166/ws.2001.0089
Harrell, F. E. (2022). Functions CD (contributed several functions and maintains latex. Hmisc: Harrell Miscellaneous. Available online at: https://CRAN.R-project.org/package=Hmisc (accessed July 13, 2022).
Ho, C. K., Christian, J. M., Ching, E. J., Slavin, J., Ortega, J., Murray, R., et al. (2016). Sediment resuspension and transport in water distribution storage tanks. J. AWWA. 108, E349–E361. doi: 10.5942/jawwa,.2016.108.0077
Husband, P. S., Boxall, J. B., and Saul, A. J. (2008). Laboratory studies investigating the processes leading to discolouration in water distribution networks. Water Res. 42, 4309–4318. doi: 10.1016/j.watres.2008.07.026
Kennedy, L. C., Miller, S. E., Kantor, R. S., and Nelson, K. L. (2021). Effect of disinfectant residual, pH, and temperature on microbial abundance in disinfected drinking water distribution systems - Environmental Science: Water Research and Technology (RSC Publishing). Environ Sci Water Res Technol. 1, D0EW00809E. doi: 10.1039/D0EW00809E
Li, W., Zhang, J., Wang, F., Qian, L., Zhou, Y., Qi, W., et al. (2018). Effect of disinfectant residual on the interaction between bacterial growth and assimilable organic carbon in a drinking water distribution system. Chemosphere. 202, 586–597. doi: 10.1016/j.chemosphere.2018.03.056
Liu, G., Bakker, G. L., Li, S., Vreeburg, J. H. G., Verberk, J. Q. J. C., Medema, G. J., et al. (2014). Pyrosequencing reveals bacterial communities in unchlorinated drinking water distribution system: an integral study of bulk water, suspended solids, loose deposits, and pipe wall biofilm. Environ. Sci. Technol. 48, 5467–76. doi: 10.1021/es5009467
Liu, G., Verberk, J. Q. J. C., and Van Dijk, J. C. (2013). Bacteriology of drinking water distribution systems: an integral and multidimensional review. Appl. Microbiol. Biotechnol. 97, 9265–9276. doi: 10.1007/s00253-013-5217-y
Liu, S., Gunawan, C., Barraud, N., Rice, S. A., Harry, E. J., Amal, R., et al. (2016). Understanding, monitoring, and controlling biofilm growth in drinking water distribution systems. Environ. Sci. Technol. 50, 8954–8976. doi: 10.1021/acs.est.6b00835
Lu, J., Struewing, I., Yelton, S., and Ashbolt, N. (2015). Molecular survey of occurrence and quantity of Legionella spp., Mycobacterium spp., Pseudomonas aeruginosa and amoeba hosts in municipal drinking water storage tank sediments. J. Appl. Microbiol. 119, 278–288. doi: 10.1111/jam.12831
Milborrow, S. (2022). rpart.plot: Plot “rpart” Models: An Enhanced Version of “plot.rpart”. Available online at: https://CRAN.R-project.org/package=rpart.plot (accessed July 13, 2022).
Paul, E., Ochoa, J. C., Pechaud, Y., Liu, Y., and Liné, A. (2012). Effect of shear stress and growth conditions on detachment and physical properties of biofilms. Water Res. 46, 5499–5508. doi: 10.1016/j.watres.2012.07.029
Perrin, Y., Bouchon, D., Delafont, V., Moulin, L., and Héchard, Y. (2019). Microbiome of drinking water: a full-scale spatio-temporal study to monitor water quality in the Paris distribution system. Water Res. 149, 375–385. doi: 10.1016/j.watres.2018.11.013
Pothof, I. W. M., and Blokker, E. J. M. (2012). Dynamic hydraulic models to study sedimentation in drinking water networks in detail. Drink Water Eng. Sci. 5, 87–92. doi: 10.5194/dwes-5-87-2012
Prest, E. I., Schaap, P. G., Besmer, M. D., and Hammes, F. (2021). Dynamic hydraulics in a drinking water distribution system influence suspended particles and turbidity, but not microbiology. Water. 13, 109. doi: 10.3390/w13010109
Proctor, C. R., and Hammes, F. (2015). Drinking water microbiology–from measurement to management. Curr. Opin. Biotechnol. 33, 87–94. doi: 10.1016/j.copbio.2014.12.014
R Core Team (2020). R: A Language and Environment for Statistical Computing. R Foundation for Statistical Computing. Available online at: https://www.R-project.org/ (accessed June 1, 2022).
Semanuik, S. M., Fiske, P., Smith, K. S., and Wade, J. (2017). “Infrastructure integrity and water quality,” in Water Quality in Distribution Systems. 1st Edn (Denver, CO: American Water Works Association). (Manual of water supply practices).
Sharpe, R. L., Smith, C. J., Boxall, J. B., and Biggs, C. A. (2012). “Pilot scale laboratory investigations into the impact of steady state conditioning flow on potable water discolouration,” in 12th Annual Conference on Water Distribution Systems Analysis (WDSA) (Tucson, AZ: American Society of Civil Engineers), 494–506. Available online at: https://ascelibrary.org/doi/abs/10.1061/41203%28425%2947
Smith, K., and Alspach, B. (2019). Consider the “big 10” distribution water quality challenges. J> AWWA. 111, 71–72. doi: 10.1002/awwa.1400
Suzuki, M. T., Taylor, L. T., and DeLong, E. F. (2000). Quantitative analysis of small-subunit rRNA genes in mixed microbial populations via 5′-nuclease assays. Appl. Environ. Microbiol. 66, 4605–4614. doi: 10.1128/AEM.66.11.4605-4614.2000
Therneau, T., and Atkinson, B. (2022). rpart: Recursive Partitioning and Regression Trees. Available online at: https://CRAN.R-project.org/package=rpart (accessed July 13, 2022).
U. S. Environmental Protection Agency (2002a). Finished Water Storage Facilities. Washington, DC: U. S. Environmental Protection Agency. 24.
U. S. Environmental Protection Agency (2002b). Health Risks From Microbial Growth and Biofilms in Drinking Water Distribution Systems. 52. Washington, DC.
U. S. Environmental Protection Agency (2015). Adherence of Chemical, Biological, and Radiological Contaminants to Sediments Found in Water Storage Tanks. Washington, DC: U. S. Environmental Protection Agency.
Vacs Renwick, D., Heinrich, A., Weisman, R., Arvanaghi, H., and Rotert, K. (2019). Potential public health impacts of deteriorating distribution system infrastructure. J. AWWA. 111, 42–53. doi: 10.1002/awwa.1235
van der Wielen, P. W. J. J., and Lut, M. C. (2016). Distribution of microbial activity and specific microorganisms across sediment size fractions and pipe wall biofilm in a drinking water distribution system. Water Sci. Technol. Water Supply. 16, 896–904. doi: 10.2166/ws,.2016.023
Vreeburg, I. J. H. G., and Boxall, J. B. (2007). Discolouration in potable water distribution systems: A review. Water Res. 41, 519–529. doi: 10.1016/j.watres.2006.09.028
Vreeburg, J. H. G., Schippers, D., Verberk, J. Q. J. C., and van Dijk, J. C. (2008). Impact of particles on sediment accumulation in a drinking water distribution system. Water Res. 42, 4233–4242. doi: 10.1016/j.watres.2008.05.024
Vrouwenvelder, J. S., Buiter, J., Riviere, M., van der Meer, W. G. J., van Loosdrecht, M. C. M., Kruithof, J. C., et al. (2010). Impact of flow regime on pressure drop increase and biomass accumulation and morphology in membrane systems. Water Res. 44, 689–702. doi: 10.1016/j.watres.2009.09.054
Wei, T., and Simko. (2021). R package “corrplot”: Visualization of a Correlation Matrix. Available online at: https://github.com/taiyun/corrplot (accessed July 13, 2022).
Wickham, H. (2016). ggplot2: Elegant Graphics for Data Analysis. Available online at: https://cran.r-project.org/web/packages/ggplot2/citation.html (accessed July 13, 2022).
Yoder, J., Roberts, V., Craun, G. F., Hill, V., Hicks, L. A., Alexander, N. T., et al. (2008). Surveillance for waterborne disease and outbreaks associated with drinking water and water not intended for drinking–United States, 2005-2006. Morb. Mort. Weekly Rep. Surv. Summ. 57, 39–62. Available online at: https://www.cdc.gov/mmwr/preview/mmwrhtml/ss5709a4.htm
Zhang, R., Liu, B., Lau, S. C. K., Ki, J. S., and Qian, P. Y. (2007). Particle-attached and free-living bacterial communities in a contrasting marine environment: Victoria Harbor, Hong Kong. FEMS Microbiol. Ecol. 61, 496–508. doi: 10.1111/j.1574-6941.2007.00353.x
Keywords: drinking water, distribution system, sediment, microbial water quality, flow regime
Citation: Osborne E, Haddix M and Garner E (2022) Impact of hydraulic and physicochemical factors on spatiotemporal variations of particle-associated bacteria in a drinking water distribution system. Front. Water 4:959618. doi: 10.3389/frwa.2022.959618
Received: 01 June 2022; Accepted: 24 August 2022;
Published: 12 September 2022.
Edited by:
Raymond M. Hozalski, University of Minnesota Twin Cities, United StatesReviewed by:
Cheng Yan, China University of Geosciences Wuhan, ChinaWencong Lai, Bob Jones University, United States
Copyright © 2022 Osborne, Haddix and Garner. This is an open-access article distributed under the terms of the Creative Commons Attribution License (CC BY). The use, distribution or reproduction in other forums is permitted, provided the original author(s) and the copyright owner(s) are credited and that the original publication in this journal is cited, in accordance with accepted academic practice. No use, distribution or reproduction is permitted which does not comply with these terms.
*Correspondence: Emily Garner, ZW1pbHkuZ2FybmVyQG1haWwud3Z1LmVkdQ==