 Sayalee Joshi1,2
 Rain Richard3Carlos Levya4Joanna Ciol Harrison1,2Daniella Saetta5
 Naushita Sharma1,6Lucas Crane1,7
 Noelle Mushro1,2
 Lucien Dieter2,8
 Grace V. Morgan2
 Ashley Heida2Bennett Welco1,2Treavor H. Boyer1,7
 Paul Westerhoff1,6
 Kerry A. Hamilton1,2*
- 1The School of Sustainable Engineering and the Built Environment, Arizona State University, Tempe, AZ, United States
- 2The Biodesign Institute Center for Environmental Health Engineering, Arizona State University, Tempe, AZ, United States
- 3Department of Wastewater and Drinking Water Engineering, Narasimhan Consulting Services (NCS) Engineering, Phoenix, AZ, United States
- 4Department of Electrical Design and Electrical Engineering, Narasimhan Consulting Services (NCS) Engineering, Phoenix, AZ, United States
- 5Department of Environmental Engineering, University of South Florida, Tampa, FL, United States
- 6Nanosystems Engineering Research Center for Nanotechnology-Enabled Water Treatment, School of Sustainable Engineering and the Built Environment, Arizona State University, Tempe, AZ, United States
- 7Biodesign Swette Center for Environmental Biotechnology, Arizona State University, Tempe, AZ, United States
- 8Department of Chemical and Environmental Engineering, Yale University, New Haven, CT, United States
Introduction: Legionella pneumophila is an opportunistic pathogen that is a key contributor to drinking water-associated disease outbreaks in the United States. Prolonged water stagnation periods in building plumbing systems due to low occupancy, especially during building shutdowns, breaks, and holidays, can lead to water quality deterioration and (re)colonization of buildings with L. pneumophila. Water monitoring in buildings typically relies on grab samples with small datasets.
Methods: In this study, a larger dataset was created by sampling a Leadership in Energy and Environmental Design (LEED)-certified data-rich commercial building for L. pneumophila and physical-chemical water quality during the COVID-19 pandemic after reduced building occupancy. A proxy for human occupancy rates using WIFI logins was recorded throughout the study period.
Results: L. pneumophila was observed in grab samples taken throughout the building, where concentrations generally increased with greater distances from the building point of entry to locations throughout the building. Factors conducive to microbial growth were identified in the building including fluctuations in water temperatures, lack of chlorine residual, a low water heater setpoint, colonized water-saving fixtures, prolonged stagnation throughout the building; especially in an expansion tank designed to reduce pressure issues during demand fluctuations, and the presence of oversized softener tanks with ion exchange resin that contributed to chlorine residual removal as well as colonization of the resin with L. pneumophila.
Discussion: Flushing and thermal disinfection alone did not resolve the problem, and replacement of the expansion tank ultimately resolved the L. pneumophila issue. As ad-hoc approaches are logistically- and time-intensive, more proactive approaches are needed for informing preventative and corrective actions for reducing the risk of exposure to opportunistic pathogens in the building plumbing.
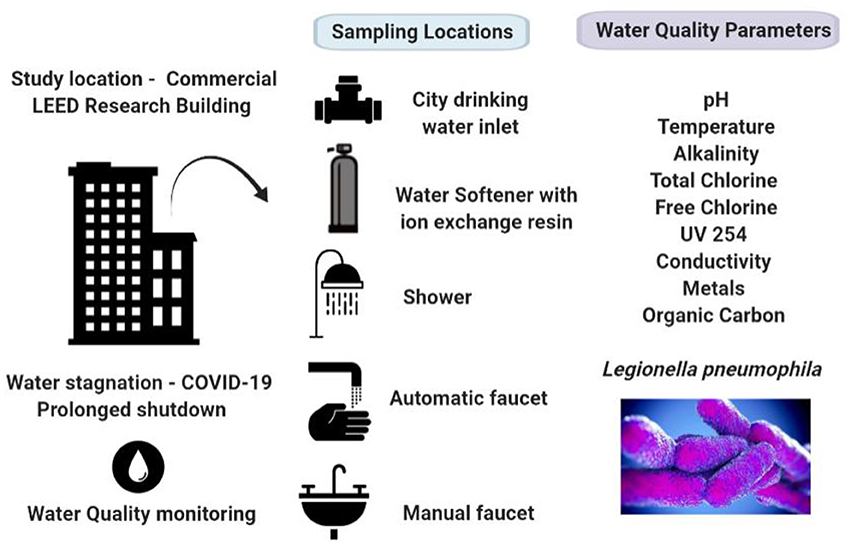
Graphical Abstract. Summary of water sampling locations and water quality parameters monitored.
Introduction
Drinking water pathogens of the immunocompromised (DWPI), also known as opportunistic premise plumbing pathogens (OPPPs), are microbes that primarily inhabit building water systems and tend to infect people with weakened immune systems (Proctor et al., 2022). Populations at higher risk include people who are immunocompromised or have pre-existing conditions, the elderly, and smokers (WHO, 2007). DWPI share several common characteristics such as resistance to disinfection, biofilm formation, growth in protozoa such as amoeba, growth at low organic carbon concentrations (oligotrophs), and growth under stagnation conditions (Falkinham, 2015; Nisar et al., 2020). The most common DWPI that are the focus of sampling efforts and are also commonly found in building water systems are Legionella pneumophila, Mycobacterium avium complex (MAC), Pseudomonas aeruginosa, Methylobacterium spp., Acinetobacter baumanii, and Aeromonas hydrophila (Falkinham et al., 2015), however, additional pathogens are included in this group and are infrequently the subject of sampling efforts (Proctor et al., 2022). Two of these pathogens, L. pneumophila and MAC, are included in the United States Environmental Protection Agency (USEPA) Contaminant Candidate List (CCL), with maximum contaminant level goals (MCLG) of zero pathogens in water systems (USEPA, 2022).
L. pneumophila causes the pneumonia-like illness Legionnaires' disease as well as a milder illness, Pontiac fever (WHO, 2018), which together are referred to as Legionellosis. In particular, L. pneumophila is the most common cause of waterborne disease outbreaks due to drinking water exposures in the USA (Beer, 2015; Benedict et al., 2017; CDC, 2019), with L. pneumophila serogroup 1 accounting for 85–90% of illness cases worldwide (Dedicoat and Venkatesan, 1999; Tchounwou, 2022). While other serogroups can also cause disease, the urine antigen diagnostic test commonly performed in hospitals only focuses on serotype 1 due to its high specificity and modest sensitivity (Reller et al., 2003; Yu and Stout, 2009). Illness due to Legionella tends to be undiagnosed and underreported (Neil and Berkelman, 2008). Legionnaire's disease has a high (5–30%) case fatality rate (Soda et al., 2017; WHO, 2018). In the US, the estimated annual hospitalization cost from legionellosis is ~430 million USD with more than 10,000 reported cases per year. Several fixtures such as faucets, toilets, washers, and showers are sources of bioaerosols in the premise plumbing environment and can result in exposures. Building water system characteristics such as pipes with smaller diameters providing higher surface area-to-volume ratios for microbial growth, leaching of pipe materials, water age, and temperature fluctuations also can support increased biological activity in drinking water (Rhoads et al., 2015, 2016).
Of these factors, the impact of water stagnation and its role in reducing chlorine residual is thought to be a driver of Legionella spp. colonization in building water systems, however quantitative evidence is sparse (Liang, 2021; Rhoads and Hammes, 2021). During the COVID-19 pandemic, reduced occupancy raised concerns regarding increased exposures for people using or re-entering buildings (Hozalski et al., 2020; Proctor et al., 2020; Cassell et al., 2021). Continued concern regarding stagnation in buildings is associated with building shutdowns, reduced occupancy due to hybrid working modes, holidays, and other periods of low occupancy. Stagnation can decrease system hot water temperatures to within a favorable Legionella growth range (~25 to 45°C). Increasing water age also decreases disinfection residual, favoring higher microbial growth in the building plumbing. Metal release, disinfection by-production formation, and pathogen proliferation could result in water quality deterioration which are public health concerns (Zlatanović et al., 2017). Lead and copper have USEPA MCLs of 15 and 1300 ppb (action levels), respectively (USEPA, 1991). Lead is a concern for negative impacts on behavior and cognitive impairments in children, as well as cardiovascular, kidney effects, and reproductive issues in adults (USEPA, 2016). Elevated copper levels can result in gastrointestinal, kidney, or liver issues as well as complications for Wilson's disease patients (USEPA, 2008). Lead and copper are primarily considered as contaminants but corrosion can stimulate the growth of Legionella and iron is an essential nutrient for Legionella growth (States et al., 1985; Schwake et al., 2016; Cullom et al., 2020).
Building water management practices play an important role in controlling water quality in building water systems (Clopper et al., 2021; Logan-Jackson, A. R. and Rose, 2021), however building water management plans are typically developed on an ad-hoc basis using broad guidelines as a reference point rather than using a tailored site-specific approach (National Academies of Sciences, 2019). Given the need for and importance of comprehensive water management programs in large, commercial-institutional buildings and the human health threat from Legionella infection, it is crucial to assess the likelihood of a hazard and reduce exposures to ensure occupants' safety. According to the World Green Building Council, LEED or green buildings are designed, constructed, and operated to reduce negative impacts on climate and the natural environment. Green buildings without proper management can exacerbate DWPI and other water quality problems in the drinking water due to high retention time, temperature fluctuation, and low disinfectant residual (Aw et al., 2022).
Thus, the objectives of this study are to (1) quantify L. pneumophila, metals, and water quality parameters in a green building during a period of reduced occupancy in hot water and mixed hot and cold water; (2) pinpoint the factors causing contamination and evaluate the impact of water management interventions; and (3) evaluate statistical relationships between L. pneumophila contamination and other water quality factors. As the practice of remote work continues to become more common (Felstead and Henseke, 2017), and occupancy patterns remain variable (Mantesi et al., 2022) amid hybrid working patterns, the impacts of the current work extend beyond the COVID-19 pandemic. The goal is for these findings to inform the development of water management plans for green buildings.
Materials and methods
Building description
A Platinum Leadership in Energy and Environmental Design (LEED) certified commercial research building located in Tempe, Arizona was chosen for study. The building construction was completed in 2018. It is a five-story commercial research building with a basement and penthouse complex (mechanical space). The building has both lab and office space with an area of 17,558 m2. The overall building capacity is ~400 scientists and staff. Each floor has breakrooms and restrooms along with lab and office areas. The building basement has a climate controlled mechanical room with a heat exchanger and a whole building water softener. The restrooms have automatic sensor faucets with blended cold and hot water, whereas the breakrooms have manual faucets along with an icemaker and drinking water reverse osmosis (RO) spigot at each tap location. Basement restrooms have showers. It is common to have showers in a LEED building as they provide LEED credits that are used to determine LEED certification (USGBC, 2019). All the faucets in this building have aerators to prevent splashing and produce straight, evenly pressurized streams. Drinking water fountains are located in alcoves adjacent to the restrooms. The hot water from the heat exchanger runs through a water recirculation loop. Overall, the building has 6 manual faucets, 30 automatic faucets, 10 water fountains, 5 RO spigots, 5 icemakers, and 2 showers in non-laboratory areas. Laboratory areas may contain additional faucets, refrigerators, ice machines, eye wash stations, etc., however these are restricted access and an accurate inventory of these areas was not obtained. As this building is a LEED building, it was constructed with high standards of sustainability, saving 44% energy and 42% water consumption with efficient use of utilities and efficient architecture compared to a conventional building (Williams, 2019). The building receives municipal treated drinking water as domestic cold water (DCW) from the City of Tempe. The city uses free chlorine residual disinfectant. The city water enters the building at the point of entry and flows through a whole-building water softener system consisting of three ion exchange resin softener tanks to lower the water hardness. The water softener was designed for full building capacity, however full capacity has not been achieved to date. The water softener consisted of 3 tanks used for regeneration, standby, and softening. Softened water from the softener is then split for domestic usage and for industrial use (water used in research labs and for building equipment). The softener pumps water to a ~60 gallon (225 L) storage tank, also referred to by facilities as a pressure/expansion tank (referred to as “expansion tank” hereafter). The expansion tank provides water to higher floors according to the water demand. If the pumps do not turn on due to low water demand, the unused water remains stored in the expansion tank. This is not a component of the softener but rather a component of the water system designed to reduce a water hammer effect due to fluctuations in water demand; nevertheless it is fed by softened water. This tank does not drain out completely as it provides a cushion that evens out the pressure swings in the booster pump operation. Thus, the tank always holds water even when it is not in use. The domestic water lines in the building are copper piping.
This building is also equipped with a smart system consisting of several sensors at various sampling locations for continuous, real-time water monitoring. Ultrasonic flowmeters are installed in the building's mechanical room that record the DCW flow every 15 min. Thus, this building chosen was a unique sampling location as it was a data-rich building outfitted with several online sensors that monitored pH, free chlorine, temperature, conductivity, and some disinfection by-products. Free chlorine is an important parameter as it is the amount of chlorine available for sanitizing contaminants. Sensor data are described in the Supplementary material 1 but as the focus of this work was on the hot water, sensor data were used for comparison purposes only. Previous studies have monitored the water quality in this building when it was newly constructed and examined the water quality variation between the city water collected from the service line and water collected within the multi-story building. A detailed description of this institutional building can be found elsewhere (Richard et al., 2020, 2021).
Building occupancy
Approximate building occupancy was assessed using the number of hourly WIFI logins per floor and was taken as a proxy for water usage. Although the direct count of occupants in the building is difficult to determine, each connection of an individual's electronic device (e.g., cell phone or laptop) to the WIFI in the building counts as one WIFI login, giving a surrogate for occupancy trends. Building occupancy is important as it is a surrogate used for understanding the water demand, occupant activity related to water use, and water quality parameters that vary significantly with changes in occupancy patterns. Arizona State University (ASU) Information Technology (ASUIT) provided the counts, by floor, of how many times the WIFI access points were connected to a wireless device such as phones, tablets, or personal computers. The ASU Facilities Development and Management provided water usage data for the LEED building of interest in this study (Richard et al., 2020).
Initial biweekly water quality sample collection
Sampling was conducted twice per week for 6 weeks on Mondays and Wednesdays starting at 6 a.m. Arizona time from the hot water side of faucet taps with handles opened to maximum, automatic faucets receiving mixed hot and cold water, and hot water from a basement shower with the setting set to maximum hot water. The early morning timeframe was chosen in order to maximize the likelihood of sampling before building occupancy and/or demand increased. The sampling duration lasted from August 17th to September 23rd, 2020, which consisted of one pilot and 10 sampling events. Sampling locations, type of fixtures in the sampled areas, and timing can be found in Table 1 and Supplementary Table 1. First draw single water samples of ~2 L were collected in sterile 2 L Nalgene polypropylene (PP) bottles. 1.1 L was separated for microbial analysis in PP bottles, pre-dosed with 1 mL of 2.4% of sodium thiosulfate. The remaining sample was tested for physical-chemical water quality parameters and metals. Controls were used for each sampling event including a field blank and trip blank. The blank samples were 1.1 L of autoclaved deionized (DI) water in sterile sampling bottles. The trip blank was kept on the sampling cart during sampling trips. The field blank was brought to the sampling site and opened to expose it to the site environment.
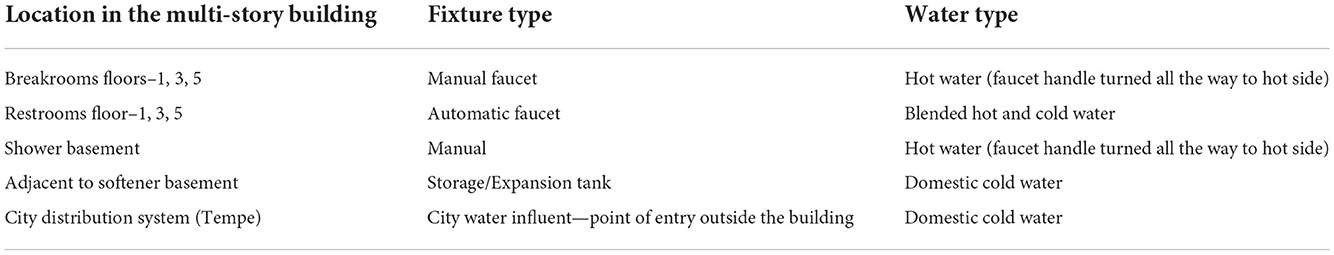
Table 1. Initial biweekly water sampling locations, fixture types, and water type (hot or cold domestic water).
Physical-Chemical water quality parameters
pH, temperature, free and total chlorine for the water samples were tested onsite after each sample was collected. The pH was measured using the Oakton pH30 pH tester probe. The temperature of the water samples was measured using a Ryobi IR002 Infrared Thermometer. A Hach DR 900 colorimeter was used for total and free chlorine concentration (method DPD 8167 and DPD 8021, respectively, range 0.02–2 Cl2). The samples were transported to the lab for testing other water quality parameters such as conductivity, UV 254, organic carbon, etc within ~2 h of collection. Conductivity (μS/cm) was measured using an Orion Versa Star Pro pH/ISE/Conductivity/Dissolved Oxygen Multiparameter Benchtop Meter (Thermo Fisher Scientific). UV 254 was measured using an Agilent Cary 60 UV-Vis spectrophotometer (range 119–1,100 nm). Autoclaved DI water was used for blanking the UV instrument. A Hach DR 3900 spectrophotometer was used to measure the alkalinity of the water samples using the TNT 870 total alkalinity kit (range 25–400 mg/L CaCO3). Water samples were filtered using a 0.45 μm filter (25 mm, MDI syringe filter) for dissolved organic carbon (DOC) analysis. DOC was measured using the Shimadzu total organic carbon analyzer TOC-L (range 4 μg/L−30,000 mg/L). For metals analysis, water samples were acidified with 2% by volume HNO3 (Nitric acid 67–70%, ARISTAR® ULTRA, ultrapure for trace metal analysis, VWR Chemicals BDH®). Metal concentrations in the drinking water samples were analyzed for Titanium, Vanadium, Chromium, Manganese, Iron, Nickel, Copper, Zinc, Arsenic, Palladium, Silver, Cerium, Tungsten, and Lead using inductively coupled plasma mass spectrometry (ICP-MS, Thermo X Series II). The detection limit for the ICP-MS is 1 ppb for all metals except for copper (5 ppb).
Municipal water quality data
Grab sampling water quality parameters from the LEED building values were also compared with the City of Tempe Water treatment plant daily analysis report for August and September 2020. The Johnny G. Martinez and South Tempe Water Treatment Plants (JGM and STWTP) reported daily monitoring values for turbidity, pH, total hardness as CaCO3 along with calcium and magnesium hardness, chloride, total alkalinity, temperature, and total organic carbon (TOC) concentrations in its daily chemical report (City of Tempe, 2020a,b).
Culture of Legionella bacteria using IDEXX Legiolert method
One hundred mL of water sample was used for L. pneumophila testing and the remainder was filtered for further analysis with quantitative polymerase chain reaction (qPCR). The Legiolert™ kit (IDEXX Laboratories, Westbrook, Maine, USA) was performed according to the manufacturer's instructions for potable water. Legiolert (IDEXX Laboratories, Inc.) is a liquid culture assay, enzyme-substrate reaction-based method (LeChevallier, 2019). Quantification of viable L. pneumophila is based on the most probable number (MPN) technique (range 1–2,272.6 MPN/100 mL). This culture method is specific for L. pneumophila detection. The water hardness of the samples was determined using Aquadur hardness test strips (Macherey–Nagel, Germany). Depending on the water hardness range, a volume of either 0.33 mL (for low hardness water) or 1 mL (for high hardness water) of hardness supplement was added to the 100 ml of the water sample. A Legiolert blister pack of powdered reagents/nutrients was added to the sample and shaken until completely dissolved. The sample solution was poured into a Quanti-tray Legiolert tray (96 wells−6 big wells and 90 small wells) that was immediately sealed using the Quanti-TrayTM Sealer PLUS using a Quanti-Tray/Legiolert rubber insert. These plates were incubated, paper side down (wells face upward) at 39 ± 0.5°C in an incubator in a humid environment to reduce evaporation/to limit moisture loss. The incubation period was 7 days, after which the plates were read. The number of positive wells (corresponding to wells that are turbid and/or with brown color) was counted and the most probable number was determined using the IDEXX MPN generator 1.4.4. Quality assurance and quality control (QA-QC) were performed by culturing positive and negative control recommended by IDEXX (L. pneumophila serogroup 1 and Enterococcus faecalis, respectively). The lower and upper limit of detection for the IDEXX Legiolert was <1 and >2,272.6 MPN/100 mL, respectively (Monteiro et al., 2021). Serotyping was performed using a latex agglutination kit according to the manufacturer's instructions (Supplementary material 2). The 1 L water sample remaining after processing grab samples for IDEXX was filtered using an Isopore 47 mm diameter 0.2 μm pore polycarbonate membrane filter (EDM Millipore, GTTP04700) and vacuum pump filtration apparatus. The filters were placed aseptically in 2 mL tubes and stored at −80°C prior to further processing. A filtration control (sterile water) was included.
Sampling of building-scale water softeners
A previous study found that the water softener system for the sampled building was likely to contribute to the removal of the disinfectant residual and was chosen as a starting point for investigating issues contributing to L. pneumophila occurrence (Richard et al., 2020, 2021). The softener tank bulk liquid, as well as the softener resin, were investigated as contributing factors.
The building had a series of three ion exchange resin water softener tanks (Culligan Water Softener) in the basement where all the city water would pass through to mitigate the calcification of equipment. Most commercial water softeners operate in an alternating mode with one tank being online and other being offline depending on the water demand. For preliminary testing to investigate if the water softeners were a potential source and reservoir for Legionella growth, on January 23rd, 2021, the first and second draw water samples from the expansion tank adjacent to the softening tanks were collected. Legiolert culture-based testing was performed on these expansion tank water samples. On the same day, water samples were collected from the 1st-floor manual hot water faucet in the breakroom and automatic faucet in the restrooms.
The building facilities planned to replace the existing softener. On Feb 2nd, 2021, tank-3 was completely drained in the morning and was offline. The other two tanks were online and carried out the softening operation. Six resin samples from the drained softener tank which was no longer operational (tank-3) were collected to test for Legionella colonization in the water softening system. The resins were stored at 4°C before ultrasonication. Two resin samples (10 g) were sonicated with 100 mL of autoclaved DI water using a sonication bath for 15–20 min cycle time (M3800 Branson, Ultrasonics Corporation, Danbury, CT) to detach biomass from the resin at an ultrasound frequency setting of 40 kHz. After the resin was settled, the 100 ml supernatant was carefully separated and the IDEXX Legiolert protocol was followed.
Water samples were collected the following day (February 3rd, 2021) from softener tank-1 and 2 along with the expansion tank for three sampling events at 9 a.m., 3 p.m., and 5 p.m. A similar sampling event with five-time points at 6 a.m., 8 a.m., 12 p.m., 2 p.m., and 5 p.m. were performed on February 4th, 2021 to get a day-long profile of water quality. All samples were tested for L. pnuemophila using the IDEXX Legiolert protocol. One liter of all the water samples from these two sampling days were filtered and DNA was extracted for further microbial analysis using molecular methods.
Targeted water sampling after changing water softeners
In late January 2021, the building facilities replaced the Culligan water softening system with a new series of water softening equipment (Kinetico PRO-Total Water Care). These were commercial scale, demand-operated, resin-based twin tank softeners used for moderate to high volumes of water. Water samples were collected on April 22nd, 2021, from 6:50 to 9:30 a.m. The water samples were immediately transported to the laboratory for further microbial processing (liquid culture based IDEXX Legiolert method and qPCR).
On May 5th, 2021, as a follow-up monitoring, water samples were collected from the shower located in the basement, softener expansion tank, and the city drinking water point of entry. Physical-chemical water quality parameters were recorded on-site, and water samples were immediately transported to the laboratory for further microbial processing (liquid culture-based IDEXX Legiolert method and 1 L water filtration for further qPCR processing).
Water sampling after changing showerheads and expansion tank
Facilities were notified about the building water quality and subsequently, showerheads were replaced. On 16th July 2021, water samples were taken from men's and women's restrooms after new showerheads were installed in the basement. Samples were collected from the 1st-floor manual hot water faucet in the breakroom and automatic faucet in the restrooms, water fountains, softener expansion tank, and the city drinking water point of entry between 7:15 and 9:00 a.m. Physical-chemical water quality parameters were recorded on-site and water samples were immediately transported to the laboratory for further microbial processing (liquid culture-based IDEXX Legiolert method and 1 L water filtration for further qPCR processing).
During September 2021, the expansion tank adjacent to the water softening system was replaced for the building water system. Follow-up sampling was conducted after the new expansion tank was installed. All original sampling locations in the building were sampled on September 17th, 2021, in the early morning. All three water softening tanks (tanks A, B, and C) were also sampled during this event. A timeline of the study with respect to management interventions is shown in Figure 1 and Supplementary Table 1.
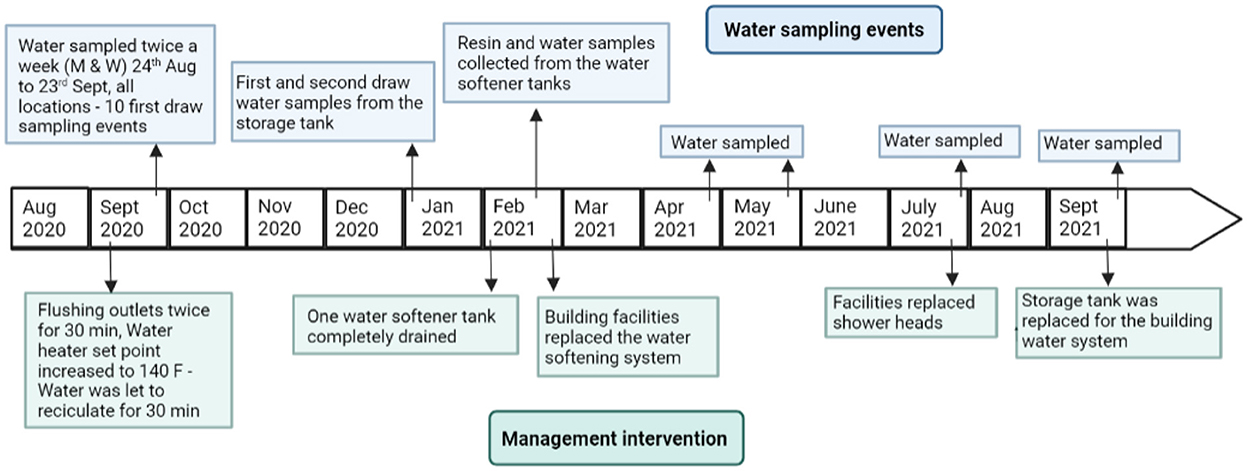
Figure 1. Timeline of water sampling events and building management interventions throughout the study period August 2020–September 2021.
DNA extraction
Filters were aseptically transferred to 2 mL Qiagen power bead tubes with 1.4 mm ceramic beads (Qiagen, Hilden, Germany). A Precellys Evolution bead beating homogenizer (Bertin Technologies) was used to grind the filters and lyse the biomass. To enhance the extraction yield, the Precellys was set to 10,000 rpm, 3 cycles for 15 s with 10 s pause program. DNA was extracted from the filters using a Qiagen Dneasy PowerSoil kit (with inhibition removal technology) for all water samples and blanks. DNA concentrations were measured with a spectrophotometer (Thermo Scientific NanoDrop 2000). The elution buffer used for eluting the DNA in the last of Power soil DNA extraction protocol was used for blanking the Nanodrop. All extracted DNA samples were stored at −80°C until further molecular analysis.
qPCR assays
Primers and probe sequences specific to the single-copy macrophage infectivity potentiator mip gene target from L. pneumophila species were used for gc/μL quantification (Nazarian et al., 2008). The mip gene is a single copy gene so it can be assumed that one gene copy (gc) was equivalent to one microorganism (acknowledging that the presence of gene copies does not denote viability). Quantitative real-time PCR was performed on a Biorad CFX 96 (Hercules, CA) thermocycler. Samples were tested in triplicates. The optimized assay details and cycling conditions are shown in Supplementary Tables 2, 3. A 25 μL PCR reaction was used with 12.5 μL universal probe super mix (Biorad), 1.25 μL of 10 μM forward and reverse primer stocks, 0.625 μL of 10 μM probe, 6.375 μL PCR grade nuclease-free water, and 3 μL DNA template. All PCR reagents (nucleotides) were synthesized by IDT (Coralville, IA).
For the preparation of the qPCR standard curve, gBlocks (amplicon synthesized by IDT) for the mip target specific to L. pnuemophila was serially diluted 10-fold using nuclease free water. The amplicon contained a defined high number of gene copies (1010 gc/μL). The standard curve ranged from 106 to 100 gc/μL. All standards were run in triplicates and a full standard curve was run with each 96 well plate for quantifying gene copies in water samples.
PCR inhibition
All samples were tested for the 16s rRNA target to confirm the extraction process was successful. Both undiluted and 1:10 dilutions were tested and the difference in their Cq (quantification cycles) was calculated. If the Cq difference did not fall in the range of 2–4 Cq, the samples were considered to have PCR inhibition. Samples with PCR inhibitors were subjected to a 10-fold dilution while testing for the L. pneumophila mip gene target. All other samples were tested without any dilution with a full standard curve for each plate.
qPCR quality control
The qPCR assay's lower limit of detection (LOD) and quantification (LOQ) values were determined from Cq values of the standards. A total of 21 replicates per concentration across three plates (seven replicates per concentration per plate) were run. Three independent standard dilutions were performed for each plate to account for plate-to-plate variation. The concentrations diluted for the LOD and LOQ determination were 103, 102, 50, 10, 5, 2, 1, and 0.5 gc/ μL. The LOD is defined as the lowest concentration where at least 95% of the wells amplify. The LOQ is defined as the lowest concentration standard where the coefficient of variation (CV) is ≤ 25% (0.25). CV is calculated using a standard deviation of calculated log gc/reaction/mean of calculated log gc/reaction. LOD and LOQ per μL DNA template were converted to per 100 mL water limits using (LOD or LOQ/μL qPCR reaction)*(qPCR reaction/3 μL DNA template)*(50 μL DNA eluate/1,000 mL water extracted).
Standard curve amplification efficiencies (E) were considered acceptable between 85 and 110%, slope ~ −3.3, with coefficient of determination/linearity (R2) values for standard curve linear regression of at least 0.98 for each plate. To minimize qPCR contamination, DNA extraction and qPCR setup were performed in separate laboratory spaces. The Minimum Information for Publication of Quantitative Real-Time PCR Experiments (MIQE) were followed while performing the quantification (Bustin et al., 2009; Borchardt et al., 2021).
Data analysis
For grab samples, the normality of the data was tested using the Shapiro-Wilk test. As data were not normally distributed, non-parametric Wilcoxon signed rank tests were performed to determine statistical differences among L. pneumophila concentrations and mip gene copy numbers with building floor, water sampling day (Monday vs. Wednesday), water type (domestic cold water, hot water, and blended water), fixture type, and before and after applying interventions. A Kendall's tau rank correlation test was computed on data gathered from initial biweekly samplings as the full suite of water quality parameters was collected for this period only. The tau-B correlation coefficient with adjustment for tied ranks was used to interpret the strength and direction of association/relationship between the water quality parameters. All statistical assessments were performed in R studio (R software version v.3.6.0). R code is provided in Supplementary material 3.
Results
Physical-Chemical water quality in biweekly samples
The sampling campaign proceeded in two phases: (1) an initial biweekly sampling campaign to determine L. pneumophila occurrence and relationship to other physical-chemical water quality parameters and heavy metals and (2) additional sampling events following various management interventions. Physical-chemical water quality parameter values and metals are summarized in Table 2 and a full compendium of monitoring data are available in Supplementary Table 4.
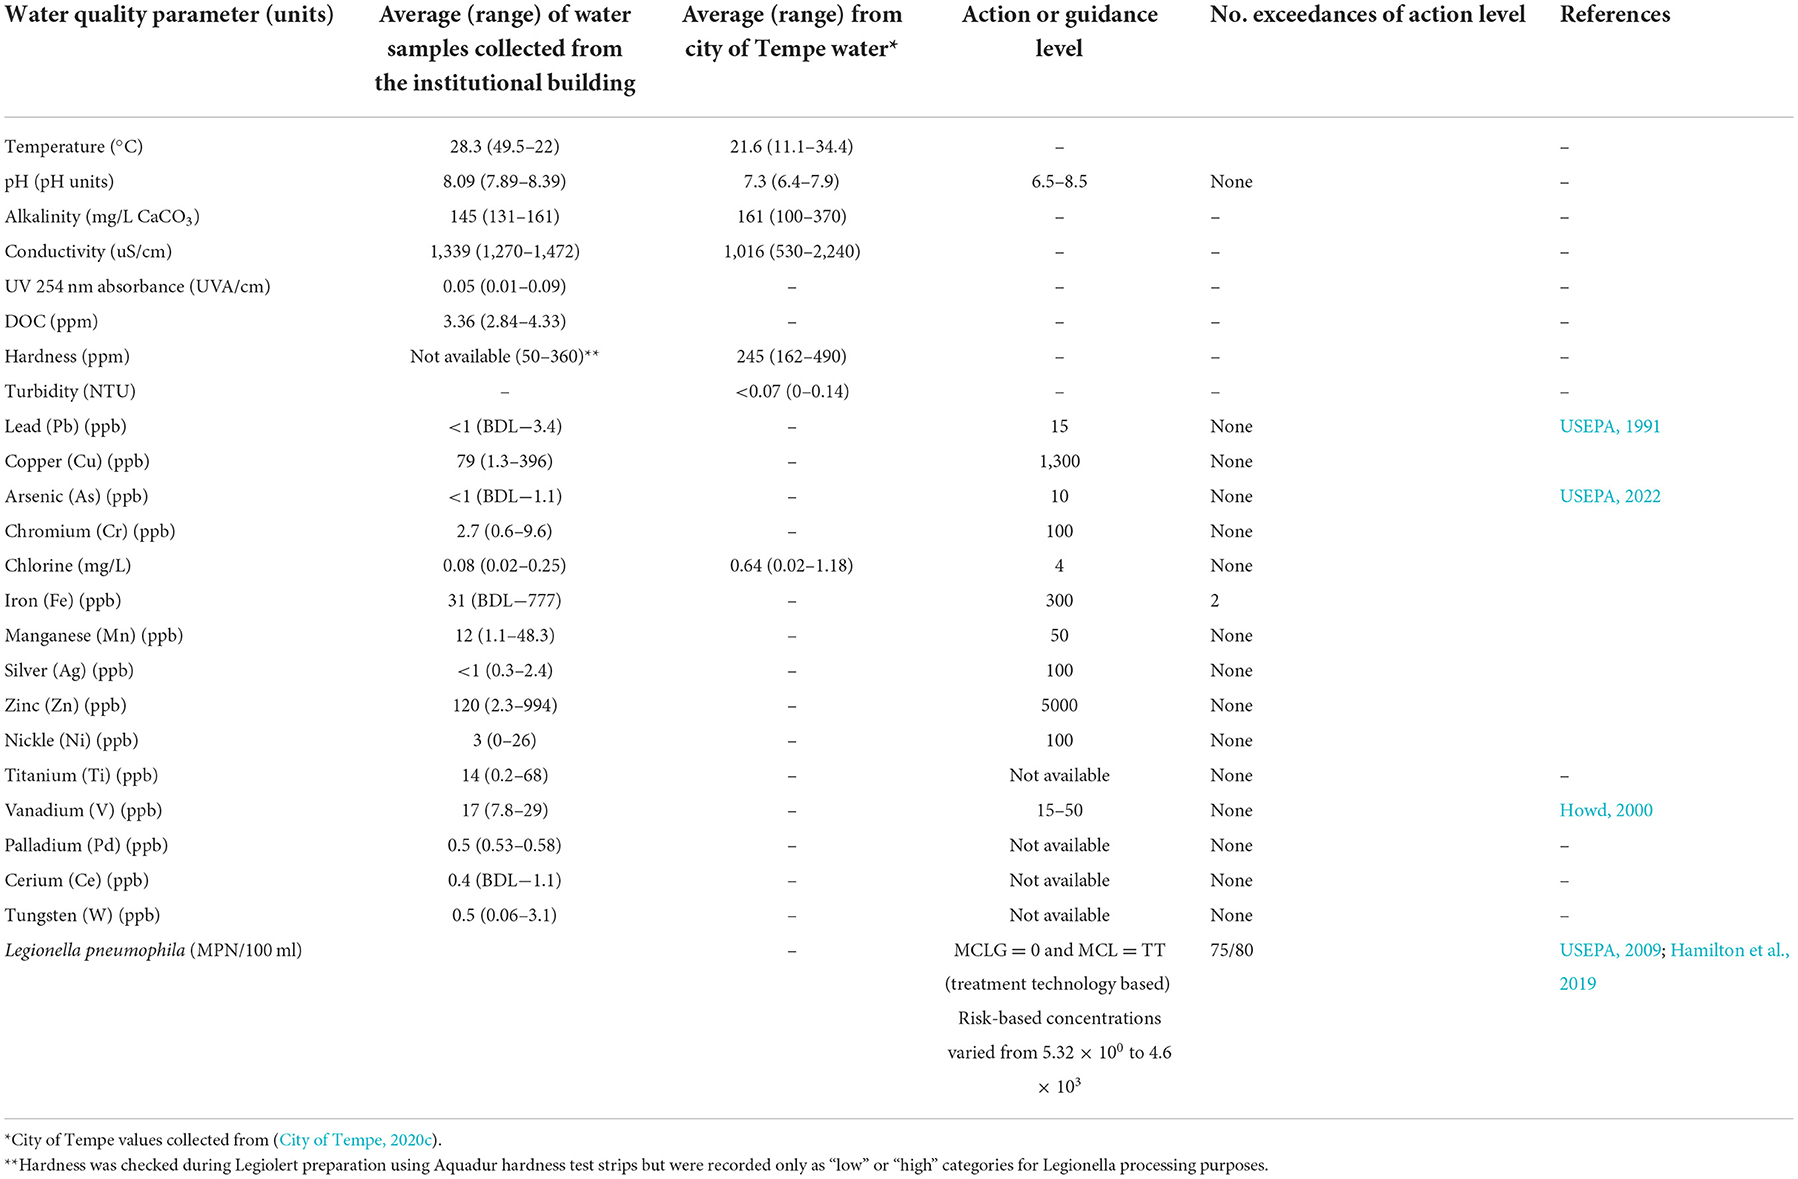
Table 2. Summary of physical-chemical water quality parameters for all locations during the biweekly initial water sampling events.
The average water temperature was 28.3°C with a maximum of 49.5°C for the hot water samples (range 26.2–49.5°C) and a minimum of 22°C for the domestic cold-water samples (range 22–32.1°C) during the August to September 2020 biweekly sampling. The hot water faucet on the 5th floor and the shower first draw samples had the highest average temperatures of 33.2 and 32.7°C, respectively. The average water pH was 8.09 with a range of 7.89–8.39. The water pH from locations inside the building was observed to be slightly higher than the city drinking water pH.
The total chlorine concentrations for the water samples collected within the building had a low average value of 0.06 mg/L with a range of <0.02–0.32 mg/L. The city water sample collected from the drinking water point of entry to the building had an average total chlorine concentration of 0.64 mg/L with a range of 0.49–0.81 mg/L. The free chlorine concentrations for the water samples collected within the building had a low average disinfectant residual of 0.03 mg/L with a range of 0.02–0.25 mg/L. The city water sample collected from the city water point of entry to the building had an appropriate average free chlorine concentration of 0.49 mg/L with a range of 0.24–0.68 mg/L and falls above the recommended 0.2 mg/L minimum disinfectant residual concentration for incoming water (Figure 2). Ninety-eight percentage of samples were below the recommended 0.2 mg/L free chlorine concentration (USEPA, 2005; CDC, 2022). According to the City of Tempe data, water leaving the drinking water treatment plants contains ~1 mg/L of free residual chlorine as Tempe adds 0.8–1.2 mg/L of chlorine to treated effluent (City of Tempe, 2020c). Chlorine concentrations were slightly higher on Wednesdays compared to Mondays. Previous studies indicated generally low chlorine the building regardless of season, with declining chlorine during the summer months (Richard et al., 2021).
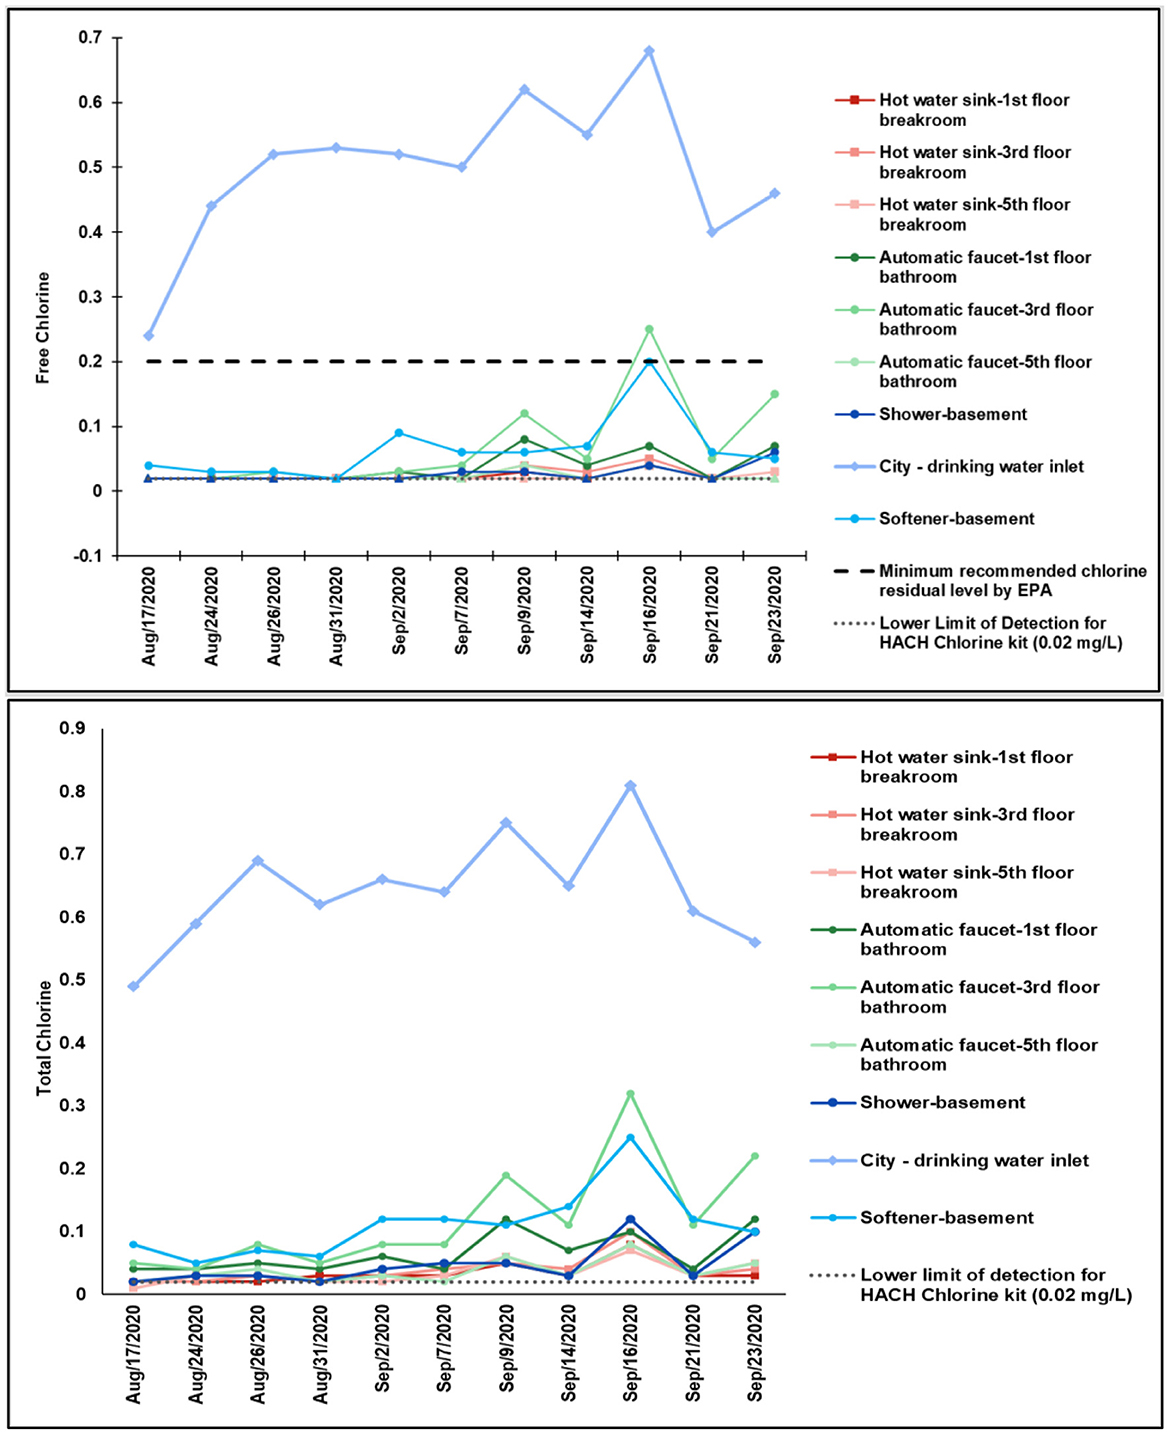
Figure 2. Free and total chlorine concentrations (mg/L) in the biweekly collected bulk water samples during August–September 2020.
Metals in biweekly samples
The metal concentrations for all the tested metals were below the action levels except for iron concentrations in a few water samples from the shower and expansion tank adjacent to the softener (Table 2) which were above the 300 ppb USEPA secondary MCL (USEPA, 2022). Concentrations as high as 777 ppb were detected in the shower water samples. Several water samples collected from the expansion tank were rusty orange in color consistent with the dissolved iron. Copper concentrations were consistently below the USEPA action level of 1,300 ppb, unlike higher levels which have previously been reported in similar buildings during higher occupancy periods when chlorine levels varied significantly over time (Richard et al., 2020, 2021). Generally, hardness was removed by the building water softener (Table 2), indicating that the softening system was operating as intended. However, performance was variable across the duration of the study. This could have potentially been due to varying hardness in the incoming water supply (Table 2), ion exchange resin performance, softening capacity, and changing regeneration schedules for ion exchange.
Prevalence and concentration of culturable L. pneumophila in biweekly samples
There was widespread colonization of L. pneumophila in the building plumbing system screened during the summer of 2020. Ninety-four percentage of the biweekly collected samples tested were positive for viable L. pneumophila using the IDEXX Legiolert method. Quantification data for culturable L. pneumophila is shown in Figure 3. The city drinking water test at the point of entry to the building always had L. pneumophila <1 MPN/100 mL whereas the water samples collected within the building were initially always positive for culturable L. pneumophila. A wide range from <1 to >2,272.6 MPN/100 mL was observed at all the fixtures. During initial sampling events in August, as the water samples were not diluted before L. pneumophila enumeration, and concentrations were above the upper limit of quantification (>2,272.6 MPN/100 mL). Samples after the initial dates were diluted 1:10. Positive and negative controls were confirmed, and no contamination or off-target amplification was detected. The two locations in the building that were observed to have the highest L. pneumophila concentrations in the collected samples were the hot water faucet on the 5th floor (average concentration in the positive samples was 3,175 MPN/100 mL) and the shower in the building basement (average concentration 4,916 MPN/100 mL). Water samples were positive for both groups of serotypes which the kit covers, Legionella serogroups 1 and 2 through 14.
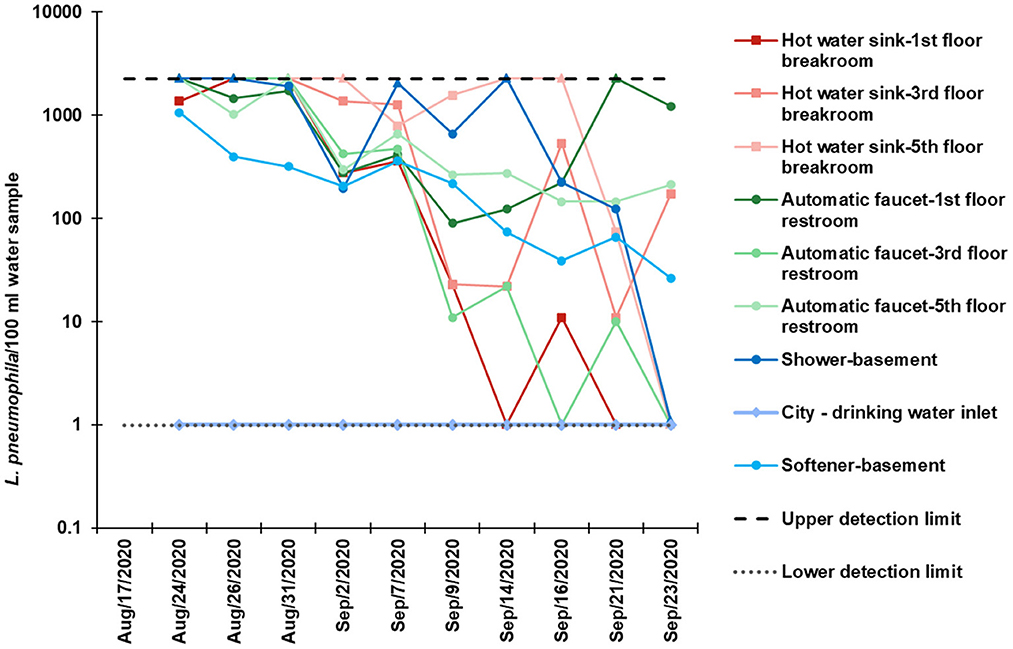
Figure 3. Culturable L. pneumophila concentrations per 100 mL water using the IDEXX method, in biweekly collected bulk water samples during August–September 2020.
L. pneumophila mip gene concentrations in biweekly samples
The standard curves had a linear range of quantification from 3 × 101 to 3 × 10⁶ to gc/reaction. The limit of detection (LOD) and limit of quantification (LOQ) for the L. pneumophila mip gene assay was determined to be 10 and 50 gc/μL DNA template, respectively. This equated to an LOD of 16.7 gc/100 mL water and a LOQ of 83.3 gc/ 100 mL water. Values below the LOD were reported as “below the detection limit,” between LOD and LOQ as “positive but not quantifiable” and values above LOQ were quantifiable and reported as numerical values. The slope of the standards ranged from −3.494 to −3.133. The amplification efficiencies E ranged from 93.3 to 108.5%, the correlation coefficient (R2) ranged from 0.981 to 0.990, and Y-intercept ranged from 39.21 to 42.06 (Supplementary Table 5). No template controls (NTC) did not show any amplification throughout the study.
The point of entry city drinking water had low mip gc values or were below the quantifiable limit while high mip gc values were observed in positive shower water samples (Figure 4). This trend aligned with the culture-based IDEXX Legiolert trend. The highest culturable concentration was 1.92 × 10⁴ MPN/L in the shower water, while the highest concentration with qPCR was 3.47 × 10⁵ mip gc/L in the 3rd floor hot water sample from the manual faucet in the breakroom during the biweekly monitoring.
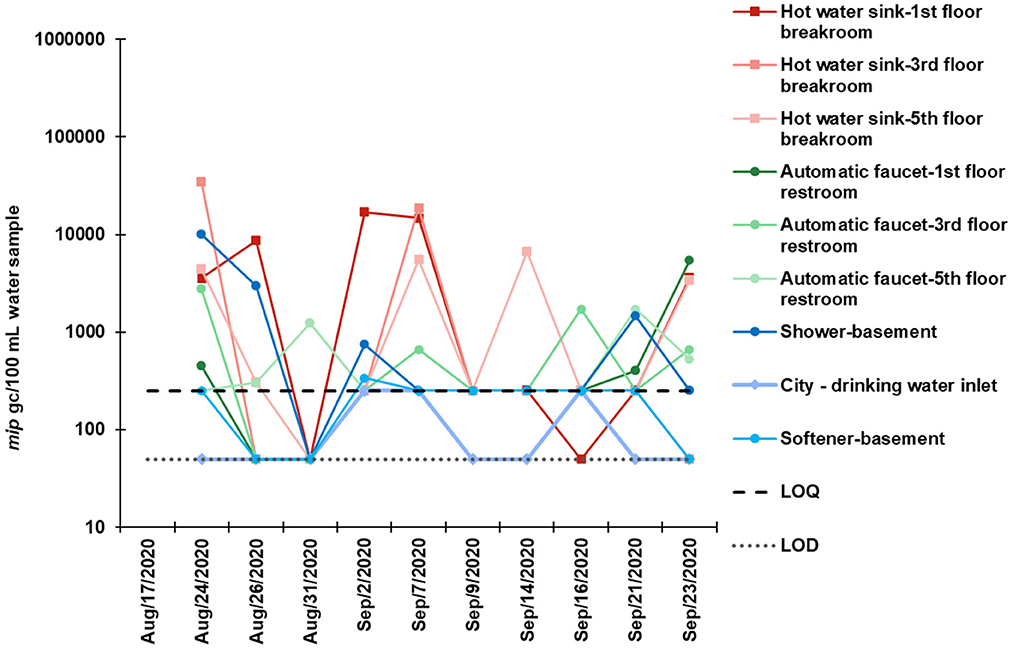
Figure 4. L. pneumophila mip gene concentrations per 100 mL water using qPCR in biweekly collected bulk water samples during August–September 2020.
Culturable L. pneumophila in water softeners resin and stored water
L. pneumophila concentrations started to gradually decrease toward the end of the sampling effort as flushing strategies were implemented by the facilities maintenance personnel. At the beginning of September 2020, the building facilities flushed breakroom sinks, all the lab sinks, the janitor's closet, and both the men's and women's showers. The hot water temperature set point on the water heating system (heat exchanger) was turned up to 60°C, as the actual building requirement for routine operation hot water setpoint was 46°C due to a concern for sustainability. Hot water was recirculated for 30 min on all the floors as a part of the thermal disinfection process. Hot water recirculation was performed as a one-time action after information was shared with facilities on bacterial presence. The standby mode softener tanks were regenerated, and the resin tanks were flushed by the janitors on a weekly basis.
In January 2021, to evaluate if the water softener was the hotspot for microbial water quality deterioration, preliminary testing was performed before the water softener tanks were replaced. Softener resins are known to leach dissolved carbon and provide an environment potentially conducive for Legionella spp. to grow (Ra et al., 2020). The water collected from the storage/expansion tank adjacent to the softeners was observed to be discolored; the first draw water sample had a brown-orange color followed by the second draw which had a lighter orange color.
The water from the expansion tank adjacent to the softener was always positive for viable L. pneumophila. Resin samples collected from the ion exchange softener tanks were positive for L. pneumophila indicating that the softener tanks potentially played a role in encouraging L. pneumophila colonization in the building plumbing. The water samples from the operational softener Tank-1 and Tank-2 water did not show any positive culturable concentrations.
After the softener was replaced, an additional sample was taken in April 2021. Along with water samples collected inside the building, the city water at the drinking water point of entry was also tested. Similar trends in the physical-chemical water quality parameters were observed after the softener replacement. The average water pH inside the building was 8.42 which was higher than the City of Tempe drinking water sample (8.12). The average total and free chlorine values were slightly higher than the initial biweekly water sampling events in August-September 2020. The average total chlorine for the water inside the building was 0.12 mg/ L and that for the city water at the building point of entry was 0.79 mg/ L. The average free chlorine for the water inside the building was 0.06 mg/ L and that for the city water at the building point of entry was 0.58 mg/ L. Average conductivity and alkalinity for all water samples were 1,393 μS/cm and 152 mg/L CaCO3, respectively. Lower L. pneumophila concentrations were observed after the water softener replacement and flushing events performed by facilities staff. Except for the shower in the basement (ranging from 6.08 × 10² MPN/100 mL to above the upper limit of detection), all other water samples were negative for culturable L. pneumophila. Table 3 provides details on the ion exchange resin water softener profiling and follow up monitoring of water quality parameters after softener replacement.
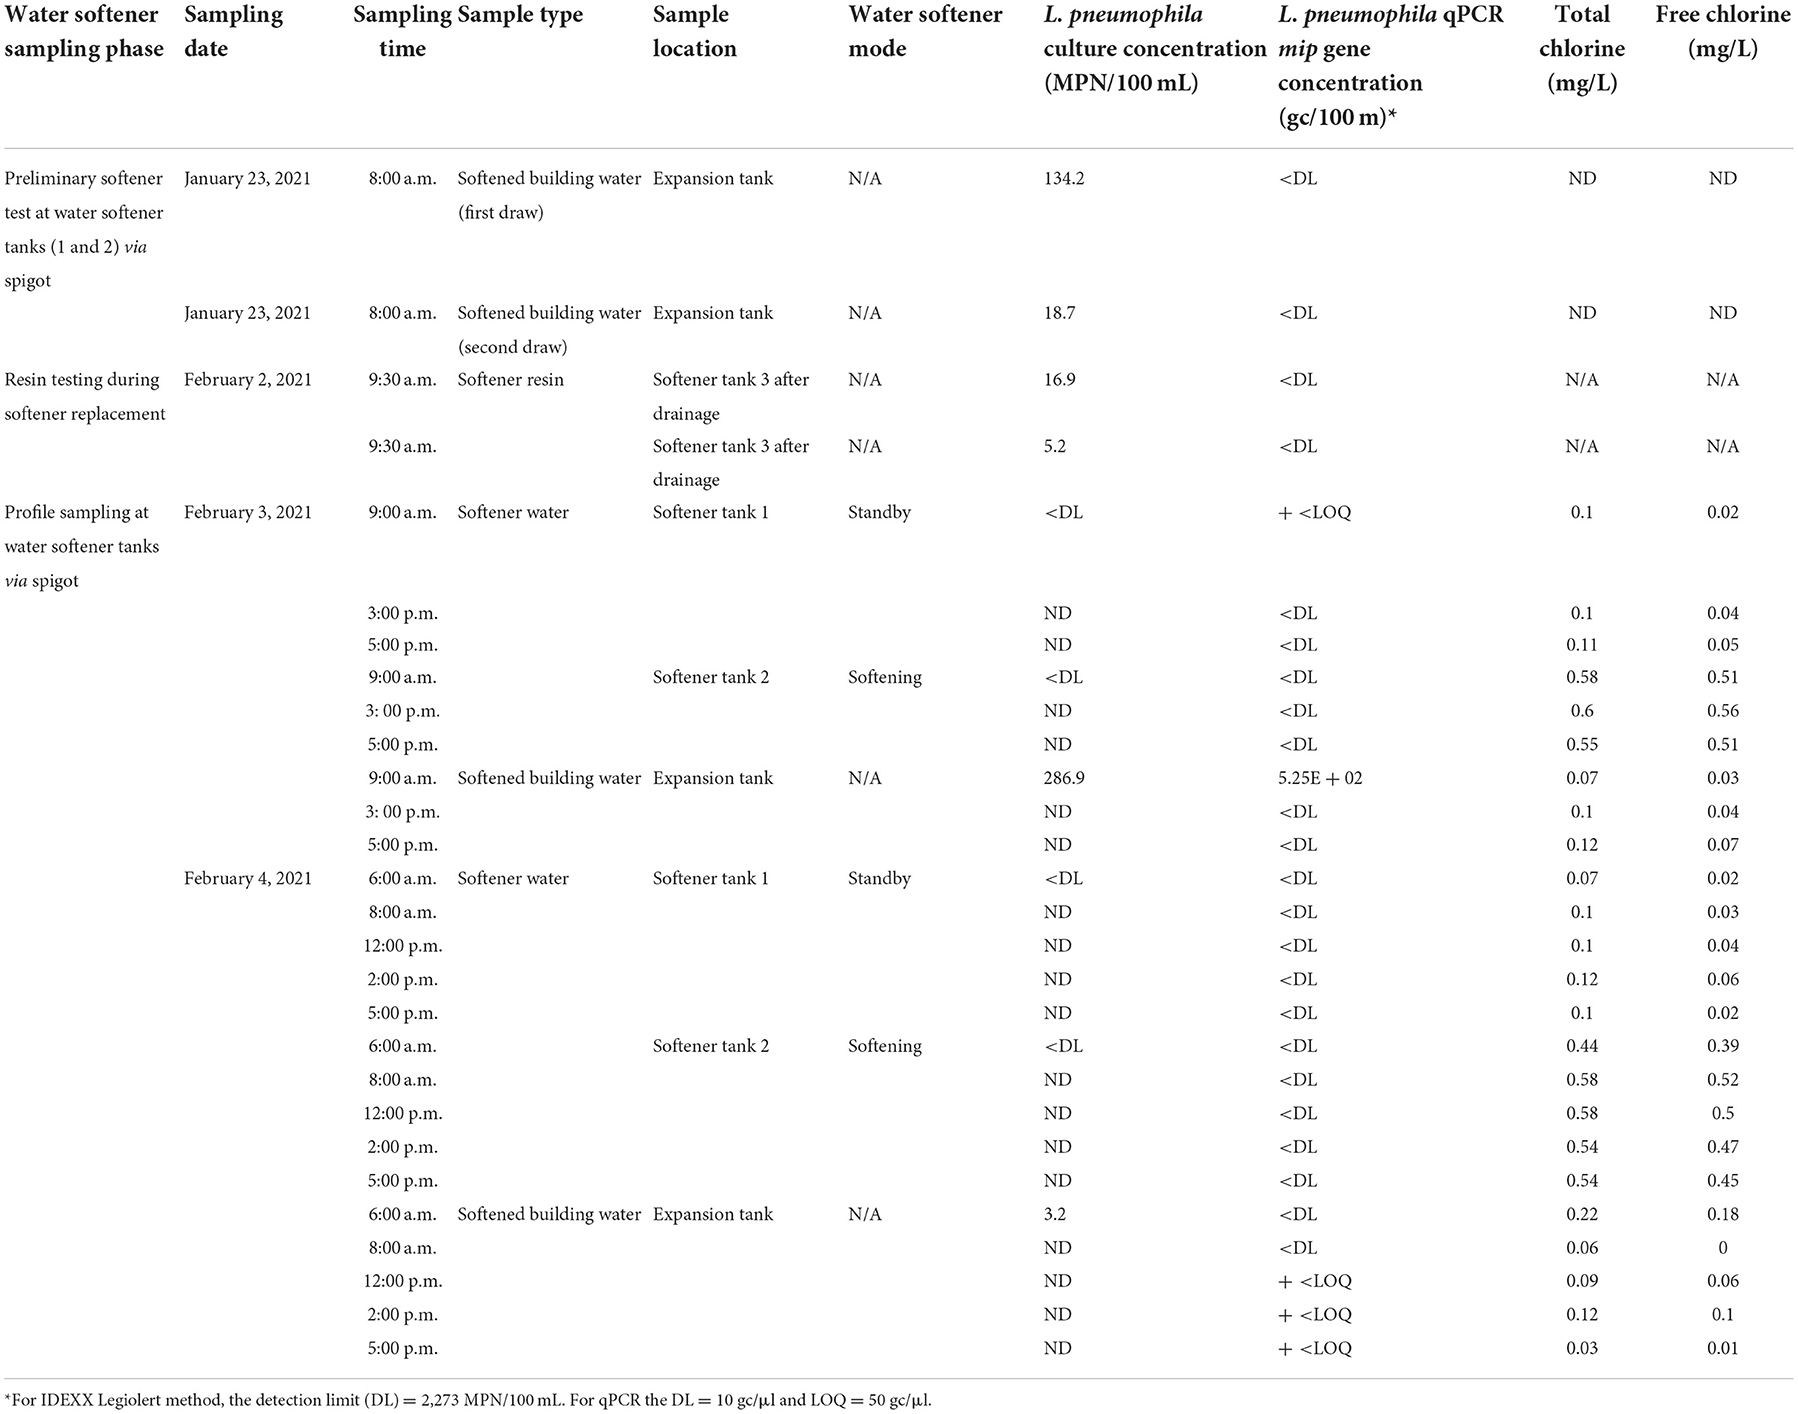
Table 3. Water quality results from sampling performed in initial water softener for preliminary testing and water softener profile sampling events (ND, not determined; N/A, not applicable).
Culturable L. pneumophila after showerhead and expansion tank replacement
In mid-July 2021, the building facilities installed new showerheads and flushed the water lines in the building's lower-level restrooms. Along with shower samples from both men's and women's restrooms, the expansion tank adjacent to the water softening system and city drinking water point of entry were tested. Chlorine residuals were still low and below 0.2 mg/L, unlike the incoming city water which had adequate chlorine concentrations. The chlorine residual (free chlorine concentration) in the expansion tank was 0.11 mg/ L being closest to the drinking water point of entry, all other locations had free chlorine concentrations below the detection limit. The average pH for water samples collected was 7.89, which was consistent with previous pH trends. L. pneumophila concentrations were lower than previous samples or below the detection limit for all the samples except for the expansion tank water sample which had >2,272 MPN/100 mL L. pneumophila. Softener ion exchange resins and water in standby mode expansion tanks were colonized with L. pneumophila. L. pneumophila was also present in the water sampled from the expansion tank adjacent to the softening system. These results led the facilities to replace the expansion tank. The water samples that were tested post storage/expansion tank replacement in September 2021 were all below detection (<1 MPN/100 mL sample) for L. pneumophila. The free chlorine concentrations continued to be lower than 0.2 mg/ L, and most were below the detection limit. The average pH for water samples collected during this sampling event was 8.30 (Table 4).
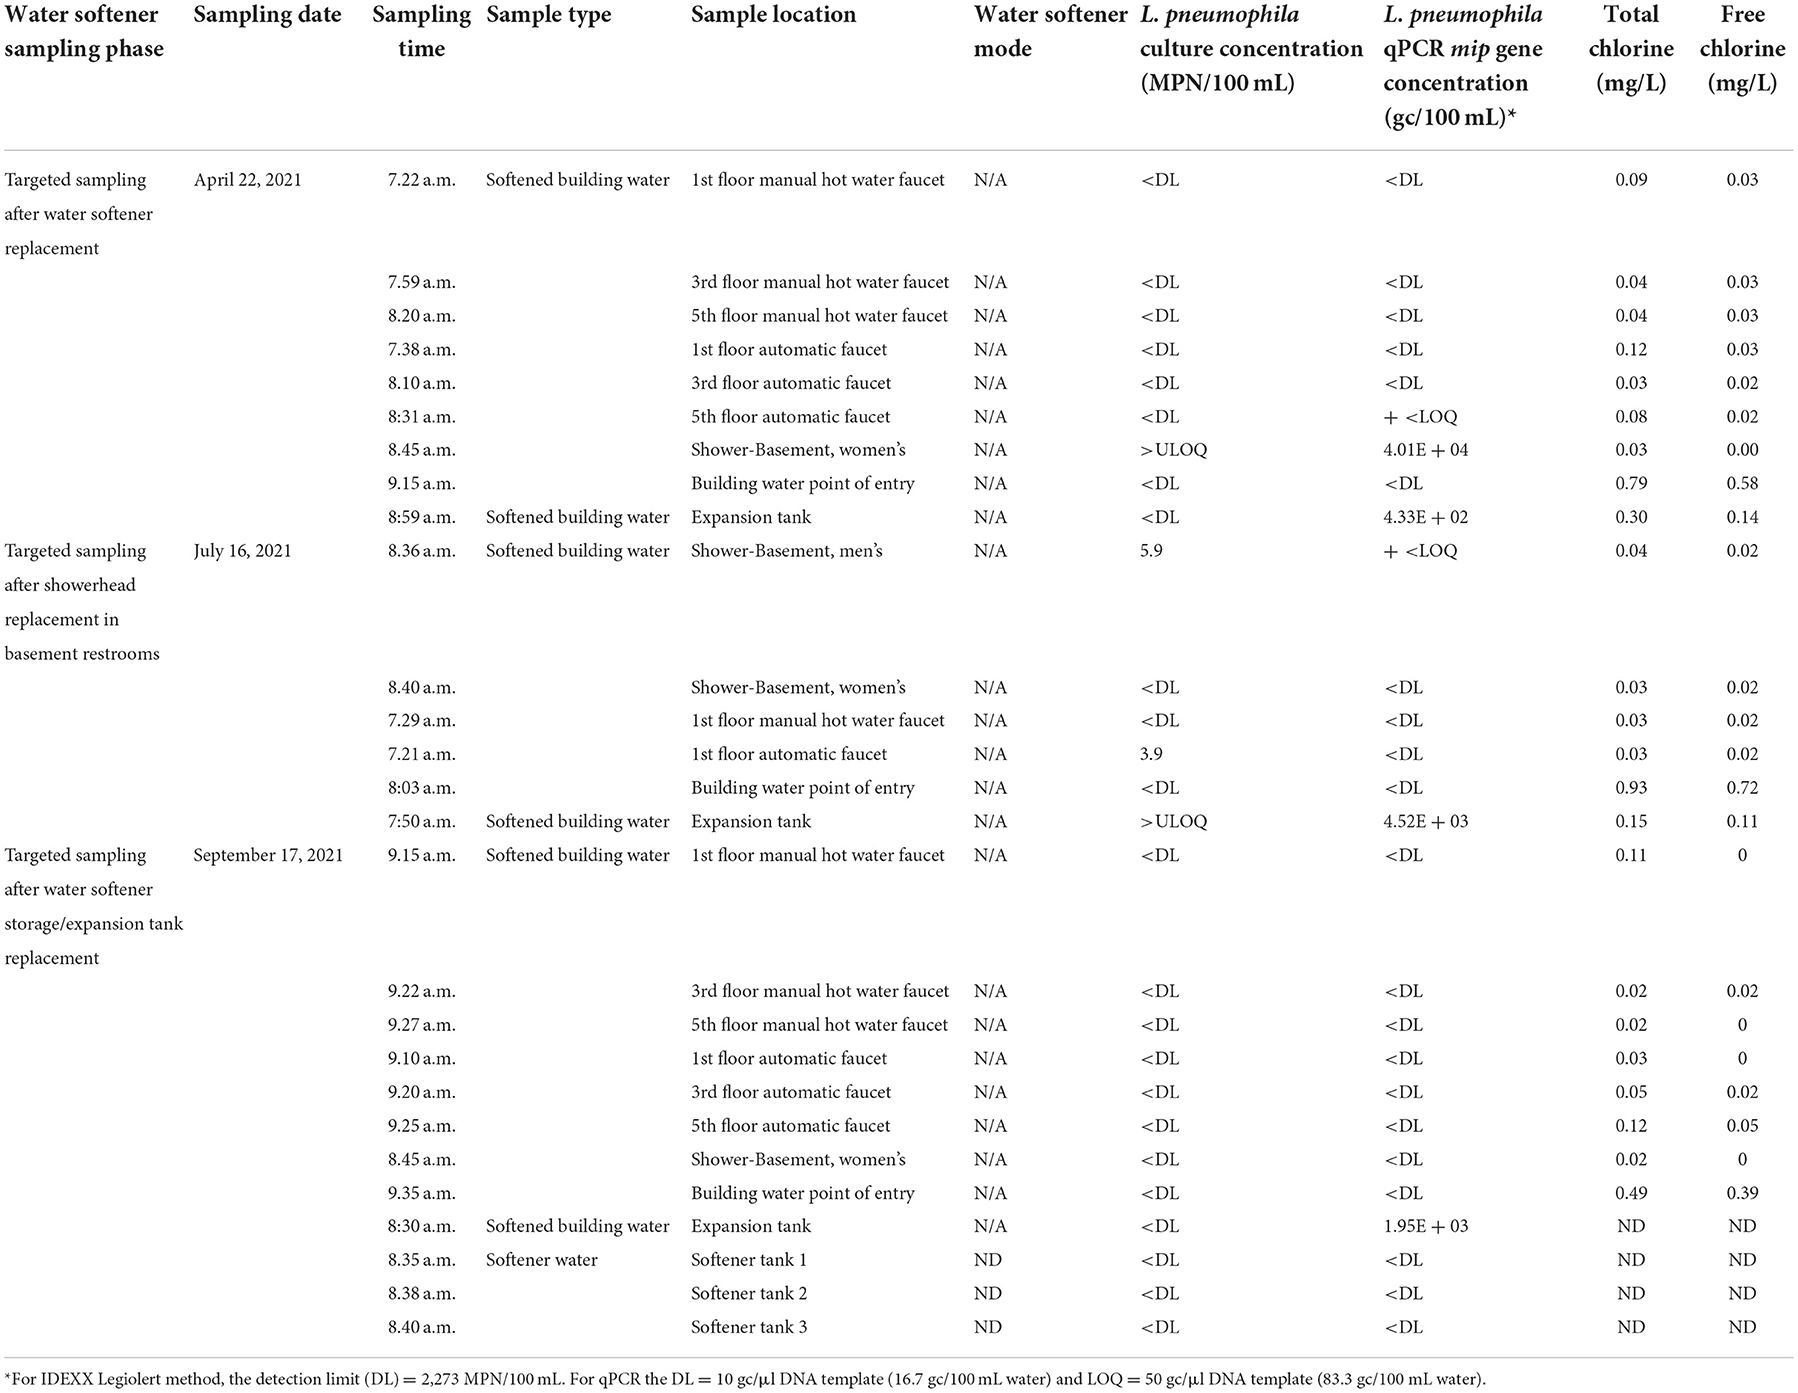
Table 4. Water quality results from sampling performed after water softening system replacement, showerhead replacement, and an expansion tank replacement (ND, not determined; N/A, not applicable).
Building occupancy during the study period
Due to the COVID-19 pandemic restrictions and stay at home orders, a sharp decrease in activity of this institutional building was observed (Figure 5). The occupancy was observed to be 17–32 % of the pre-COVID occupancy. The 1st floor had the highest number of WIFI logins compared to the 3rd and 5th floors. The occupancy increased gradually but did not reach close to the building occupancy before the pandemics during this study sampling duration.
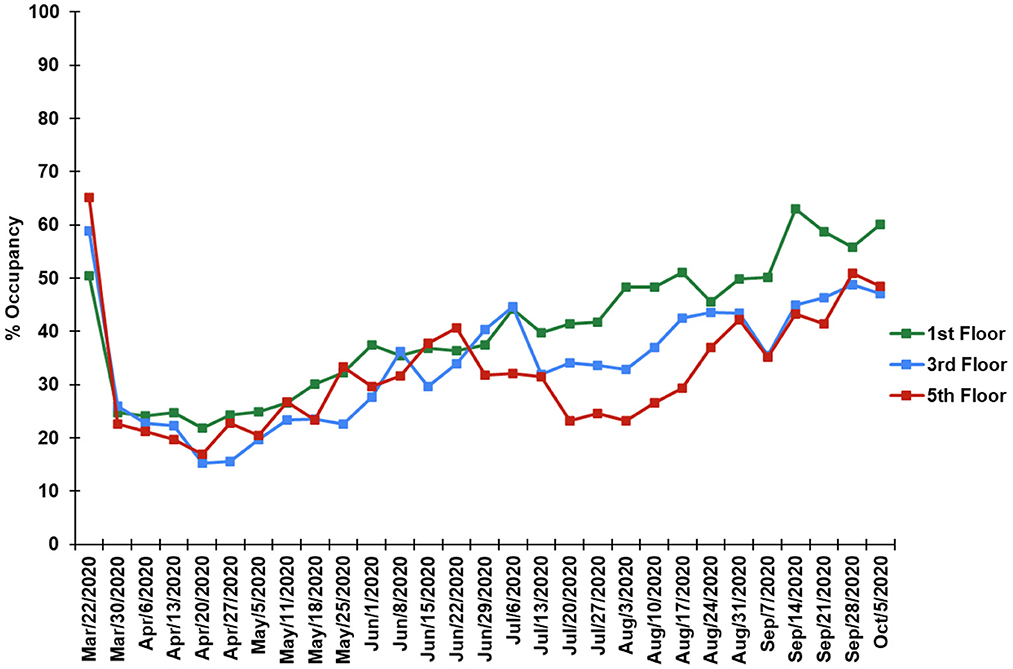
Figure 5. Occupancy trends during the study, reported as percent occupancy compared to pre-2020 building operations for floors 1,3, and 5, respectively.
Statistical analysis
Comparison of L. pneumophila and mip gene copy concentrations across sampling factors
A Wilcoxon signed ranked test for non-parametric data was performed to assess L. pneumophila concentration differences between sampling events performed on different sampling days, different floors, and different fixtures (Supplementary Table 6). Monday sampling events presumably occurred after a weekend stagnation event. Wednesday samples typically were associated with lower water stagnation and higher activity/occupancy values. The average culturable L. pneumophila concentration for Monday sampling events in the premise plumbing samples not including the building point of entry (which was always below detection) was 1,110 MPN/100 mL, which was significantly higher compared to Wednesday samples (670 MPN/100 mL, p < 0.001) for positive quantifiable samples, consistent with stagnation events associated with higher concentrations. No significant difference was observed when Monday qPCR L. pneumophila mip gene concentrations (gc/L) were compared to Wednesday samples.
There were significant differences between the L. pneumophila concentrations on different floors, correlating with increased distances from the building point of entry. The average L. pneumophila concentrations for the hot water manual faucets in the breakroom were 659, 1,022, and 1,607 MPN/100 mL for the 1st, 3rd, and 5th-floor positive samples, respectively. Significant differences were observed between 1st vs. 3rd floor measurements (p = 0.02 < 0.05) and 1st vs. 5th floor (p = 0.02). No significant difference was observed between 3rd and 5th floor concentrations (p = 0.15). Average L. pneumophila concentrations for the automatic faucets demonstrated an opposite trend with 1,008, 776, and 757 MPN/100 mL for the 1st, 3rd, and 5th-floor positive samples, respectively. No significant difference was observed between floors for automatic faucets (p > 0.05). There was no statistically significant difference observed while comparing concentrations measured at manual vs. automatic faucets. When mip gc/L values were compared for different floors and fixture types, no significant difference was observed.
Comparison of L. pneumophila concentrations before and after water management interventions
The building facilities management performed several corrective actions to lower L. pneumophila concentrations. In September 2020, there were two flushing events and the L. pneumophila concentrations were significantly lower (<~103 MPN/100 mL compared to >2,272.6 MPN/100 mL prior to the flushing) via a Wilcoxon signed-rank test when compared to August 2020 water samples from the building (p = 0.01). After the water softening system was changed in the building, samples from April 2021 were compared to the initial August 2020 water samples and were observed to be significantly lower (p = 0.03). Lastly, after changing the showerheads and replacing the expansion tank, a significant decrease was observed in September 2021 water samples compared to August 2020 water samples (p = 0.01). Beginning in April 2021, most samples were below detection, however 6 samples were ≥433 gc/100 mL and 5 samples were above 6 MPN/100 mL. The highest concentration detected in September 2021 was 1,950 MPN/100 mL in the expansion tank.
Correlation of L. pneumophila concentrations by method and with water quality parameters
A non-parametric Kendall's Tau correlation was used in order to consider different limits of detection for the compared variables; note that Kendall's Tau will produce results ~0.15 lower than Pearson or Spearman rank correlation coefficients for the same data (Helsel, 2005; Figure 6). L. pneumophila was correlated with free chlorine concentrations (Kendall's Tau of −0.12 to −0.36 for IDEXX and qPCR data), consistent with recommendations that residual chlorine is important for reducing Legionella spp. (Rafiee et al., 2014). Culturable L. pneumophila concentrations showed a mild/moderate positive correlation with other water quality parameters such as conductivity (Kendall's Tau = 0.19) and zinc (Kendall's Tau = 0.23). Comparing methods, the IDEXX and qPCR had a very low correlation coefficient (Kendall's Tau = 0.01). This may be due to a relatively small proportion of total samples which had positive detections. Comparing positive/negative sample concordance (Supplementary Table 4) for 134 samples for which both IDEXX and qPCR were performed, 97 (73.1%) were concordant (positive for IDEXX and qPCR or negative for IDEXX and qPCR). For the 36 that did not align, 19 pairs had a positive qPCR and negative IDEXX result. The remaining 17 pairs with higher IDEXX than qPCR were from August 2020 samples from conventional faucets, automatic faucets, the expansion tank, and the shower as well as September 2020–July 2021 samples from conventional faucets, automatic faucets, the expansion tank, and the water softener resin. Samples from July 2021 that were positive for IDEXX were at lower levels in the water softener (~100 MPN/100 mL or lower) compared to other discordant samples earlier in the study and may have approached the qPCR LOD and LOQ of 16.7 gc/100 mL water or 83.3 gc/100 mL water, respectively. The high concentrations via IDEXX and non-detects via qPCR in August 2020 may indicate some methodological limitations for those samples due to low qPCR method recovery or PCR inhibitors. While positive and negative controls were used for all IDEXX tests and seroagglutination tests confirmed L. pneumophila serogroups in positive samples, false positive results from IDEXX tests have been reported and warrant further investigation (Hirsh et al., 2021). The % of false + using IDEXX varies from 0.5 to 4.8% due to other gram – bacteria present in the water IDEXX legiolert method was compared with the CDC method of LP quantification. They observed IDEXX has higher resistance to non legionella organisms compared to other methods with varying interferences. IDEXX also has high sensitivity and specificity compared to several other quantification methods. IDEXX legiolert is widely used due to its high reliability and accuracy to detect LP, has 99% reproducibility. A weak negative correlation was observed between L. pneumophila concentrations and pH (−0.21), copper (−0.16), and building occupancy (−0.06). The mip gene concentration followed similar trends. Lastly, a weak positive correlation was observed between iron and UV 254 values (0.01).
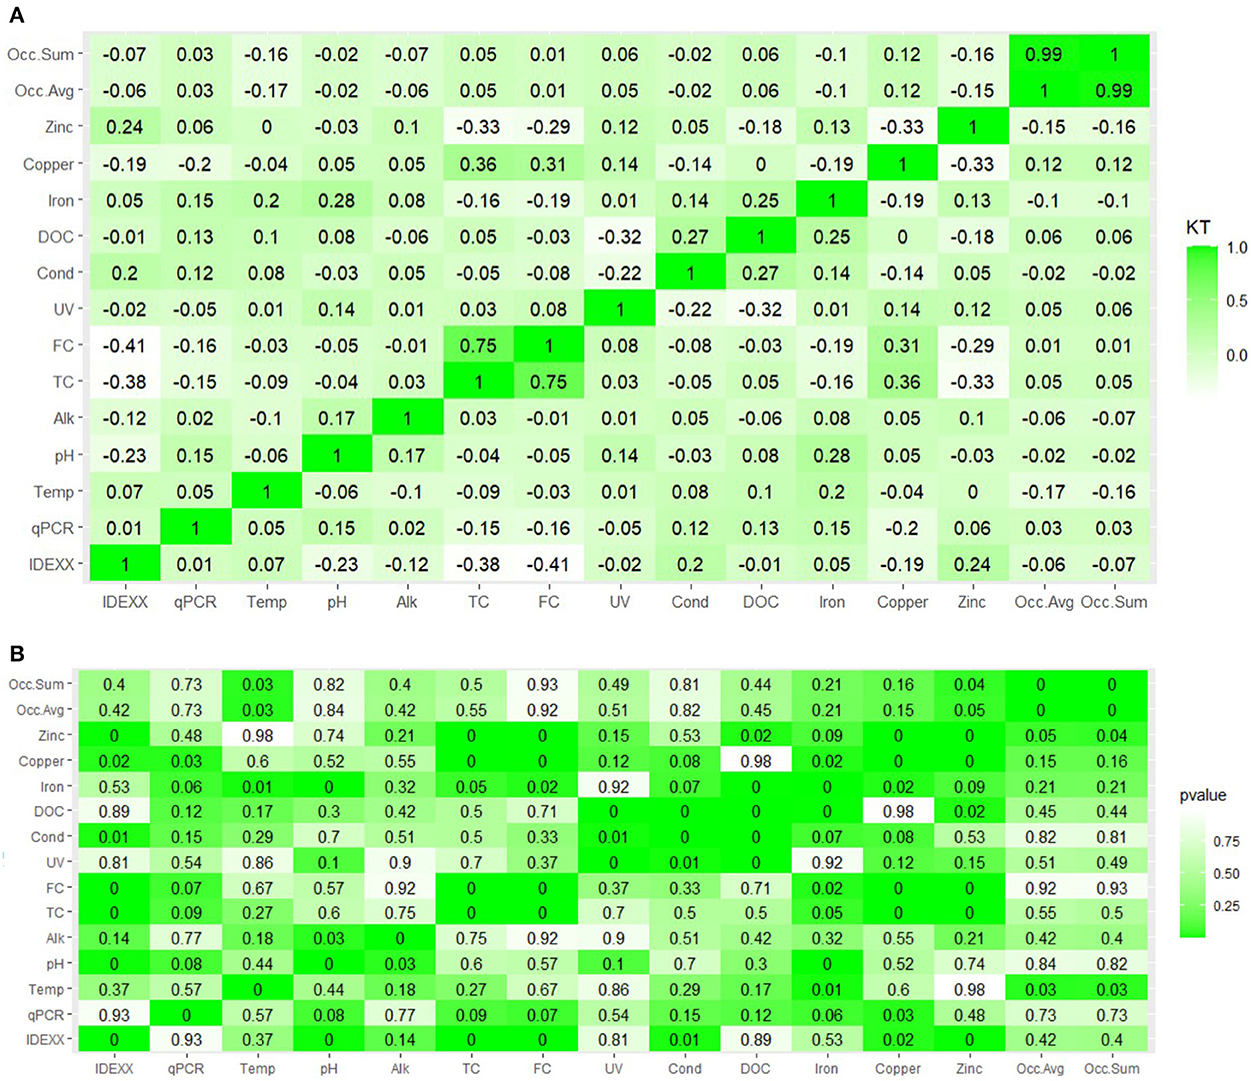
Figure 6. (A,B) Bivariate correlations between water quality parameters (top: Kendall's Tau Heatmap; bottom: p-values).
Discussion
Physical-Chemical water quality parameters
Temperature and disinfection residual are the most frequently recommended parameters to monitor overall building water quality (Singh et al., 2020). Legionella spp. are known to grow best at temperatures from 25 to 45°C (CDC, 2018). In locations such as Tempe with warmer climates, water in pipes in normal buildings that carry cold water can reach higher temperatures [e.g., up to ~32°C in a previous study (Richard et al., 2021)] in certain areas that encourage Legionella spp. growth. Both in distributions systems and premise plumbing, water temperature can get heated by the ambient temperature which might accelerate chemical and biological rates of reactions. This includes decay of disinfectant residual, microbial growth including DWPI, and leaching of plumbing materials (Julien et al., 2022). Hot water systems are potential contributors to water quality issues, specifically for microbial parameters. LEED buildings tend to have a lower water heater setpoint (48–50°C instead of 60°C) due to their energy saving credit requirements (Wilber, 2015). To encourage less conducive growth ranges for Legionella spp., water heater temperatures can be increased while following anti-scalding regulations which recommend that the hot water temperature at the point of use should not exceed 120°F/48.9°C (CDC, 2020; Heida et al., 2022).
According to USEPA guidelines, a pH of 6.5–8.5 is an acceptable range for drinking water (Ikem et al., 2002; USEPA, 2009; Islam et al., 2017). The average pH of the City of Tempe drinking water entering the building was 8.05. After the water entered the whole building softening system, there was a slight decrease in pH to 7.99 which was observed in the water samples collected from the storage/expansion tank adjacent to the softener. This could be due to the removal of alkaline earth metals (i.e., calcium, magnesium) by the ion exchange resin from the softener, which also contribute to hardness. As water flows through the complex building plumbing system with copper piping, a slight increase in pH was observed, ranging from 8.09 to 8.14 units. The pH fluctuations can cause metals to leach from pipes into the stagnant water (Cuppett, 2006; Salehi et al., 2020). As other water quality parameters such as pH, alkalinity, and copper concentration increased, there was a slight decrease in culturable L. pneumophila concentrations showing a weak negative correlation. These results are consistent with previously reported observations (Ohno et al., 2003; Helbig et al., 2007; Logan-Jackson, A. and Rose, 2021).
The chlorine residual values for the city drinking water at the building entry point were in accordance with USEPA's national primary drinking water regulation. According to USEPA standards, the disinfectant residual concentration at the point of entry should not be <0.2 mg/L detectable concentration (USEPA, 2022). The disinfectant residual values for grab samples collected inside the building had values below the minimum recommended 0.2 mg/L. There could be several reasons for loss of disinfectant after water enters the building including stagnation periods from low use of fixtures and long closures, warmer water temperatures, and quality of incoming water (Richard et al., 2021; Julien et al., 2022). Conductivity in water samples was ~1,400 μS/cm on average. This value is on the higher end of typical drinking water values of 50–1,500 μS/cm, with USEPA recommending <1,000 μS/cm (NM EPHT, 2019). This could be due to periods of elevated temperature within the building or the water softener conditions.
Metals
The concentration of metals in the drinking water depends on the residence time of water within pipes, water temperature, and water pH. During the biweekly water sampling, iron concentrations exceeded action limits twice for shower samples. The expansion tank adjacent to the softener was made from steel, which potentially could have corroded and leached iron into the water. Iron dissolution and/or corrosion can occur from oxidation and a decrease in pH. Iron is considered a secondary contaminant for aesthetic concerns, giving water a metallic taste, forming sediment and rusty color, or potentially causing reddish or orange staining. Additionally, high concentrations of iron [as a reference point, 250 mg/Lis used in BYE agar optimized for Legionella spp. growth (Portier et al., 2016)] are a matter of concern as it is an essential nutrient for the growth of Legionella spp. (States et al., 1985; Cullom et al., 2020). Water concentrations of iron associated with Legionella spp. growth vary and have been reported for bench scale studies up to 1 mg/L and in field studies up to 69.97 mg/L (States et al., 1985; Cullom et al., 2020). The copper values of water samples collected from the current study building were higher than city water at the point of entry. The copper plumbing potentially contributes to the elevated copper values in the water samples collected inside the building. Copper has a secondary MCL (SMCL) of 1.0 mg/L because it can cause a metallic taste or blue-green staining, but California has a public health goal of 0.3 mg/L for sensitive populations (OEHHA, 2008; Taylor et al., 2020). Short-term exposures to copper can cause gastrointestinal distress, including nausea or vomiting (Taylor et al., 2020). The remaining metals measured (Mn, Ag, Zn, Ni, Ti, V, Pb, Pd, Ce, and W) were never measured at concentrations exceeding recommended water quality values.
Microbial water quality
Widespread and persistent colonization of L. pneumophila was observed in the studied LEED building with reduced occupancy after the COVID-19 shutdown. During this period, there was intermittent and variable usage of the potable water system impacting the water flow dynamics. Prolonged stagnation due to restricted water circulation can stimulate colonization of Legionella spp. within established biofilms (Nisar et al., 2020). As extensive growth of L. pneumophila was observed in the building plumbing, several interventions were implemented by the building facility managers. Flushing in the building resulted in a small decrease in concentrations of L. pneumophila. Significant decreases in L. pneumophila were observed when other corrective actions such as replacing water softening system, expansion tanks, and changing shower heads. L. pneumophila in water samples were identified as both serotype1 and serogroup 2–14. Other studies have also observed the presence of serotypes 1 and 2 even after decontamination as these strains survive thermal disinfection (Steinert et al., 2002). Serogroup 2–14 were found to be the most prevalent in a study conducted in Hungary where several hot water networks in commercial and residential buildings were monitored (Barna et al., 2016).
Legionella spp. regulations and guidelines
There is a lack of federal laws and regulations pertinent to Legionella spp. control. Legionella spp. is listed on the USEPA Candidate Contaminant List (CCL). No specific technology or installation of treatment in premise plumbing is recommended for controlling Legionella spp. growth as premise plumbing usually doesn't fall under the same purview as regulated public water systems. The MCLG for Legionella spp. is 0 CFU/L and the MCL is treatment-based. The MCLG is not enforceable and does not require routine monitoring. There are no quantitative limits set for Legionella spp., however, several recommended guidelines for L. pneumophila concentration limits are available (Masters et al., 2018; National Academies of Sciences, 2019). Risk-based targets based on analysis of acceptable risk levels for different fixtures (toilet flushing, sinks, showers) and dose-response models (clinical severity infection, subclinical severity) are also available (Hamilton et al., 2019). Using the risk-based targets as a guideline for conventional water fixtures, 75 of 80 samples were above these values, indicating the presence of a potential health risk if aerosol exposures occur within the building.
Impact of sampling timing and locations
L. pneumophila concentrations in the bulk water from the building for Monday samples were observed to be significantly higher than for Wednesday samples. This could be due to higher stagnation over the weekends (~60 h of inactivity) before collecting samples on Monday than just the overnight stagnation before collecting samples on Wednesday morning. The doubling time of Legionella is approximately 2 h at mid-log phase within a host cell (Steinert et al., 2002), however this is likely to be temperature-dependent with first order growth rates in drinking water ranging from 0.83 to 0.25 h−1 at temperatures 25–42°C (Yee and Wadowsky, 1982; Sharaby et al., 2017; Heida et al., 2022). Similar results were observed in a recent study (Montagnino et al., 2022). This does not necessarily mean that there is higher growth of Legionella spp. as major growth would occur in the biofilm and not in bulk water (Ra et al., 2020). Biofilm samples from the pipes were not tested in this study but are an area for future work.
L. pneumophila concentrations for 3rd and 5th floor water samples were significantly higher than 1st floor samples. This could indicate that the microbial water quality deteriorates as it travels vertically to the higher floors away from the city drinking water point of entry (Richard et al., 2021). An increasing pipe length would provide more opportunities for heat loss and contact of bulk water with biofilms in the building plumbing system.
While not explored in this study, Legionella risks may show seasonal trends due to differences in occurrence and/or exposure patterns, with higher occurrence generally during summer months (Sharaby et al., 2019; Ley et al., 2020; Barskey et al., 2022). The current study was conducted over a full year, but due to multiple factors and interventions the extent to which seasonality played a role is challenging to assess. Three measurements at the point of entry water had a positive but not quantifiable qPCR measurement during the study on 9/2/2020, 9/7/2020, and 9/16/2020 indicating fluctuations in incoming water to the building. Culturable L. pneumophila was never detected at the point of entry.
Impact of water management interventions on building water quality
The studied building did not have a water management plan in place as recommended by national organizations (NASEM, 2019). Water management plans are effective in reducing the likelihood of a Legionella spp. outbreak (Clopper et al., 2021). Several corrective actions were implemented by the building facility managers after they were informed about the deteriorating water quality during the duration of reduced occupancy. Flushing helped to replenish the disinfectant residual (Hozalski et al., 2020), however, it did not eliminate L. pneumophila colonization. After replacing the showerheads, the water softener, and the expansion tank, there was a significant decrease in culturable L. pneumophila concentrations. However, the expansion tank was still a source of high L. pneumophila levels (no culturable L. pneumophila but gene concentrations up to 1.95 × 10³ gc/100 mL. This indicates that softeners could still serve as a source of L. pneumophila seeding in the system.
Identification of water softeners and the expansion tank as a cause of L. pneumophila contamination
The building water softener tanks are located in a climate-controlled mechanical room, although ambient air temperatures remained elevated compared to the rest of the building (21°C+) and could still contribute to elevated temperatures in cold water pipes. The non-functional tanks were in standby mode, indicating a higher degree of water stagnation. It is common to have oversized tanks, equipment malfunction, and maintenance issues with water softening systems such as fouling of ion exchange resins from biofilm and metal deposition (LRM, 2021). Ion exchange water softeners can result in microbial growth after ion exchange resin for some organisms (e.g., higher indicator bacterial counts but not other groups such as Pseudomonas and E. coli), however, limited data are available regarding ion exchange resins as a reservoir for DWPI (Romano et al., 1997; Parsons, 2000). Other studies noted high concentrations of Legionella spp. exiting water softeners at 103.8 CFU/100 mL (Aw et al., 2022) and that softeners served as microbial amplifiers in a school building (Ra et al., 2020). Water softeners have been associated with L. pneumophila colonization in dental settings (Ma'ayeh et al., 2008) and hotels (Borella et al., 2005), and are noted as a potential hazard for medical settings such as hemodialysis units where softening is used (Favero et al., 1975). The current work identified L. pneumophila in multiple components of the water softening system including softener tank water, storage/expansion tank water, and softener resin. Resins may provide media for bacterial growth in the softening system (Stamm et al., 1969; Flemming, 1987; Anupkumar et al., 2001) along with increasing water age and temperature (Rhoads, 2021), however, limited information is available on resins. New softener resins are also known to leach high amounts of dissolved organic carbon into the softened water, further creating conditions likely to support microbial growth (Salehi et al., 2020). In this study, L. pneumophila concentrations were higher in tanks that were in standby operation mode compared to tanks in softening mode. As the water softener was seeded with L. pneumophila, the entire building received water that tested positive for L. pneumophila. The expansion tank that provides water to the higher floors of the building was also seeded with L. pneumophila thus mitigation strategies such as flushing alone did not help until the softening system and expansion tank were replaced. Softener sizing is usually based on building occupancy and can be expanded in phases with increasing occupancy, however oversizing is a common problem (LRM, 2021). In this study, the original softener was designed for a fully operational building, but the building never achieved its full operational capacity. Softener sizing is usually based on building occupancy and could ideally be commissioned commensurate with building occupancy if the design is compartmentalized with multiple tanks to prevent stagnation associated with oversizing.
The expansion tank presumably also maintained a high water age throughout the study, indicating that expansion tanks could be a source and/or amplifier of Legionella growth. Expansion tanks have been noted as contributors to stagnation and one study indicated that isolating the expansion tank resulted in a reduction in Legionella in a Veterans Affairs medical facility (Ambrose et al., 2020). However, there is limited information available on the role of expansion tanks and documented sampling of these apparatuses.
Implications of this study for sustainable buildings and water management plans
In the US, the green or sustainable buildings conserve water compared to conventional buildings by using water efficient fixtures along with large water expansion tanks. Water saving fixtures are usually low flow fixtures and mostly have aerators. Slower flowrates and elevated water ages in green buildings may pose a concern for water quality (Rhoads et al., 2016). The overall water quality in a green building is influenced by several factors such as source water characteristics, season, physicochemical plumbing complexities, water age, stagnation, water usage, water flow rates/patterns, disinfectant residuals, expansion tanks, fixtures, time of the day, and water management practices. This study identified several factors such as temperatures within the ideal L. pneumophila growth range due to a low water heater set point and potentially combined with elevated ambient temperatures, water stagnation under reduced occupancy conditions, colonized water fixtures such as showerheads, and colonization of multiple aspects of a water softening system as contributing to L. pneumophila contamination within a LEED building. Ion exchange resins and water softener bulk water were colonized with L. pneumophila, and therefore the water softener is an underexplored reservoir of pathogens. These factors can inform multi-pronged water safety plans for LEED buildings designed to reduce exposure risks, in addition to informing LEED criteria that are inclusive of health considerations and risks in the long-term. Water softeners are a relatively unstudied area of building water systems and warrant further investigation for their impacts on microbial water quality.
Studies involving water monitoring efforts in green building during restricted occupancy are rare. The findings from these studies are relevant and can be used for schools over break and workplaces over holidays. A written water management plan specific to the building can help mitigate such water quality issues and identify root causes of water quality problems.
Conclusion
L. pneumophila was present throughout a LEED building water system during a period of reduced occupancy. The building was highly colonized compared to a nationwide survey during the COVID-19 pandemic (Dowdell et al., 2022) with multiple factors contributing to colonization including lack of disinfectant residual, fluctuating temperatures, low water heater set point, a colonized expansion tank, the presence of a whole-building water softener, and low occupancy. This finding prompted water quality interventions by the building facilities' management.
The main two water management plan activities that are most broadly recommended by guidance documents (flushing and raising the water heater set point) did not completely mitigate L. pneumophila colonization in the building, highlighting the need to explore root causes of colonization and proliferation of pathogens.
The expansion tank, water softener, and water softener resins were colonized with L. pneumophila. Colonization was not reduced until the expansion tank was replaced and highlights water softeners and expansion tanks as a potentially key, yet understudied component of water management plans.
Identifying the root cause of colonization was a time-, labor-, and cost-intensive activity. Improved methods are needed for rapid diagnosis and automated response to microbial water quality problems in buildings. Practical barriers to diagnosis and response result in undiscovered and unmitigated building hazards.
Data availability statement
The original contributions presented in the study are included in the article/Supplementary material, further inquiries can be directed to the corresponding author.
Author contributions
SJ conducted sampling and laboratory analysis and wrote manuscript. RR, CL, JH, NS, LC, NM, LD, GM, AH, and BW contributed to study design, sampling, physical-chemical, and metal data processing. DS conducted occupancy analysis. RR and CL additionally contributed to manuscript. TB and PW edited manuscript, contributed to study design, and supervised individuals involved in sample collection. KH originated study, supervised sample collection and analysis, and contributed to manuscript. All authors contributed to the article and approved the submitted version.
Funding
This work was partially funded by the National Science Foundation Nanosystems Engineering Research Center for Nanotechnology-Enabled Water Treatment (EEC-1449500). This research was partially supported under Assistance Agreement No. R836880 awarded by the U.S. Environmental Protection Agency. It has not been formally reviewed by USEPA.
Acknowledgments
The authors are grateful to Paula Aguilar for assistance with sampling.
Conflict of interest
Authors RR and CL are employed by NCS Engineers but were not employed by this entity during the work performed for this study.
The remaining authors declare that the research was conducted in the absence of any commercial or financial relationships that could be construed as a potential conflict of interest.
Publisher's note
All claims expressed in this article are solely those of the authors and do not necessarily represent those of their affiliated organizations, or those of the publisher, the editors and the reviewers. Any product that may be evaluated in this article, or claim that may be made by its manufacturer, is not guaranteed or endorsed by the publisher.
Supplementary material
The Supplementary Material for this article can be found online at: https://www.frontiersin.org/articles/10.3389/frwa.2022.966223/full#supplementary-material
References
Ambrose, M., Kralovic, S. M., Roselle, G. A., Kowalskyj, O., Rizzo, V. J., Wainwright, D. L., et al. (2020). Implementation of Legionella prevention policy in health care facilities: the United States veterans health administration experience. J. Public Health Manag. Pract. 26, E1. doi: 10.1097/PHH.0000000000000986
Anupkumar, B., Rao, T. S., and Satpathy, K. K. (2001). Microbial fouling of an anion exchange resin. Curr. Sci. 80, 1104–1107. Available online at: https://www.jstor.org/stable/24105763
Aw, T. G., Scott, L., Jordan, K., Ra, K., Ley, C., and Whelton, A. J. (2022). Prevalence of opportunistic pathogens in a school building plumbing during periods of low water use and a transition to normal use. Int. J. Hyg. Environ. Health 241, 113945. doi: 10.1016/j.ijheh.2022.113945
Barna, Z., Kádár, M., Kálmán, E., Scheirich Szax, A., and Vargha, M. (2016). Prevalence of Legionella in premise plumbing in Hungary. Water Res. 90, 71–78. doi: 10.1016/j.watres.2015.12.004
Barskey, A. E., Derado, G., and Edens, C. (2022). Rising incidence of Legionnaires' disease and associated epidemiologic patterns, United States, 1992–2018. Emerg. Infect. Dis. 28, 527–538. doi: 10.3201/eid2803.211435
Beer, K. D. (2015). Surveillance for waterborne disease outbreaks associated with drinking water—United States, 2011-2012. MMWR Morb. Mortal. Wkly. Rep. 64, 842–848. doi: 10.15585/mmwr.mm6431a2
Benedict, K. M., Reses, H., Vigar, M., Roth, D. M., Roberts, V. A., Mattioli, M., et al. (2017). Surveillance for waterborne disease outbreaks associated with drinking water—United States, 2013–2014. MMWR Morb. Mortal. Wkly. Rep. 66, 1216–1221. doi: 10.15585/mmwr.mm6644a3
Borchardt, M. A., Boehm, A. B., Salit, M., Spencer, S. K., Wigginton, K. R., and Noble, R. T. (2021). The environmental microbiology minimum information (EMMI) guidelines: qPCR and dPCR quality and reporting for environmental microbiology. Environ. Sci. Technol. 55, 10210–10223. doi: 10.1021/acs.est.1c01767
Borella, P., Montagna, M. T., Stampi, S., Stancanelli, G., Romano-Spica, V., Triassi, M., et al. (2005). Legionella contamination in hot water of Italian hotels. Appl. Environ. Microbiol. 71, 5805–5813. doi: 10.1128/AEM.71.10.5805-5813.2005
Bustin, S. A., Benes, V., Garson, J. A., Hellemans, J., Huggett, J., Kubista, M., et al. (2009). The MIQE guidelines: minimum information for publication of quantitative real-time PCR experiments. Clin. Chem. 55, 611–622. doi: 10.1373/clinchem.2008.112797
Cassell, K., Davis, J. L., and Berkelman, R. (2021). Legionnaires' disease in the time of COVID-19. Pneumonia 13, 2. doi: 10.1186/s41479-020-00080-5
CDC (2018). What Owners and Managers of Buildings and Healthcare Facilities Need to Know about the Growth and Spread of Legionella. Atlanta, GA: CDC.
CDC (2020). Guidance for Reopening Buildings After Prolonged Shutdown or Reduced Operation: Ensure the Safety of Your Occupants and Building Water System and Devices. Atlanta, GA: CDC. Available online at: https://www.cdc.gov/coronavirus/2019-ncov/php/building-water-system.html
Clopper, B. R., Kunz, J. M., Salandy, S. W., Smith, J. C., Hubbard, B. C., and Sarisky, J. P. (2021). A methodology for classifying root causes of outbreaks of legionnaires' disease: deficiencies in environmental control and water management. Microorganisms 9, 89. doi: 10.3390/microorganisms9010089
Cullom, A. C., Martin, R. L., Song, Y., Williams, K., Williams, A., Pruden, A., et al. (2020). Critical review: propensity of premise plumbing pipe materials to enhance or diminish growth of Legionella and other opportunistic pathogens. Pathogens 9, 957. doi: 10.3390/pathogens9110957
Cuppett, J. D. (2006). Evaluation of copper speciation and water quality factors that affect aqueous copper tasting response. Chem. Senses 31, 689–697. doi: 10.1093/chemse/bjl010
Dedicoat, M., and Venkatesan, P. (1999). The treatment of Legionnaires' disease. J. Antimicrob. Chemother. 43, 747–752. doi: 10.1093/jac/43.6.747
Dowdell, K. S., Greenwald, H. D., Joshi, S., Grimard-Conea, M., Pitell, S., Song, Y., et al (2022). Legionella Pneumophila Occurrence in Reduced-Occupancy Buildings in 11 Cities During the COVID-19 Pandemic. medRxiv [Preprint]. Available online at: https://www.medrxiv.org/content/10.1101/2022.06.28.22277022v1.full.pdf
Falkinham, J. (2015). Common features of opportunistic premise plumbing pathogens. Int. J. Environ. Res. Public. Health 12, 4533–4545. doi: 10.3390/ijerph120504533
Falkinham, J., Pruden, A., and Edwards, M. (2015). Opportunistic premise plumbing pathogens: increasingly important pathogens in drinking water. Pathogens 4, 373–386. doi: 10.3390/pathogens4020373
Favero, M. S., Petersen, N. J., Carson, L. A., Bond, W. W., and Hindman, S. H. (1975). Gram-negative water bacteria in hemodialysis systems. Health Lab. Sci. 12, 321–334.
Felstead, A., and Henseke, G. (2017). Assessing the growth of remote working and its consequences for effort, well-being and work-life balance. New Technol. Work Employ. 32, 195–212. doi: 10.1111/ntwe.12097
Flemming, H.-C. (1987). Microbial growth on ion exchangers. Water Res. 21, 745–756. doi: 10.1016/0043-1354(87)90149-7
Hamilton, K. A., Hamilton, M. T., Johnson, W., Jjemba, P., Bukhari, Z., LeChevallier, M., et al. (2019). Risk-Based critical concentrations of Legionella pneumophila for indoor residential water uses. Environ. Sci. Technol. 53, 4528–4541. doi: 10.1021/acs.est.8b03000
Heida, A., Mraz, A., Hamilton, M. T., Weir, M. H., and Hamilton, K. A. (2022). Computational framework for evaluating risk trade-offs in costs associated with Legionnaires' disease risk, energy, and scalding risk for hospital hot water systems. Environ. Sci. Water Res. Technol. 8, 76–97. doi: 10.1039/D1EW00397F
Helbig, J. H., Benson, R. F., Pelaz, C., Jacobs, E., and Lück, P. C. (2007). Identification and serotyping of atypical Legionella pneumophila strains isolated from human and environmental sources. J. Appl. Microbiol. 102, 100–105. doi: 10.1111/j.1365-2672.2006.03057.x
Helsel, D. R. (2005). More than obvious: better methods for interpreting nondetect data. Environ. Sci. Technol. 20, 419A−423A. doi: 10.1021/es053368a
Hirsh, M., Baron, J. L., Mietzner, S., Rihs, J. D., and Stout, J. E. (2021). Cross-reactivity of the IDEXX legiolert method with other gram-negative bacteria and waterborne pathogens leads to false-positive assay results. Lett. Appl. Microbiol. 72, 750–756. doi: 10.1111/lam.13469
Howd, R. A. (2000). Proposed Notification Level for Vanadium. California Office of Environmental Health Hazard Assessment. Available online at: https://oehha.ca.gov/water/notification-level/proposed-notification-level-vanadium
Hozalski, R. M., LaPara, T. M., Zhao, X., Kim, T., Waak, M. B., Burch, T., et al. (2020). Flushing of stagnant premise water systems after the COVID-19 shutdown can reduce infection risk by Legionella and Mycobacterium spp. Environ. Sci. Technol. 54, 15914–15924. doi: 10.1021/acs.est.0c06357
Ikem, A., Odueyungbo, S., Egiebor, N. O., and Nyavor, K. (2002). Chemical quality of bottled waters from three cities in eastern Alabama. Sci. Total Environ. 285, 165–175. doi: 10.1016/S0048-9697(01)00915-9
Islam, R., Faysal, S., Amin, R., Juliana, F. M., Islam, M. J., Alam, J., et al. (2017). Assessment of pH and total dissolved substances (TDS) in the commercially available bottled drinking water. IOSR J. Nurs. Health Sci. 6, 35–40. Available online at: https://www.iosrjournals.org/iosr-jnhs/papers/vol6-issue5/Version-9/E0605093540.pdf
Julien, R., Saravi, B., Nejadhashemi, A., Whelton, A. J., Aw, T. G., and Mitchell, J. (2022). Identifying water quality variables most strongly influencing Legionella concentrations in building plumbing. AWWA Water Sci. 4, e1267. doi: 10.1002/aws2.1267
LeChevallier, M. W. (2019). Monitoring distribution systems for Legionella pneumophila using legiolert. AWWA Water Sci. 1, e1122. doi: 10.1002/aws2.1122
Ley, C. J., Proctor, C. R., Singh, G., Ra, K., Noh, Y., Odimayomi, T., et al. (2020). Drinking water microbiology in a water-efficient building: stagnation, seasonality, and physicochemical effects on opportunistic pathogen and total bacteria proliferation. Environ. Sci. Water Res. Technol. 6, 2902–2913. doi: 10.1039/D0EW00334D
Liang, J. (2021). Impact of building closures during the COVID-19 pandemic on Legionella infection risks. Am. J. Infect. Control 49, 1564–1566. doi: 10.1016/j.ajic.2021.09.008
Logan-Jackson, A., and Rose, J. B. (2021). Cooccurrence of five pathogenic Legionella spp. and two free-living amoebae species in a complete drinking water system and cooling towers. Pathogens 10, 1407. doi: 10.3390/pathogens10111407
Logan-Jackson, A. R., and Rose, J. B. (2021). Water age effects on the occurrence and concentration of Legionella species in the distribution system, premise plumbing, and the cooling towers. Microorganisms 10, 81. doi: 10.3390/microorganisms10010081
Ma'ayeh, S., Al-Hiyasat, A., Hindiyeh, M., and Khader, Y. (2008). Legionella pneumophila contamination of a dental unit water line system in a dental teaching centre. Int. J. Dent. Hyg. 6, 48–55. doi: 10.1111/j.1601-5037.2007.00280.x
Mantesi, E., Chmutina, K., and Goodier, C. (2022). The office of the future: operational energy consumption in the post-pandemic era. Energy Res. Soc. Sci. 87, 102472. doi: 10.1016/j.erss.2021.102472
Masters, S., Clancy, J. L., Villegas, S., LeChevallier, M., and Bukhari, Z. (2018). Customer Messaging on Opportunistic Pathogens in Plumbing Systems. Denver, CO: Water Research Foundation Project 4664.
Montagnino, E., Proctor, C. R., Ra, K., Ley, C., Noh, Y., Vigil, K., et al. (2022). Over the weekend: Water stagnation and contaminant exceedances in a green office building. PLOS Water 1, e0000006. doi: 10.1371/journal.pwat.0000006
Monteiro, S. N., Robalo, A. M., and Santos, R. J. (2021). Evaluation of LegiolertTM for the detection of Legionella pneumophila and comparison with spread-plate culture and qPCR methods. Curr. Microbiol. 78, 1792–1797. doi: 10.1007/s00284-021-02436-6
NASEM (2019). Management of Legionella in Water Systems. Washington, DC: The National Academies Press; National Academies of Sciences, Engineering and Medicine.
National Academies of Sciences (2019). Regulations and Guidelines on Legionella Control in Water Systems—Management of Legionella in Water Systems. National Academies of Sciences.
Nazarian, E. J., Bopp, D. J., Saylors, A., Limberger, R. J., and Musser, K. A. (2008). Design and implementation of a protocol for the detection of Legionella in clinical and environmental samples. Diagn. Microbiol. Infect. Dis. 62, 125–132. doi: 10.1016/j.diagmicrobio.2008.05.004
Neil, K., and Berkelman, R. (2008). Increasing incidence of legionellosis in the United States, 1990–2005: changing epidemiologic trends. Clin. Infect. Dis. 47, 591–599. doi: 10.1086/590557
Nisar, M. A., Ross, K. E., Brown, M. H., Bentham, R., and Whiley, H. (2020). Water stagnation and flow obstruction reduces the quality of potable water and increases the risk of legionelloses. Front. Environ. Sci. 8, 611611. doi: 10.3389/fenvs.2020.611611
OEHHA (2008). Public Health Goal for Copper in Drinking Water. California Office of Environmental Health Hazard Assessment, OEHHA.
Ohno, A., Kato, N., Yamada, K., and Yamaguchi, K. (2003). Factors influencing survival of Legionella pneumophila serotype 1 in hot spring water and tap water. Appl. Environ. Microbiol. 69, 2540–2547. doi: 10.1128/AEM.69.5.2540-2547.2003
Parsons, S. (2000). The effect of domestic ion-exchange water softeners on the microbiological quality of drinking water. Water Res. 34, 2369–2375. doi: 10.1016/S0043-1354(99)00407-8
Portier, E., Bertaux, J., Labanowski, J., and Hechard, Y. (2016). Iron availability modulates the persistence of Legionella pneumophila in complex biofilms. Microbes Environ. 31, 387–394. doi: 10.1264/jsme2.ME16010
Proctor, C., Garner, E., Hamilton, K. A., Ashbolt, N. J., Caverly, L. J., Falkinham, J. O., et al. (2022). Tenets of a holistic approach to drinking water-associated pathogen research, management, and communication. Water Res. 211, 117997. doi: 10.1016/j.watres.2021.117997
Proctor, C. R., Rhoads, W. J., Keane, T., Salehi, M., Hamilton, K., Pieper, K. J., et al. (2020). Considerations for large building water quality after extended stagnation. AWWA Water Sci. 2, e1186. doi: 10.1002/aws2.1186
Ra, K., Odimayomi, T., Ley, C., Aw, T. G., Rose, J. B., and Whelton, A. J. (2020). Finding building water quality challenges in a 7 year old green school: implications for building design, sampling, and remediation. Environ. Sci. Water Res. Technol. 6, 2691–2703. doi: 10.1039/D0EW00520G
Rafiee, M., Mesdaghinia, A., Hajjaran, H., Miahipour, A., and Jahangiri-Rad, M. (2014). The efficacy of residual chlorine content on the control of Legionella spp. Hosp. Water Syst. 43, 8.
Reller, L. B., Weinstein, M. P., and Murdoch, D. R. (2003). Diagnosis of Legionella infection. Clin. Infect. Dis. 36, 64–69.
Rhoads, W. J., and Hammes, F. (2021). Growth of Legionella during COVID-19 lockdown stagnation. Environ. Sci. Water Res. Technol. 7, 10–15. doi: 10.1039/D0EW00819B
Rhoads, W. J., Pearce, A., Pruden, A., and Edwards, M. A. (2015). Anticipating the effects of green buildings on water quality and infrastructure. J. Am. Water Works Assoc. 107, 50–61. doi: 10.5942/jawwa.2015.107.0058
Rhoads, W. J., Pruden, A., and Edwards, M. A. (2016). Survey of green building water systems reveals elevated water age and water quality concerns. Environ. Sci. Water Res. Technol. 2, 164–173. doi: 10.1039/C5EW00221D
Richard, R., Hamilton, K. A., Westerhoff, P., and Boyer, T. H. (2020). Tracking copper, chlorine, and occupancy in a new, multi-story, institutional green building. Environ. Sci. Water Res. Technol. 6, 1672–1680. doi: 10.1039/D0EW00105H
Richard, R., Hamilton, K. A., Westerhoff, P., and Boyer, T. H. (2021). Physical, chemical, and microbiological water quality variation between city and building and within multistory building. ACS EST Water 1, 1369–1379. doi: 10.1021/acsestwater.0c00240
Romano, G., Stampi, S., Zanetti, F., De, L. G., and Tonelli, E. (1997). Occurrence of gram-negative bacteria in drinking water undergoing softening treatment. Int. J. Hyg. Environ. Med. 200, 152–162.
Salehi, M., Odimayomi, T., Ra, K., Ley, C., Julien, R., Nejadhashemi, A. P., et al. (2020). An investigation of spatial and temporal drinking water quality variation in green residential plumbing. Build. Environ. 169, 106566. doi: 10.1016/j.buildenv.2019.106566
Schwake, D. O., Garner, E., Strom, O. R., Pruden, A., and Edwards, M. A. (2016). Legionella DNA markers in tap water coincident with a spike in legionnaires' disease in flint, MI. Environ. Sci. Technol. Lett. 3, 311–315. doi: 10.1021/acs.estlett.6b00192
Sharaby, Y., Rodríguez-Martínez, S., Höfle, M. G., Brettar, I., and Halpern, M. (2019). Quantitative microbial risk assessment of Legionella pneumophila in a drinking water supply system in Israel. Sci. Total Environ. 671, 404–410. doi: 10.1016/j.scitotenv.2019.03.287
Sharaby, Y., Rodríguez-Martínez, S., Oks, O., Pecellin, M., Mizrahi, H., Peretz, A., et al. (2017). Temperature-Dependent growth modeling of environmental and clinical legionella pneumophila multilocus variable-number tandem-repeat analysis (MLVA) genotypes. Appl. Environ. Microbiol. 83, e03295–e03216. doi: 10.1128/AEM.03295-16
Singh, R., Hamilton, K. A., Rasheduzzaman, M., Yang, Z., Kar, S., Fasnacht, A., et al. (2020). Managing water quality in premise plumbing: subject matter experts' perspectives and a systematic review of guidance documents. Water 12, 347. doi: 10.3390/w12020347
Soda, E. A., Barskey, A. E., Shah, P. P., Schrag, S., Whitney, C. G., Arduino, M. J., et al. (2017). Vital signs: health care–associated legionnaires' disease surveillance data from 20 states and a large metropolitan area—United States, 2015. MMWR Morb. Mortal Wkly. Rep. 66, 584–589. doi: 10.15585/mmwr.mm6622e1
Stamm, J. M., Engelhard, W. E., and Parsons, J. E. (1969). Microbiological Study of Water-Softener Resins. Appl. Microbiol. 18, 376–386. doi: 10.1128/am.18.3.376-386.1969
States, S. J., Conley, L. F., Ceraso, M., Stephenson, T. E., Wolford, R. S., Wadowsky, R. M., et al. (1985). Effects of metals on Legionella pneumophila growth in drinking water plumbing systems. Appl. Environ. Microbiol. 50, 1149–1154. doi: 10.1128/aem.50.5.1149-1154.1985
Steinert, M., Hentschel, U., and Hacker, J. (2002). Legionella pneumophila: an aquatic microbe goes astray. FEMS Microbiol. Rev. 26, 149–162. doi: 10.1111/j.1574-6976.2002.tb00607.x
Taylor, A. A., Tsuji, J. S., Garry, M. R., McArdle, M. E., Goodfellow, W. L., Adams, W. J., et al. (2020). Critical review of exposure and effects: implications for setting regulatory health criteria for ingested copper. Environ. Manage. 65, 131–159. doi: 10.1007/s00267-019-01234-y
Tchounwou, P. (2022). A tale of four Danish cities: Legionella pneumophila diversity in domestic hot water and spatial variations in disease incidence. Int. J. Environ. Res. Public. Health 1, 1–2. doi: 10.3390/ijerph2004010001
USEPA (1991). Lead and Copper Rule. 56 FR 26548. 40 CFR Part 141 Subpart I. Available online at: https://www.ecfr.gov/current/title-40/chapter-I/subchapter-D/part-141/subpart-I
USEPA (2005). Surface Water Treatment Rule (SWTR) Fact Sheet. EPA Region 8. Washington, DC. Available online at: https://www.epa.gov/sites/default/files/documents/SWTR_Fact_Sheet.pdf
USEPA (2009). Drinking Water Regulations and Contaminants. Washington, DC. Available online at: https://www.epa.gov/sdwa/drinking-water-regulations-and-contaminants
USEPA (2016). Basic Information about Lead in Drinking Water. USEPA. Washington, DC. Available online at: https://www.epa.gov/ground-water-and-drinking-water/basic-information-about-lead-drinking-water (accessed February 6, 2022).
USEPA (2022). USEPA National Primary Drinking Water Regulations. 40 CFR 141. Washington, DC. Available online at: https://www.epa.gov/ground-water-and-drinking-water/national-primary-drinking-water-regulations
Wilber, H. (2015). Optimize yourwater heater, optimize your energy savings. Available online at: https://www.usgbc.org/articles/optimize-your-water-heater-optimize-your-energy-savings
Yee, R. B., and Wadowsky, R. M. (1982). Multiplication of Legionella pneumophila in unsterilized tap water. Appl. Env. Microbiol. 43, 5. doi: 10.1128/aem.43.6.1330-1334.1982
Yu, V. L., and Stout, J. E. (2009). Rapid diagnostic testing for community-acquired pneumonia. Chest 136, 1618–1621. doi: 10.1378/chest.09-0939
Keywords: Legionella pnuemophila, stagnation, Leadership in Energy and Environmental Design (LEED), flushing, premise plumbing, storage tank, sustainability, opportunistic pathogens
Citation: Joshi S, Richard R, Levya C, Harrison JC, Saetta D, Sharma N, Crane L, Mushro N, Dieter L, Morgan GV, Heida A, Welco B, Boyer TH, Westerhoff P and Hamilton KA (2023) Pinpointing drivers of widespread colonization of Legionella pneumophila in a green building: Roles of water softener system, expansion tank, and reduced occupancy. Front. Water 4:966223. doi: 10.3389/frwa.2022.966223
Received: 10 June 2022; Accepted: 24 November 2022;
Published: 05 January 2023.
Edited by:
William Rhoads, Swiss Federal Institute of Aquatic Science and Technology, SwitzerlandReviewed by:
Marc Edwards, Virginia Tech, United StatesCaitlin Proctor, Purdue University, United States
Copyright © 2023 Joshi, Richard, Levya, Harrison, Saetta, Sharma, Crane, Mushro, Dieter, Morgan, Heida, Welco, Boyer, Westerhoff and Hamilton. This is an open-access article distributed under the terms of the Creative Commons Attribution License (CC BY). The use, distribution or reproduction in other forums is permitted, provided the original author(s) and the copyright owner(s) are credited and that the original publication in this journal is cited, in accordance with accepted academic practice. No use, distribution or reproduction is permitted which does not comply with these terms.
*Correspondence: Kerry A. Hamilton, a2VycnkuaGFtaWx0b25AYXN1LmVkdQ==