 Cyndi Vail Castro
 Clint Carney2
 Mariana Madruga de Brito
- 1Department of Civil and Environmental Engineering, University of Illinois at Urbana-Champaign, Urbana, IL, United States
- 2Department of Forest and Rangeland Stewardship, Colorado State University, Fort Collins, CO, United States
- 3Department of Urban and Environmental Sociology, Helmholtz Centre for Environmental Research - UFZ, Leipzig, Germany
Introduction: Integrated water management (IWM) involves a range of policies, actions, and organizational processes that go beyond traditional hydrology to consider multifaceted aspects of complex water resource systems. Due to its transdisciplinary nature, IWM comprises input from diverse stakeholders, each with unique perceptions, values, and experiences. However, stakeholders from differing backgrounds may disagree on best practices and collective paths forward. As such, successful IWM must address key governance principles (e.g., information flow, collective decision-making, and power relations) across social and institutional scales. Here, we sought to demonstrate how network structure impacts shared decision-making within IWM.
Methods: We explored a case study in Houston, Texas, USA, where decision-making stakeholders from various sectors and levels of governance engaged in a participatory modeling workshop to improve adoption of nature-based solutions (NBS) through IWM. The stakeholders used fuzzy cognitive mapping (FCM) to define an IWM model comprising multifaceted elements and their interrelationships, which influenced the adoption of NBS in Houston. We applied grounded theory and inductive reasoning to categorize tacit belief schemas regarding how stakeholders viewed themselves within the management system. We then used FCM-based modeling to explore how unique NBS policies would translate into more (or less) NBS adoption. Finally, we calculated specific network metrics (e.g., density, hierarchy, and centrality indices) to better understand the structure of human-water relations embedded within the IWM model. We compared the tacit assumptions about stakeholder roles in IWM against the quantitative degrees of influence and collectivism embedded within the stakeholder-defined model.
Results and discussion: Our findings revealed a mismatch between stakeholders' external belief statements about IWM and their internal assumptions through cognitive mapping and participatory modeling. The case study network was characterized by a limited degree of internal coordination (low density index), high democratic potential (low hierarchy index), and high-efficiency management opportunities (high centrality index), which transcended across socio-institutional scales. These findings contrasted with several of the belief schemas described by stakeholders during the group workshop. We describe how ongoing partnership with the stakeholders resulted in an opportunity for adaptive learning, where the NBS planning paradigm began to shift toward trans-scale collaboration aimed at high-leverage management opportunities. We emphasize how network analytics allowed us to better understand the extent to which key governance principles drove the behavior of the IWM model, which we leveraged to form deeper stakeholder partnerships by identifying hidden opportunities for governance transformation.
Introduction
Integrated water management involves a range of policies, actions, and organizational processes that go beyond traditional hydrology to consider multifaceted aspects of complex water resource systems. Within this context, water governance provides the overarching framework that guides the management of water resources. As Bakker and Morinville (2013) described, water governance is the vehicle “through which community interests are articulated, their input is incorporated, decisions are made and implemented, and decision-makers are held accountable in managing water resources.” As such, successful management must address key governance principles, including collective decision-making, information sharing, consensus building, and power relations (Pahl-Wostl et al., 2013; Al-Saidi, 2017).
Due to its transdisciplinary nature, integrated water management comprises input from diverse governmental and non-governmental stakeholders, each with unique perceptions, values, and experiences. Hence, collaboration across multiple sectors, levels of governance, and authority levels is necessary to facilitate information and resource flows and to effectively integrate aspects such as economic prosperity, environmental/ecosystem health, and social well-being into water resource management. However, the inequitable representation of stakeholders can hinder the success of integrated water initiatives (e.g., Green et al., 2013; Bradford et al., 2017; Wamsler et al., 2020). The governance of such systems is challenging due to the many tradeoffs that must be negotiated, which can trigger conflict, stall progress, or deplete resources. Indeed, top-down, centralized management is poorly suited for overcoming such tradeoffs (Pahl-Wostl et al., 2013). Instead, opportunities for joint action can improve governance potential by facilitating the diffusion of knowledge and resources in decision-making spaces (Bodin and Crona, 2009). Moreover, collaborative governance has been shown to improve communication, reciprocity, and trust among different stakeholder types (Olsson et al., 2004; Hahn et al., 2006), thereby balancing some of the complex tradeoffs associated with integrated water management.
Despite the potential advantages, collaborative decision-making may fail and, conversely, hinder the desired policy objective(s) due to disproportionate levels of influence embedded within the management system (e.g., Lieberman, 2011; McGinnis, 2013; Baldwin et al., 2018). To address this challenge, principles of the complex adaptive system (CAS) theory can be applied to integrated water management (e.g., Geldof, 1995; Rammel et al., 2007; Giacomoni et al., 2013). CAS theory provides a framework for understanding how natural, social, and infrastructural elements interact in a nonlinear fashion. In CAS, the outcome of any one variable depends on the actions and dynamic behaviors of all other variables linked within the system. This creates a highly decentralized control structure, resulting in asymmetries in the ability of stakeholders to influence systemic change. These asymmetries may, thus, either promote or hinder effective problem-solving, depending on the structure of the integrated management system (da Silveira and Richards, 2013; Turnhout et al., 2020).
Different governance approaches can have varying impacts on integrated water management. For example, top-down governance may result in a mismatch between the collective wishes of the group and the chosen policy initiative(s), leading to potential conflict. The extent of this mismatch depends on the power dynamics within the system and the willingness of influential stakeholders to accommodate dissenting opinions (Lieberman, 2011; Ricart and Rico-Amorós, 2022). Conversely, top-down approaches may be beneficial for managing common-pool resources. In this case, strong governance can be used to disperse resources among disparate parties, thereby reducing potential overuse and/or depletion (e.g., Dinar et al., 1997; Schlüter and Pahl-Wostl, 2007). Thus, it is important to consider not only the collaborative potential but also the distribution of power (i.e., influence) within complex management systems, as this can impact the intended policy objective(s).
Within the growing literature on natural resource governance, network analysis is emerging as a useful technique for mapping sets of decision-making stakeholders and identifying their connections with each other and with the systems they seek to shape (Bodin and Crona, 2009). For instance, network analysis has been used to identify the capacity of water managers to overcome coordination challenges through strategic interventions and improved collaboration across multiple decision-making scales, social sectors, and levels of governance (Stein et al., 2011; Pahl-Wostl et al., 2020). By using statistical tools to measure linkages between a plurality of system variables (e.g., Knoke et al., 1996), network analysis can provide insights regarding the levels of influence contained within network elements and how such influence spreads among key variables. These insights can help define responsibility in complex decision-making processes and develop a set of common rules regarding how to shape the system through strategic policy intervention, thereby limiting conflict and promoting democratic collectivism.
Network analysis is an application of graph theory (Euler, 1953) used to define and analyze network structures and the interactions of their components (Newman, 2003; Majeed and Rauf, 2020). Using graphs (or networks), researchers can deduce insights about complex systems from a topological perspective by examining the proximity of network components to one another. In contrast to system dynamics, which is used to model the evolution of a system over time, network analysis focuses on mapping the complexity of a system's internal structure (Oliva, 2004). Networks represent system components as a structural pattern of nodes (vertices) and edges (links) to depict critical relationships between disparate elements (Omidshafiei et al., 2020). Nodes can represent attributes of biophysical processes or systems, as well as human or social features, such as institutions, policies, or individual perceptions. Edges represent the interdependence between each pair of network nodes and can be defined by binary or weighted values describing the strength of their connection.
Networks have been used extensively across the physical and social sciences (Barabási, 2013). In ecology, network analysis has been used to investigate habitat connectivity (Minor and Urban, 2008; Zetterberg et al., 2010; Dilts et al., 2016) and to explore the collective experiences of decision-making stakeholders (Tan and Özesmi, 2006; Kontogianni et al., 2012; Misthos et al., 2017). Network analysis has been used in water resources engineering to optimize water distribution and sewer systems (Pagano et al., 2019; Meijer et al., 2021) and to map the evolution of water trade networks (Oliva, 2004; Suweis et al., 2011; Dalin et al., 2012). Networks have also been used to understand connectivity among physical components of the hydrologic cycle (Sivakumar, 2015). In the social and political sciences, connective structure has been used to better understand conflict resolution (Hamouda et al., 2006; He, 2019; Amini et al., 2021) and social interactions in decision-making spaces (McAllister et al., 2014; Turnbull et al., 2018; Blacketer et al., 2022). In natural resources governance, network analysis has been used to examine power dynamics (Stein et al., 2011; Suweis et al., 2011; Nabiafjadi et al., 2021) and collaborative capacity (Ogada et al., 2017; Pahl-Wostl et al., 2020) across social and institutional scales. Within socio-hydrology, network analysis is gaining traction as a promising tool for mapping human-water systems through the lens of node-node connectivity (Bertassello et al., 2021; Frota et al., 2021; Es'haghi et al., 2022). Such studies underscore the importance of network analysis as a tool for understanding complex systems, whereby researchers may collaborate with diverse stakeholders to capture the interdependence between the humans making the decisions and the physical processes they seek to shape.
In this study, we demonstrate how network analysis can be used to gain insights into the structure of complex decision-making systems. More specifically, we investigate the network structure encoded within the collective mental map of relevant stakeholders involved in integrated water management to understand group power dynamics and identify opportunities for effective water governance. We employ metrics such as network density and centralization to uncover valuable information about the behavior of human-nature systems and how understanding network structure can reveal opportunities for effective water governance. Our work builds on Castro (2022a) study, where fuzzy cognitive modeling (FCM) was used to construct mental models that depicted tradeoffs between competing objectives in managing nature-based solutions (NBS). Here, we illustrate how the management structure impacts key water governance principles, including collective decision-making, information sharing, consensus building, and power relations. We conclude by discussing how network analytics can support integrated water management by assessing levels of collaboration and influence embedded within the decision-making system.
Illustrative case study
Here, we build upon an existing study by Castro (2022a) regarding the complexities of integrated water management, where a participatory modeling workshop was used to elicit an FCM model of interacting factors associated with the adoption of NBS in Houston, Texas, USA. Causal thinking was used to capture how the local socio-institutional context influences NBS decisions. The workshop resulted in a graphical representation of system variables and feedbacks (i.e., fuzzy cognitive map) according to the shared experiences of the stakeholder group. This exercise promoted dialogue across varying sectors and levels of governance to develop a robust, shared understanding of how integrated water management is structured in Houston.
In this section, we provide a brief background to the case study workshop and summarize how the FCM was derived in Castro (2022a). We extend the aforementioned study by highlighting general stakeholder beliefs about how the management system functions within the local context. We use FCM-based scenarios to explore how unique NBS policies would translate into more (or less) NBS adoption, according to the underlying dynamics of the management system. Next, we discuss how network analytics can be used to identify levels of collaboration and influence in integrated water management. Here, we detail the primary network metrics used in the case study (e.g., density, hierarchy, centrality). Finally, we convert the FCM into a node-link network and assess the structure of human-water relations embedded within the graph. In the Discussion section, we consider how these unique case study characteristics (stakeholder beliefs, policy efficacy, network structure) combine to reveal important perceptions and opportunities in NBS planning.
Case study background
As climate change and urbanization have challenged traditional stormwater management, communities are increasingly using NBS within water resource planning (Slater and Villarini, 2016; Hettiarachchi et al., 2018; Marsooli et al., 2019). NBS approaches utilize natural design characteristics to slow the movement of runoff and increase infiltration capacitance for stormwater abatement and pollution control. By increasing the amount of green space in an urban environment, NBS have been associated with multiple co-benefits, including improved air quality, urban heat island abatement, recreational opportunities, social capital, physical health, and biodiversity (Cohen-Shacham et al., 2016; Nesshöver et al., 2017). Despite these benefits, NBS uptake has been limited in many communities (Slater and Villarini, 2016). This is due, in part, to complex social and institutional barriers (e.g., public education, financial incentives, institutional fragmentation, land acquisition/planning) which hinder the translation of NBS interest into mainstream practice (Frantzeskaki et al., 2019; Raška et al., 2022).
Houston was selected as an ideal case study due to its long-standing challenges related to NBS and socio-environmental challenges, including urban flooding, poor air and water quality, communal health, and heat island effects (Hopkins et al., 2022). Despite increasing public interest in green space, Houston remains one of the most impervious cities in the United States (Nowak and Greenfield, 2012), with a low uptake of urban greening initiatives (Young, 2011). Local governance is driven by socio-political forces that promote rapid urban growth (e.g., powerful business elites, pro-development economics, lack of zoning) while limiting public regulation and city-wide planning. Consequently, Houston development has been characterized by a laissez-faire philosophy that has arguably exacerbated socio-environmental stresses, particularly in marginalized communities (Vojnovic, 2003).
Stakeholder workshop
To better understand the role of local governance on integrated water management, our case study approached NBS planning as a complex system involving social constructs interlinked with hydro-environmental considerations across a variety of social, institutional, and governmental scales. Many management systems are multi-scalar in nature, from grassroots organizations to regional decision-makers, which necessitate democratic collaboration and knowledge-sharing for effective governance (Leck and Simon, 2013). As such, the stakeholders selected for this study encompassed the cross-scale nature of integrated water management, extending beyond traditional administrative and geographical boundaries (Gerlak, 2014). As shown in Figure 1, a total of 11 stakeholders from various social and institutional sectors participated in the workshop, representing entities commonly impacted by (and involved in) Houston-area urban greening.
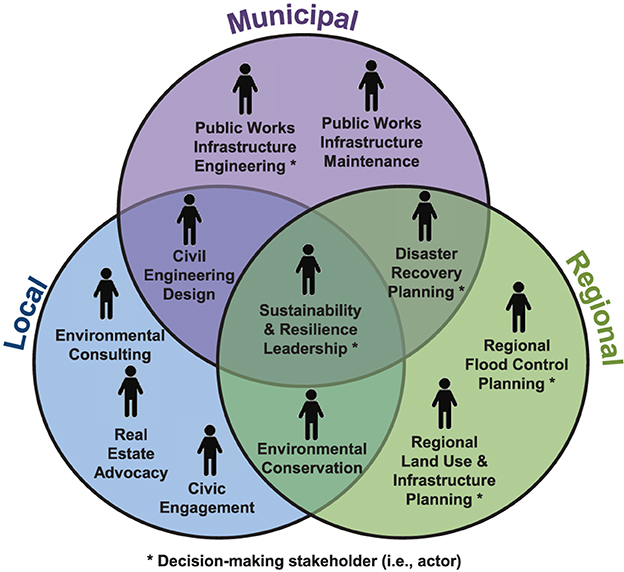
Figure 1. Cohort of stakeholders engaged in the case study workshop, categorized into three primary scales: local (e.g., neighborhood-scale activists), municipal (city-scale planners), and regional (e.g., county-scale managers). The “*” symbol indicates decision-making stakeholders (i.e., actors) with authority to act decisively within the system to influence NBS development.
Deriving a fuzzy cognitive map
The workshop in Castro (2022a) was designed to reveal key perceptions of NBS challenges, management opportunities, and their inter-relationships, including how stakeholders view themselves as agents of change. The workshop was used to derive a model of social and physical variables describing NBS management through the lens of FCM (i.e., fuzzy cognitive modeling). FCM is a common approach for mapping complex governance systems and projecting their future response to policy interventions (e.g., Giordano et al., 2005; Kafetzis et al., 2010; Kaleeswari et al., 2018; Schramm et al., 2020). In FCM, decision-making stakeholders elicit a composite illustration of the system they seek to shape using cognitive maps, which are schematic representations of the world as perceived by humans (Ahmad and Azman Ali, 2003). Cognitive maps provide a means for capturing the subjective knowledge of individuals, which fosters an awareness of internal assumptions regarding how the system operates. In FCM, variables are interconnected by causal feedbacks, where a change in one variable triggers a similar magnitude of change in all causally interrelated variables (Axelrod, 1976; Puccia and Levins, 1991; Kontogianni et al., 2012; Gray et al., 2014). In directed fuzzy maps, causal feedbacks are defined by polarity, where a positive (“+”) sign indicates causality between variables moving in the same direction, and a negative (“–”) sign indicates causality between variables moving in opposing directions.
In integrated water management, cognitive maps often combine abstract elements (e.g., human agency, cultural norms and values) and physical constructs (e.g., landscape characteristics, ecosystem processes) with feedbacks derived from tacit (rather than empirical) knowledge. In such instances, FCM provides a useful means for defining the structure of mental maps where detailed scientific datasets are not available, but where we have the local knowledge of people who have co-evolved and adapted with the systems they seek to shape (Özesmi and Özesmi, 2004). In seeking to utilize stakeholder knowledge, we must be able to represent varying levels of experience through some common construct. In FCM, imprecise relationships are identified using linguistic statements of relational strength (e.g., low, medium, high) and translated into semi-quantitative values according to fuzzy logic (e.g., low = 0, high = 1) (Kosko, 1986; Gray et al., 2014).
The FCM case study workshop was facilitated by guiding the stakeholder group through a series of interactive scripts (e.g., Hovmand et al., 2011) to help participants identify and understand causality within the local NBS management system. Stakeholders were asked to discuss various challenges, opportunities, and exogenous factors associated with NBS uptake throughout greater-Houston. Key themes from this discussion were documented in real-time and used to guide the development of cause-effect relationships within regional NBS management. During the workshop, the stakeholders were asked to identify a comprehensive set of variables involved in NBS adoption according to the group's collective experiences. The stakeholders were then asked to identify all causal connections between the variables and to define their general strengths, which triggered a series of discussions regarding the underlying dynamics of the management system. As the stakeholders communicated, the workshop facilitator drew system variables (nodes) and their weighted relationships (links) on a shared virtual whiteboard, which was refined in real-time to capture the group consensus. Areas of uncertainty and conflict were also noted by the facilitator. The feedbacks were weighted using fuzzy logic: low strength (±0.25), medium strength (±0.50), and high strength (±0.75).
The diagram was reviewed for accuracy by local NBS policymakers who were not involved in the workshop, and minor modifications were suggested. The map was optimized accordingly and shared with all workshop participants for final input and validation. The resulting FCM model contained 19 causal variables connected by 37 causal links, as shown in Figure 2. Of the 19 nodes in the network, the stakeholders identified 9 as management opportunities (i.e., within the scope of stakeholder influence) for increasing the adoption of NBS. Other dimensions represented within the map included social challenges and exogenous system variables, which were outside the scope of direct stakeholder influence.
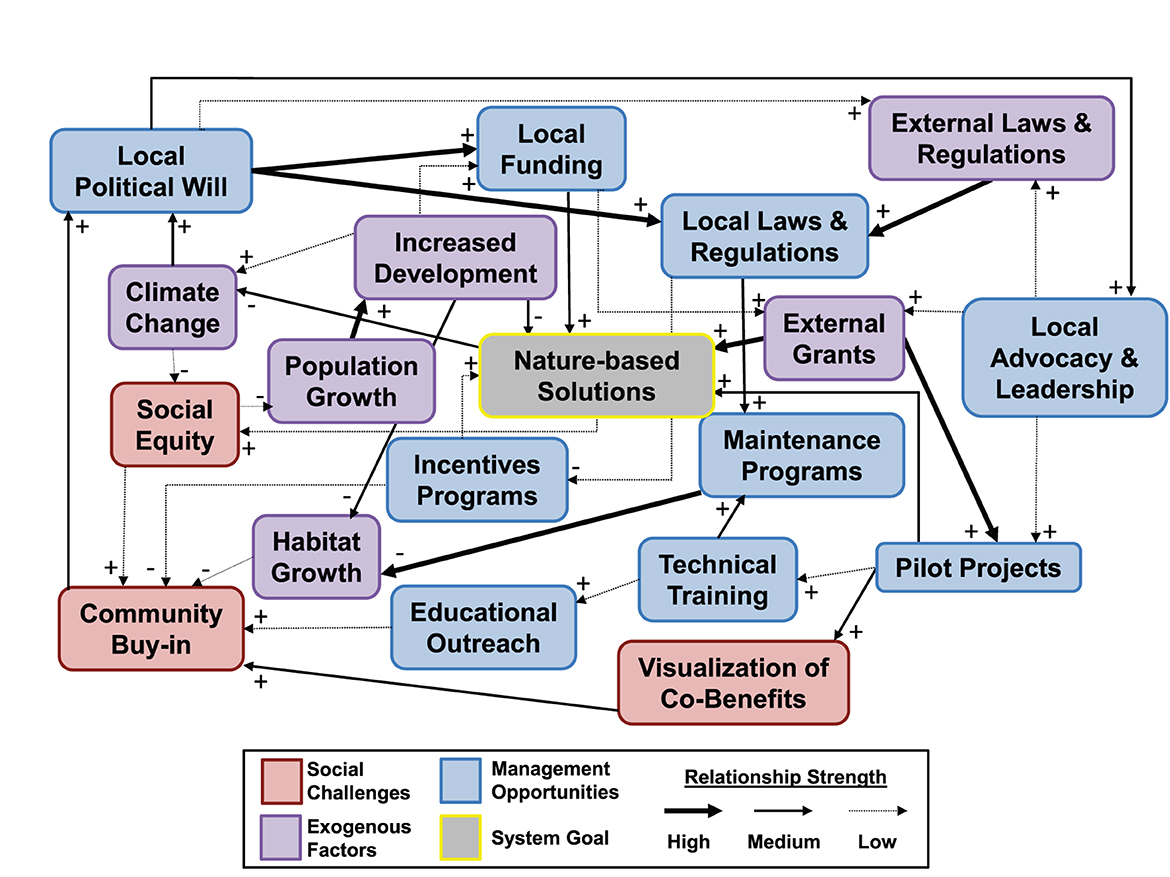
Figure 2. Composite fuzzy cognitive mapping (FCM) model, derived from the stakeholder workshop session. The model describes key variables which can influence the adoption of NBS in Houston and their interrelationships. Source: adapted from Castro (2022a).
Identifying embedded belief schemas
During the case study workshop, we observed that stakeholders had unique belief schemas about their role within the NBS management system. Belief schemas are used here to describe general ways of thinking about the universe and the nature of “self” within it. Such analogical thinking reveals tacit ideas about culture, context, and values, which may be difficult to characterize through formal logic. In this study, we categorized these belief schemas using grounded theory and an inductive approach. Later, in Table 1, we summarize some of the group-thinking nuances which were observed during the workshop. We noticed a general tendency for “more powerful” stakeholders (as perceived by rank/title) to drive formal topics of discussion (i.e., jurisdictional authority, institutional collaboration), while “less powerful” stakeholders tended to emphasize socio-environmental factors (i.e., climate change, social welfare). Throughout the workshop, we observed a mixture of silo mentality (individualism) and eagerness to collaborate (collectivism) during different periods of the exercise. In the Discussion section, we compare these tacit assumptions about stakeholder roles within the system against quantitative degrees of influence and collectivism, as revealed by network analysis and FCM modeling.
Table 1. Summary of belief schemas observed during the case study workshop.
FCM-based scenario analysis
To date, participatory FCMs have been used for “what-if” scenario building to estimate many possible futures of the system by altering one (or more) constituent variables (e.g., Jetter and Schweinfort, 2011; Mourhir et al., 2015; Singh and Chudasama, 2020). In this study, FCM-based scenario analysis was used to better understand how a change in local policy would impact NBS adoption. The FCM model in Figure 2 was simulated by “activating” unique management nodes and assessing the amount of relative change in all system components. FCM-based scenarios quantify dynamic interactions between system components using neural processing and formalized activation rules, which iterate over discrete steps until the system converges to equilibrium (Nápoles et al., 2017). The activation rule used here is based on Kosko (1986), defined by
where is the value of variable vi at step (t+1), is the value of variable vi at step t, is the value of variable vj at step t, wij is the weight of the edge relationship between variable vi and causally-connected variable vj, and f is a threshold function used to normalize values at each time-step (Gray et al., 2015).
A total of nine management scenarios (i.e., policy options) were examined. For each scenario, the edge relationships (wij) were weighted as previously defined [i.e., low strength (±0.25, 25%), medium strength (±0.50, 50%), high strength (±0.75, 75%)]. The activated node was “clamped” to a maximum strength of +1.00 (i.e., 100%), which represents a continually high state throughout the simulation (Gray et al., 2015). All other nodes within the system had an initial value of 0 (i.e., no change at the start of the simulation). After each model stabilized at step t = T, the changes in end-state values for all system variables were graphed as relative percentages (i.e., ). The end-state values were obtained using a standard application of Mental Modeler (mentalmodeler.org), a web-based, entry-level platform for graphing and simulating FCMs (Gray et al., 2013).
The importance of network structure
To understand how well the network facilitates transmission of stakeholders' collective ideas and resources throughout the system and their propensity for shared decision-making, we analyzed the network structure of the FCM in Figure 2 using properties of density and centralization.
Network density
Density describes the activity level among network nodes according to the richness of internal coordination. The extent of node-node communication between network links is defined as the proportion of overall connective potential (Sandström, 2008). A high density value means the network exhibits strong levels of integration, where the activity of each node depends mainly upon the joint activities of all other nodes within the system. In management networks, a large degree of density may lead to greater opportunities for group communication and adaptation through democratic pathways. When considering the application to water management, density helps us understand how well the network facilitates transmission of stakeholders' collective ideas and resources throughout the system and their propensity for shared decision-making. As demonstrated in Figure 3A, a low density network has few ties between nodes, thereby limiting the possibilities for collective action and communication among disparate stakeholders. Conversely, a high density network contains many connections between nodal elements (Figure 3B), thereby increasing collaborative opportunities and facilitating the potential for pooled resource governance.
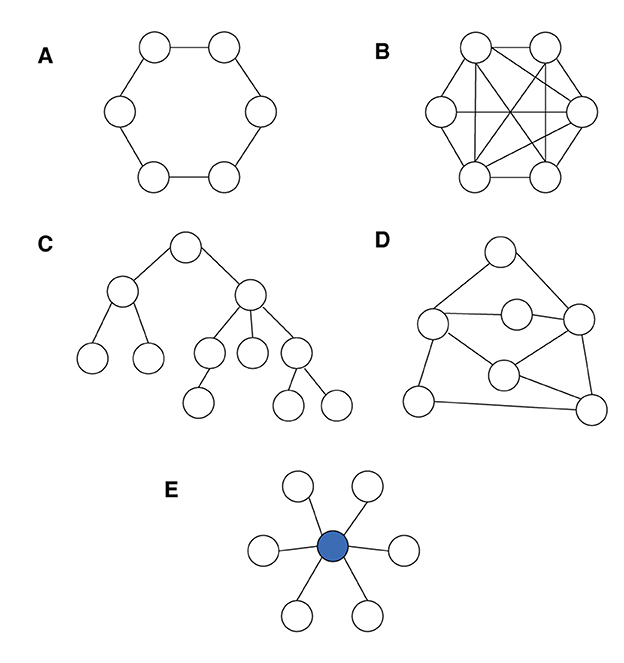
Figure 3. Schematic of network topologies representing: (A) low density of relations (low density index); (B) high density of relations (high density index); (C) low levels of cohesiveness (high hierarchy index); (D) high levels of cohesiveness (low hierarchy index); (E) degree of centrality, where the blue (central) node exhibits the strongest level of influence (high centrality index).
Network centralization
Network centralization describes the extent to which activity levels (i.e., management processes) are dominated by a small number of nodes (i.e., decision-makers and/or physical system variables) (Sandström, 2008). Assessing network centralization helps us better understand the proportion and types of nodes with causal influence in the system (Özesmi and Özesmi, 2004). Centralization may be described in two ways: (1) globally, by the degree of cohesion within the network (aka hierarchy index), or (2) locally, by the level of influence within individual nodes (aka centrality index). Overall cohesiveness describes the extent to which the network “groups together” rather than being divided into distinguishable subgroups (Bodin and Crona, 2009). Cohesion can also be portrayed by the magnitude of stakeholders who, if removed from the network, would disconnect the overall group (Moody and White, 2003). As demonstrated in Figure 3C, removal of the single top node would divide the network into two separate subgroups with no connective pathways between them. Many governance structures contain a low degree of cohesion (and thus, a high degree of hierarchy), where system behavior is governed primarily by top-down influences. Such networks limit the potential for collective action, particularly when dominant system stakeholders are unable (or unwilling) to engage with stakeholders at lower levels. Conversely, a bottom-up network, as shown in Figure 3D, presents more opportunity for collaboration between nodes, thereby facilitating a high degree of information exchange among multiple stakeholder types (i.e., levels of governance, industry sectors, or social scales).
Local centrality is used to rank the influence of individual nodes on all other variables and, thus, on the overall network structure. Dominant nodes influence the processes and patterns observed in group decision-making, which is particularly important when the group comprises agents from disparate backgrounds and different, potentially conflicting, views of effective management decisions. Therefore, it is important to identify local centrality to understand how units are ranked in relation to one another. As shown in Figure 3E, the most central node (in blue) is positioned with the ability to influence all other nodes within the network and thus contains a high level of influence on the overall system behavior. Management nodes with high centrality tend to influence flows of information (and resources) more so than others, thereby serving as high-leverage points for systemic change and providing a bridge between otherwise disconnected stakeholders and/or physical system variables (Bodin and Crona, 2009).
The concepts of density and local/global centralization are complementary measurements that refer to different but related components of the network's connective structure. This connectivity underpins the function (and effectiveness) of different management processes within the decision-making system. By analyzing the relationship between structure and process, we can better understand management complexities and identify interactions that may enhance (or inhibit) governance outcomes. The specific structural metrics used in this study (density index, hierarchy index, and centrality index) are defined in the following sections.
Key structural metrics
Density index
The density index (aka clustering coefficient) describes how connected or fragmented variables are within a node-link network. Through a topological lens, this metric describes the closeness of specific nodes and edges relative to the whole network (Heckmann et al., 2015). It is defined as the number of direct (actual) connections between nodes divided by the total number of possible connections within the network. When applying the density index to integrated water management, this metric elicits stakeholder perceptions of overall collaborative potential. A high density index suggests that the network contains many pathways for communication and collective action. The density index is defined by
where D is the density index, C denotes the total number of connections within the system, and N denotes the total number of variables (Koskoff et al., 1986). [Note: In systems where all variables can have a causal effect on themselves, the denominator in Equation 2 is represented by N2.] A completely linked graph would have D = 1, where all points are connected to all other possible points. A completely unlinked graph would be described by D = 0 (Özesmi and Özesmi, 2004).
Hierarchy index
The hierarchy index describes the tendency of network nodes to fall within well-defined levels connected in a centralized fashion. This index reveals how systematic pathways are organized for change according to inherent variable strengths and their connectivity with other network nodes. Like the density index, hierarchy can help identify the potential for stakeholder collaboration in a management network (Mourhir, 2021). A low hierarchy index suggests the network is democratic, with strong pathways for integrated participatory management. A high hierarchy index suggests the network is hierarchical, where systematic change is only possible through top-down solutions. The hierarchy index is expressed by
where h is the hierarchy index, N defines the total number of system variables, and od(vi) is the outdegree strength of each variable, i, in influencing other system variables in an outward direction (Weir and MacDonald, 1984). The outdegree is calculated as the cumulative strength of all connections () exiting each variable, such that . A fully hierarchical network is depicted when h = 1, and a completely democratic network corresponds to h = 0 (Özesmi and Özesmi, 2004). A network can exhibit a high level of hierarchy despite few central connections, so long as the connections carry relatively large weights (Kosko, 1986).
Centrality index
The centrality index describes how connected a variable is to other variables in the network. This index is calculated for all variables in the network and used to rank the comparative influence of nodal elements on system behavior. Centrality is characterized according to the cumulative strengths of all connections entering and exiting a variable. The centrality index is defined by
where ci is the centrality index for variable i, od(vi) and id(vi) define the outdegree and indegree strength of each variable (i.e., the cumulative strength of connections pointing outward or inward from each variable node), such that , , and is the absolute value of all connection weights exiting variable i and connecting to variable j (Özesmi and Özesmi, 2004).
The centrality index was calculated for each node to better understand the influence of individual variables within the overall network. The connective strengths associated with each node (vi) were defined by indegree [cumulative strength of connections pointing toward a node, id(vi)] and outdegree [cumulative strength of connections pointing away from a node, od(vi)].
Converting the FCM to a network
To analyze the structure of the stakeholder-defined management system, we mapped a simple node-link graph (network) from the composite FCM model. Each FCM variable was converted into a single network node, and each FCM connection was converted into a weighted network link. As shown in Figure 4, the network represents collective knowledge about NBS management in Houston by providing a visual illustration of how the network concepts (nodes) are connected via directed feedbacks (links). From Figure 4B, we computed key network metrics (i.e., density index, hierarchy index, and centrality index; Equations 2–4) and validated them using the Mental Modeler FCM software (Gray et al., 2013). The Mental Modeler platform contains a set of built-in algorithms for identifying fundamental characteristics of the network structure (e.g., node-link connectivity, in/outdegree strength, variable type), which were used to estimate the density, hierarchy, and centrality indices.
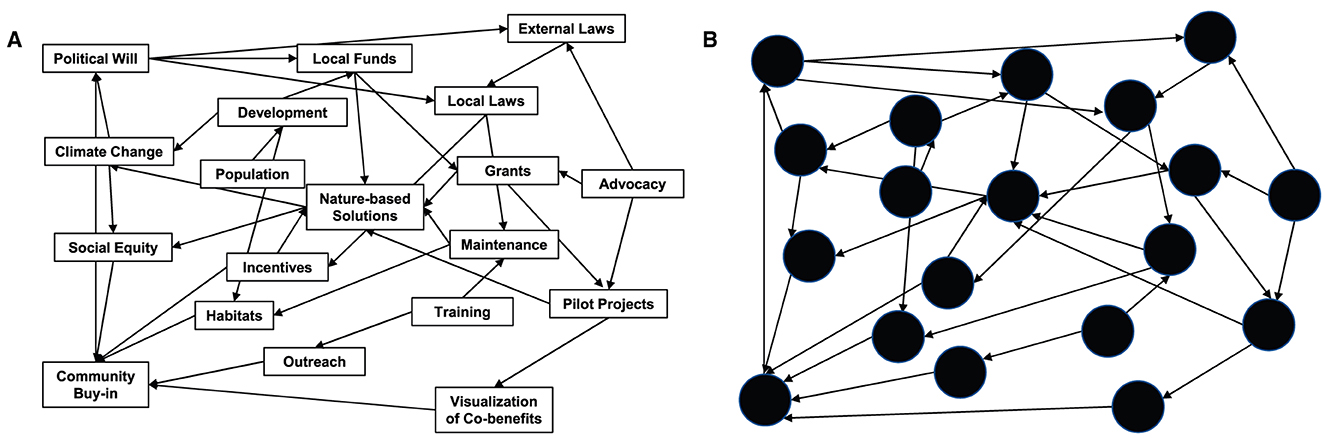
Figure 4. Schematic of (A) composite fuzzy cognitive map describing causality of NBS management; (B) topology of nodes and links describing connective structure in the network.
Results
Embedded stakeholder beliefs
When a diverse group of actors engage in cognitive mapping, the results may vary widely depending on embedded stakeholder beliefs of system complexity and how variables interact (Levy et al., 2018). In Table 1, we summarize the stakeholder beliefs observed during the case study workshop, which we use to identify dominant schemas that may be leveraged and transitioned toward a more effective management structure.
Effectiveness of management strategies
We demonstrate in Figure 5 how different management strategies rank in comparison to one another for shifting the end-goal variable (i.e., NBS adoption) in a positive direction. The relative magnitudes in Figure 5 reveal the efficacy of unique policy actions in the case study model. Since the model is dynamic, rather than linear, a shift in one variable does not necessarily trigger a proportional shift in all other variables throughout the system. For example, management nodes for “Local Funding” (LF) and “Advocacy and Leadership” (AL) are located similar graphical distances from the NBS node in Figure 2 (i.e., both LF and AL pass through EG with a positive relationship strength of +0.25, and EG connects directly to NBS with a positive relational strength of +0.75). However, we can expect a much stronger state shift toward NBS when activating node LF (Si_LF=64%) in comparison to AL (Si_AL=39%) due to their respective locations within the overall management system and the behaviors of all causally-connected variables throughout the FCM simulation. Similarly, we may note a weaker propensity for “Educational Outreach” (EO) to achieve the intended management goal (Si_EO = 8%), due likely to the inability of EO to trigger a strong state shift in any of the other system variables which influence NBS (i.e., short blue bars within the positive region of Figure 5, top-left graph). The visualization provided by Figure 5 can be used to quickly assess the effectiveness of management strategies toward the intended end-goal using semi-quantitative metrics of connectivity, as defined by the stakeholders themselves. These results allow us identify paradoxes between the stakeholders' internal assumptions (as defined by the FCM model) and their external belief statements (as summarized in Table 1).
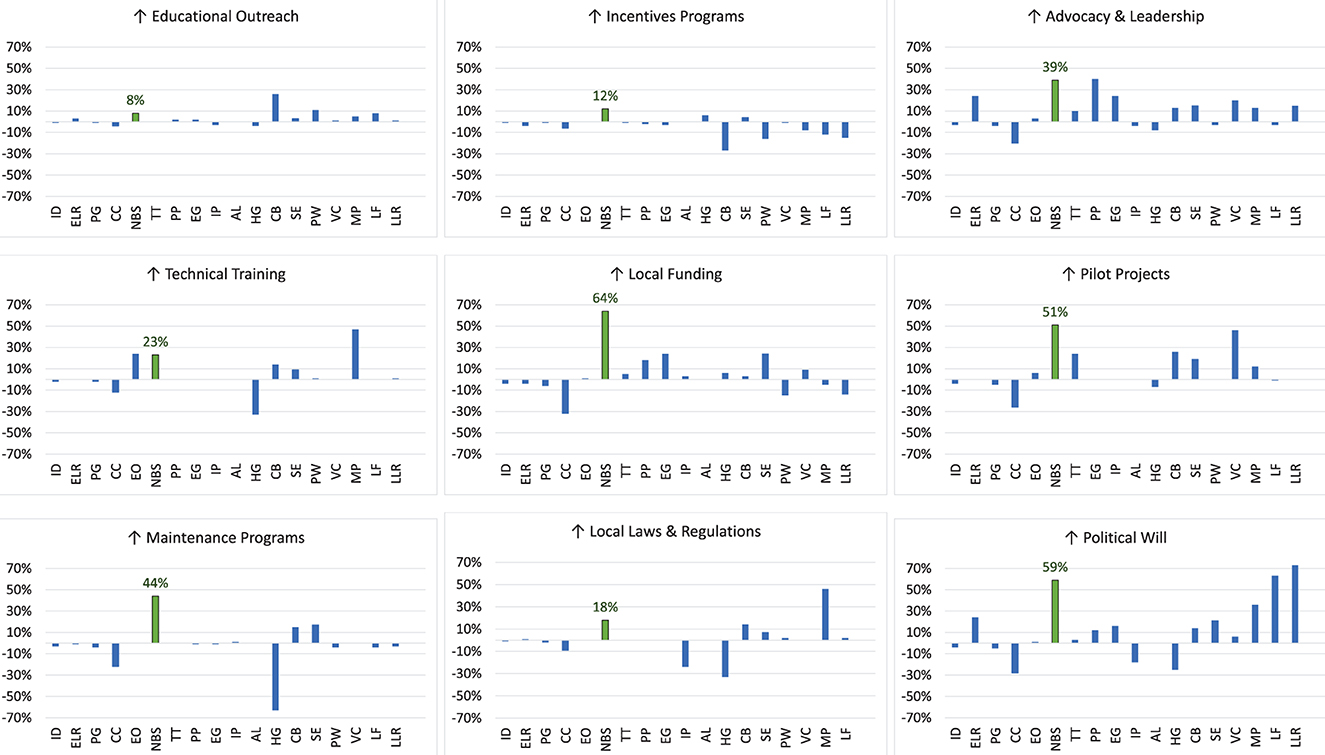
Figure 5. FCM-based scenario outputs, where unique management variables (shown in each chart title) were activated, and changes in the end-state value for all system variables were graphed as a relative percentage (ΔSi). The shifts in magnitude for nature-based solutions (i.e., the goal variable for this system) are shaded in green (ΔSi_NBS). ID, Increased Development; ELR, External Laws and Regulations; PG, Population Growth; CC, Climate Change; EO, Educational Outreach; NBS, Nature-based Solutions; TT, Technical Training; PP, Pilot Projects; EG, External Grants; IP, Incentives Programs; AL, Advocacy and Leadership; HG, Habitat Growth; CB, Community Buy-in; SE, Social Equity; PW, Political Will; VC, Visualization of Co-benefits; MP, Maintenance Programs; LF, Local Funding; LLR, Local Laws and Regulations.
Primary network characteristics
The primary network composition is defined by the index characteristics in Equations 2–4, which are summarized in Table 2. The case study network was characterized by limited internal coordination (low density), high democratic potential (low hierarchy) and high-efficiency management nodes (high centrality index) which transcended across socio-institutional scales. In applying Equation 2 to the management network map, the case study group described a largely unconnected network with a low density index (D = 0.102). This indicates that stakeholders observed only 10.2% of all potential network connections in NBS management practice. Since density describes the proportion of all possible connections present within the map, the causal relationships between stakeholders and the social/physical constructs of the system were described with a thin level of interconnectivity. This low density index suggests that the stakeholder group perceived limited pathways for collaboration and a system with many functions outside their control. While the density index reflects the overall proportion of ties (connections) present within the network, the hierarchy index extends a step further to consider the actual weights of connectivity exiting each network node. Per Equation 3, the low hierarchy index (H = 0.019) suggests that the stakeholders described a largely decentralized network with many collaborative pathways across socio-institutional scales.
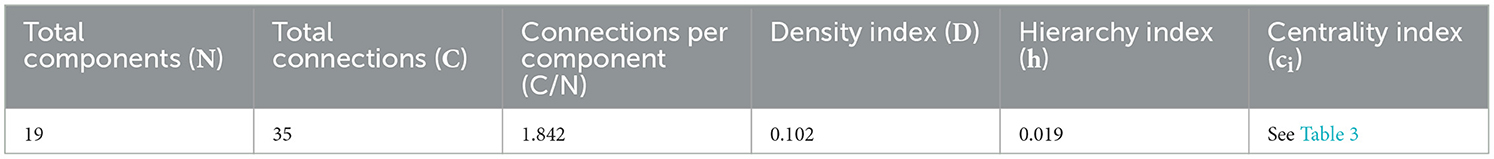
Table 2. Summary of key characteristics in the network structure.
The centrality index for each node is summarized in Table 3. The management nodes were further defined by their scale(s) of socio-institutional influence (L—local, M—municipal, R—regional), as perceived by the stakeholder group, in order to explore the balance of power (i.e., influence) and collaborative potential within the management network. For reference, the relative efficiencies of all management nodes (per the FCM-based scenario analysis) are also noted in the table.
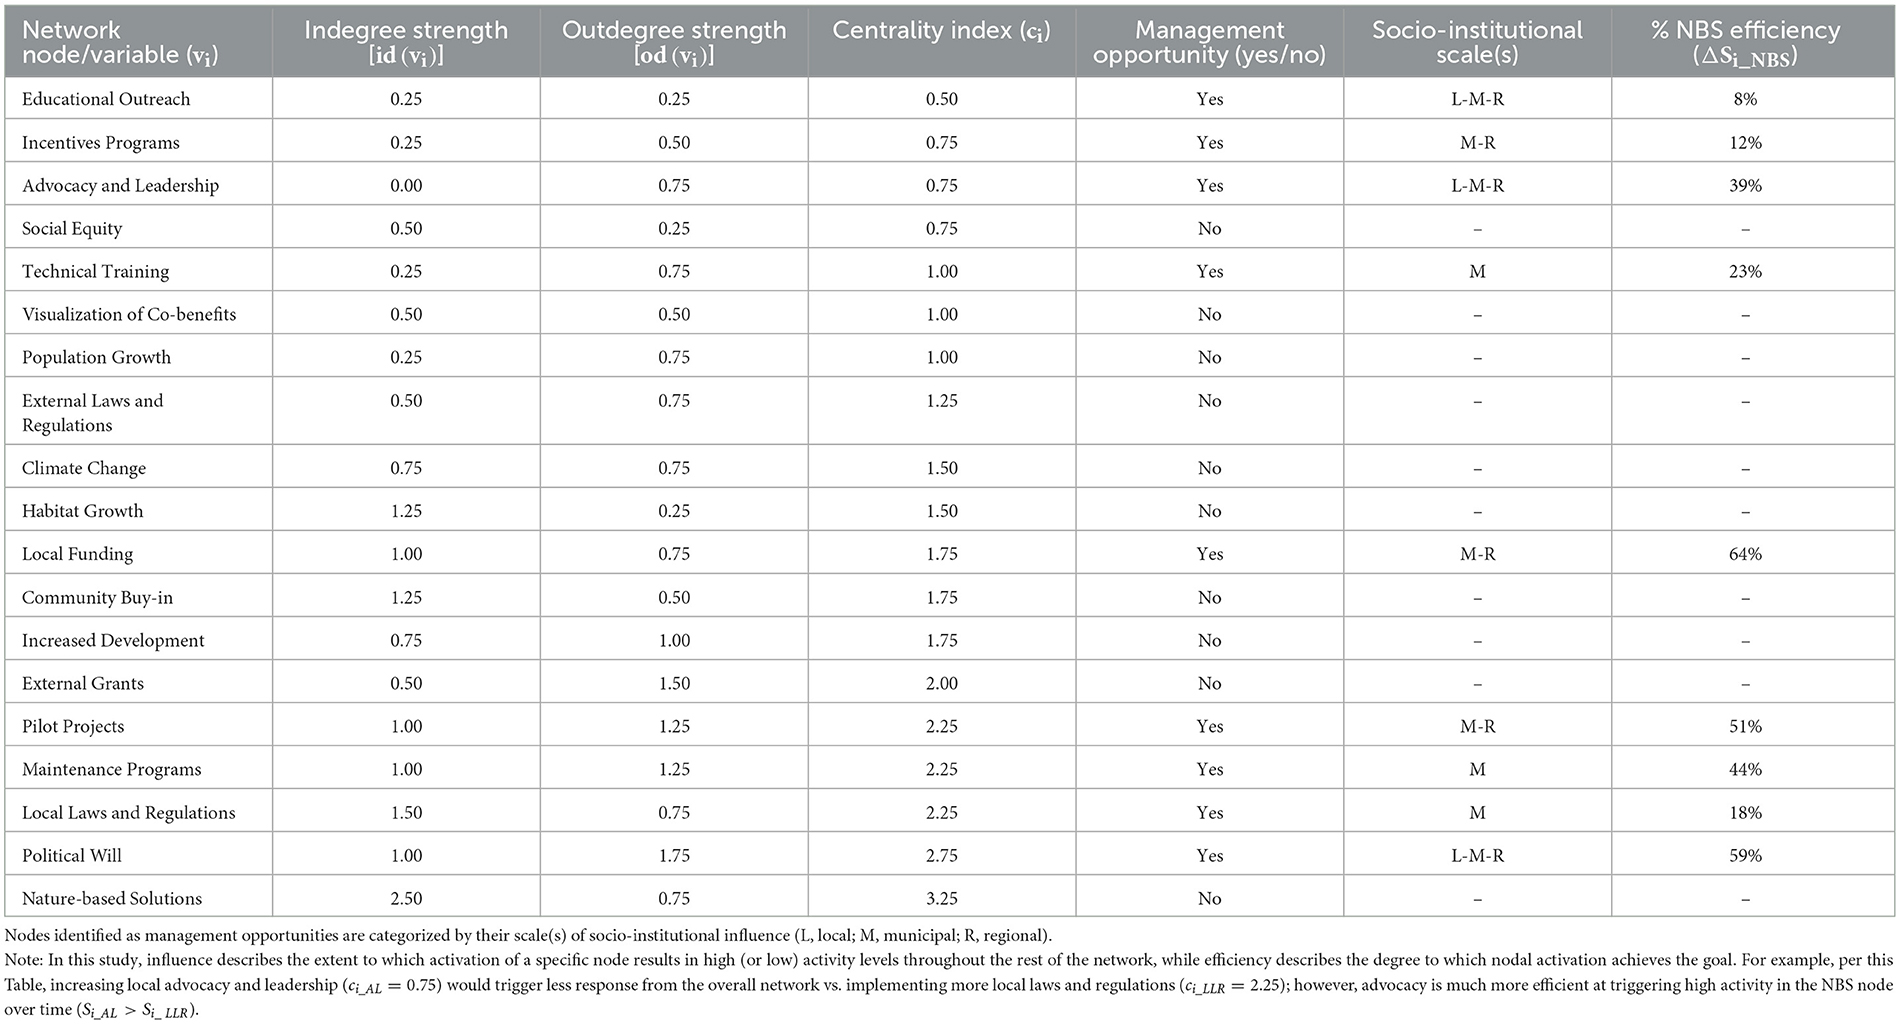
Table 3. Centrality characteristics for 19 nodes identified within the case study network.
Discussion
Collaborative potential
Cohesion within the network, as described by network density, may influence the willingness and ability of stakeholders to share knowledge and work with one another. The density of relations provides insight into the extent of possible joint actions available between differing managing stakeholders and across related sectors. When a greater number of ties exist, the potential for collaborative engagements is improved, which could aid in reducing resource conflicts by facilitating common pool opportunities. Indeed, the literature on natural resources governance supports a positive relationship between network density and joint action when integrated management teams work together to foster an increase in relations (links) among multi-disciplinary elements (nodes) (Bodin and Crona, 2009). Here, we observed a low density index, which suggests the stakeholder group perceived limited pathways for collaboration and a system with many functions outside their control. For the participatory researcher, this insight allows continued engagement with the group to elicit deeper levels of trans-scale collaboration. Such engagement aids adaptive governance, which applies collaborative and iterative learning to foster self-organization around common goals (Huitema et al., 2009) and is the most common approach for capacitance building in the water literature (Jiménez et al., 2020).
Indeed, through ongoing engagement with this stakeholder group, Castro (2022b) demonstrated a shift in NBS management toward improved collective action. Through a series of informal discussions with local policymakers, the FCM models were simulated to demonstrate how the system performed in terms of NBS policy effectiveness. During these engagements, our partners noticed how the NBS system was largely driven by properties of social equity, which was not originally identified as a feasible management opportunity. Some of the stakeholders decided to shift their planning paradigm to include properties of social equity within NBS planning, which requires robust collaboration among neighborhood groups, regional decision-makers, municipal planners, and multi-scale engineers, sustainability experts, etc. Local leaders requested assistance in developing a multifunctional optimization scheme that sites NBS features according to spatial properties of social deprivation, as demonstrated in Castro (2022b). These results demonstrate that while some stakeholders may have displayed an “us-vs.-them” attitude during the workshop (i.e., tacit beliefs), the group indeed described a network where joint action was possible by collaborating across multiple sectors and levels of governance (i.e., embedded beliefs). In other words, the group beliefs at the individual scale were not consistent with the network relationships derived at the composite scale.
During the workshop, the stakeholders perceived themselves as participatory observers with a limited role in influencing the overall system. However, through adaptive learning, several key stakeholders shifted to become leading agents of change. We believe this shift was possible due to the underlying structure of the management network. While the density index described a network with limited connections, the hierarchy index described a bottom-up governance scheme with many pathways for trans-scale collaboration. A low degree of hierarchy emphasizes the stakeholders' willingness and capacity to work toward a common goal by bridging network ties through strong outdegree relations among multi-scale nodes (Bodin and Crona, 2009). As such, the hierarchy index may provide a more accurate depiction of collaborative potential within the network structure by considering connective weighting, emphasizing the need to explore various graph theory statistics when attempting to understand network structure. Thus, we may deduce that the group's perception of the network at a high topographical level (i.e., density of links and nodes) was deepened through the group's characterization of causal strength between elements (i.e., outdegree properties of Equation 3).
Moreover, in comparing Table 3 and Figure 5, we observe how the management opportunities with the greatest potential for increasing NBS (i.e., ↑ Si_NBS) transposed many socio-institutional scales (e.g., Local Funding, Political Will, Advocacy and Leadership). Conversely, several nodes with high levels of overall network influence (i.e., ↑ ci) were limited to a single scale (e.g., Maintenance Programs, Local Laws and Regulations). As such, the ideal behavior of the management system (revealed by dynamic FCM modeling) may not align with its underlying structure (defined by stakeholders and revealed by network analysis). This disconnect suggests that stakeholders' intuition of trans-scale system behavior may be biased toward the institutional context within which management is embedded. Stakeholders must identify all democratic opportunities (i.e., trans-scale partnerships) and weigh them accordingly to shift the system toward an idealized outcome. Conversely, identifying potential misconceptions in the system can stabilize the system and translate disparate collectives of trans-scale institutional participants into robust decision-making agents. By anticipating such structural elements, and identifying where asymmetries exist, we may form deeper partnerships with stakeholder groups toward ongoing adaptive governance schemes. In other words, by elucidating several structural elements of the collective mental map, we could reveal paradoxes within stakeholder thinking (i.e., limiting beliefs) that, when addressed, served to build the momentum needed to shift the system trajectory toward a successful outcome.
Spread of influence
While this study resulted in a positive opportunity to improve NBS planning, we observed many paradoxes between the stakeholders' internal perceptions and their external belief statements, particularly regarding the spread of influence (i.e., power dynamics) throughout the system. For example, as previously discussed, the management nodes with highest efficiency transposed many socio-institutional scales. However, the stakeholders maintained throughout the workshop that NBS adoption would only improve with additional “Laws and Regulations” (LLR) for urban greening. In other words, the stakeholders believed (internally) that the system was most effective through top-down governance. Yet the actual dynamics of the system, as defined (externally) by the stakeholders themselves, revealed optimal efficiency through bottom-up initiatives. Similarly, the stakeholders believed that locals were not interested in the social and environmental benefits provided by NBS. Rather, due to the long history of flooding in Houston, the stakeholders asserted that community outreach efforts should focus on the stormwater abatement qualities of NBS. However, per the FCM-based scenario analysis, policy initiatives which increased “Visualization of Co-benefits” (VC) scored the highest degrees of NBS efficiency.
We were curious to understand how the dominant leverage points within the system (defined by network centrality) compared with the most efficient management nodes (defined by policy scenarios). In continuing the above example, we noticed how the level of influence contained within the VC node (ci_VC = 1.00) was significantly less than the centrality of the LLR node (ci_LLR = 2.25), although VC was more efficient than LLR. The assumption that dominant nodal elements may lead the overall system behavior is seemingly persuasive. This is because the centrality index does not tell us how well a node might influence a specific variable of interest (i.e., Si_NBS) but rather its overall degree of influence in triggering flows of information throughout the entire network. Understanding the impact of nodal activation on a specific node requires scenario-based modeling. Instead, we can use this information to quickly assess the dominance properties of nodes across multiple institutional scales and identify hidden power dynamics which may be hindering system efficacy.
In applying this to integrated water management, central actors must use their positioning within the network in a way that has a favorable impact on the overall governance outcome. For example, in our case study, local lawmakers and regulators must be willing (and able) to engage in democratic concessions and promote collective action initiatives throughout all scales of NBS management to realize favorable policy outcomes, which is theoretically possible due to the low hierarchy index described by the group. As demonstrated in this study, collective hierarchy (described in terms of overall influence via the hierarchy index) is not necessarily related to the individual hierarchy (described in terms of connective strengths via the centrality index). Rather, extremes along these spectrums may coexist within the same group. By exploring both the local and global centrality of the network, we were able to aid in a mental shift away from traditional, top-down governance structures toward a collective planning paradigm comprising multi-scale opportunities.
When navigating through complex researcher-stakeholder partnerships, network tools may be used as a first step toward better understanding the structure of the stakeholder-defined management system before engaging in governance transformation. By understanding the network structure, we can explore (and potentially address) paradoxes within management systems which may be stuck and/or inefficient, despite well-intended efforts. In our case study, the stakeholders expressed tacit beliefs which appeared to conflict with the nature of the collective model they had derived. However, the high heterogeneity of governance actors engaged in the workshop led to robust representation of causal influences, and the overall network structure presented numerous democratic opportunities for trans-scale cooperation.
Conclusions
Everything is, in some sense, intricately connected to everything else, but it is clear that some things are more connected than others (Tobler, 1970). Understanding how and why this happens in complex systems, and what are the implications, is central to addressing integrated water management across socio-institutional scales. Participatory research and cognitive mapping have become commonplace within water research for defining complex dynamics from embedded human knowledge. Cognitive maps offer two primary frameworks for assessing collective knowledge: (1) Exploring the structure of the map to capture types of information and their connective properties, and (2) Investigating the dynamics of the map through cause-effect relationships to construct rules of system behavior (Glykas, 2010). To date, the latter paradigm has governed water resources case studies; however, as we are transitioning beyond understanding human-water phenomena to engaging deeply with stakeholders for actionable change, we must be able to assess the structure of cognitive maps prior to using them for dynamic prediction and/or management.
The premise of this study was that a small extension of FCM-based scenario building (via network analysis) can substantially improve our understanding of stakeholder perception and cognitive structures. Network science allowed us to make testable predictions about the properties of real-world networks once their structures were specified. By examining the role of knowledge and power within the management system, we could reveal paradoxes within stakeholder thinking (i.e., limiting beliefs) that, when addressed, served to build the momentum needed to shift the system trajectory toward a successful outcome. In essence, by identifying the stakeholders' perception of the system, per network topology, this exercise served as a foundation for promoting flexibility (collaborative potential) and catalyzing change (influential management) across socio-institutional scales.
Water sector reforms have been criticized for not considering the local context regarding policy implementation (i.e., management) and instead applying universal remedies which can lead to resistance, conflict, and ultimate failure (Al-Saidi, 2017). When a diverse group of stakeholders engage in integrated management, the results may vary widely depending on embedded stakeholder beliefs and how variables interact. As such, the performance of integrated water management depends on complex relational dynamics embedded within the stakeholders' collective experiences. This paper examined how such properties can be identified prior to policy reform by conceptualizing key interactions involved in water management through the lens of network analysis. This research highlighted how we cannot impact water governance without first describing and understanding its structure. Network theory aided in identifying unseen phenomena by emphasizing the normative role of stakeholder interactions in a complex system and revealing underlying properties behind how social decision-makers interact with, define, and influence a two-way human-nature system. In other words, networks helped us to understand, through their web of interconnected features, the core relationships between disparate elements, thereby revealing key organizational principles underlying a complex, integrated water management system. We thus advocate a deeper incorporation of management structure within participatory water research toward achieving the principles of good governance.
Data availability statement
The original contributions presented in the study are included in the article/supplementary material, further inquiries can be directed to the corresponding author/s.
Author contributions
CVC: conceptualization, methodology, software, validation, formal analysis, investigation, resources, data curation, writing—original draft, writing—review and editing, visualization, supervision, project administration, and funding acquisition. CC: writing—original draft and writing—review and editing. MB: writing—original draft, writing—review and editing, and supervision. All authors contributed to the article and approved the submitted version.
Funding
This material was based upon work supported by the National Science Foundation under Award No. 2052598. We are grateful for financial support from the Frontiers in Water editorial team and the Delft International Conference on Socio-hydrology special section topic team, who provided a fee waiver for open-access publishing charges within the journal.
Conflict of interest
The authors declare that the research was conducted in the absence of any commercial or financial relationships that could be construed as a potential conflict of interest.
Publisher's note
All claims expressed in this article are solely those of the authors and do not necessarily represent those of their affiliated organizations, or those of the publisher, the editors and the reviewers. Any product that may be evaluated in this article, or claim that may be made by its manufacturer, is not guaranteed or endorsed by the publisher.
References
Ahmad, R., and Azman Ali, N. (2003). The use of cognitive mapping technique in management research: theory and practice. Manag. Res. News 26, 1–16. doi: 10.1108/01409170310783556
Al-Saidi, M. (2017). Conflicts and security in integrated water resources management. Environ. Sci. Policy 73, 38–44. doi: 10.1016/j.envsci.2017.03.015
Amini, A., Jafari, H., Malekmohammadi, B., and Nasrabadi, T. (2021). Transboundary water resources conflict analysis using graph model for conflict resolution: a case study - harirud river. Discrete Dyn. Nat. Soc. 2021, 1720517. doi: 10.1155/2021/1720517
Axelrod, R. (1976). Structure of Decision: The Cognitive Maps of Political Elites. Princeton, NJ. : Princeton University Press.
Bakker, K., and Morinville, C. (2013). The governance dimensions of water security: a review. Philos. Trans. A Math. Phys. Eng. Sci. 371, 20130116. doi: 10.1098/rsta.2013.0116
Baldwin, E., McCord, P., Dell'Angelo, J., and Evans, T. (2018). Collective action in a polycentric water governance system. Environ. Policy Gov. 28, 212–222. doi: 10.1002/eet.1810
Barabási, A.-L. (2013). Network science. Philos. Trans. A Math. Phys. Eng. Sci. 371, 20120375. doi: 10.1098/rsta.2012.0375
Bertassello, L., Levy, M. C., and Müller, M. F. (2021). Sociohydrology, ecohydrology, and the space-time dynamics of human-altered catchments. Hydrol. Sci. J. 66, 1393–1408. doi: 10.1080/02626667.2021.1948550
Blacketer, M. P., Brownlee, M. T. J., and Bowen, B. B. (2022). Perceptions of social network influence: key players' insights into power, conflict, and collaboration at the bonneville salt flats. Environ. Manage. 69, 288–304. doi: 10.1007/s00267-021-01590-8
Bodin, Ö., and Crona, B. I. (2009). The role of social networks in natural resource governance: what relational patterns make a difference? Glob. Environ. Change 19, 366–374. doi: 10.1016/j.gloenvcha.2009.05.002
Bradford, L. E. A., Ovsenek, N., and Bharadwaj, L. A. (2017). “Indigenizing water governance in Canada,” in Global Issues in Water Policy, eds S. Renzetti, and D. Dupont (Cham: Springer), 269–298. doi: 10.1007/978-3-319-42806-2_15
Castro, C. V. (2022a). Systems-thinking for environmental policy coherence: stakeholder knowledge, fuzzy logic, and causal reasoning. Environ. Sci. Policy 136, 413–427. doi: 10.1016/j.envsci.2022.07.001
Castro, C. V. (2022b). Optimizing nature-based solutions by combining social equity, hydro-environmental performance, and economic costs through a novel Gini coefficient. J. Hydrol. X 16, 100127. doi: 10.1016/j.hydroa.2022.100127
Cohen-Shacham, E., Walters, G., Janzen, C., and Maginnis, S. (2016). Nature-based Solutions to Address Global Societal Challenges. Gland: IUCN, xiii + 97. doi: 10.2305/IUCN.CH.2016.13.en
da Silveira, A. R., and Richards, K. S. (2013). The Link between polycentrism and adaptive capacity in river basin governance systems: insights from the River Rhine and the Zhujiang (Pearl River) Basin. Ann. Assoc. Am. Geogr. 103, 319–329. doi: 10.1080/00045608.2013.754687
Dalin, C., Konar, M., Hanasaki, N., Rinaldo, A., and Rodriguez-Iturbe, I. (2012). Evolution of the global virtual water trade network. Proc. Natl. Acad. Sci. USA. 109, 5989–5994. doi: 10.1073/pnas.1203176109
Dilts, T. E., Weisberg, P. J., Leitner, P., Matocq, M. D., Inman, R. D., Nussear, K. E., et al. (2016). Multiscale connectivity and graph theory highlight critical areas for conservation under climate change. Ecol. Appl. 26, 1223–1237. doi: 10.1890/15-0925
Dinar, A., Rosegrant, M. W., and Meinzen-Dick, R. (1997). Water Allocation Mechanisms: Principles and Examples. Washington, DC: The World Bank. doi: 10.1596/1813-9450-1779
Es'haghi, S. R., Rezaei, A., Karimi, H., and Ataei, P. (2022). Institutional analysis of organizations active in the restoration of Lake Urmia: the application of the social network analysis approach. Hydrol. Sci. J. 67, 328–341. doi: 10.1080/02626667.2022.2026950
Euler, L. (1953). Leonhard euler and the koenigsberg bridges. Sci. Am. 189, 66–70. doi: 10.1038/scientificamerican0753-66
Frantzeskaki, N., McPhearson, T., Collier, M. J., Kendal, D., Bulkeley, H., Dumitru, A., et al. (2019). Nature-based solutions for urban climate change adaptation: linking science, policy, and practice communities for evidence-based decision-making. Bioscience 69, 455–466. doi: 10.1093/biosci/biz042
Frota, R. L., Souza Filho, F. A., Barros, L. S., Silva, S. M. O., Porto, V. C., and Rocha, R. V. (2021). “Network” socio-hydrology: a case study of causal factors that shape the Jaguaribe River Basin, Ceará-Brazil. Hydrol. Sci. J. 66, 935–950. doi: 10.1080/02626667.2021.1913282
Geldof, G. D. (1995). Adaptive water management: integrated water management on the edge of chaos. Water Sci. Technol. 32, 7–13. doi: 10.2166/wst.1995.0004
Gerlak, A. K. (2014). “Federalism and US water policy,” in Federal Rivers: Managing Water in Multi-Layered Political Systems, eds D. E. Garrick, G. R. M. Anderson, and D. Connell (London: Edward Elgar Publishing), 41–56. doi: 10.4337/9781781955055.00013
Giacomoni, M. H., Kanta, L., and Zechman, E. M. (2013). Complex adaptive systems approach to simulate the sustainability of water resources and urbanization. J. Water Resour. Plan Manag. 139, 554–564. doi: 10.1061/(ASCE)WR.1943-5452.0000302
Giordano, R., Passarella, G., Uricchio, V. F., and Vurro, M. (2005). Fuzzy cognitive maps for issue identification in a water resources conflict resolution system. Phys. Chem. Earth 30, 463–469. doi: 10.1016/j.pce.2005.06.012
Glykas, M. (2010). Fuzzy cognitive maps: Advances in Theory, Methodologies, Tools and Applications. Cham: Springer. doi: 10.1007/978-3-642-03220-2
Gray, S. A., Gray, S., Cox, L. J., and Henly-Shepard, S. (2013). “Mental modeler: a fuzzy-logic cognitive mapping modeling tool for adaptive environmental management,” in Proceedings of the Annual Hawaii International Conference on System Sciences (Wailea, HI: IEEE). doi: 10.1109/HICSS.2013.399
Gray, S. A., Gray, S., de Kok, J. L., Helfgott, A. E. R., O'Dwyer, B., Jordan, R., et al. (2015). Using fuzzy cognitive mapping as a participatory approach to analyze change, preferred states, and perceived resilience of social-ecological systems. Ecol. Soc. 20, 11. doi: 10.5751/ES-07396-200211
Gray, S. A., Zanre, E., and Gray, S. R. J. (2014). Fuzzy cognitive maps as representations of mental models and group beliefs. Intell. Syst. Ref. Libr. 54, 29–48. doi: 10.1007/978-3-642-39739-4_2
Green, O. O., Cosens, B. A., and Garmestani, A. S. (2013). Resilience in transboundary water governance: the Okavango river basin. Ecol. Soc. 18, 23. doi: 10.5751/ES-05453-180223
Hahn, T., Olsson, P., Folke, C., and Johansson, K. (2006). Trust-building, knowledge generation and organizational innovations: the role of a bridging organization for adaptive comanagement of a wetland landscape around Kristianstad, Sweden. Hum. Ecol. 34, 573–592. doi: 10.1007/s10745-006-9035-z
Hamouda, L., Kilgour, D. M., and Hipel, K. W. (2006). Strength of preference in graph models for multiple-decision-maker conflicts. Appl. Math. Comput. 179, 314–327. doi: 10.1016/j.amc.2005.11.109
He, S. (2019). Coalition analysis in basic hierarchical graph model for conflict resolution with application to climate change governance disputes. Group Decis. Negot. 28, 879–906. doi: 10.1007/s10726-019-09632-7
Heckmann, T., Schwanghart, W., and Phillips, J. D. (2015). Graph theory-recent developments of its application in geomorphology. Geomorphology 243, 130–146. doi: 10.1016/j.geomorph.2014.12.024
Hettiarachchi, S., Wasko, C., and Sharma, A. (2018). Increase in flood risk resulting from climate change in a developed urban watershed - the role of storm temporal patterns. Hydrol. Earth Syst. Sci. 22, 2041–2056. doi: 10.5194/hess-22-2041-2018
Hopkins, L. P., January-Bevers, D. J., Caton, E. K., and Campos, L. A. (2022). A simple tree planting framework to improve climate, air pollution, health, and urban heat in vulnerable locations using non-traditional partners. Plants People Planet 4, 243–257. doi: 10.1002/ppp3.10245
Hovmand, P., Rouwette, E., Andersen, D. F., Richardson, G. P., Calhoun, A., Rux, K., et al. (2011). Scriptapedia: a handbook of scripts for developing structured group model building sessions. in Proceedings of the 2011 International System Dynamics Conference.
Huitema, D., Mostert, E., Egas, W., Moellenkamp, S., Pahl-Wostl, C., and Yalcin, R. (2009). Adaptive water governance: assessing the institutional prescriptions of adaptive (co-)management from a governance perspective and defining a research agenda. Ecol. Soc. 14, 1–19. doi: 10.5751/ES-02827-140126
Jetter, A., and Schweinfort, W. (2011). Building scenarios with fuzzy cognitive maps: an exploratory study of solar energy. Futures 43, 52–66. doi: 10.1016/j.futures.2010.05.002
Jiménez, A., Saikia, P., Giné, R., Avello, P., Leten, J., Lymer, B. L., et al. (2020). Unpacking water governance: a framework for practitioners. Water 12, 827. doi: 10.3390/w12030827
Kafetzis, A., McRoberts, N., and Mouratiadou, I. (2010). “Using fuzzy cognitive maps to support the analysis of stakeholders' views of water resource use and water quality policy,” in Fuzzy Cognitive Maps. Studies in Fuzziness and Soft Computing, ed M. Glykas (Berlin; Heidelberg: Springer). doi: 10.1007/978-3-642-03220-2_16
Kaleeswari, K., Johnson, T., and Vijayalakshmi, C. (2018). Fuzzy cognitive map approach to sustainable development of water resources. Int. J. Pure Appl. Math. 119, 11–20.
Knoke, D., Wasserman, S., and Faust, K. (1996). Social network analysis: methods and applications. Contemp. Sociol. 25, 219–220. doi: 10.2307/2077235
Kontogianni, A., Papageorgiou, E., Salomatina, L., Skourtos, M., and Zanou, B. (2012). Risks for the Black Sea marine environment as perceived by Ukrainian stakeholders: a fuzzy cognitive mapping application. Ocean Coast. Manag. 62, 34–42. doi: 10.1016/j.ocecoaman.2012.03.006
Kosko, B. (1986). Fuzzy cognitive maps. Int. J. Man Mach. Stud. 24, 65–75. doi: 10.1016/S0020-7373(86)80040-2
Koskoff, E., Hage, P., and Harary, F. (1986). Structural models in anthropology. Ethnomusicology 30, 167. doi: 10.2307/851847
Leck, H., and Simon, D. (2013). Fostering multiscalar collaboration and co-operation for effective governance of climate change adaptation. Urban Stud. 50, 1221–1238. doi: 10.1177/0042098012461675
Levy, M. A., Lubell, M. N., and McRoberts, N. (2018). The structure of mental models of sustainable agriculture. Nat. Sustain. 1, 413–420. doi: 10.1038/s41893-018-0116-y
Lieberman, E. S. (2011). The perils of polycentric governance of infectious disease in South Africa. Soc. Sci. Med. 73, 676–684. doi: 10.1016/j.socscimed.2011.06.012
Majeed, A., and Rauf, I. (2020). Graph theory: a comprehensive survey about graph theory applications in computer science and social networks. Inventions 5, 10. doi: 10.3390/inventions5010010
Marsooli, R., Lin, N., Emanuel, K., and Feng, K. (2019). Climate change exacerbates hurricane flood hazards along US Atlantic and Gulf Coasts in spatially varying patterns. Nat. Commun. 10, 3785. doi: 10.1038/s41467-019-11755-z
McAllister, R. R. J., McCrea, R., and Lubell, M. N. (2014). Policy networks, stakeholder interactions and climate adaptation in the region of South East Queensland, Australia. Reg. Environ. Change 14, 527–539. doi: 10.1007/s10113-013-0489-4
McGinnis, M. D. (2013). Costs and challenges of polycentric governance: an equilibrium concept and examples from U.S. Health Care. SSRN Electron. J. Available online at: https://papers.ssrn.com/sol3/papers.cfm?abstract_id=2206980
Meijer, D., Post, J., van der Hoek, J. P., Korving, H., Langeveld, J., and Clemens, F. (2021). Identifying critical elements in drinking water distribution networks using graph theory. Struct. Infrastruct. Eng. 17, 347–360. doi: 10.1080/15732479.2020.1751664
Minor, E. S., and Urban, D. L. (2008). A graph-theory framework for evaluating landscape connectivity and conservation planning. Conserv. Biol. 22, 297–307. doi: 10.1111/j.1523-1739.2007.00871.x
Misthos, L. M., Messaris, G., Damigos, D., and Menegaki, M. (2017). Exploring the perceived intrusion of mining into the landscape using the fuzzy cognitive mapping approach. Ecol. Eng. 101, 60–74. doi: 10.1016/j.ecoleng.2017.01.015
Moody, J., and White, D. R. (2003). Structural cohesion and embeddedness: a hierarchical concept of social groups. Am. Sociol. Rev. 68, 103–127. doi: 10.2307/3088904
Mourhir, A. (2021). Scoping review of the potentials of fuzzy cognitive maps as a modeling approach for integrated environmental assessment and management. Environ. Modell. Softw. 135, 104891. doi: 10.1016/j.envsoft.2020.104891
Mourhir, A., Rachidi, T., and Karim, M. (2015). “Employing Fuzzy Cognitive Maps to support environmental policy development,” in IEEE International Conference on Fuzzy Systems (Istanbul). doi: 10.1109/FUZZ-IEEE.2015.7337969
Nabiafjadi, S., Sharifzadeh, M., and Ahmadvand, M. (2021). Social network analysis for identifying actors engaged in water governance: an endorheic basin case in the Middle East. J. Environ. Manage. 288, 112376. doi: 10.1016/j.jenvman.2021.112376
Nápoles, G., Leon, M., Grau, I., and Vanhoof, K. (2017). “Fuzzy cognitive maps tool for scenario analysis and pattern classification,” in 2017 IEEE 29th International Conference on Tools with Artificial Intelligence (ICTAI) (Boston, MA: IEEE), 644–651. doi: 10.1109/ICTAI.2017.00103
Nesshöver, C., Assmuth, T., Irvine, K. N., Rusch, G. M., Waylen, K. A., Delbaere, B., et al. (2017). The science, policy and practice of nature-based solutions: an interdisciplinary perspective. Sci. Total Environ. 579, 1215–1227. doi: 10.1016/j.scitotenv.2016.11.106
Newman, M. E. J. (2003). The structure and function of complex networks. SIAM Rev. 45, 169–173. doi: 10.1137/S003614450342480
Nowak, D. J., and Greenfield, E. J. (2012). Tree and impervious cover change in U.S. cities. Urban For. Urban Green 11, 21–30. doi: 10.1016/j.ufug.2011.11.005
Ogada, J. O., Krhoda, G. O., Van Der Veen, A., Marani, M., and van Oel, P. R. (2017). Managing resources through stakeholder networks: collaborative water governance for Lake Naivasha basin, Kenya. Water Int. 42, 271–290. doi: 10.1080/02508060.2017.1292076
Oliva, R. (2004). Model structure analysis through graph theory: partition heuristics and feedback structure decomposition. Syst. Dyn. Rev. 20, 313–336. doi: 10.1002/sdr.298
Olsson, P., Folke, C., and Berkes, F. (2004). Adaptive comanagement for building resilience in social-ecological systems. Environ. Manage. 34, 75–90. doi: 10.1007/s00267-003-0101-7
Omidshafiei, S., Tuyls, K., Czarnecki, W. M., Santos, F. C., Rowland, M., Connor, J., et al. (2020). Navigating the landscape of multiplayer games. Nat. Commun. 11, 5603. doi: 10.1038/s41467-020-19244-4
Özesmi, U., and Özesmi, S. L. (2004). Ecological models based on people's knowledge: a multi-step fuzzy cognitive mapping approach. Ecol. Modell. 176, 43–64. doi: 10.1016/j.ecolmodel.2003.10.027
Pagano, A., Sweetapple, C., Farmani, R., Giordano, R., and Butler, D. (2019). Water distribution networks resilience analysis: a comparison between graph theory-based approaches and global resilience analysis. Water Resour. Manag. 33, 2925–2940. doi: 10.1007/s11269-019-02276-x
Pahl-Wostl, C., Conca, K., Kramer, A., Maestu, J., and Schmidt, F. (2013). Missing links in global water governance: a processes-oriented analysis. Ecol. Soc. 18, 33. doi: 10.5751/ES-05554-180233
Pahl-Wostl, C., Knieper, C., Lukat, E., Meergans, F., Schoderer, M., Schütze, N., et al. (2020). Enhancing the capacity of water governance to deal with complex management challenges: a framework of analysis. Environ. Sci. Policy 107, 23–35. doi: 10.1016/j.envsci.2020.02.011
Puccia, C. J., and Levins, R. (1991). “Qualitative modeling in ecology: loop analysis, signed digraphs, and time averaging,” in Qualitative Simulation Modeling and Analysis. Advances in Simulation, eds P. A. Fishwick, and P. A. Luker (New York, NY: Springer), 119–143. doi: 10.1007/978-1-4613-9072-5_6
Rammel, C., Stagl, S., and Wilfing, H. (2007). Managing complex adaptive systems—a co-evolutionary perspective on natural resource management. Ecol. Econ. 63, 9–21. doi: 10.1016/j.ecolecon.2006.12.014
Raška, P., Bezak, N., Ferreira, C. S. S., Kalantari, Z., Banasik, K., Bertola, M., et al. (2022). Identifying barriers for nature-based solutions in flood risk management: an interdisciplinary overview using expert community approach. J. Environ. Manage. 310, 114725. doi: 10.1016/j.jenvman.2022.114725
Ricart, S., and Rico-Amorós, A. M. (2022). To be, to do, to share: the triple-loop of water governance to improve urban water resilience—testing the benidorm'experience, Spain. Land 11, 121. doi: 10.3390/land11010121
Sandström, A. (2008). Policy networks: the relation between structure and performance. Dep. Bus. Admin. Soc. Sci. 36. 509–511.
Schlüter, M., and Pahl-Wostl, C. (2007). Mechanisms of resilience in common-pool resource management systems: an agent-based model of water use in a river basin. Ecol. Soc. 12. doi: 10.5751/ES-02069-120204
Schramm, F., Schramm, V. B., and Junior, G. A. V. (2020). “Using fuzzy cognitive maps for supporting water resources management and planning,” in Conference Proceedings - IEEE International Conference on Systems, Man and Cybernetics (Toronto, ON: IEEE). doi: 10.1109/SMC42975.2020.9283331
Singh, P. K., and Chudasama, H. (2020). Evaluating poverty alleviation strategies in a developing country. PLoS ONE 15, e0227176. doi: 10.1371/journal.pone.0227176
Sivakumar, B. (2015). Networks: a generic theory for hydrology? Stoch. Environ. Res. Risk Assess. 29, 761–771. doi: 10.1007/s00477-014-0902-7
Slater, L. J., and Villarini, G. (2016). Recent trends in US flood risk. Geophys. Res. Lett. 43, 12–428. doi: 10.1002/2016GL071199
Stein, C., Ernstson, H., and Barron, J. (2011). A social network approach to analyzing water governance: the case of the Mkindo catchment, Tanzania. Phys. Chem. Earth 36, 1085–1092. doi: 10.1016/j.pce.2011.07.083
Suweis, S., Konar, M., Dalin, C., Hanasaki, N., Rinaldo, A., and Rodriguez-Iturbe, I. (2011). Structure and controls of the global virtual water trade network. Geophys. Res. Lett. 38, L10403. doi: 10.1029/2011GL046837
Tan, C. O., and Özesmi, U. (2006). A generic shallow lake ecosystem model based on collective expert knowledge. Hydrobiologia 563, 125–142. doi: 10.1007/s10750-005-1397-5
Tobler, W. R. (1970). A computer movie simulating urban growth in the detroit region. Econ. Geogr. 46, 234–240. doi: 10.2307/143141
Turnbull, L., Hütt, M.-T., Ioannides, A. A., Kininmonth, S., Poeppl, R., Tockner, K., et al. (2018). Connectivity and complex systems: learning from a multi-disciplinary perspective. Appl. Netw. Sci. 3, 1–49. doi: 10.1007/s41109-018-0067-2
Turnhout, E., Metze, T., Wyborn, C., Klenk, N., and Louder, E. (2020). The politics of co-production: participation, power, and transformation. Curr. Opin. Environ. Sustain. 42, 15–21. doi: 10.1016/j.cosust.2019.11.009
Vojnovic, I. (2003). Governance in Houston: growth theories and urban pressures. J. Urban Aff. 25, 589–624. doi: 10.1111/j.1467-9906.2003.00004.x
Wamsler, C., Alkan-Olsson, J., Björn, H., Falck, H., Hanson, H., Oskarsson, T., et al. (2020). Beyond participation: when citizen engagement leads to undesirable outcomes for nature-based solutions and climate change adaptation. Clim. Change 158, 235–254. doi: 10.1007/s10584-019-02557-9
Weir, B. S., and MacDonald, N. (1984). Trees and networks in biological models. Biometrics 40, 1210. doi: 10.2307/2531182
Young, R. F. (2011). Planting the living city. J. Am. Plan. Assoc. 77, 368–381. doi: 10.1080/01944363.2011.616996
Keywords: fuzzy cognitive mapping (FCM), network analysis (NA), participatory modeling (PM), density index, hierarchy index, centrality index, adaptive management, water governance and management
Citation: Castro CV, Carney C and de Brito MM (2023) The role of network structure in integrated water management: a case study of collaboration and influence for adopting nature-based solutions. Front. Water 5:1011952. doi: 10.3389/frwa.2023.1011952
Received: 04 August 2022; Accepted: 19 July 2023;
Published: 14 August 2023.
Edited by:
Giuliano Di Baldassarre, Uppsala University, SwedenReviewed by:
Tiffany Morrison, James Cook University, AustraliaKumaraswamy Ponnambalam, University of Waterloo, Canada
Copyright © 2023 Castro, Carney and de Brito. This is an open-access article distributed under the terms of the Creative Commons Attribution License (CC BY). The use, distribution or reproduction in other forums is permitted, provided the original author(s) and the copyright owner(s) are credited and that the original publication in this journal is cited, in accordance with accepted academic practice. No use, distribution or reproduction is permitted which does not comply with these terms.
*Correspondence: Cyndi Vail Castro, Y3ZjYXN0cm9AaWxsaW5vaXMuZWR1