 Benjamin Meyer1
 Mark Pannekens1André R. Soares2
 Lara Timmermann1Alexander J. Probst2,3Martin Hippelein4Bernd Bendinger1*
 Andreas Nocker1*
- 1IWW Water Centre, Mülheim, Germany
- 2Environmental Metagenomics, Research Center One Health Ruhr of the University Alliance Ruhr, Faculty of Chemistry, University of Duisburg-Essen, Essen, Germany
- 3Centre of Water and Environmental Research (ZWU), University of Duisburg-Essen, Essen, Germany
- 4Institute for Infection Medicine, Christian-Albrecht University of Kiel, University Medical Center Schleswig-Holstein, Kiel, Germany
Drinking water enters buildings with a given microbiological community composition. Within premise plumbing systems, the drinking water is subject to very different conditions and temperatures. Whereas part of the water stays cold, another part is heated to provide hot water. In this study, drinking water samples were taken at different locations in four buildings that had central heating circles and that were equipped with ultrafiltration modules. The latter were intended to keep bacterial numbers low. When studying the increase in bacterial concentrations in these water samples using regrowth tests at different incubation temperatures, a temperature-dependence could be observed. Bacteria in cold water samples propagated best when incubated at 22°C, but often poorly at 36°C and not at all at 50°C. Bacteria in hot water samples showed the reverse behavior and grew best when incubated at 50°C, whereas growth at 22°C was poor or associated with a long growth lag. Water samples from distal taps in periphery locations used for retrieving both cold and hot water showed intermediate growth behaviors. Results suggest the existence of different temperature-adapted bacterial populations within domestic drinking water systems. The finding was supported by sequence data revealing distinct differences in the microbiomes between cold and hot water samples. Abundant bacterial groups in hot water included Deinococci, Kryptonia, Ignavibacteria, Nitrospiria, Gemmatimonadetes and different genera of Gammaproteobacteria. Stagnation of hot water at 50°C, 55°C, or 60°C furthermore shaped the microbiome in different ways indicating that small temperature differences can have a substantial impact on the bacterial communities.
Graphical Abstract.
Introduction
Drinking water from the distribution network enters buildings with a specific microbiome. The composition of the microbial community contained at the point of entry depends on local conditions and is influenced by the raw water source of the distributed drinking water (Thom et al., 2022), the underlying treatment process (Pinto et al., 2012; Bruno et al., 2018), seasonal variation, pipe materials, water age, and other parameters characteristic of the corresponding distribution network (Proctor and Hammes, 2015). The distributed drinking water quality is in most countries highly regulated and monitored for hygienic parameters.
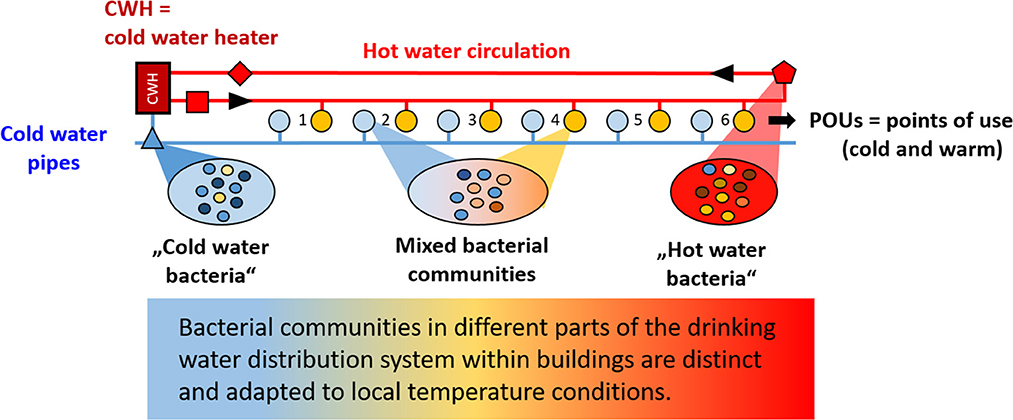
The drinking water distributed by the water utility enters buildings at a single point (point of entry, POE). Subsequently, the water again underlies much variation which also affects the waterborne microbiome (Moermann et al., 2014; Proctor et al., 2017; Novak Babič et al., 2020). As in the municipal water distribution system, factors influencing the microbiological water quality within buildings comprise materials used within the drinking water distribution system (DWDS), ambient temperatures and water consumption behavior and, relating hereto, residence time (Lautenschlager et al., 2010; Lipphaus et al., 2014; Zhang et al., 2015; Ley et al., 2020). Another important, but less investigated factor is, whether the water stays cold or whether it is heated to serve as warm or hot water. Hot water can be provided by decentral or central heating systems. Decentral heating systems comprise mainly water heaters or boilers with different storage volumes, whereas in central warm water systems the water is heated at one point in big storage tanks (with a volume that is adjusted to the size of the building and water use) and enters a circular pipe system from which it is distributed to the different apartments in the periphery of the building. Hot water that is not used in the periphery is fed back to the hot water circulation, re-enters the water heater and is again heated back to the desired temperature. Regulations in Germany require that the temperature difference between the hot water return flow and the hot water at the exit point of the water heater should not exceed 5°K [DVGW (German Technical Scientific Association for Gas and Water), 2004]. Water entering fittings in the periphery and in pipes leading to those, on the other hand, undergoes stagnation and typically cools down with a number of consequences for the microbial communities present (Zlatanović et al., 2017; Montagnino et al., 2022). Systematic broad examinations of these effects on the microbiomes are rare (Ji et al., 2017), but gain relevance with the growing understanding in the field of water hygiene that solutions of microbiological problems depend on a more holistic approach instead of only focusing on specific pathogens. The fate of the latter is shaped by their ecological surrounding either sustaining their presence or suppressing their occurrence and establishment (Wang et al., 2013; Bruno et al., 2022). Temperature can be seen as an important parameter influencing the microbial communities within buildings and was reported to have a higher magnitude of impact on the microbiome than the pipe material (Aloraini et al., 2023).
In this study, we examined the concentrations of total and intact bacteria at different points within the DWDS of multi-family buildings provided with hot water via a central circulation system. The buildings had ultrafiltration modules installed, either at the point of entry (POE) or within the hot water circulation pipe. These ultrafiltration modules had the aim of lowering concentrations of waterborne bacteria in the potable water and were intended in the overarching project to serve as a microbiological barrier to prevent the possible inflow of undesired pathogens like Legionella.
Although the actual effect of the ultrafiltration itself on the hygienic situation is not addressed in this study, the reduction of cell numbers as a consequence of ultrafiltration provided the chance to assess the regrowth behavior of the filtered drinking water. Regrowth is enabled by the fact that ultrafiltration removes bacteria, but not the dissolved nutrients forming the basis for bacterial replication (Nocker et al., 2020). The origin of regrowth are bacteria that are present in the DWDS. This also applies to water directly after the ultrafiltration module as the receiving compartment or pipe is not sterile and surfaces are colonized by surface-adhered microorganisms. These microorganisms seed the filtered water and therefore are the basis for regrowth. This circumstance allowed monitoring the regrowth behavior of water sampled at different points in the DWDS of the buildings studied. Sampling points comprised cold water at the point of entry, hot water from the central circulation system as well as cold and hot water from the periphery. Water samples in the periphery were collected from point of use (POU) taps used both to retrieve cold and hot water.
Methods
Sampling locations and sample collection
Cold and hot potable water samples were obtained from four different multifamily buildings in different geographical regions (A: Kiel, B: Hamburg, C: Hameln, and D: Munich) in Germany. All buildings contained central hot water circulation systems and were equipped with an ultrafiltration module, directly after the entry point of the building (point of entry, POE; existing buildings A, B, and newly constructed building D) or in the hot water circulation system (building C), resulting in reduced cell concentrations due to removal of bacteria. Cold-water sampling locations comprised: point of entry (POE), water supplying the water heater (water heater supply, WHS) and distal taps in the periphery (point of use, POUCold). Hot water samples were taken from the central hot water circulation after leaving the hot water tank (water heater exit, WHE), from the hot water circulation (directly before the ultrafiltration unit in building C), from hot water reflow into the heater (water heater return, WHR) and from the taps in the periphery (point of use, POUHot). Sampling sites were heat-disinfected with a flame prior to sampling following standard procedures. The first liter served for DNA extraction and subsequent sequencing (in case of selected samples) and the second liter was collected to quantify bacterial concentrations and regrowth potentials. Samples were typically collected in 0.1 L, 0.5 L, or 1 L borosilicate glass bottles with Teflon seals, which were free of assimilable organic carbon (AOC). Samples were sent cold via express shipment to the laboratory and processed within 24 h after sampling. Prior to flow cytometric analysis, samples were aliquoted in three 50 ml AOC-free glass vessels holding 20 ml of sample each. Concentrations of total and intact cells were quantified by flow cytometry on the day of arrival (day 0) to determine the microbiological status at the time point of sampling. Three aliquots of each sample were subsequently incubated either at 22°C, 36°C, or 50°C and flow cytometric analysis was repeated after 7, 14, and 21 days or as indicated.
Preparation of AOC-free glassware
An alkaline solution of potassium permanganate was made by separately dissolving (A) 30 g of permanganate (cat.nr. 105082; Merck KGaA, Germany) and (B) 100 g sodium hydroxide pellets (cat.nr. 106498; Merck KGaA, Germany) in 0.5 L deionized water each and equilibrated to room temperature. The two solutions were subsequently combined and stored in a 1 L bottle in the dark prior to use. Clean glass vials (50 ml, cat.nr. 7612150; Th. Geyer GmbH & Co.KG) were first washed with deionized water and then filled with this alkaline solution and sealed with appropriate caps (cat. nr. 292401305, DWK Life Sciences, Wertheim, Germany). The vials were filled to enable contact of the entire surface with the oxidant. The permanganate solution was decanted (for recycling purposes) and glassware and caps were rinsed three times with tap water and twice with deionized water. Dried glassware and caps were wrapped in aluminum foil. Glassware was muffled at 550°C (50 ml vials) for at least 8 h or overnight, caps were heated at 180°C during that time. Caps were provided with a Teflon seal (special fabrication by Max Werth GmbH Co. KG, Mülheim an der Ruhr, Germany) prior to use.
Flow cytometry
Bacterial cell numbers were quantified using flow cytometry. For this purpose cells were stained with the fluorescent dyes SYBR Green I (10,000× stock; cat.nr. S-7567; Life Technologies Ltd.) and propidium iodide (PI; 1 mg ml−1, cat. P3566; Life Technologies Ltd.). SYBR Green I was diluted to a working stock concentration of 100× using dimethylsulfoxide (DMSO; Sigma Aldrich) and stored at −20°C until use. Aliquots (250 μl) of water samples were transferred into a 96-well plates (cat. nr. 601808, HJ-Bioanalytik GmbH). To determine total cell concentrations (TCC), 200 μl sample aliquots from this plate were transferred into the wells of a second 96-well plate with pre-aliquoted 2 μl of the 100× SG working stock solution followed by thorough mixing by pipetting up and down several times with a multichannel pipette. To determine intact cell concentrations, 200 μl sample aliquots from this plate were transferred into the wells of a second 96-well plate with pre-aliquoted 2.4 μl of a mixture of 100× SG I (2 μl) and PI (0.4 μl) followed by thorough mixing through repeated aspiration. Staining was performed at 37°C for 13 min in an air incubator. Data was collected using Novocyte ACEA benchtop instrument equipped with a 488 nm laser (ACEA Biosciences Inc., USA) and an autosampler to enable analysis on a 96-well plate basis. Data were analyzed using the instrument-specific software and a gating procedure similar to the one described by Gatza et al. (2013). In case that the total signals exceeded ~1.000 signals/s water samples were diluted with 0.1 μm filtered mineral water (Evian, Evian-les-Bains, France) to ensure osmotic balance.
Assessment of regrowth potential and of microbiome changes during regrowth
Water samples contained in AOC-free vials were incubated at 22°C, 36°C, or 50°C (±1°C) for up to 3 weeks without shaking. At indicated time intervals cell numbers were repeatedly quantified by flow cytometry. In experiments addressing whether the regrowth characteristics could be transplanted from one sample to another, hot water samples (20 ml) from building A were supplemented with a 1/1,000th volume (20 μl) of cold water (POE) from the same building. These spiked samples together with non-spiked control samples were incubated at 22°C for 3 weeks.
For experiments addressing potential changes of the microbiome during incubation at elevated temperatures (50°C, 55°C, 60°C), hot water samples from building C were collected in AOC-free 1 L bottles. At the time point of sampling, the temperature of the central water heater was set to 45°C−50°C and the actual temperature of the sampled water was 45.5°C. Samples for direct filtration were cooled on ice and transported to the laboratory. Samples for regrowth experiments and subsequent sequencing were not placed on ice, but transported at their given temperature in insulated transport boxes to minimize cooling and potential growth inhibition. The samples were incubated in the laboratory at the indicated temperatures without shaking for 3 weeks using standard laboratory incubators.
Genomic DNA extraction and sequencing
For microbial community analysis, 1 L of each water sample was filtered through 0.2 μm polycarbonate filters (Pieper Filter GmbH, Germany). Genomic DNA was extracted using the Aquadien™ DNA Extraction and Purification Kit (cat. nr. 3578121, Bio-Rad Laboratories GmbH, Feldkirchen, Germany). Illumina MiSeq sequencing was performed by Eurofins Genomics (Ebersberg, Germany) after amplifying the V3/4 region of the 16S rRNA gene (467 bp ± 20 bp) using universal primers (forward: 5′-TCGTCGGCAGCGTCAGATGTGTATAAGAGACAGCCTACGGGNGGCWGCAG-3′ and reverse: 5′-GTCTCGTGGGCTCGGAGATGTGTATAAGAGACAGGACTACHVGGGTATCTAATCC-3′). The data presented in the study are deposited in the NCBI BioSample database repository, accession numbers SAMN35749896–SAMN35749922.
Sequence analysis
Paired-end reads were initially processed using cutadapt (version 2.7, Martin, 2011) by the sequencing company Eurofins Genomics (Ebersberg, Germany) to remove primer and adapter sequences. DADA2 (version 1.29.0, Callahan et al., 2016) was subsequently employed to obtain an ASV (amplicon sequence variants) abundance matrix including taxonomical classifications. Firstly, forward and reverse reads were filtered and truncated at lengths 280 bp and 200 bp, respectively using the DADA2 filterAndTrim function. Filtered reads were further dereplicated (derepFastq) before error rate estimation subsampling 100 Mbp for training (learnErrors). Finally, the DADA algorithm was applied to infer ASVs and read pairs were merged using a minimum overlap of 10 bp under the default parameters (DADA2 functions dada, mergePairs) and bimeric sequences were removed via function removeBimeraDenovo. Taxonomy was assigned to ASVs using the SILVA database version 138.1 clustered at 99% similarity (https://www.arb-silva.de/documentation/release-1381/) with assignTaxonomy. An overview of the generated data, e.g., the total raw reads, their numbers across DADA2 workflow steps, and final ASVs are given in Supplementary Table S3.
Metadata, taxonomic classifications and abundance matrix were integrated into a phyloseq object and analyzed using R packages phyloseq (version 1.42.0, McMurdie and Holmes, 2013), tidyverse (version 2.0.0, Wickham et al., 2019) and ggplot2 (version 3.4.2, Wickham, 2016) within R (version 4.1.2, https://intro2r.com/citing-r.html). The phyloseq object was firstly filtered to include only those ASVs affiliated to the kingdom “Bacteria” and following calculation of relative abundances, ASVs representing <1% of each sample were removed. A Principal Components Analysis (PCoA) of Bray-Curtis dissimilarities and Shannon–Wiener (Shannon, 1948), Simpson (Simpson, 1949) and Chao 1 (Chao, 1987) indices were created making use of the phyloseq and vegan R packages (https://cran.r-project.org/web/packages/vegan/index.html). Barplots and heatmaps of class- and genus-level abundances were plotted using ggplot2 following taxonomic rank-specific summarizing of the filtered phyloseq object using tidyverse functions (https://www.tidyverse.org/).
Results
Bacterial regrowth in water from different locations in the DWDS of different buildings
Drinking water samples from four buildings (A, B, C, and D) with hot water circulation systems were taken at different locations of the corresponding DWDS. Samples included cold water from the point of entry (POE), cold water entering the water heater (water heater supply, WHS), hot water at the water heater exit (WHE), hot water from the circulation pipe, hot water re-entering the water heater (water heater return, WHR) as well as cold and hot water at the point of use (POU) in the periphery. Regrowth assays were performed by incubating samples either at 22°C, 36°C, or 50°C. Intact cell concentrations (ICC) were monitored by flow cytometry in weekly intervals over 3 weeks.
For buildings A, B and C, cold-water samples from POE and WHS sampling points tended to show strongest bacterial regrowth when samples were incubated at 22°C and in part also at 36°C (Figures 1–3). No regrowth was observed when incubating cold-water samples at 50°C. Hot water from WHE and WHR sampling points showed the opposite behavior with regrowth being strongest when incubating samples at 50 and 36°C, while no regrowth was observed at 22°C. The most diverse regrowth behaviors were measured for POU samples from distal taps which were used to retrieve both cold and hot water. Regrowth for those samples was building-specific. In buildings A and C, hot water POU samples exhibited regrowth at all three incubation temperatures, whereas regrowth of cold-water POU samples was limited to 36 and 22°C (Figures 1, 3). In building B, all POU samples showed regrowth at all three temperatures (Figure 2).
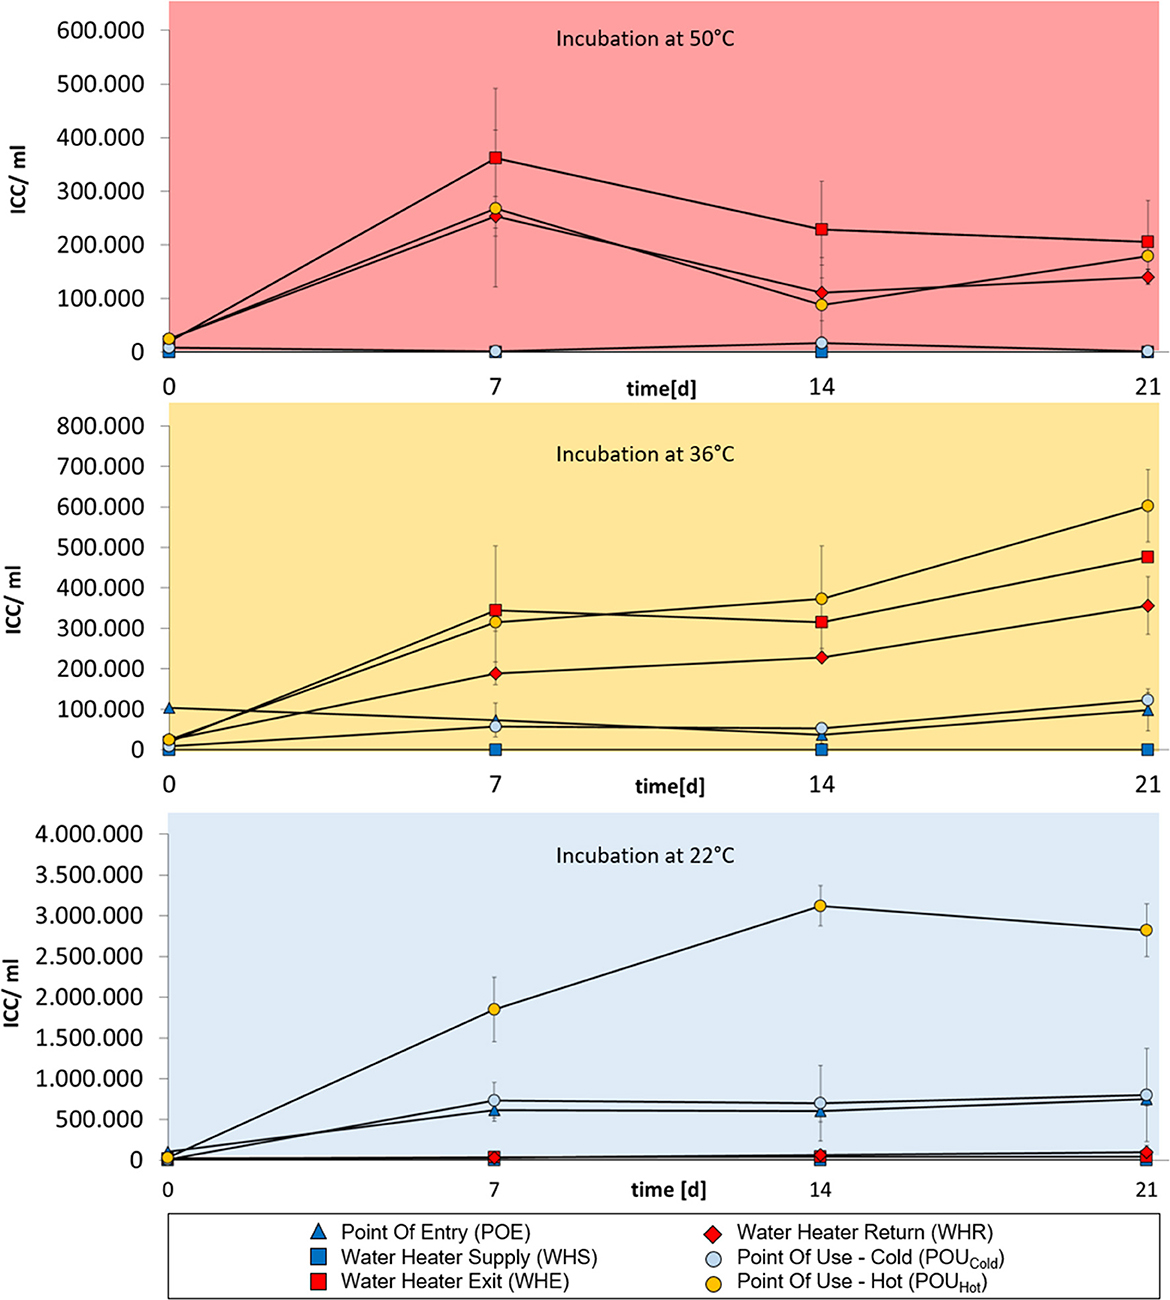
Figure 1. Changes in intact cell concentrations in drinking water samples from building A over a 3 week-incubation at different temperatures (50°C, 36°C, or 22°C). Cold-water samples are indicated in dark blue, hot water samples are indicated in red. Water from POU sampling points in the periphery are indicated in light blue (cold water samples) or orange (hot water samples). Error bars show standard deviations from three independent samples originating from a 1 L collection sample.
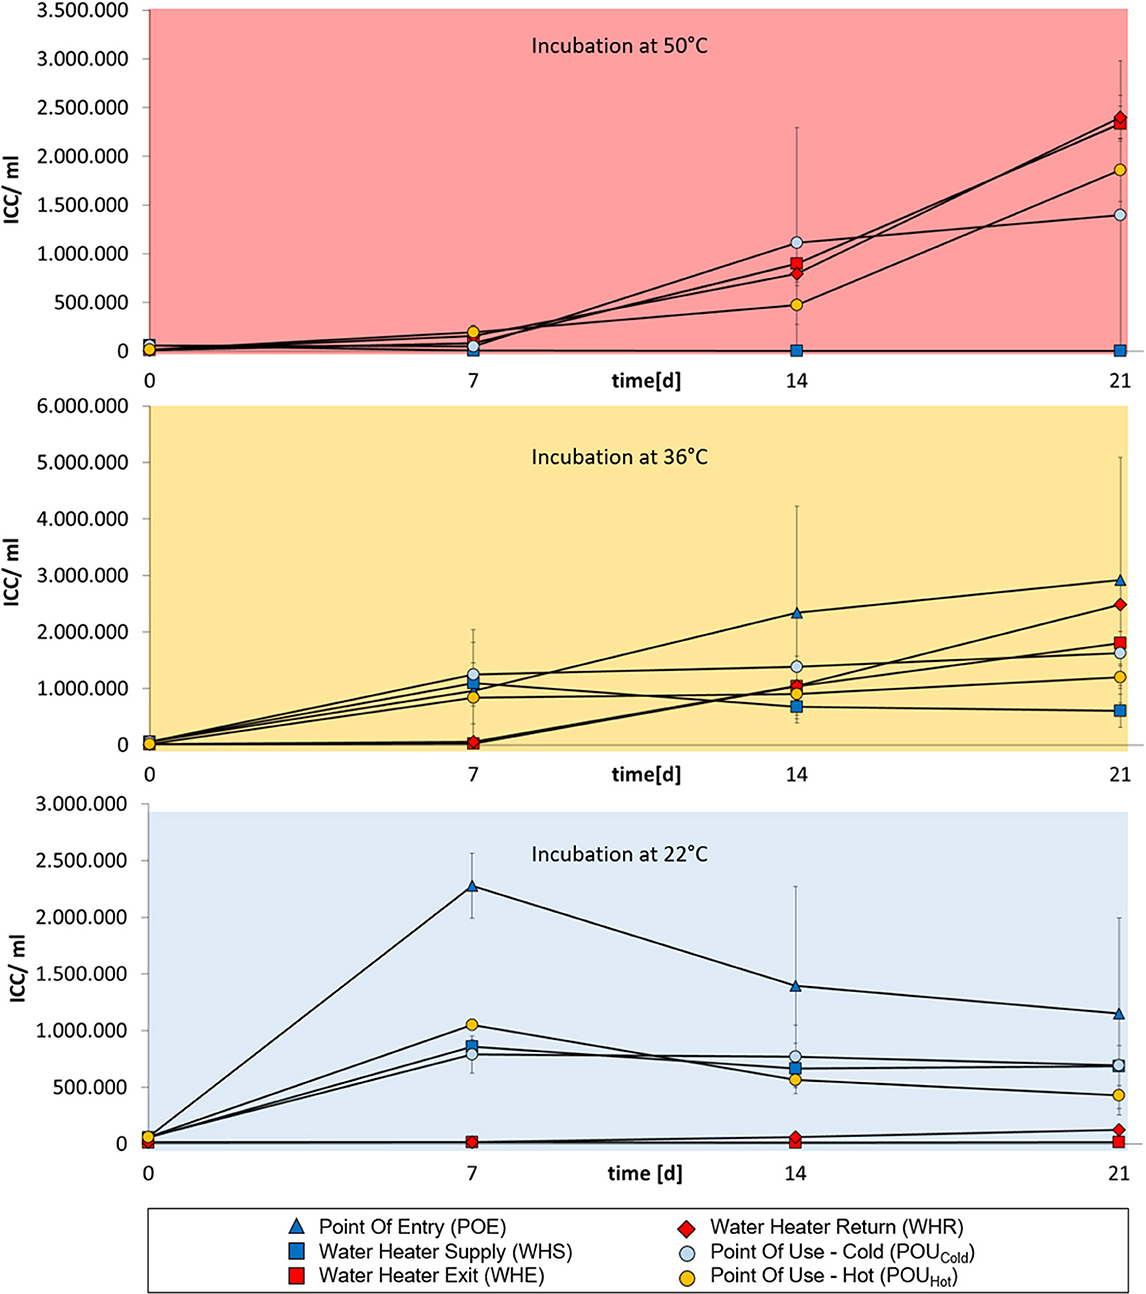
Figure 2. Changes in intact cell concentrations in drinking water samples from building B over a 3 week-incubation at different temperatures (50°C, 36°C, or 22°C). Cold-water samples are indicated in dark blue, hot water samples are indicated in red. Water from POU sampling points in the periphery are indicated in light blue (cold water samples) or orange (hot water samples). Error bars show standard deviations from three independent samples originating from a 1 L collection sample.
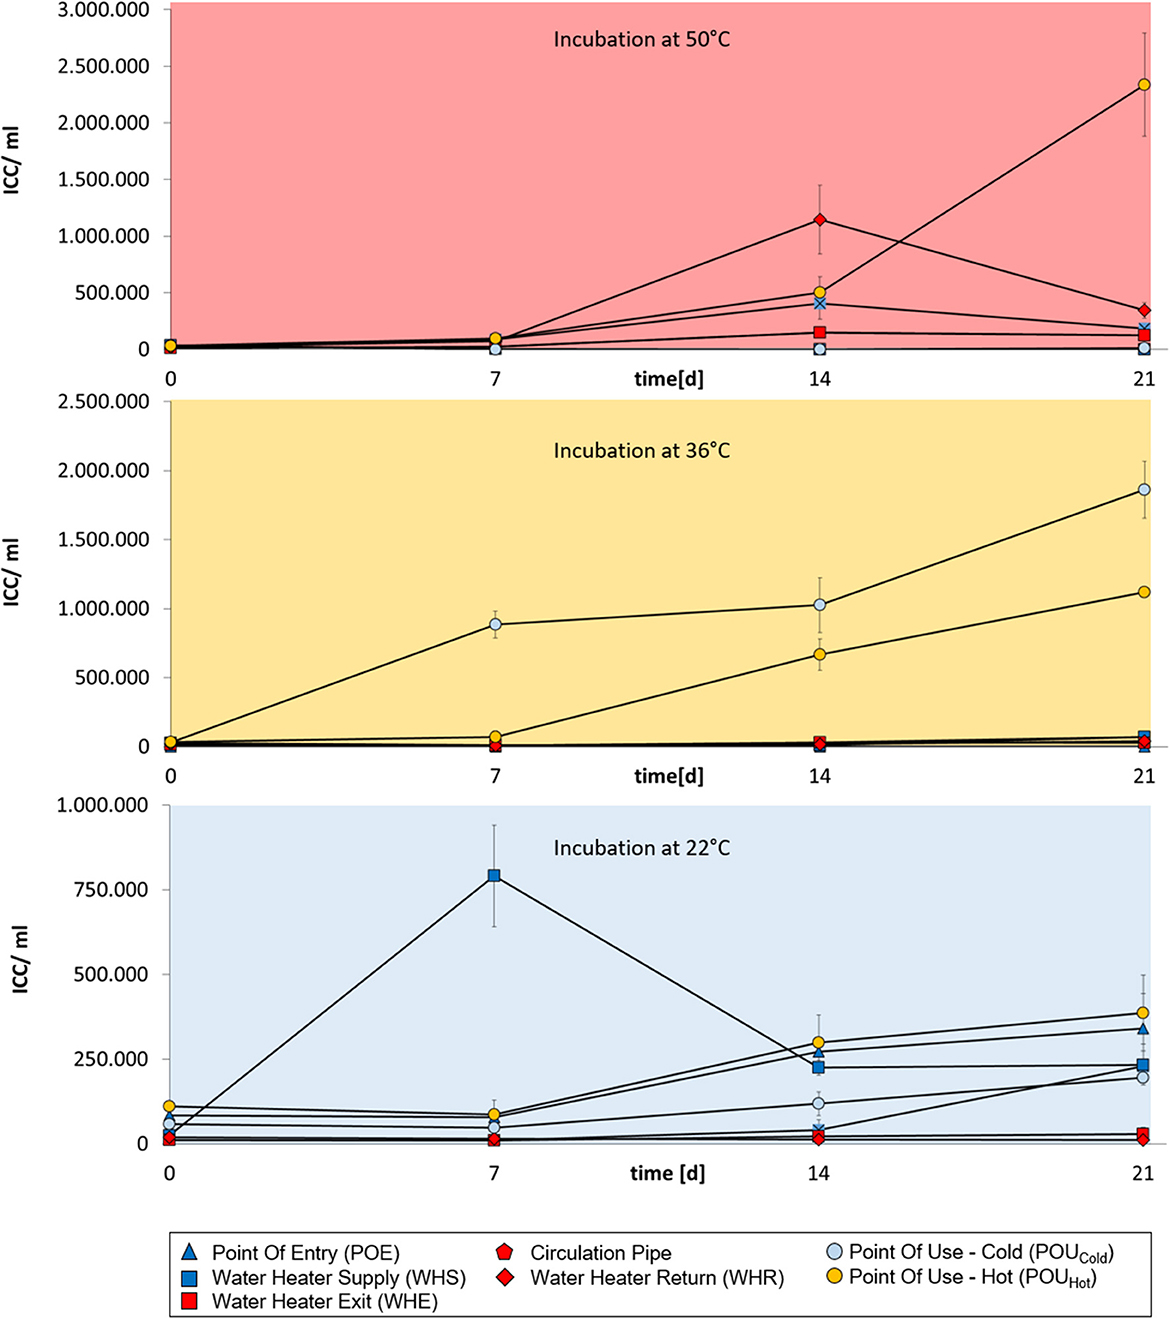
Figure 3. Changes in intact cell concentrations in drinking water samples from building C over a 3 week-incubation at different temperatures (50°C, 36°C, or 22°C). Cold-water samples are indicated in dark blue, hot water samples are indicated in red. Water from POU sampling points in the periphery are indicated in light blue (cold water samples) or orange (hot water samples). Error bars show standard deviations from three independent samples originating from a 1 L collection sample.
Water samples from building D represented an exception as no regrowth was obtained at 50°C (Figure 4). Neither hot water samples from sampling points WHE nor from WHR showed regrowth at this elevated temperature. The already low concentration of intact cells initially present in the first measurement (representing the time point of sampling) declined within seven days to values near the detection limit of ~200 cells/ml. At the time point of sampling the domestic plumbing system of the building had been in use for only 11 months including a weekly thermal disinfection at 60°C for 12 h. These conditions were seen as the reason for the lack of regrowth at 50°C. Regrowth was obtained on the other hand at 36 and 22°C (Figure 4) although cell concentrations were substantially lower than the ones in comparable samples from buildings A–C (Figures 1–3).
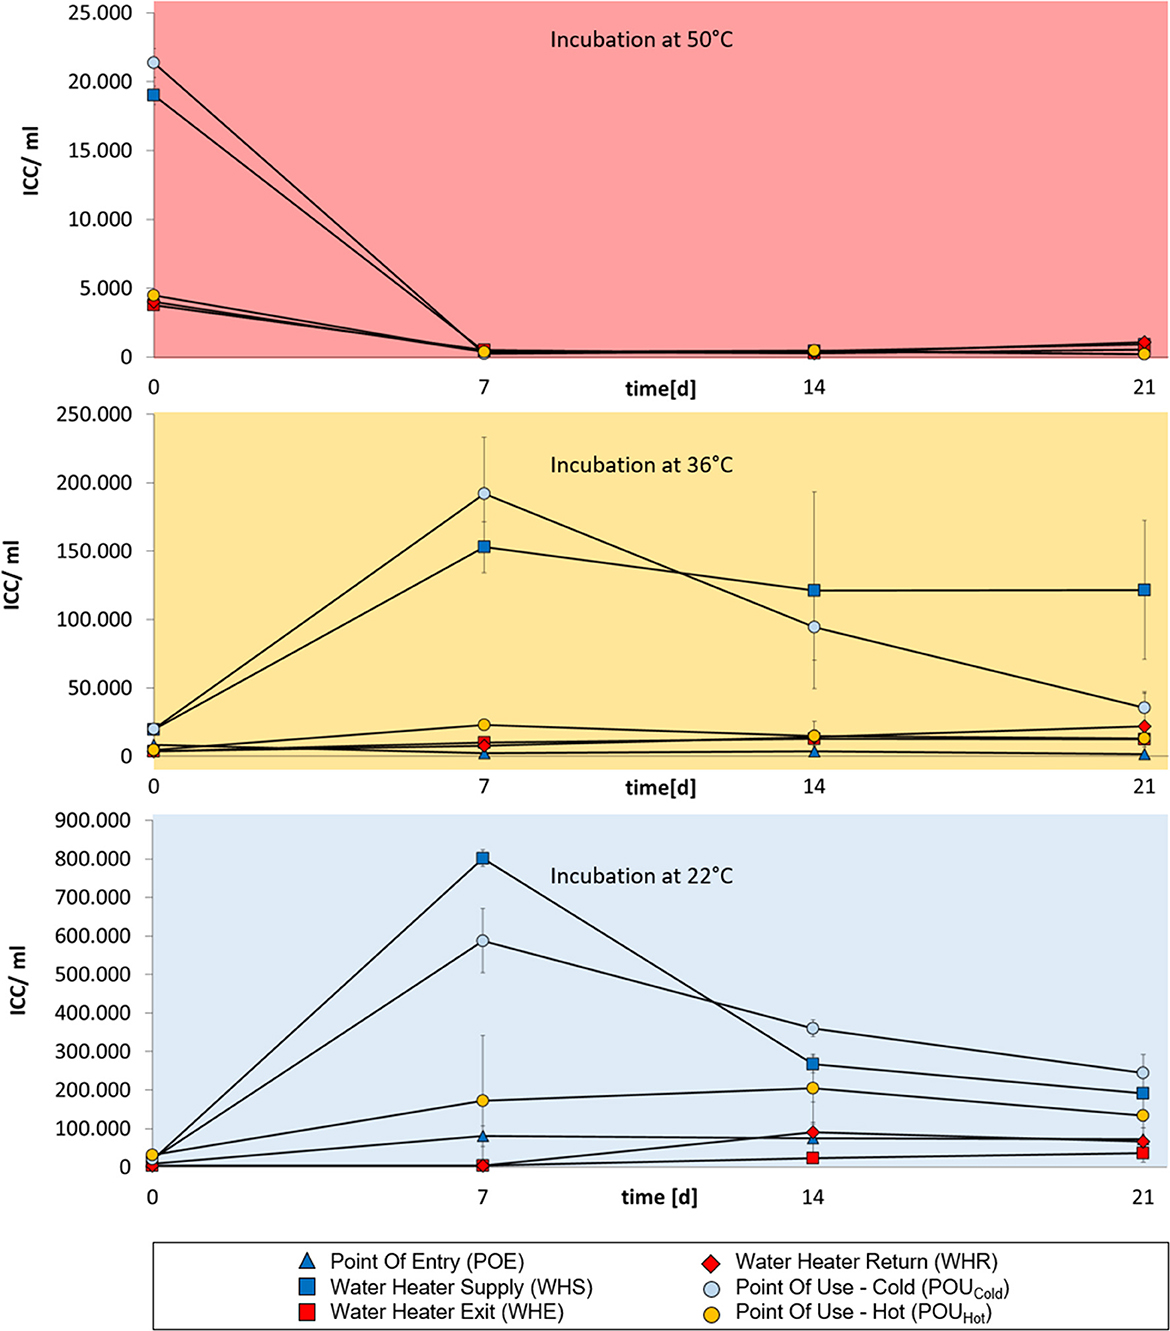
Figure 4. Change in total bacterial concentrations in drinking water samples from building D over a 3 week-incubation at different temperatures (50°C, 36°C, or 22°C). Cold-water samples are indicated in dark blue, hot water samples are indicated in red. Water from POU sampling points in the periphery are indicated in light blue (cold water samples) or orange (hot water samples). Error bars show standard deviations from three independent samples originating from a 1 L collection sample.
Transplantation of regrowth characteristics
As water samples from different locations had different permissive temperatures for bacterial regrowth, we hypothesized that the temperature dependency could be altered by spiking water of a specific regrowth characteristics with a small volume of water of a different regrowth characteristic. For that purpose, a hot water sample from the water heater exit (WHE) of building A was supplemented with a 1/1,000 v/v ratio of cold water from the point of entry. While water from sampling point WHE displayed no significant regrowth at 22°C for up to 3 weeks, the spiking with cold water resulted in measurable regrowth beginning at day 7 (Figure 5). Cell numbers continued to increase when extending incubation up to 3 weeks.
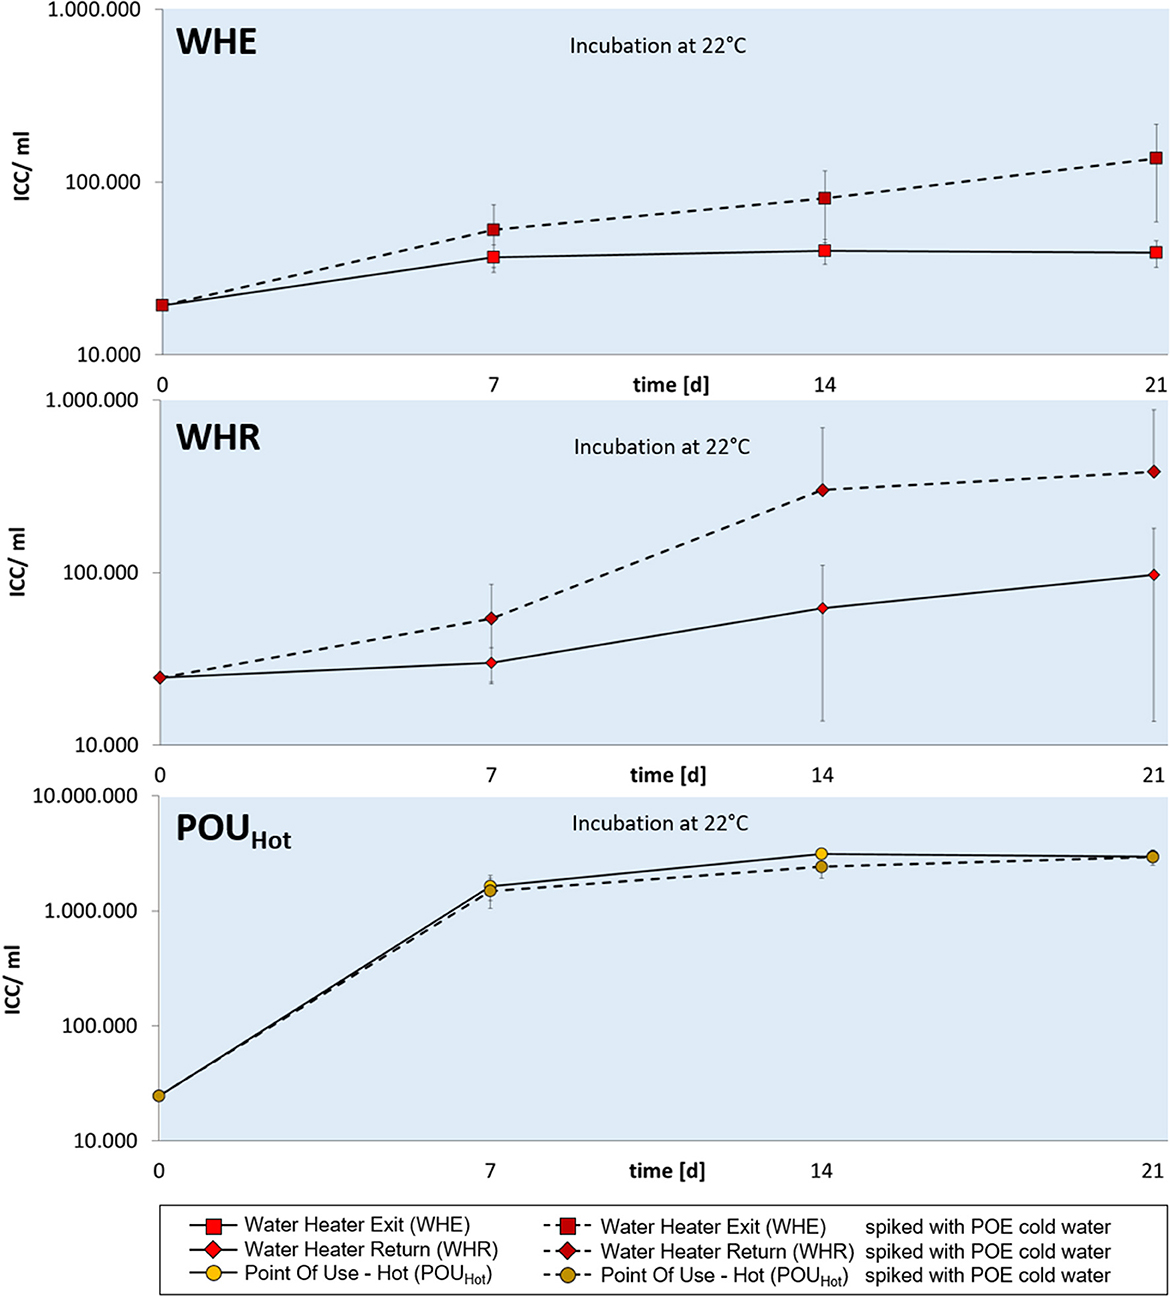
Figure 5. Bacterial regrowth in three hot water samples WHE (top), WHR (middle), and POUHot (bottom) from building A. Hot water samples were either inoculated with cold POE water (dotted lines) or not (solid lines) and incubated at 22°C for 21 days. Changes in intact cell concentrations were measured after 0, 7, 14, and 21 days. Error bars show standard deviations from three replicate samples originating from a common water volume.
Regrowth at 22°C was also achieved for hot water sampled at location WHR (Figure 5) when supplemented with cold water from POE whereas no significant regrowth was measured for the unsupplemented WHR hot water sample. Overall data suggested that the regrowth characteristics of the cold-water sample (and the bacteria contained herein) could be “transplanted” to the hot water sample. This was not the case when spiking hot water sampled from the POUHot tap in the periphery. This water showed per se regrowth at 22°C and the addition of cold water did not change the regrowth characteristics.
Microbiome diversity at different sampling locations
The different regrowth characteristics of the drinking water samples were likely due to different bacterial communities present at different locations in the DWDS. In order to gain more insight into the associated microbiomes, selected samples were sequenced. Using the example of building C, PCoA analysis discriminated dissimilarities in the structure of bacterial communities in cold water and hot water (Figure 6). For the cold-water samples, the bacterial community at the point of entry was distinct from those obtained from taps. Also the hot water communities were not uniform with pronounced divergence between the bacterial communities in the central hot water circulation system (WHE, the circulation pipe and WHR) and those obtained from distal taps.
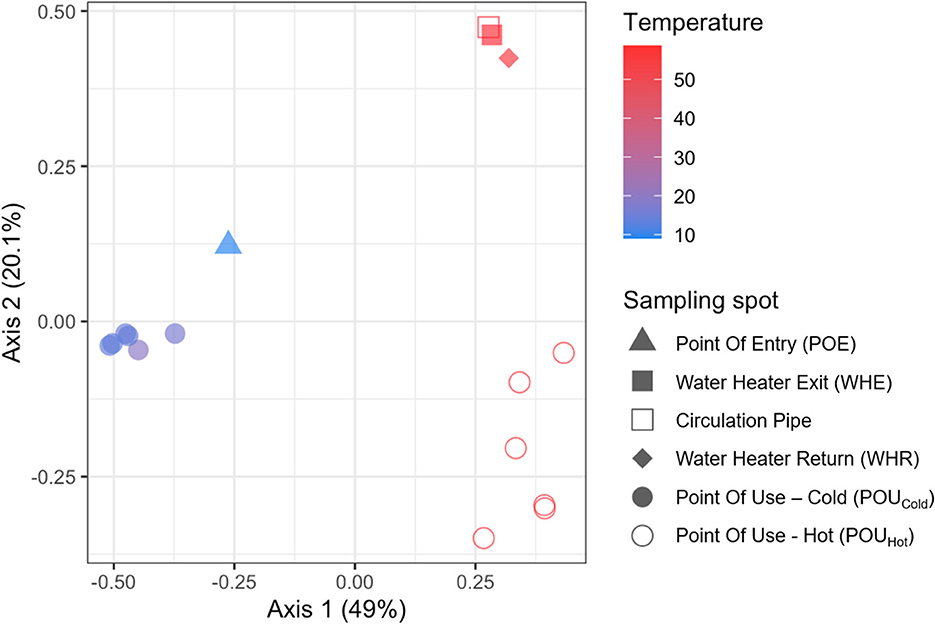
Figure 6. A Principal Components Analysis (PCoA) based on 16S rRNA gene amplicon sequence variants (ASVs) of bacterial community compositions within the DWDS of building C. Represented variance for each axis is given in brackets.
Amplicon sequence variants (ASVs) recovered from samples collected at building C were assigned to a total of 25 taxonomic classes. Gammaproteobacteria comprised on average the largest fraction of all samples (Figures 7A, B). Their relative abundance was hereby higher in hot water samples (average: 76%) than in cold-water samples (average: 54%), with relative proportions in hot water ranging between 61 and 86% (Supplementary Figure S1). Gammaproteobacteria showed the lowest relative abundance (22%) in cold water at the point of entry, whereas POUCold samples contained proportions ranging from 46% to 78%.
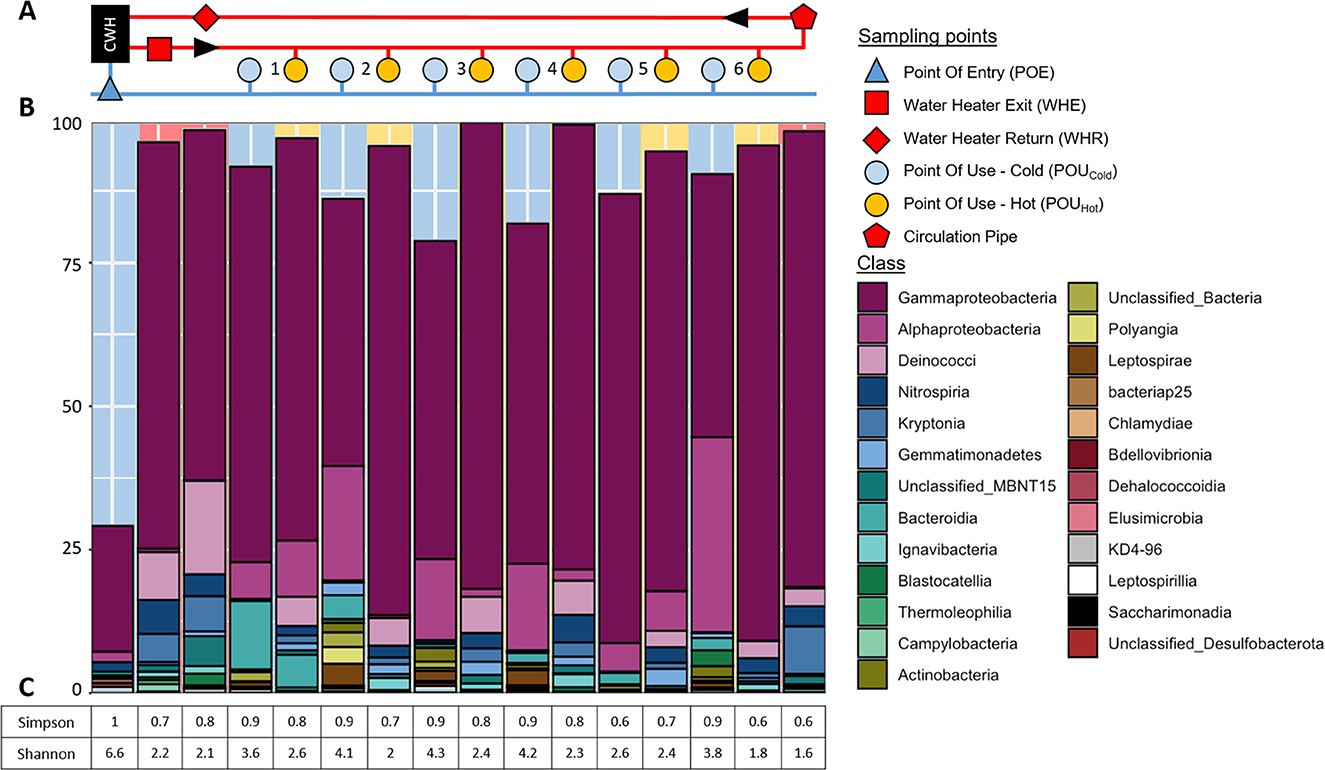
Figure 7. Taxonomic diversity of bacterial communities of cold and hot water samples in building C. (A) Schematic presentation of the DWDS with dark blue color representing cold water at POE and red color representing hot water. Light blue and orange colors indicate distal taps as sampling points in the periphery. Black arrows indicate the direction of water flow of the hot water circulation system. (B) Relative abundances of dominant bacterial classes based on 16S rRNA geneASVs grouped by major taxa and classified using ASVs at class-level (taxa <1% of each sample were removed). (C) Corresponding Simpson and Shannon–Wiener indices. Not rounded indices as well as the observed ASVs and predicted diversity are given in Supplementary Table S1. Only Taxa with >1% relative abundance are shown.
Other bacterial classes with higher abundances in hot water included Deinococci (2.88%−16.3%), Kryptonia (0.85%−8.28%), Nitrospiria (1.57%−5.89%), and to a minor extent Gemmatimonadetes (0.37%−3.02%) and Ignavibacteria (0.32%−2.25%; Supplementary Figure S1). Within the hot water samples, Deinococci, Kryptonia, and Nitrospiria had highest relative abundances in the central circulation system (WHE, WHR) and somewhat lesser abundances in the POUHot samples. The most abundant genera among the Gammaproteobacteria in hot water samples comprised unclassified Hydrogenophilaceae, unclassified Comamonadaceae, Extensimonas, Methyloversatilis, and MND1 (Figure 8, Supplementary Figure S2, Supplementary Table S4). Whereas the genera Hydrogenophilaceae and Methyloversatilis were dominant in the hot water circulation system (WHE, WHR, and the circulation pipe), unclassified Comamonadaceae and Extensimonas were dominant in the POUHot samples (Figure 8, Supplementary Figure S2, Supplementary Table S4).
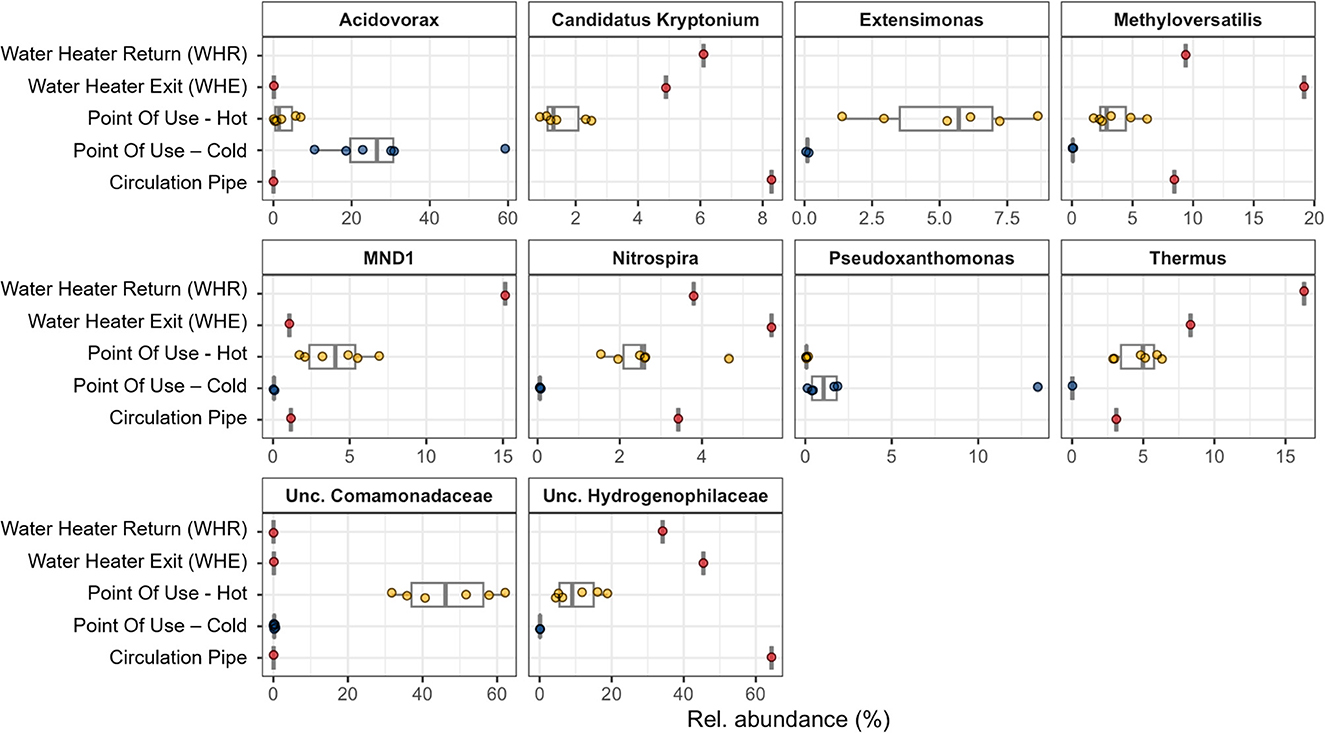
Figure 8. Relative abundance (%) of the top 10 most abundant genera in the DWDS of building C. Genera are sorted in alphabetical order. Colors of the symbols correspond to the temperature of the samples (WHE, circulation pipe and WHR: red; POUHot: orange, POUCold: light blue, and POE: dark blue). Missing values indicate that the specific genus was not found in that sample. POE is not shown based due to the lack of the 10 most abundant genera, which the exception of Nitrospira (Supplementary Table S4).
Cold-water samples on the other hand contained apart from Gammaproteobacteria high relative abundances of Alphaproteobacteria, especially in POUCold samples with relative proportions between 5 and 34% (Supplementary Figure S1). Cold water from POE in comparison contained <2% of Alphaproteobacteria. POUCold samples also showed higher relative abundances of Bacteroidia (up to 12%) than POE water (<1%). Among the Gammaproteobacteria, the genus Acidovorax (belonging to the Comamonadaceae) was dominant in POUCold samples, whereas this genus was present with only 0.2% in cold water at the POE (Figure 8, Supplementary Figure S2, Supplementary Table S4).
Differences between cold and hot water samples were also reflected in the diversity indices with higher Simpson and especially higher Shannon–Wiener indices for cold water samples (Figure 7C). The diversity indices were highest for cold POE water (Figure 7C).
Effect of incubation at different temperatures on microbiome
As the described bacterial communities reflected the microbiological status of the time point directly after sampling, we addressed the question how stagnation would affect the microbiome of hot water. For that purpose hot water from building C (initial temperature during sampling: 45.5°C) was either processed directly or was incubated for 3 weeks at 50°C, 55°C, or 60°C. Cold water processed directly after sampling served as a reference.
Independent of stagnation, all hot water samples showed a different bacterial community composition and structure and much less diversity than the cold water (Simpson index: 1, Shannon–Wiener index: 6.6; Figure 9). As seen before, Gammaproteobacteria were the dominant bacterial class in hot water samples (Figure 9). Stagnation at elevated temperatures resulted in a strong increase of this bacterial class and led to a pronounced difference to the directly processed hot water. Other abundant bacterial classes comprised as before Kryptonia and Deinococci and to a minor extent unclassified MBNT15 and Gemmatimonadetes (Supplementary Figure S3). The abundance of Ignavibacteria that were initially present in the hot water samples at the time point of sampling with ~7%, decreased during the 3-week incubation in a temperature-depended fashion to 1.28%, 0,75%, and <0.5% at 50°C, 55°C, and 60°C, respectively.
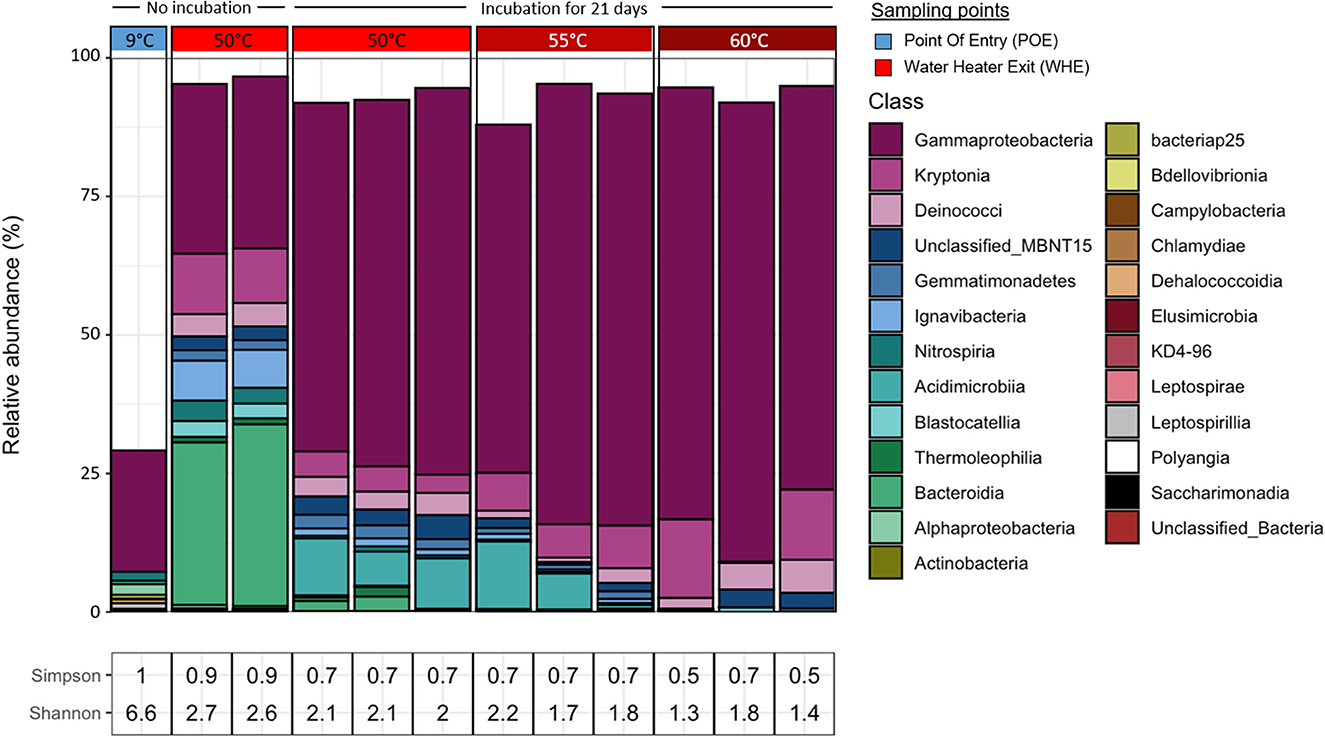
Figure 9. Effect of incubating hot water at elevated temperatures (50°C, 55°C, or 60°C for 3 weeks) on the taxonomic diversity of bacterial communities in comparison with cold water and hot water without incubation. All water samples originated from building C. Taxonomic diversity is based on 16S rRNA gene amplicon sequences grouped by major taxa and classified using ASVs. Only Taxa with >1% relative abundance are shown. Corresponding Simpson and Shannon–Wiener indices are indicated. Not rounded indices as well as the observed ASVs and predicted diversity are given in Supplementary Table S2.
A bacterial class that on the other hand only became abundant during stagnation was the one of Acidimicrobia. Stagnation at 50 and 55°C resulted in proportions up to 12%, whereas this class was hardly detected after stagnation at 60°C.
Among the Gammaproteobacteria, the genera MND1 and unclassified Hydrogenophilaceae were dominant in hot water samples (Supplementary Figure S4). Whereas the relative abundance of MND1 tended to strongly increase during stagnation, the relative abundance of Hydrogenophilaceae varied between samples, with a tendency to higher abundances at higher stagnation temperatures. Unclassified OPS 17 (belonging to the Bacteroidia) showed only strong presence (~29%−32%) in directly processed hot water, their relative abundance strongly declined during stagnation.
The incubation temperature caused differences in the bacterial community compositions. Whereas 50 and 55°C seemed permissive for Gemmatimonadetes, Ignavibacteria, and Acidimicrobia, these bacterial classes showed much lower relative abundances after incubation at 60°C (Supplementary Figure S3). The relative abundance of Kryptonia, on the other hand, seemed to increase when rising the incubation temperature. On genus level, unclassified Actinomarinales were only found in samples incubated at 50 and 55°C, but not after incubation at 60°C (Supplementary Figure S4).
In summary, stagnation of hot water for 3 weeks resulted in pronounced differences in the bacterial community compositions. On class level, Gammaproteobacteria strongly increased in relative abundance during stagnation, whereas the relative proportions of Bacteroidia and Ignavibacteria strongly decreased. On genus level, NMD1 Gammaproteobacteria and Acidimicrobia strongly increased during stagnation, whereas the relative abundance of unclassified OPS 17 (Bacteroidia) strongly decreased. Different incubation temperatures thus shaped the bacterial community compositions in different ways.
Discussion
The obtained data demonstrates that the microorganisms in different parts of the premise plumbing system are adapted to the ambient temperatures. Different populations could be distinguished on the basis of their regrowth behaviors at different temperatures. The extent of regrowth owed itself to the coincidence that ultrafiltration modules had been installed in the buildings that were sampled. While bacteria are removed by ultrafiltration, the dissolved nutrients that form the basis for regrowth are not withheld and enable regrowth (Nocker et al., 2020). Data from three different DWDS in different cities suggested that bacteria from central hot water sampling points tended to show substantial regrowth at 50°C and at 36°C, whereas no significant regrowth was typically obtained at 22°C. Bacteria in cold-water samples on the other hand tended to reach higher concentrations when samples were incubated at 22°C compared to 36°C. No regrowth was obtained when incubating samples at 50°C.
Cold and hot water from taps in the periphery used to retrieve both cold and hot water showed intermediate regrowth behaviors, meaning the sampled water contained bacteria adapted to both temperature extremes, although to different extents. These bacteria could possibly originate from biofilms adhered to the surfaces within the taps and that could serve as a microbial source from which seeding of the water takes place. This could explain the introduction of thermotolerant bacteria into POU-cold water. Seeding of inflowing hot water might already take place earlier in the distal hot water pipes leading to the periphery. Distal tap environments had been reported previously to be distinct from that of recirculating lines as the occasionally inflowing hot water stagnates and cools down to ambient temperatures (Ji et al., 2017). Distal parts of the hot water pipes are only intermittently exposed to heat shock, after which water temperatures rapidly drop and remain low at ambient temperatures for extended periods of time depending on water usage. The microbiome in the distal part of hot water pipes is both adapted to intermittent heat shock and extended periods of room temperature during stagnation. When sampling hot water from this tap, the water was probably “naturally spiked” with cold-water bacteria even if not artificially supplemented. The regrowth characteristics at 22°C of the spiked and non-spiked POU-hot sample were thus the same (Figure 5). Overall regrowth thus strongly depended on (i) the initial temperature of the water sample, (ii) the incubation temperature during regrowth, and (iii) the local conditions present at the sampling sites.
When comparing the four different buildings, building D was exceptional in regard to the lack of regrowth at 50°C. The hot water obviously did not contain bacteria capable of replication at this elevated temperature. The reason was seen in the fact that at the time point of sampling the domestic plumbing system of the building had been in use for only 11 months. This time might not have been sufficient to establish a bacterial community adapted to the ambient hot temperatures at 60°C. Maybe more importantly, the central hot water circulation system was subject to weekly thermal disinfections at 70°C. These conditions were seen as the reason for the lack of regrowth at 50°C.
Selective temperature-dependent growth of hot and cold-water bacteria has also been reported when studying a domestic water system in a Danish apartment building (Bagh et al., 2004). Heterotrophic plate counts in hot water samples (55–60°C) from various sampling sites were substantially higher when plates were incubated at 55 or 65°C (105 CFU/ml) compared to incubation at 25 or 37°C (103-104 CFU/ml). For cold water (10°C) supplying the hot water system, HPC colonies were obtained at 25 and 37°C, but not after incubation at 55 or 65°C.
When assessing the microbiota of these different samples, a strong difference in bacterial diversity was observed (Figure 7C, Supplementary Table S1). Greatest diversity was seen in cold water from POE. Stagnation of cold water led to a loss of diversity as seen for POUCold samples in comparison with POE water. Hot water at either sampling point revealed much less diversity. This observation is consistent with previous reports on less diversity in hot drinking water compared to cold water (Henne et al., 2013). Significantly lower bacterial diversity was also reported for bathroom hot tap water compared to cold tap water (Zhang et al., 2021). Apart from a decrease in diversity with higher water temperatures, the study also showed an increase of diversity with the age of the DWDS (Zhang et al., 2021). The latter would explain that in case of building D no regrowth was obtained in our study at 50°C as the plumbing system was too new to allow the establishment of a thermophilic bacterial community. The fact that an ultrafiltration unit was present at the POE of this building from the first time point of operation of the plumbing system might have prevented the establishment of a heat-resistant population.
Abundant bacterial classes identified in our study in hot water included Deinococci, Kryptonia, Ignavibacteria, Nitrospiria, Gemmatimonadetes, and different genera of Gammaproteobacteria (unclassified Hydrogenophilaceae, unclassified Comamonadaceae, Extensimonas, Methyloversatilis, MND1). Deinococci are known to be one of the most extremophilic bacterial classes (Theodorakopoulos et al., 2013) and have been identified as prominent class in hot drinking water kept at 51 or 58°C (Ji et al., 2017; Dai et al., 2018). The novel class Kryptonia has been found in high-temperature geothermal springs (Eloe-Fadrosh et al., 2016). Also Ignavibacteria (Iino et al., 2010), ammonia-oxidizing Nitrospira (Daims et al., 2015) and Gemmatimonadetes (Ma et al., 2020) have been identified in hot water environments. A comparison with other studies showed however that some taxa prominent in hot drinking water were absent. Henne et al. (2013) described that the hot drinking water community in a different German city (Braunschweig) was dominated by five taxonomic groups that were mostly affiliated with high temperature habitats: Betaproteobacteria, Acidobacteria, Alphaproteobacteria, Bacteroidetes, and Planctomycetes. In hot tap water in the United States, the total relative abundance of the top five most abundant phyla (Proteobacteria, Actinobacteria, Bacteroidetes, Cyanobacteria, and Firmicutes) was >90% among the 24 identified phyla (Zhang et al., 2021) The community compositions were thus distinct from our hot water samples. In agreement with those and other studies (Ma et al., 2020), however, was a distinct difference between the bacterial community compositions of cold and hot drinking water. Temperature had been reported to have an “overarching influence” on the microbial composition (Proctor et al., 2017). When examining different biotic and abiotic factors in simulated hot water DWDS in the temperature range from 32 to 53°C, different bacteria were enriched at different temperatures. For example a shift in the microbiota observed when raising temperatures to 53°C was mostly attributed to Firmicutes. Also Actinobacteria were reported to be enriched at this temperature. On the other hand, some operational taxonomic units were present at all temperatures. This taxonomic core accounted for 50% of all operational taxonomic units (OTUs) from 32 to 49°C and for 20% at 53°C. The authors concluded that temperature shifts as little as 4°C induce shifts in the hot water microbial community structure. When examining only cold and moderately warm water (up to 35°C), another study assigned more importance to the residence time than to temperature in their impact on bacterial community compositions (Moermann et al., 2014). Temperature was on the other hand reported to have more impact on the microbiome than pipe materials (Aloraini et al., 2023).
The temperature of 51°C was seen as a critical threshold for drinking water demarcating a transition from a mesophilic to a thermophilic environment (Ji et al., 2017). For distal taps where hot water typically cools down, the bacterial communities had interestingly been reported to display a noticeable overlap with the ones from influent cold water and recirculating hot water (Ji et al., 2017). The majority of OTUs of distal tap bulk water was shared (82/106 OTUs) with recirculating hot water. The overlap of microbiota at POU sampling sites would be in agreement with the intermediate regrowth characteristics of water from the periphery measured in our study.
Other important factors that influence the microbial community composition in DWDS and were not considered in our study include pipe materials (Proctor et al., 2017; Neu and Hammes, 2020), AOC availability (Proctor et al., 2017), the raw water type used for drinking water production (Henne et al., 2013) and water use and stagnation (Zhang et al., 2015; Zlatanović et al., 2017; Ling et al., 2018). For cold water, the bacterial community composition was even reported to undergo diurnal changes which are specific to individual sampling points and probably due to hydraulic changes caused by changes in water demand (Henne et al., 2013; Bautista-de los Santos et al., 2016). As a common denominator for all these studies, it becomes increasingly evident that microbial ecology serves as the basis to explain much of the microbial characteristics of drinking water. The impact of water temperature as one of the factors influencing the microbial ecology is hereby not limited to bulk water, but also affects biofilms (Buse et al., 2017; Ji et al., 2017; Dai et al., 2018). Improving our knowledge base on microbial communities and their dependence on physical, chemical and biological parameters in their ambient environment is an ultimate challenge in microbiology and potentially opens up the opportunity to shape microenvironments in a way that hygienic problems are prevented (Bruno et al., 2022). Pathogens can only thrive in an appropriate environment sustaining their presence. In the last years, the application of the “probiotic” concept of suppressing undesired organisms by providing a robust and biologically stable microbiological community also gains interest in water hygiene (Wang et al., 2013; Cavallaro et al., 2022). Insight into the interrelationships between microbes and their surrounding environment is the basis for the successful and sustainable long-term establishment of such stable communities and possibly pro-active management of plumbing systems in the future.
Conclusions
Distinct microbial populations were identifiable in premise plumbing systems based on their temperature-dependent regrowth behaviors. The rate of regrowth was determined by the original temperature at the sampling site, with peak regrowth observed at either 22°C, 36°C, or 50°C. This pattern suggests that bacterial communities adapt to the specific conditions prevalent at various points within the DWDS. Point of Use (POU) sampling points presented a unique case, as their water seemed to harbor both cold and hot water-adapted bacteria and displayed intermediate regrowth characteristics, independent of whether cold or hot water was sampled. This could be due to POU water samples being naturally seeded with bacteria present in distal taps exposed to both water temperature extremes. For distal hot water pipes, a wide range of temperature adaptations is expected, given these pipes experience intermittent heat shocks from incoming hot water that eventually cools to room temperature during extended stagnation periods.
Microbiome variations among different sampling sites confirmed these observations. Notably, hot water housed several abundant bacterial classes, including Deinococci, Kryptonia, Ignavibacteria, Nitrospiria, Gemmatimonadetes, and various genera of Gammaproteobacteria. A 3-week incubation of hot water at temperatures between 50 and 60°C further altered the microbiome, reflecting adaptations to the ambient conditions during stagnation. Future studies must focus on interpreting the hygienic implications of these findings.
Data availability statement
BioSample sequence metadata are available in the NCBI BioSample database (http://www.ncbi.nlm.nih.gov/biosample/) under accession numbers SAMN35749896 - SAMN35749922.
Author contributions
AN, BB, BM, MH, and MP: concept and design of the study. AN, BM, and BB: writing of the manuscript. BM, MP, and LT: data provision. AS and AP: analysis of sequencing data. All authors contributed to the article and approved the submitted version.
Funding
We thank the German Federal Ministry of Economic Affairs and Climate Action (BMWK) that financed this study as part of the ULTRA-F (Ultrafiltration as element of energy efficiency in drinking water hygiene, 2018–2023) project under grant no. 03ET1617D.
Acknowledgments
Denise Windrich and Dietmar Pütz from IWW are gratefully acknowledged for sample preparation and technical analysis.
Conflict of interest
The authors declare that the research was conducted in the absence of any commercial or financial relationships that could be construed as a potential conflict of interest.
Publisher's note
All claims expressed in this article are solely those of the authors and do not necessarily represent those of their affiliated organizations, or those of the publisher, the editors and the reviewers. Any product that may be evaluated in this article, or claim that may be made by its manufacturer, is not guaranteed or endorsed by the publisher.
Author disclaimer
All claims expressed in this article are solely those of the authors and do not necessarily represent those of their affiliated organizations, those of the organizations of the research consortium or of the funding agency.
Supplementary material
The Supplementary Material for this article can be found online at: https://www.frontiersin.org/articles/10.3389/frwa.2023.1119951/full#supplementary-material
Supplementary Figure S1. Relative abundance of the bacterial phlya in the drinking water at different locations in the DWDS. Schematic presentation of the DWDS with dark blue color representing cold water at POE and red color representing hot water. Light blue and orange colors indicate distal taps at sampling points in the periphery. Black arrows indicate the direction of flow of the hot water circulation. Samples were taken from the point of entry (POE), water heater exit (WHE), water heater circulation return (WHR), the cold (C) and hot (H) at the point of use (POU) of the ascending pipe 1–6, and at the hot water circulation (HWC). Only Taxa with >1% abundance are shown.
Supplementary Figure S2. Relative abundance of the bacterial genera in the drinking water at different locations in the DWDS. Schematic presentation of the DWDS with dark blue color representing cold water at POE and red color representing hot water. Light blue and orange colors indicate distal taps at sampling points in the periphery. Black arrows indicate the direction of flow of the hot water circulation. Samples were taken from the point of entry (POE), water heater exit (WHE), water heater circulation return (WHR), the cold (C) and hot (H) at the point of use (POU) of the ascending pipe (AP) 1–6, and at the hot water circulation (HWC). Taxa <1% of each sample were removed.
Supplementary Figure S3. Relative abundance of the bacterial phyla in cold and hot drinking water at the time point of sampling and in hot drinking water after a 3 week stagnation at 50°C, 55°C, or 60°C. Cold water was sampled at the point of entry (POE) and hot water at the water heater exit (WHE). Taxa <1% of each sample were removed.
Supplementary Figure S4. Relative abundance of the bacterial genera in cold and hot drinking water at the time point of sampling and in hot drinking water after a 3 week stagnation at 50°C, 55°C, or 60°C. Cold water was sampled at the point of entry (POE) and hot water at the water heater exit (WHE). Taxa <1% of each sample were removed.
References
Aloraini, S., Alum, A., and Abbaszadegan, M. (2023). Impact of pipe material and temperature on drinking water microbiome and prevalence of Legionella, Mycobacterium, and Pseudomonas species. Microorganisms 11, 352. doi: 10.3390/microorganisms11020352
Bagh, L. K., Albrechtsen, H. J., Arvin, E., and Ovesen, K. (2004). Distribution of bacteria in a domestic hot water system in a Danish apartment building. Water Res. 38, 225–235. doi: 10.1016/j.watres.2003.08.026
Bautista-de los Santos, Q. M., Schroeder, J. L., Blakemore, O., Moses, J., Haffey, M., Sloan, W., et al. (2016). The impact of sampling, PCR, and sequencing replication on discerning changes in drinking water bacterial community over diurnal time-scales Water Res. 90, 216–224. doi: 10.1016/j.watres.2015.12.010
Bruno, A., Agostinetto, G., Fumagalli, S., Ghisleni, G., and Sandionigi, A. (2022). It's a long way to the tap: microbiome and DNA-based omics at the core of drinking water quality. Int. J. Environ. Res. Public Health 19, 7940. doi: 10.3390/ijerph19137940
Bruno, A., Sandionigi, A., Bernasconi, M., Panio, A., Labra, M., Casiraghi, M., et al. (2018). Changes in the drinking water microbiome: effects of water treatments along the flow of two drinking water treatment plants in a urbanized area, Milan (Italy). Front. Microbiol. 31, 2557. doi: 10.3389/fmicb.2018.02557
Buse, H. Y., Ji, P., Gomez-Alvarez, V., Pruden, A., Edwards, M. A., Ashbolt, N. J., et al. (2017). Effect of temperature and colonization of Legionella pneumophila and Vermamoeba vermiformis on bacterial community composition of copper drinking water biofilms. Microb. Biotechnol. 10, 773–788. doi: 10.1111/1751-7915.12457
Callahan, B., McMurdie, P., Rosen, M., Han, A. W., Johnson, A. J. A., Holmes, S. P., et al. (2016). DADA2: high-resolution sample inference from Illumina amplicon data. Nat. Methods 13, 581–583. doi: 10.1038/nmeth.3869
Cavallaro, A., Rhoads, W. J., Huwiler, S., Stachler, G., and Hammes, E. F. (2022). Potential probiotic approaches to control Legionella in engineered aquatic ecosystems. FEMS Microbiol. Ecol. 98, 1–9. doi: 10.1093/femsec/fiac071
Chao, A. (1987). Estimating the population size for capture-recapture data with unequal catchability. Biometrics 43, 783–791. doi: 10.2307/2531532
Dai, D., Rhoads, W. J., Edwards, M. A., and Pruden, A. (2018). Shotgun metagenomics reveals taxonomic and functional shifts in hot water microbiome due to temperature setting and stagnation. Front. Microbiol. 9, 2695. doi: 10.3389/fmicb.2018.02695
Daims, H., Lebedeva, E. V., Pjevac, P., Han, P., Herbold, C., Albertsen, M., et al. (2015). Complete nitrification by Nitrospira bacteria. Nature 24, 504–509. doi: 10.1038/nature16461
DVGW (German Technical Scientific Association for Gas Water). (2004). Worksheet W 551. Available online at: https://www.beuth.de/de/technische-regel/dvgw-w-551/74193855 (accessed June 21, 2023).
Eloe-Fadrosh, E. A., Paez-Espino, D., Jarett, J., Dunfield, P. F., Hedlund, B. P., Dekas, A. E., et al. (2016). Global metagenomic survey reveals a new bacterial candidate phylum in geothermal springs. Nat. Commun. 7, 10476. doi: 10.1038/ncomms10476
Gatza, E., Hammes, F., and Prest, E. (2013). Assessing Water Quality with the BD AccuriTM C6 Flow Cytometer. Ann Arbor, MI: BD Biosciences. Available online at: https://www.bdbiosciences.com/content/dam/bdb/marketing-documents/Accuri-C6-DS-Eawag-Water-Quality-Template.pdf (accessed June 22, 2023).
Henne, K., Kahlisch, L., Höfle, M. G., and Brettar, I. (2013). Seasonal dynamics of bacterial community structure and composition in cold and hot drinking water derived from surface water reservoirs. Water Res. 47, 5614–5630. doi: 10.1016/j.watres.2013.06.034
Iino, T., Mori, K., Uchino, Y., Nakagawa, T., Harayama, S., Suzuki, K. I., et al. (2010). Ignavibacterium album gen. nov., sp. nov., a moderately thermophilic anaerobic bacterium isolated from microbial mats at a terrestrial hot spring and proposal of Ignavibacteria classis nov., for a novel lineage at the periphery of green sulfur bacteria. Int. J. Syst. Evol. Microbiol. 60, 1376–1382. doi: 10.1099/ijs.0.012484-0
Ji, P., Rhoads, W., Edwards, M., and Pruden, A. (2017). Impact of water heater temperature setting and water use frequency on the building plumbing microbiome. ISME J. 11, 718–729. doi: 10.1038/ismej.2017.14
Lautenschlager, K., Boon, N., Wang, Y., Egli, T., and Hammes, F. (2010). Overnight stagnation of drinking water in household taps induces microbial growth and changes in community composition. Water Res. 44, 4868–4877. doi: 10.1016/j.watres.2010.07.032
Ley, C. J., Proctor, C. R., Singh, G., Ra, K., Noh, Y., Odimajomi, T., et al. (2020). Drinking water microbiology in a water-efficient building: stagnation, seasonality, and physicochemical effects on opportunistic pathogen and total bacteria proliferation. Environ. Sci. Water Res. Technol. 6, 2902–2913. doi: 10.1039/D0EW00334D
Ling, F., Whitaker, R., LeChevallier, M. W., and Liu, W. T. (2018). Drinking water microbiome assembly induced by water stagnation. ISME J. 12, 1520–1531. doi: 10.1038/s41396-018-0101-5
Lipphaus, P., Hammes, F., Kötzsch, S., Green, J., Gillespie, S., Nocker, A., et al. (2014). Microbiological tap water profile of a medium-sized building and effect of water stagnation. Environ. Technol. 35, :620–628. doi: 10.1080/09593330.2013.839748
Ma, X., Pierre, D., Bibby, K., and Stout, J. E. (2020). Bacterial community structure correlates with Legionella pneumophila colonization of New York City high rise building premises plumbing systems. Environ. Sci. Water Res. Technol. 6, 1324–1335. doi: 10.1039/C9EW01084J
Martin, M. (2011). Cutadapt removes adapter sequences from high-throughput sequencing reads. EMBnet J. 17, 10–12. doi: 10.14806/ej.17.1.200
McMurdie, P. J., and Holmes, S. (2013). Phyloseq: an R package for reproducible interactive analysis and graphics of microbiome census data. PLoS ONE 8, e61217. doi: 10.1371/journal.pone.0061217
Moermann, A., Blokker, M., Vreeburg, J., and van der Hoek, J. P. (2014). Drinking water temperature modelling in domestic systems. Procedia Eng. 89, 143–150. doi: 10.1016/j.proeng.2014.11.170
Montagnino, E., Proctor, C. R., Ra, K., Ley, C., Noh, Y., Vigil, K., et al. (2022). Over the weekend: Water stagnation and contaminant exceedances in a green office building. PLOS Water 1, e0000006. doi: 10.1371/journal.pwat.0000006
Neu, L., and Hammes, F. (2020). Feeding the building plumbing microbiome: the importance of synthetic polymeric materials for biofilm formation and management. Water 12, 1774. doi: 10.3390/w12061774
Nocker, A., Schulte-Illingheim, L., Müller, H., Rohn, A., Zimmermann, B., Gaba, A., et al. (2020). Microbiological changes along a modular wastewater reuse treatment process with a special focus on bacterial regrowth. J. Water Reuse Desal. 10, 380–393. doi: 10.2166/wrd.2020.012
Novak Babič, M., Gostinčar, C., and Gunde-Cimerman, N. (2020). Microorganisms populating the water-related indoor biome. Appl. Microbiol. Biotechnol. 104, 6443–6462. doi: 10.1007/s00253-020-10719-4
Pinto, A. J., Xi, C., and Raskin, L. (2012). Bacterial community structure in the drinking water microbiome is governed by filtration processes. Environ. Sci. Technol. 46, 8851–8859. doi: 10.1021/es302042t
Proctor, C. R., Dai, D., Edwards, M. A., and Pruden, A. (2017). Interactive effects of temperature, organic carbon, and pipe material on microbiota composition and Legionella pneumophila in hot water plumbing systems. Microbiome 5, 130. doi: 10.1186/s40168-017-0348-5
Proctor, C. R., and Hammes, F. (2015). Drinking water microbiology–from measurement to management. Curr. Opin. Biotechnol. 33, 87–94. doi: 10.1016/j.copbio.2014.12.014
Shannon, C. E. (1948). A mathematical theory of communication. Bell Syst. Tech. J. 27, 379–423. doi: 10.1002/j.1538-7305.1948.tb01338.x
Theodorakopoulos, N., Bachar, D., Christen, R., Alain, K., and Chapon, V. (2013). Exploration of Deinococcus-Thermus molecular diversity by novel group-specific PCR primers. Microbiol. Open 2, 862–872. doi: 10.1002/mbo3.119
Thom, C., Smith, C. J., Moore, G., Weir, P., and Umer, I. Z. (2022). Microbiome in drinking water treatment and distribution: a critical review and meta-analysis from source to tap. Water Res. 212, 118106. doi: 10.1016/j.watres.2022.118106
Wang, H., Edwards, M. A., Falkinham, J. O., and Pruden, A. (2013). Probiotic approach to pathogen control in premise plumbing systems? A review. Environ. Sci. Technol. 47, 10117–10128. doi: 10.1021/es402455r
Wickham, H. (2016). ggplot2: Elegant Graphics for Data Analysis. New York, NY: Springer-Verlag. doi: 10.1007/978-3-319-24277-4_9
Wickham, H., Averick, M., Bryan, J., Chang, W., McGowan, L. D. A., François, R., et al. (2019). Welcome to the tidyverse. J. Open Source Softw. 4, 1686. doi: 10.21105/joss.01686
Zhang, C., Qin, K., Struewing, I., Buse, H., Santo Domingo, J., Lytle, D., et al. (2021). The bacterial community diversity of bathroom hot tap water was significantly lower than that of cold tap and shower water. Front. Microbiol. 12, 625324. doi: 10.3389/fmicb.2021.625324
Zhang, H. H., Chen, S. N., Huang, T. L., Shang, P. L., Yang, X., Ma, W. X., et al. (2015). Indoor heating drives water bacterial growth and community metabolic profile changes in building tap pipes during the winter season. Int. J. Environ. Res. Public Health 12, 13649–13661. doi: 10.3390/ijerph121013649
Keywords: premise plumbing systems, domestic drinking water distribution, drinking water microbiology, drinking water microbiome, temperature adaptation
Citation: Meyer B, Pannekens M, Soares AR, Timmermann L, Probst AJ, Hippelein M, Bendinger B and Nocker A (2023) Bacterial populations in different parts of domestic drinking water systems are distinct and adapted to the given ambient temperatures. Front. Water 5:1119951. doi: 10.3389/frwa.2023.1119951
Received: 09 December 2022; Accepted: 14 June 2023;
Published: 03 July 2023.
Edited by:
William Rhoads, Swiss Federal Institute of Aquatic Science and Technology, SwitzerlandReviewed by:
Jitendra Keshri, Medgenome Pvt. Ltd, IndiaYun Zhou, Huazhong Agricultural University, China
Francis Hassard, Cranfield University, United Kingdom
Copyright © 2023 Meyer, Pannekens, Soares, Timmermann, Probst, Hippelein, Bendinger and Nocker. This is an open-access article distributed under the terms of the Creative Commons Attribution License (CC BY). The use, distribution or reproduction in other forums is permitted, provided the original author(s) and the copyright owner(s) are credited and that the original publication in this journal is cited, in accordance with accepted academic practice. No use, distribution or reproduction is permitted which does not comply with these terms.
*Correspondence: Andreas Nocker, YS5ub2NrZXJAaXd3LW9ubGluZS5kZQ==; Bernd Bendinger, Yi5iZW5kaW5nZXJAaXd3LW9ubGluZS5kZQ==