 Chamal Perera
 Shinichiro Nakamura
- Department of Civil and Environmental Engineering, Nagoya University, Nagoya, Japan
In rapidly changing human-flood systems, dynamic models can assist with system thinking, policy-making, and response. Previous research has shown that flood memory is important for better responses during disasters. To date, socio-hydrological research has primarily focused on memory accumulation after flood events and the related dynamics and feedback mechanisms. Notably, the impact of risk information has not yet been considered in any modeling exercise. Accordingly, this study improved upon the socio-hydrological model (SHM) by incorporating the impact of risk information on collective memory and associated dynamics. Probable flood maps were used to assess the response of a floodplain community from the Lower Kelani River Basin, Sri Lanka, via two interview surveys conducted at a 6-month interval. The surveys were conducted under two categories: A—after distributing maps and conducting awareness sessions, and B—after showing and distributing flood maps. The results showed that the flood maps helped to improve the risk perception of floodplain communities. Of the two categories, the memory decay process was slower for Category A. Furthermore, the SHM application showed that flood damage in the study area could be reduced by 10–30% when flood maps were distributed, and awareness sessions were conducted at 1–5-yr intervals.
1. Introduction
The impacts of flooding are increasing day by day. Fluvial floods alone have caused more than 200,000 deaths and 790 billion USD in economic damage globally since 1980 (Sauer et al., 2021). Various factors influence these increasing effects, including population, economic growth, and climate change (Mikio and Daisuke, 2021). Accordingly, the increase in these complexities demands that communities respond to these changes in an effective manner by taking either structural or non-structural measures (Fuchs et al., 2017). Numerous studies have shown that a combination of structural and non-structural measures is important to effectively respond to flood hazards (Chitsaz and Banihabib, 2015; Shiru et al., 2015; Chan et al., 2019). The nature of the response, however, depends on the risk perception and financial capabilities of communities and organizations. Previous experience, demographic factors, knowledge, gender, worry and social collective trust have been shown to affect flood risk perception (Ardaya et al., 2017; Lechowska, 2018; Sawada et al., 2022). Importantly, the definition of knowledge includes both experience and study (Cambridge University Press, 2022a). Overall, the knowledge gained from experience and information is important for the risk perception of communities. Memory is the ability to store and retrieve information and experience (Zlotnik and Vansintjan, 2019; Cambridge University Press, 2022b); thus, as knowledge becomes memories, it is important for improved responses during flood disasters.
In most related studies, the term “collective memory” has been used to explain the memory of communities. This concept has been investigated across many subject areas, including sociology, neuroscience, psychology, anthropology, and history (Anastasio et al., 2012); however, a clear definition of this concept remains unavailable (Wertsch and Roediger, 2008). Following the definitions of knowledge and memory, here, collective flood memory is defined as a combination of two factors: (1) Memory based on previous flood experiences (Mex), and (2) Memory based on flood risk information (Min). Different approaches have been used to evaluate the significance of Mex and Min in the context of effective flood responses (Song et al., 2021). The flood memory of floodplain communities decays over time. Ridolfi et al. (2021) explains the evaluation of the memory decay process (Mex) by selecting different half-memory rates. In this approach, half memory rates are selected based on the judgment. Moreover, having quantitative values for Mex, Min, collective memory, and memory decay rates is important for the understanding of socio-hydrological dynamics and implementation of community-based (non-structural) programs.
Research has shown that Mex affects how people respond to disaster situations. Individual memory decay rates can vary based on the individual's education and knowledge; however, when making community-level decisions, quantitative figures related to the entire community must be used. The socio-hydrological model (SHM) of Di Baldassarre et al. (2013) explains a method to assess Mex and associated dynamics using system dynamics. Later, an improved model was developed by incorporating population dynamics (Di Baldassarre et al., 2015). In this model, the changes in floodplain dynamics, such as memory, population density, and levee height were explained based on the intensity of fluvial flood conditions. Although this model has been applied to various case studies worldwide (Ciullo et al., 2017; Di Baldassarre et al., 2017, 2019; Pande and Sivapalan, 2017; Albertini et al., 2020; Ridolfi et al., 2021; Perera and Nakamura, 2022; Shibata et al., 2022), no method to measure the exact memory decay process has been proposed.
On the other hand, the Min is also important to improve risk perception in floodplain communities. Min can be improved using various methods, including flood maps, warning messages, books, leaflets, drills, education, and awareness sessions. Most studies to date have mainly focused on flood risk maps, as they offer a convenient method to convey information to the public. Accordingly, Houston et al. (2019) revealed how flood hazard maps beneficially affect risk perception using a questionnaire survey to measure the risk awareness (on a scale from 1 to 7) of people before and after seeing a 100-yr flood risk map. Retchless (2018) similarly explored the use of maps to evaluate risk perception related to sea level rise and showed that respondents who had doubts regarding climate change had a larger increase in risk perception following the surveys. According to Sanders et al. (2020), risk awareness and perception are improved by fine-resolution contour maps, rather than maps with flood hazard zones. Apart from these studies, limited research is available on evaluating the impact of flood risk maps. Notably, none of these studies have focused on the decay of memory related to details provided by flood risk maps. Apart from that, there are studies related to other aspects of Min, including the effectiveness of drills (Carone et al., 2019), early warnings (Cools et al., 2016), education (Scolobig et al., 2012; Cvetković et al., 2018), and social media (Li et al., 2017) on improving efficient flood response. Comparatively, the present study focuses solely on the effects of flood maps on improving Min, and thereby collective memory.
Flood risk information (FRI) is important for improving collective memory; however, to date, no studies have evaluated the collective memory (Mex + Min) of floodplain communities. Instead, socio-hydrological studies have focused on Mex for the conceptualization of floodplain dynamics, and the impact of Min has largely not been considered. Notably, extensive research and implementations related to FRI have been conducted around the world using different methods. Predictions from various modeling methods are important in communicating FRI to society; however, the connection between FRI and its impacts on society is yet to be conceptualized, a paramount step when investigating whether Min is significant in improving collective flood memory. To answer this question, the present study was designed with two objectives in mind: (i) Establish a connection between FRI and social dynamics using socio-hydrological modeling and (ii) Quantify the impacts of awareness sessions and demographic factors on collective flood memory and risk perception.
When assessing collective memory, the evaluation of all aspects of Min is a difficult task; yet, it remains possible to measure the response of the communities regarding the details in the flood maps. Accordingly, the aim here was to quantitatively evaluate the collective flood memory of a floodplain community based on the memory of past floods and flood map content, as well as propose suitable strategies for improving Min. It was hypothesized that Min was also significant compared to Mex in improving the risk perception of communities. To this end, flood risk maps for the study area were developed and distributed to a sample population, before assessing their responses. Furthermore, the community's memory of past flood events was assessed. Later, a follow-up survey was conducted after 6 months to evaluate the community memory regarding the contents of the maps. Based on these responses, the memory decay process was evaluated, and a method was proposed to calculate the collective flood memory of the community. Finally, an improved SHM was applied to the Lower Kelani River Basin, Sri Lanka (LKRB) to showcase the floodplain dynamics under different frequencies of awareness programs, as the present authors believe that understanding such dynamics is important to explaining human-flood interactions, planning flood risk awareness programs, and communicating FRI. Overall, the interdisciplinary approach used here connects the FRI (FLOODS), which was generated based on flood modeling results, with society (HUMAN) using interview surveys, and the connection was conceptualized using an SHM.
2. Materials and methods
2.1. Study area
The Kelani River originates in the central hills of the country, and it is the 4th longest river in Sri Lanka, with a total length of 145 km (Figure 1). The total area of the Kelani River Basin is 2,230 km2 (3.4% of the total land area of the country). The Kelani River flows through Colombo, the financial capital of Sri Lanka, and meets the sea in northern part of Colombo. The Kelani River Basin can be broadly divided into two parts: the Upper Kelani River Basin (UKRB), and the LKRB, based on the topography of the basin. The upper part is montane, while the lower part has a flat terrain. This study was conducted in the worst flood-affected regions of the LKRB.
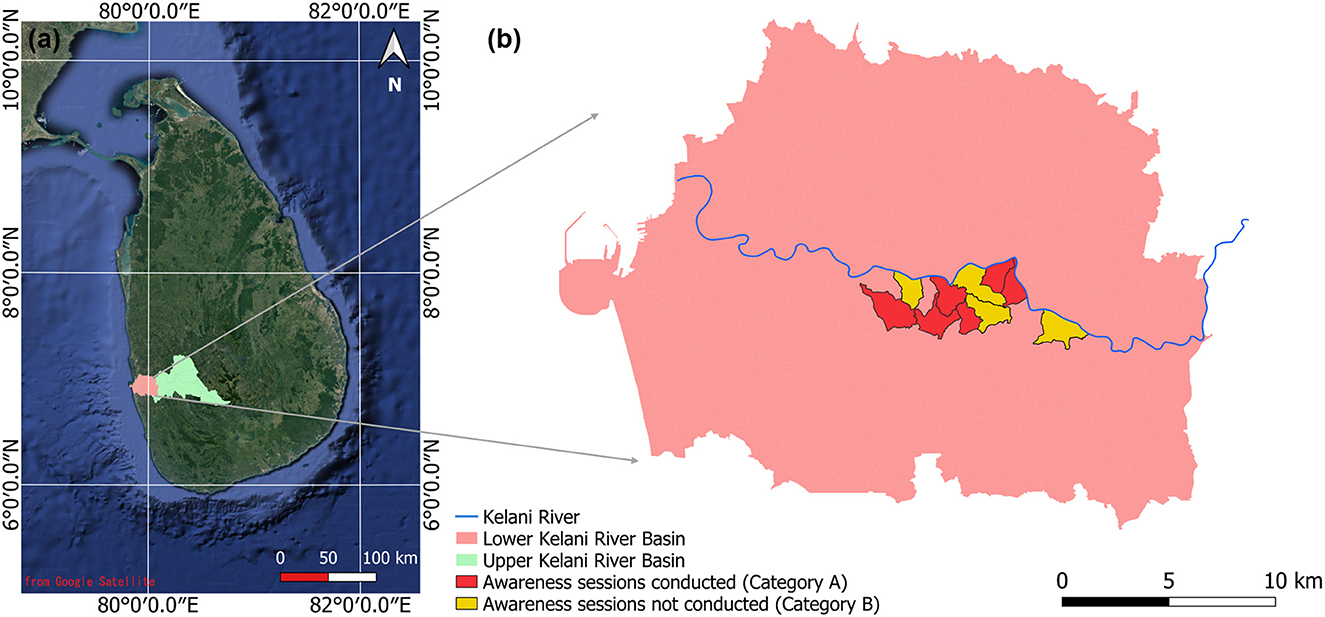
Figure 1. (a) Location of Kelani River Basin in Sri Lanka, (b) area selected for conducting the questionnaire survey.
Surveys were conducted across 10 “Grama Niladhari Divisions” (GNDs) in the LKRB. In Sri Lanka, a GND is the smallest administrative division. Notably, these selected divisions suffered severe damages during past flood events, and were therefore selected for the surveys. The total area of the LKRB is 480 km2 (20% of Kelani River Basin), in which 10% of the country's population resides. Historically, this area has suffered from multiple devastating floods, causing extensive economic damages, disrupting peoples' lives, and causing numerous fatalities (UNDRR, 2022).
2.2. Methodology
Section 2.2. describes brief details about flood modeling, flood map development, questionnaire survey procedure, method of calculating the collective flood memory, SHM details, as well as the variables and parameters of the SHM. Figure 2 shows a flowchart of the methodology.
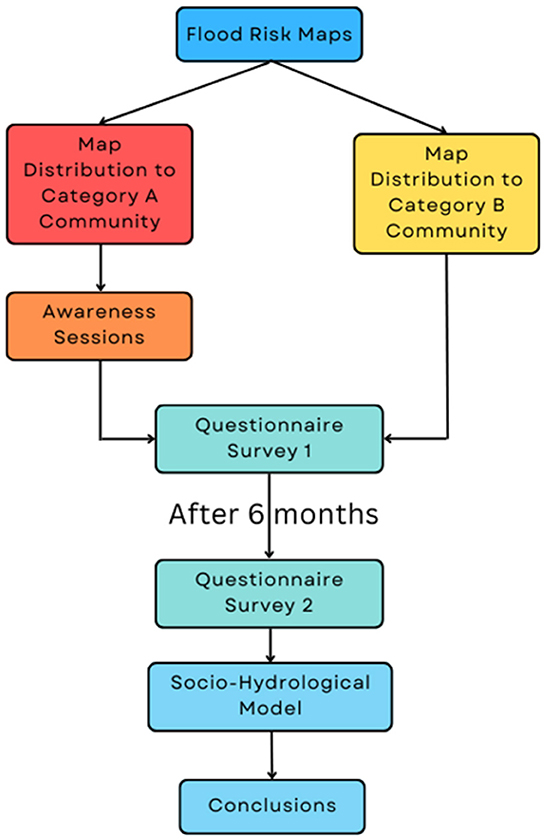
Figure 2. Methodology flow chart.
2.2.1. Flood modeling
Flooding in the LKRB occurs due to the interrelation of many factors: higher rainfall in the UKRB causes exceedance of the river capacity, an overall higher rainfall in the LKRB, initial wet conditions cause initial rainfall losses to decrease, and high sea water levels create backwater effects. In the recent past, the most devastating flood occurred in 2016, followed by substantial flooding events in 2017 and 2018; however, to date, official flood risk maps are not available for the LKRB. Therefore, the first part of this study developed probable flood risk maps with different return periods for the study area. First, the daily rainfall values of the UKRB for a 41-yr period (1980–2020) were analyzed. Next, 1–5 days of maximum annual rainfall values were fitted using 10 probability distributions, and based on the Kolmogorov–Smirnov (KS) statistics test, the generalized logistic (GLO) function was identified as the best fit. The UKRB was modeled using Hydrologic Engineering Center–Hydrologic Modeling System (HEC–HMS) v.4.8 for a period of 11 days, including 3 days prior to and after the maximum flow conditions. The model was calibrated based on the water levels at the Hanwella Gauge Station (sink of the UKRB) for the 2017 flood condition, and validated considering the 2016 and 2018 flood conditions. Based on the GLO function, the rainfall values for 10-, 50-, and 100-yr return periods were determined, and model simulations were used to calculate the flow rates at Hanwella. This served as the flow input for the hydrodynamic model simulating the downstream part of Hanwella in the LKRB.
Hydrologic Engineering Center–River Analysis System (HEC–RAS) v.6.1 was used to model the LKRB. A digital elevation model (DEM) with a 1 m resolution was used for model construction. The model was calibrated and validated considering the 2016, 2017, and 2018 flood events. To validate the model, the flood extent maps of the Survey Department, Sri Lanka (based on ground observations after flood conditions), and satellite imagery (Sentinel-1 and RISAT-1) were used. Subsequently, simulations were performed to determine 10-, 50-, and 100-yr flood conditions. Final flood maps were prepared using QGIS v.3.16. Figure 3 shows the 100-yr flood risk maps of the LKRB and the Pahala Bomiriya A administrative division. Similarly, high-resolution maps were created for each of the 10 administrative divisions for 10-, 50-, and 100-yr return period flood events. The details of the flood map preparation process are provided in the Supplementary material 1.

Figure 3. (a) Flood map of the LKRB, Sri Lanka for 100-yr return period flood events, (b) flood map of the Pahala Bomiriya A Division of the LKRB, Sri Lanka for 100-yr return period flood events.
2.2.2. Flood risk map development
Flood map details should be carefully designed so that people can easily understand their contents; thus, the presentation method is important for risk communication, and it must be presented in a way that improves memorability by constructing a mental representation (Dransch et al., 2010). The selection of colors is important, as certain colors can trigger certain motivations (Kummer and Mendling, 2021). According to Elliot et al. (2007), red is associated with danger and evokes avoidance motivation; therefore, in the present color schemes, red was used to represent the areas with the highest inundation depths. Furthermore, yellow is also closely related to avoidance motivation. To show lower inundation depths, green was used, as green and red are considered opposites in many color models (Fehrman and Fehrman, 2018).
As the ability of people to understand the concept of probable flood risk is less likely, the expected flood risk is further explained using another terminology: flood event with a 10-yr return period—medium scale flood, flood event with a 50-yr return period—large scale flood, flood event with a 100-yr return period—maximum scale flood. In the maps, both terms were used to explain the probability and magnitude of the expected events.
2.2.3. Questionnaire survey procedure
This study is based on results of two surveys conducted in the LKRB, Sri Lanka. The purpose of the surveys was to evaluate the Mex, Min, collective flood memory, and risk perception of the people. Furthermore, the impacts of demographic factors on flood memory and risk perception were also evaluated. The questionnaire was prepared based on the existing literature, and a pilot survey was conducted in the study area to finalize the questions. The first questionnaire included 27 items, while the second included 15 items (The questions from the surveys relevant to this study are attached with the Supplementary material 2). Most questions were designed with answers on a five-point Likert scale, where 5 represents the maximum value, and 1 the minimum. Even though there were different questions types in the surveys, the most important questions were dedicated to evaluating the memories of past flood events, risk information, and risk perception. The research guidelines of the Japan Sociological Society and Nagoya University ethical policy were followed when conducting the questionnaire surveys. All participants provided consent before participation.
A random sampling method was used for the surveys. At the beginning of the first survey, general details of the respondents were collected and questions about past flood events and risk perception were asked. Then flood maps prepared with return periods of 10-, 50-, and 100-yr were distributed with/without detailed explanations. Finally, questions related to the flood maps were asked. The same set of people was interviewed again 6 months after the first survey (April 2022) in October 2022. This interval between surveys was selected to help avoid the occurrence of a flood event in between, which would likely significantly increase the risk awareness of the community, making it difficult to accurately measure the impacts of the flood maps on community risk perception. In the second survey, questions about general details and risk perception were asked, followed by questions related to the content of the flood maps. The survey was conducted under two main categories: (1) Surveys conducted with flood risk awareness sessions (Category A), and (2) Surveys conducted without awareness sessions (Category B). Category A surveys were conducted in Mahadeniya, Kaduwela, Welihinda, Kothalawala, Ihala Bomiriya, and Wekewatta GNDs; whereas Category B surveys were conducted in Pahala Bomiriya A, Pahala Bomiriya B, Raggahawatta, and Ranala GNDs. The selected GNDs were within the Kaduwela Divisional Secretariat Division of the LKRB. Figure 1 shows the areas selected for the surveys, while the procedures adopted in the two survey categories are described in Table 1.
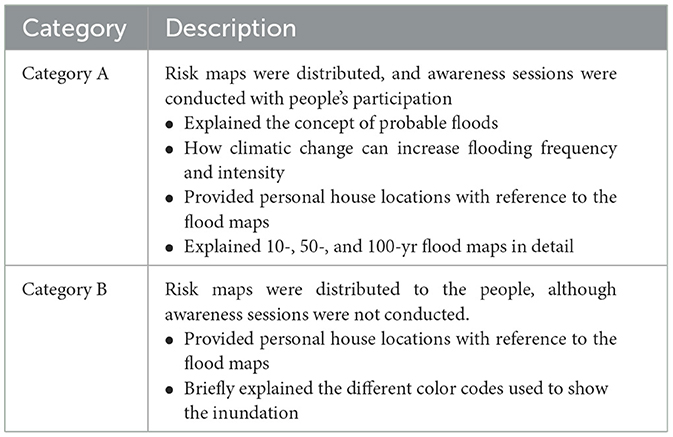
Table 1. Description of the survey process.
A total of 141 responses (Category A, 87; Category B, 54) were received from the first survey, and the same respondents were requested to participate in the second survey; however, only 126 respondents participated in the second round. Of the responses, there were some missing answers in two responses, which were thus removed from the analysis. Accordingly, a total of 124 responses were included in the analysis (Category A, 75; Category B, 49). During the interview process, only one person from each household was selected.
2.2.4. Evaluation of collective flood memory
In this study, memories of past floods were assessed considering the memory of inundation extents, and the memory decay rate was evaluated. The responses from the first survey were used to assess the memory of past floods. There were no official maps to find the inundation extents; hence, the modeled flood maps related to four recent large flood events (2010, 2016, 2017, and 2018) were used instead. Respondents' claims were verified using the modeled flood extents, where if their claims were incorrect, they were regarded as “unaware of the inundation”. The criteria used to evaluate past flood memories are listed in Table 2 (a).
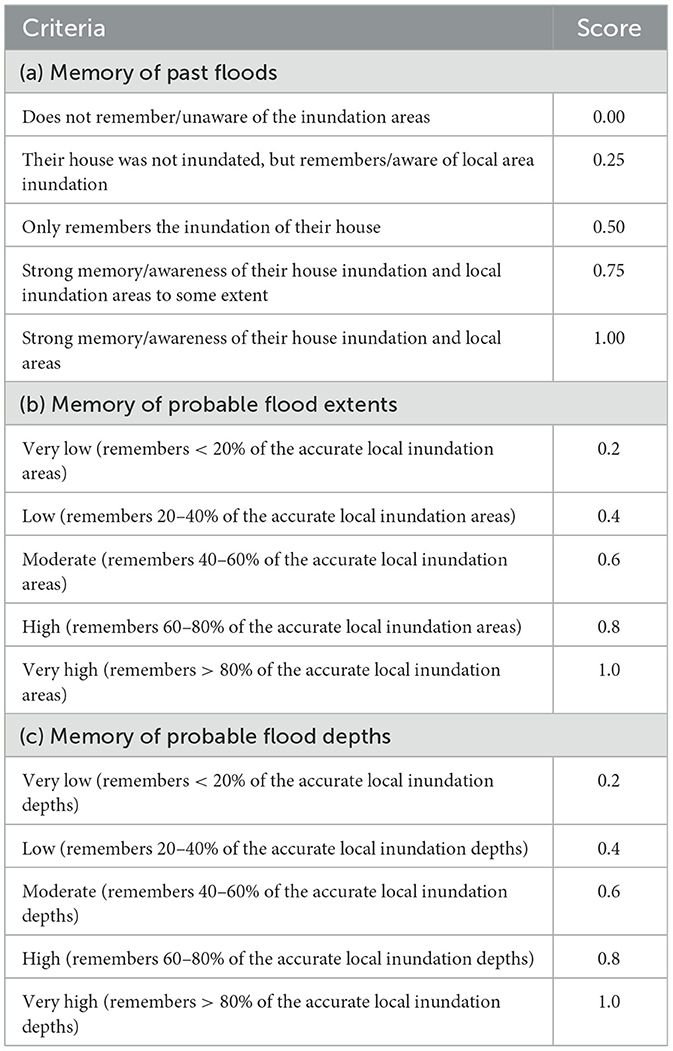
Table 2. Criteria for determining the past flood memory, memory of probable flood extents and depths.
The memory of probable flood inundation areas and depths was assessed based on the criteria explained in Table 2 (b, c). Each respondent was requested to explain the inundation areas and depths of their private land and surrounding neighborhood areas. Based on their explanations, scores were assigned to measure the memory of flood maps.
2.2.5. Socio-hydrological modeling
To date, most of the socio-hydrological modeling studies have used system dynamics modeling (SDM) for concept development. In SDM, the relationships between each variable are shown using causal loop diagrams. Since the inception of socio-hydrology by Sivapalan et al. (2012), various researchers have proposed many causal relationships to understand the feedback mechanism between humans and water systems (Di Baldassarre et al., 2013; Viglione et al., 2014; Albertini et al., 2020; Ridolfi et al., 2021). In SHM, the causality between river flooding, flood memory, levee height, and population density is explained (Di Baldassarre et al., 2015). Based on the causal relationships, equations governing the relationships between each variable were determined, and the parameters were calibrated to perform model simulations. Later, the SHM was modified by Perera and Nakamura (2022) by incorporating the combined impacts of river and urban floods; thus, this study is based on this modified SHM. Here, the effect of FRI on floodplain dynamics were incorporated, and the modified causal relationships are shown in Figure 4. In SHM, the term technology (Figure 4) is used to explain the effect of levee development on floodplain dynamics. In the modified model, the technology term was defined as the combined effects of levee development and FRI.
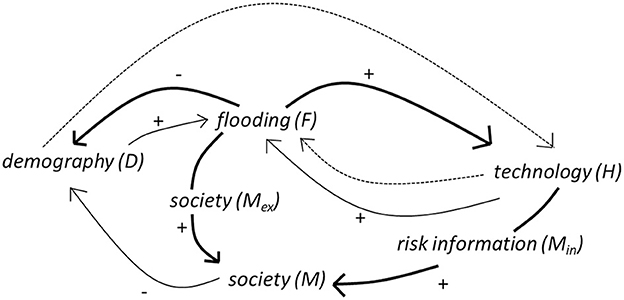
Figure 4. Causal loop diagram of the relationship between combined flooding and technology on the population and flood memory (the concept in the SHM is improved considering the impact of FRI).
In SHM, the river flood intensity was expressed by F1, and the urban flood intensity was expressed by F2. Here, the variables and parameters expressed in Equations (1) and (2) are: W, flood magnitude; ξH, flood level enhancement due to levees; H_, height of the levee before the flood event; H, flood protection level; αH, flood level vs. relative damage relationship; Rf, rainfall; RfT, rainfall threshold; αP1, a parameter related to floodplain conditions during river floods; and, αP2, a parameter related to floodplain conditions for initial dry conditions. All equation variables and parameters are listed in Table 3.
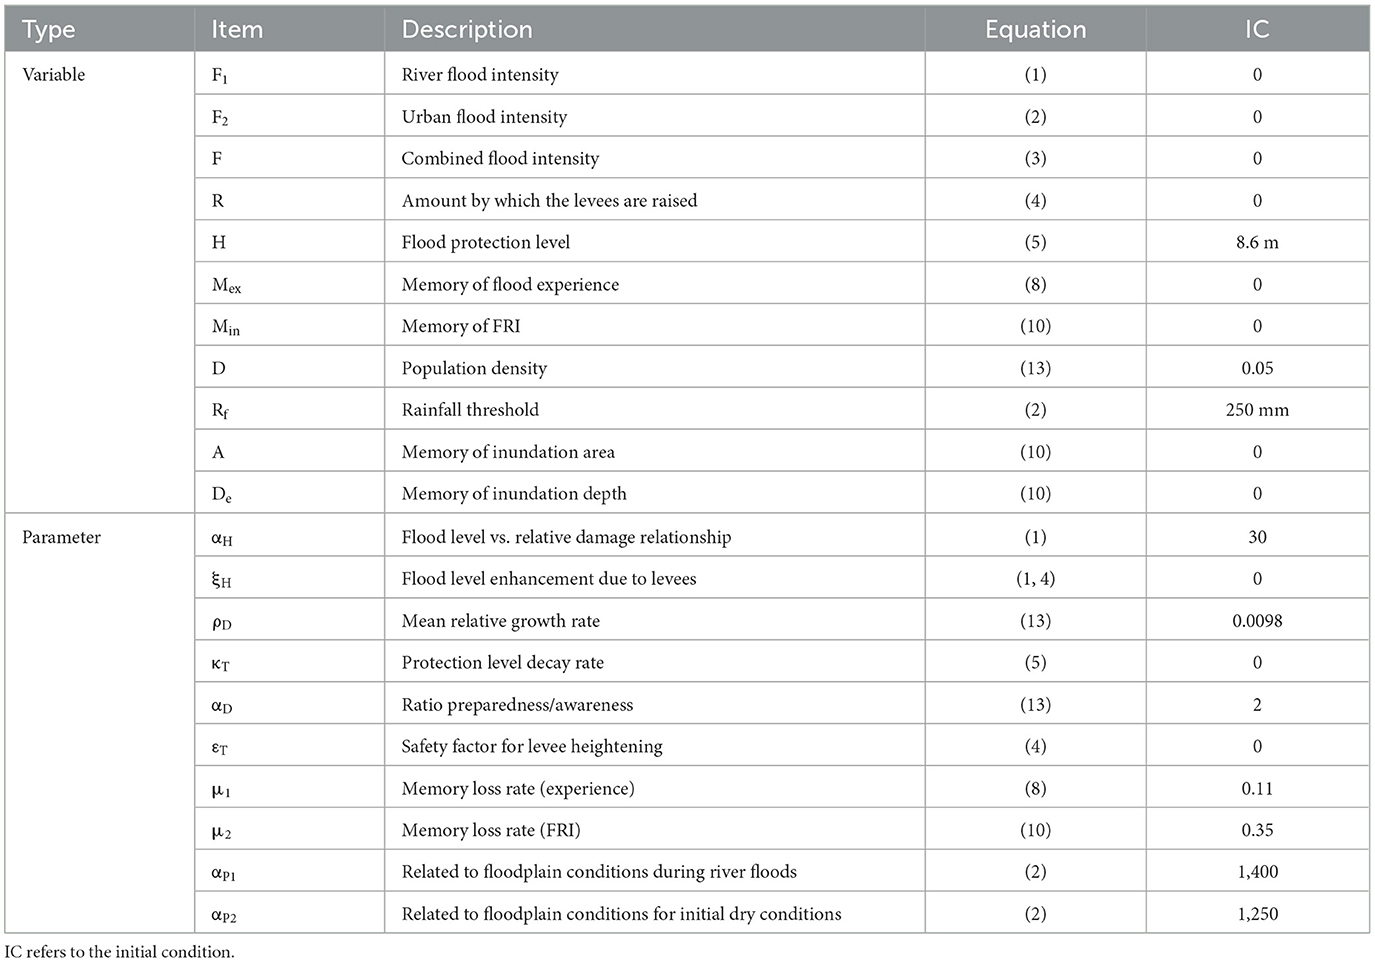
Table 3. Variables and parameters used in the SHM.
The combined flood intensity is defined with F (Equation 3).
The heightening of levees after flood events is expressed by R in Equation (4), where εT is the safety factor for levee heightening. Floodplains with levees are defined as techno societies, while floodplains without levees are defined as green societies.
The Dirac comb (Ψ(t)) is a function with a value of zero, except for instances with exceedances of the flood level. κT is the protection-level decay rate (Equation 5).
The memory decay process has been explained using exponential functions in several studies (Di Baldassarre et al., 2013, 2019; Ridolfi et al., 2021). The change in memory over time was conceptualized using Equation (6), where M' is the memory, N is the initial memory, μ is the memory decay rate, and Δt is time.
The memory decay rate can be calculated by considering the change in memory of an event over time. Accordingly, the memory decay rates here were calculated based on survey responses. Half-life, the time taken to reduce the initial memory to half its value, is an important concept in socio-hydrological studies and was calculated here via Equation (7) (Ridolfi et al., 2021), where, half life time is shown by τ.
In equations, D is the population density. The subscript “_” refers to the time immediately prior to an event, while μ1 represents the decay rate of the memory of the flood event (Equation 8). μ1 was calculated based on the memory of respondents regarding recent past flood events. The memory of each flood event for the entire sample was calculated using the Equation (9), where mf is the memory of a flood event for the entire sample, and Ri represents the score assigned to each response based on the defined method [Table 2 (a)]. The number of responses is denoted by n. In this study, the memory of four recent flood events was used to calculate the memory decay. The calculated memory corresponding to each flood event was plotted against the number of years since the flood event, and a curve for the memory decay process was fitted in the form of Equation (6) to identify the μ1.
In all past studies, the accumulation of collective memory based on flood events has been used to explore other related dynamics (Figure 5A). In the present study, the buildup of collective memory based on the flood experience, FRI, and associated dynamics is explained (Figure 5B). When the content of risk information is considered, the most important attributes are the inundation extent and depth. In this study, the understanding of the flood map's contents was measured based on the memory of the inundation extent and depth related to probable future flood events. Here, the collective memory was defined as M. A and De refer to the memory of the expected inundation area and depth, respectively, and were calculated by averaging the average scores obtained by each respondent for the memory of flood maps [the precise criteria for assigning scores are explained in Table 2 (b, c)]. The Dirac comb (Ψin(t)) is a function with a value of zero, except for instances with risk information dissemination. Further, μ2 represents the decay rate of Min (Equation 10).
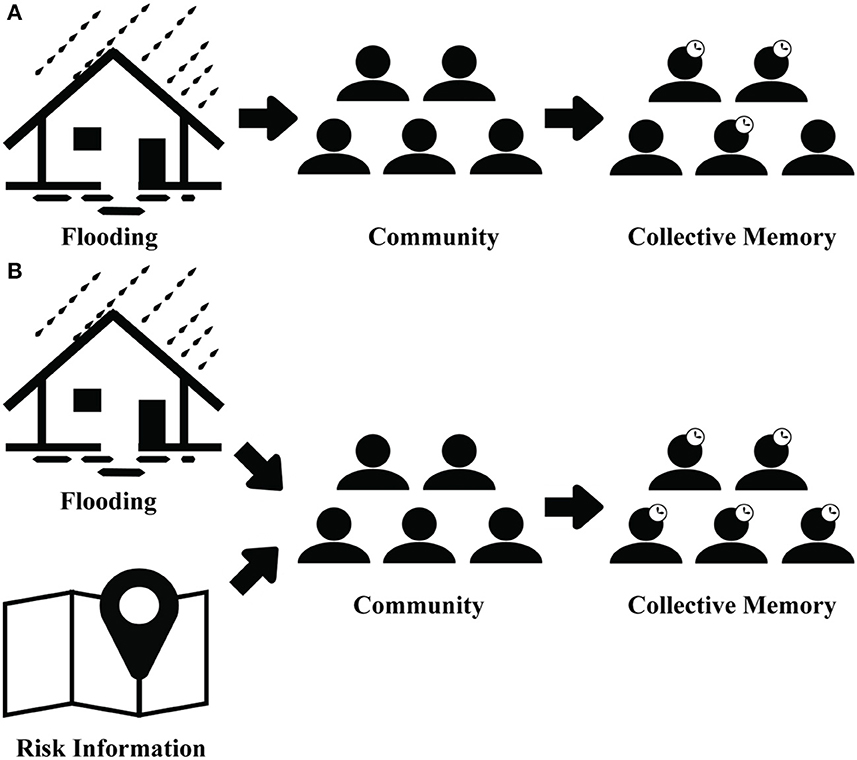
Figure 5. (A) Accumulation of memory resulting from flood experience, (B) accumulation of memory resulting from flood experience and risk information delivered to the population.
Collective memory is a combination of Mex and Min. In Equation (11), α and β are the weights assigned to Mex and Min. The selection of weights is complicated, as the significance of each memory component depends on multiple factors, including the intensity of previous personal experiences, flood knowledge, education level, age, and trust; however, the Mex is the most significant factor affecting the accumulation of collective memory (Di Baldassarre et al., 2015; Ciullo et al., 2017; Ridolfi et al., 2021). As it was necessary to integrate Min into the collective memory, Min was normalized to the range of Mex, and weights were assigned.
People tend to settle away from the river when a flood event occurs, and come close to the river once they have forgotten about the flood risk (Ciullo et al., 2017). This aspect is conceptualized by Equation (12), where ρD is the mean relative growth rate, and αD is the ratio of preparedness/awareness. According to the hypothesis, when future risk information is fed to society, risk perception increases based on their understanding. This aspect is conceptualized in the modified Equation (13). The overall damage caused by floods was conceptualized by flood intensity and population density (F × D).
The variables and parameters of the model were set based on the model validated by Perera and Nakamura (2022). Further, two decay rates were used with Mex and Min. These values were calculated based on the results of two questionnaire surveys. Details and definitions of the variables and parameters are provided in the Supplementary material 3.
3. Results
3.1. Basic details of questionnaire survey
Table 4 presents the basic details of the survey participants. Both males and females participated actively in the survey and awareness sessions. The average age of participants was 48-yr. According to the responses, the level of education of the people in the community was low, with only 8.1% of the respondents having received a certificate/diploma or university education. Of the respondents, 46.0% were either unemployed, retired, or students. Among the unemployed, 87.1% were female, and most of them were housewives. The income level of the majority (60.5%) of the people was below the middle-income category 1, which indicated the monthly income of the household was <53,500 LKR (~$150 USD). Even though the income of the majority of the community was low, 37.9% of the houses were constructed with multiple floors. The frequent flood conditions may have forced the people to construct multi-floors for their protection during the flood conditions. Some respondents mentioned that when local authorities inform them of the threat of flooding, they store their valuable things on the upper floors. Most of the respondents (67.7%) had been living in the area for >10-yr. Further, 66.1% of them had lived for >12-yr, and they were aware of the flood events since 2010. The number of members in each household varied between 1 and 10, with an average household size of 4.4 persons. From the Survey 1, in total, 626 people received flood risk maps, either directly or indirectly.
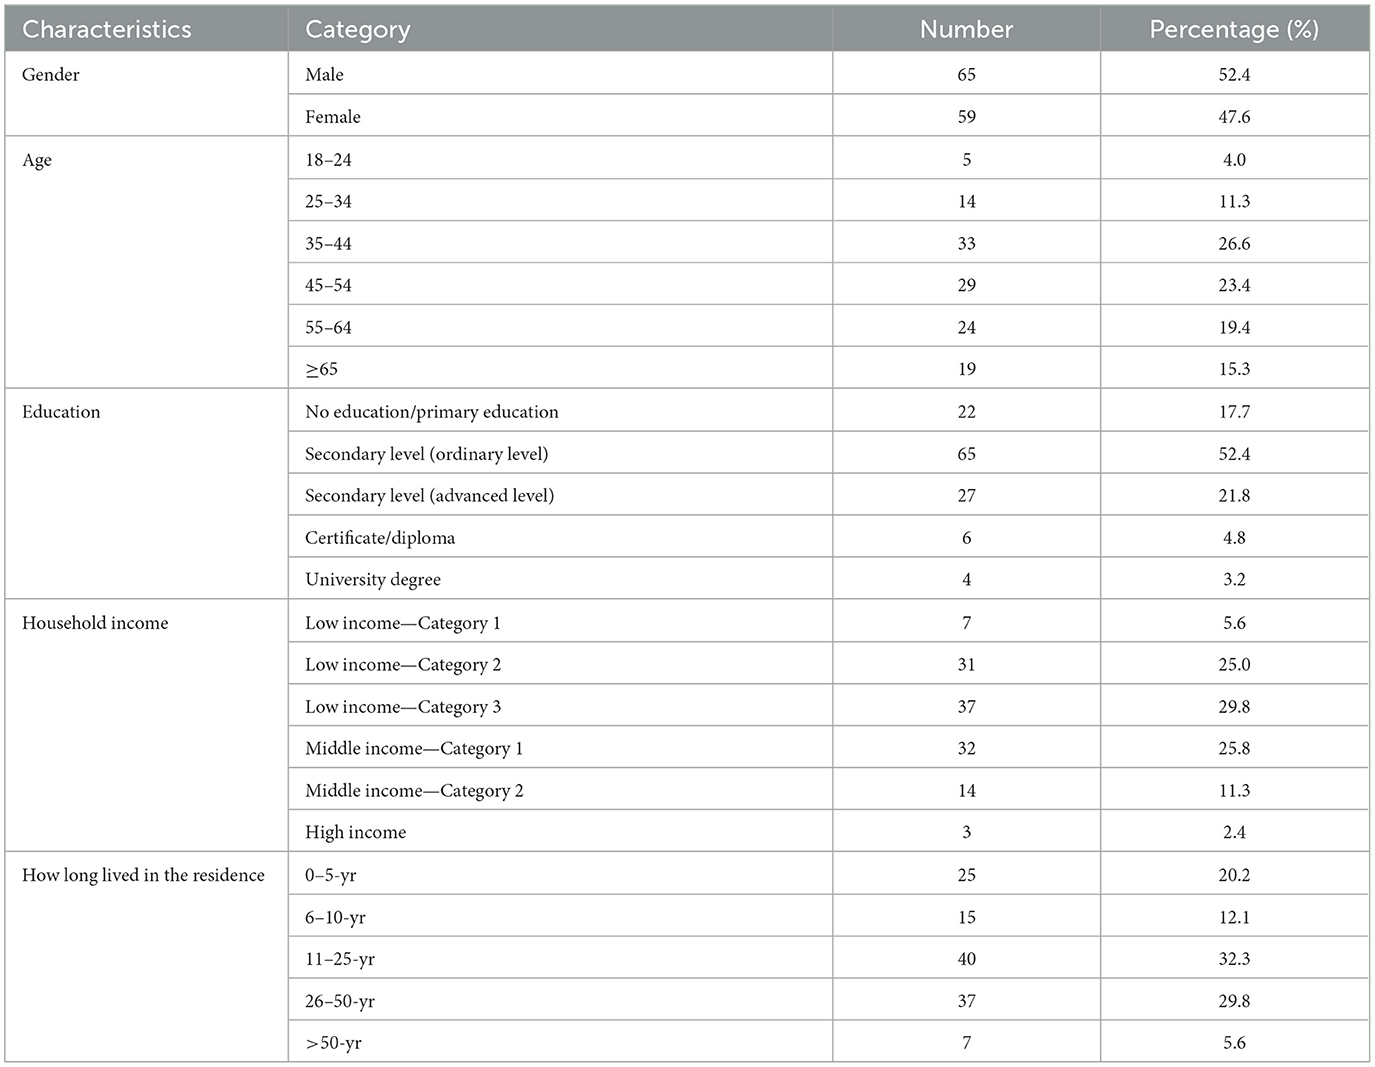
Table 4. Basic details of survey participants (household income levels are based on: Department of Census Statistics-Sri Lanka, 2019).
3.2. Memory of past floods (Mex)
Based on Survey 1, Figure 6A shows the responses received from the community regarding the memory of recent flood conditions. Table 2 (a) shows the scoring system used in Figure 6A. According to Equation (9), the calculated memory of the 2010, 2016, 2017, and 2018 flood events were 0.32, 0.84, 0.69, and 0.68, respectively. As per Figure 6B, the memory decay rate of the community was 0.11, which meant the half-life time was 6.3-yr (Equation 7). According to the literature, the half-life time of flood memory varies between 1 and 15-yr (Ridolfi et al., 2021); thus, the calculated memory decay rate in the present study site was within this range.

Figure 6. (A) Memory of the past flood events as per Survey 1 responses, (B) change of past flood event memory within the LKRB community.
3.3. Memory of flood risk information (Min)
The responses from Surveys 1 and 2 regarding the probable flood inundation extents and depths are shown in Figure 7 [Table 2 (b, c) shows the scoring system used in Figure 7].
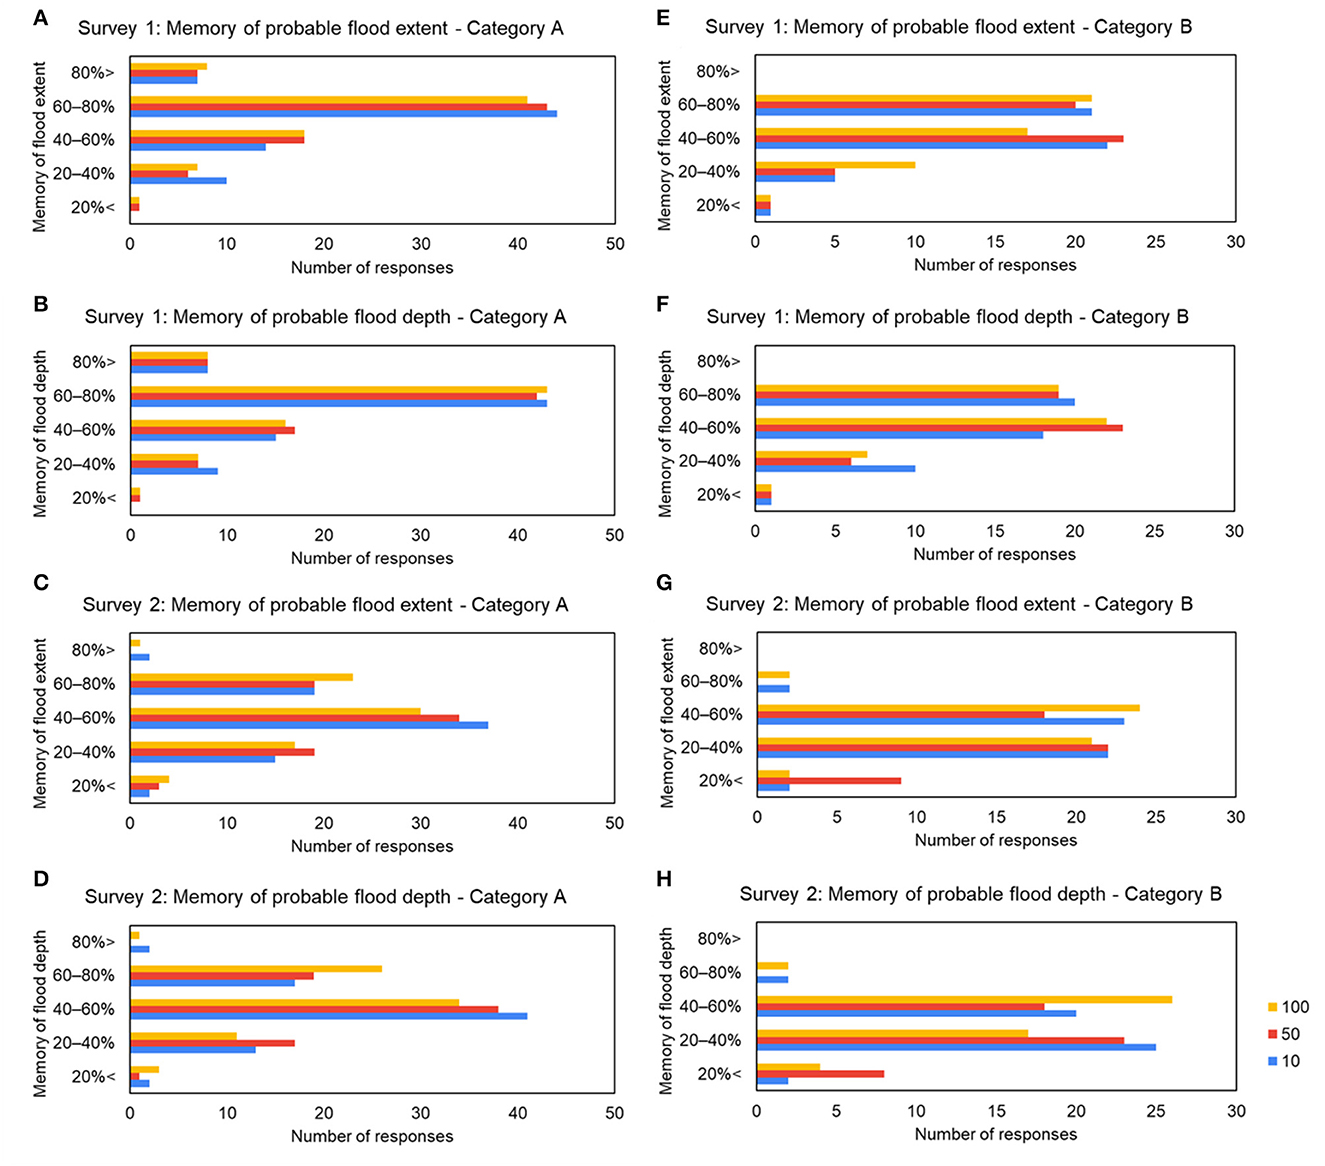
Figure 7. Memory of probable inundation extents and depths of flood maps with different return periods (10-, 50-, 100-yr) as per the results of the two surveys. (A, B) Responses to the 1st survey from category A respondents, (C, D) responses to the 2nd survey from category A respondents, (E, F) responses to the 1st survey from category B respondents, and (G, H) responses to the 2nd survey from category B respondents.
According to the survey results, residents remembered the details of flood inundation areas slightly better than those of flood depths. Overall, the memory of the details in the 100- and 10-yr maps was slightly better than that in the 50-yr flood map. In Survey 1 of Category A, the highest number of responses were in the “high” memory class; whereas in Survey 2 of Category A, the “medium” memory class showed the highest number of responses. In Category B, there was a substantial increase of “low” memory class respondents from the first survey to the second survey. Overall, there was a clear difference between the responses from the Category A and B, where the memory of the Category A respondents was primarily “very high,” “high,” or “moderate,” while the majority of memory of Category B respondents ranged from “high” to “low”. The ratio between memory from Survey 2/memory from Survey 1 was 0.84 and 0.75 for categories A and B, respectively.
Based on the scores assigned to each memory class, the average memory values of flood extent and depths were calculated using the responses of the 10-, 50-, and 100-yr flood maps. Table 5 summarizes the calculated values based on the responses from the two surveys.
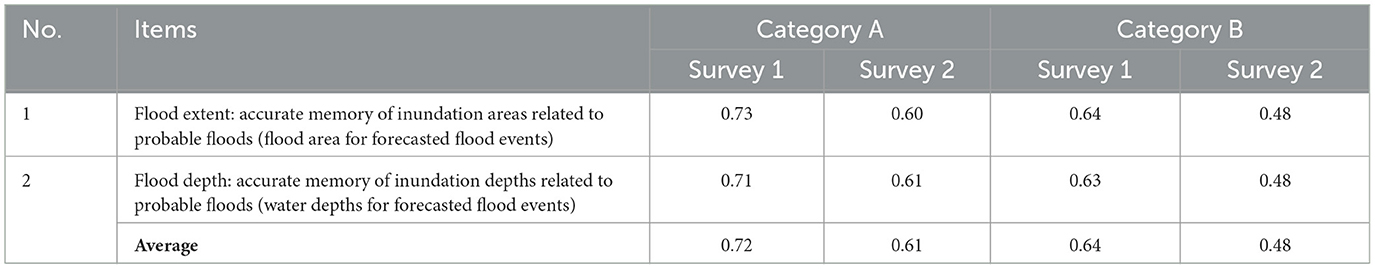
Table 5. Flood risk memory according to surveys.
After Surveys 1 and 2, the memory of the respondents on the FRI was evaluated, and the memory decay rates were calculated using Equation (6). For Category A, the decay rate was 0.35, and for Category B, it was 0.56. These decay rates correspond to memory half-life periods of 2 and 1.2-yr, respectively.
Then, a cross-tabulation was performed using the Eta squared values to check the correlations. Here, higher values of Eta squared indicate that a higher proportion of the variance can be explained by the given variable. As per the cross-tabulation results (Table 6), there was a strong connection between education and the memory of the flood risk maps. Furthermore, a strong correlation was observed between the memory of flood maps and previous flood experiences. Other variables had moderate to low correlations.
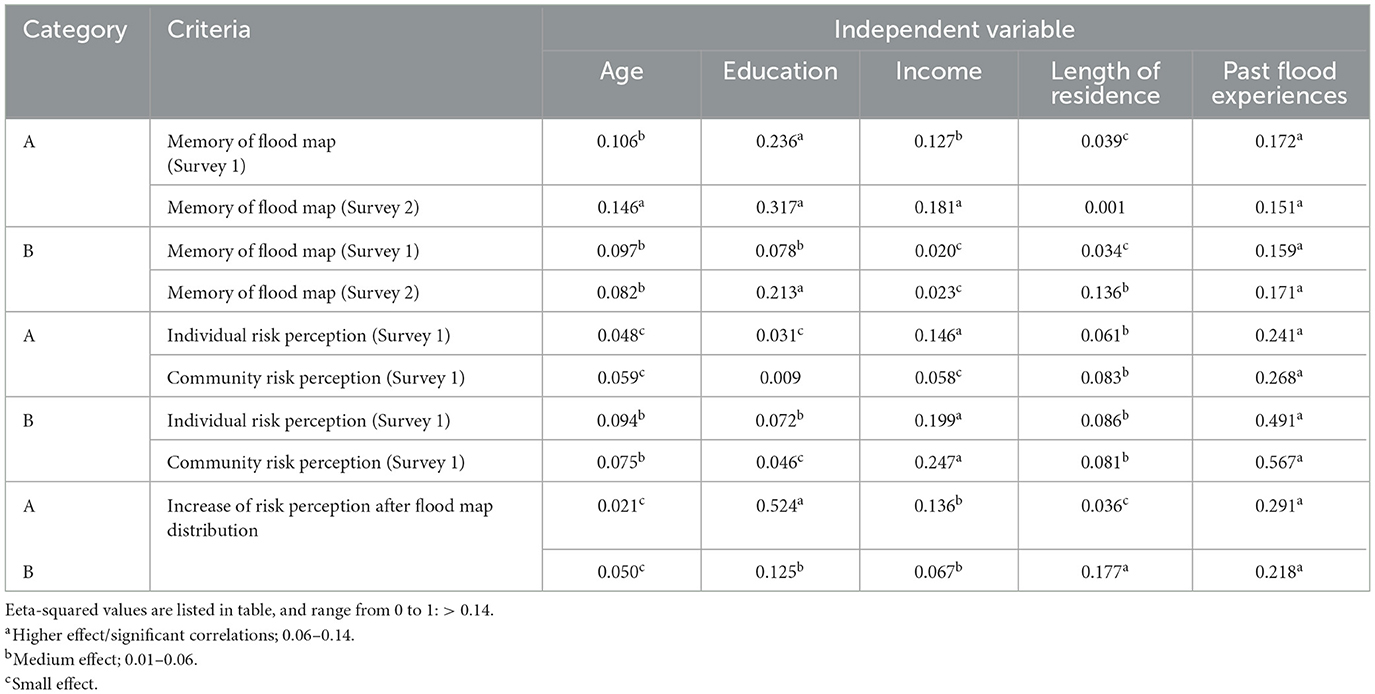
Table 6. Results of cross tabulation between memory of flood map, flood risk perception, increase of risk perception after flood map distribution with independent variables.
3.4. Risk perception
In the first survey, before distributing the flood risk maps, the respondents were asked questions regarding their risk perception of the floodplain community on a 5-point Likert scale using two questions: Q1, Do you think that future flood events cause danger to your family and house/Are you at risk? (individual risk perception); and, Q2: Do you think that future flood events cause danger to your community and the dwellings of the community/Is your community at risk? (community risk perception).
From the first survey, the average scores obtained for Q1 and Q2 were 3.69/5 and 3.73/5, respectively. According to the responses from the second survey, only 66.9% said that they still had the distributed maps with them. Among others, 24.2% said that they were not sure whether they still had the maps with them, and 8.9% said that they did not have the maps now. Across all respondents, only 9.7% said that they referred to the maps again at least once since April 2022. Their education level was well-above the education level of the population sample, with an average score of 3.42 out of 5 (compared to 2.24 for the entire sample; scores between 1 and 5 were assigned based on the level of education, ranging from primary to the university level). Furthermore, respondents were also asked the Q1 and Q2 in the second survey, and their respective responses (4.02/5 and 4.13/5) indicated an increase in individual and community risk perception by 8.9 and 10.7%, respectively.
As per the cross-tabulation of flood risk perception with independent variables (Table 6), risk perception had a high correlation with previous flood experiences. Furthermore, a significant correlation can be observed between respondent income level and risk perception.
In Survey 2, before testing the memory of the flood risk maps, the effect of flood maps on the increase in risk perception was tested using a scale of 1–5. The majority of respondents said that their perception of probable floods increased as a result of the survey, with 9.3% of Category A and 8.2% of Category B rating their increase of awareness as “very high”. In Categories A and B, 64 and 51% rated the increase in awareness as “high”, respectively. In a 5-point Likert-scale, average values of 3.8 and 3.63 were received for the overall increase of awareness of flood risk under Categories A and B, respectively. Overall, 2.7% of Category A, and 4.1% of Category B rated the increase of awareness as “low” or “very low”. As per the cross-tabulation (Table 6), a high proportion of variance in the increase in risk perception of Category A can be explained by the education level of the respondents; whereas in Category B, education had a moderate effect on risk awareness.
Furthermore, the flood risk perception as per the second survey was cross-tabulated with the memory of flood maps from the first survey (Table 7). The results showed that the memory of the flood maps had a moderate effect on the variation of respondents' risk perception.
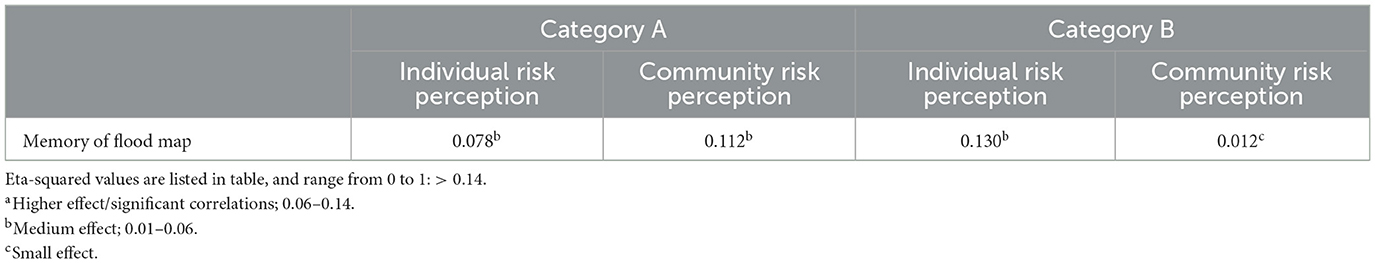
Table 7. Results of cross tabulation between memory of flood risk maps (Survey 1) and flood risk perception (Survey 2).
3.5. Application of socio-hydrological modeling and scenario analysis
Based on the results obtained after the surveys, the SHM was applied for 30-yr to three different conceptual scenarios. The validated model in the study by Perera and Nakamura (2022) was used and applied to different scenarios, as per the modified SHM in this study. The simulation period was 30-yr, based on data from 1988 to 2017. The three scenarios used for the simulation were as follows:
- If the flood map distribution is done once in every year
- If the flood map distribution is done once in every 3 years
- If the flood map distribution is done once in every 5 years
For the 30-yr of simulation, the impact of flood maps was considered from the fifth year of the simulation. In the model, it was assumed that the risk memory mainly accumulated after the distribution of maps, similar to the accumulation of memory after a flood disaster. It is believed here that the previous assumption is acceptable, because, as per the second survey, only 9.7% of the respondents viewed the map between the time of the first and second survey. In fact, the key part of memory accumulation must have occurred immediately after map distribution. For simulation purposes, to calculate the collective memory (Equation 11), α and β were assumed to be 1 and 0.2. Determining α and β is difficult; however, α must be significantly higher than β because the experience of a flood event can improve memory and risk perception better than understanding the risk from maps or other sources of information. This was also evident from previous socio-hydrological research, since all studies to date have only considered the impacts of actual flood events on the accumulation of flood memory. The value of β could vary based on individual capacities, including level of education, resulting in higher β for communities with higher educational and intellectual capacities. The purpose of this simulation was not to precisely model the floodplain dynamics, but to understand how risk information could contribute to alter these dynamics. Therefore, it was concluded here that the subjective judgement of α and β in this case was acceptable.
Figure 8 shows the simulation results. There were 14 instances of flooding (Figure 8A) at the study site according to dataset used. As per the damage simulations, the reduction in damage for different map distribution frequencies was 10% for once in 5-yr, 13.9% for once in 3-yr, and 30.7% for annual distribution.

Figure 8. (A) Flood level and rainfall, (B) memory variation, (C) population density variation, and (D) damages. M1, Memory of flood events; M1 + M2(1), Collective memory based on annual flood map distributions; M1 + M2(3), Collective memory based on once in 3-yr flood map distributions; M1 + M2(5), Collective memory based on once in 5-yr flood map distributions. D_M1, D_(M1 + M2)_1, D_(M1 + M2)_3, and D_(M1 + M2)_5, and L_M1, L_(M1 + M2)_1, L_(M1 + M2)_3, L_(M1 + M2)_5 refer to the respective population density and damage simulations for each year length.
4. Discussion
4.1. Model conceptualization
People make decisions based on the information they receive. FRI is no different, and it could alter the way people perceive their future, or how they react to impending disasters. As per the original SHM, past flood experiences alter floodplain dynamics. Experienced people make rational decisions and it helps to limit damages during disasters; however, under increasing climatic threats, population sizes, and economic complexities, it is essential to change the perception of people to alter system dynamics. In this context, delivering FRI to communities at high frequencies is vital. Therefore, the conceptualization in this study is important for understanding the possible future trajectories related to floodplain dynamics.
The frequency of flooding is high within the study area, and it can be identified as a green society, as explained by Di Baldassarre et al. (2015) in his conceptualization. Because of the high frequency of flooding, the Mex was relatively high within the community (Figure 8B, M1). Memory can be further elevated by distributing FRI. When the frequency of the flood map distribution increases, the collective memory increases, as shown by the different memory paths in Figure 8B. In the dataset, there were no flood events between yr-12 and−18; therefore, in the original flood memory path, there was a significant decline. The damage figures for the event in yr-18 were also considerably high; however, if the maps were distributed, this decline can be minimized, as the collective flood memory of the people is maintained at higher levels. When the collective flood memory is high, people limit floodplain encroachments, and as a result, the population density in the flood areas declines (Figure 8C), thereby reducing flood damage (Figure 8D). As per the 30-yr simulation period, flood damages could have been reduced substantially if flood maps were distributed and awareness sessions were conducted annually.
4.2. Risk perception of floodplain communities
The present study showed that people who had past flood experiences remembered flood map contents better. When the risk maps were distributed, people with more experience recognized the inundation extent, and even explained the inundated areas in the past years. After reading the maps, they refreshed their memories and better understood the content. Education also had a high significance related to the memory of the flood map content (Table 6). People who had a stronger education remembered the risk information better. The memory of flood maps had a moderate effect on the variation in risk perception (Table 7); thus, increasing the Min can help improve the risk perception of floodplain communities. In fact, both the (i) increase in individual and community risk perception from surveys 1–2, and (ii) The good correlation between memory values (Min) of first survey and risk perception values in the second survey supports the hypothesis pertaining to the significance of FRI on the increase of risk perception. Further, it should also be noted that, between the two surveys, there were no other significant triggers from floods or any other initiatives; thus, the change in risk perception appears to be directly due to the impact of FRI.
4.3. Impact of awareness sessions and demographic factors on risk perception
In establishing a connection between risk information and risk perception, the method of presentation is important. To demonstrate the significance of the two approaches, two survey categories were used here, both with their own merits. In Category A, extra effort was put forth to present the details to the community. If the scale is increased, greater costs and power are essential. Alternatively, Category B is more cost effective for larger scale projects; however, even though the effort is tremendous for Category A, this study suggests that it was worthy because it helped improve the memory of the community (Min) better than that in the case of Category B (Table 5). Apart from asking for answers to questions, fruitful discussions were also held with many of the respondents from Category A, who were very happy to share their personal experiences. Some were even excited to explain the reasons for their answers. Furthermore, as per the second survey, the individual risk perception of such people was higher (4.07) than that of Category B respondents (3.94), which could also be due to the trigger of flood memories due to the provision of descriptive risk information. In Survey 1, however, both Categories A and B showed similar levels of individual risk perception (3.68 and 3.70), suggesting that awareness sessions have an impact on increasing risk perception. In both Categories A and B, the overall responses recorded a higher risk perception of the community than of the individual. This may be based on previous flood experience and the location of the house. A similar observation was made in the study conducted by Scolobig et al. (2012), where the author found that flood impacts, risk exposure, level of trust in authorities, and research location influenced residents' evaluations. When the correlations between variables were considered, there was a higher correlation between education and memory of flood maps for Category A than B (Table 6). Furthermore, the correlation between the increase in risk perception and education was very high for Category A compared to B (Table 6). In both cases, the increased variance can be attributed to the influence of awareness sessions. Income level had a greater effect on the variance of risk perception in both Categories A and B, while age and length of residence also had a medium effect on the variance for both Categories A and B. These results suggest that when awareness sessions are combined with education, it helps to change the risk perception by a higher percentage.
The purpose of the flood risk map distribution is to improve the awareness of floodplain communities so that they can better respond to flood events. During the second survey, it was understood that flood maps could trigger a big motivation in floodplain communities to regroup and think about their future intentions. Also during the second survey, one of the participants from Category A mentioned that he explained the content of the 10-, 50-, and 100-yr flood maps during their village community meetings. Unsurprisingly, his memory of the map content was better than that of the majority of other survey participants. A Buddhist monk participant in Category A also said that they had shared the maps with a few of the villagers who visited the temple. Another participant said that the distribution of maps was not enough, and they required some sort of structural measures to reduce flooding. Although maps were distributed only to 141 households, these examples highlight the impact of such initiatives on increasing the awareness of much larger groups of people. As noted by Scolobig et al. (2012), risk awareness translates into actual behavior, and can be clearly understood from the actions of the aforementioned participants. It is also interesting to note that none of the participants from Category B shared such feedback. According to the outcomes of this study, conducting awareness sessions and explaining the flood risk maps to the communities can be identified as more beneficial for reaching the extra mile in improving flood risk perception.
4.4. Damage reduction by increasing risk perception
Risk perception largely varies based on the nature of floodplain communities. As explained by Di Baldassarre et al. (2015), technological societies build levees to protect themselves from potential large flooding events, while green societies cope with floods by settling away from rivers; however, in technological societies, when a flood event occurs after a long period of non-flood years, the damage can be extensive. The feeling of a false sense of security induced by high flood protection levels can lead to catastrophic situations. The frequency of flooding is high in green societies, and their memory of flooding is also high. Therefore, a lower level of damage is expected in the green societies. However, in the climatically uncertain future, the intensity and frequency of flooding may further increase, causing further damage to life and property. Therefore, understanding future exposure is vital for both types of floodplain communities to better respond during disaster situations, and to reduce damages. However, it remains impossible to mitigate all damages from a flood event. Residual or unavoidable damages cannot be prevented by mitigation measures. According to Lopez et al. (2017), residual damages oscillate between 40 and 80% of the total disaster damage; yet, a portion of these impacts can be mitigated or reduced by improving the flood memory of floodplain communities, and FRI plays a major role in the process of improving risk perception. For example, two flood events with similar exposure occurred in Cologne, Germany in 1993 (flood level, 10.63 m) and 1995 (flood level, 10.69 m). The damages from these two events were estimated at € 65 and € 30 billion, respectively (Scolobig et al., 2012). This large difference in damage losses was likely due to the increase in preparedness of the people due to the increase of flood memory (Mex). As explained previously, it is difficult to match the impact of Mex with that of Min; however, any effort to improve Min is important, as it may help improve overall risk perception and damage reduction.
According to the model simulations here, when the frequency of awareness sessions was high, collective flood memory could be maintained at higher values. When collective flood memory improves, it motivates people to settle away from the floodplain, helping reduce flood damage. There are judgements on conceptualizing damages using this simplistic approach, but this method has been applied in many socio-hydrological studies around the world, and has been accepted as the simplest and most reasonable explanation. In this case, the argument here is that when risk information is regularly delivered to society, people accept the risk, and make decisions not to further encroach on the floodplain. As per the conceptualization, depending on the frequency of awareness sessions, collective flood memory improves, and as a result, damages can be reduced between 10 and 30%. Theoretically these numbers are promising, but it is difficult to validate as there are many associated uncertainties. The purpose of this study is not to achieve absolute accuracy with the model results, but to make a theoretical foundation to explain the way risk information can be integrated to influence the floodplain dynamics. According to Barlas (1996), to judge the validity of a model, its purpose must be judged too. Since the proposed model is well-suited to explain and judge the overall impact of FRI on system dynamics, we believe that our method is justifiable.
5. Conclusions
In socio-hydrological research, the relationships between flooding, flood memory, population density, and technology have been well-established; however, past research has primarily focused on the accumulation of flood memories based on past experiences. None of the models built thus far explained the influence of FRI on improving collective flood memory, or the possible impacts on floodplain dynamics. In this socio-hydrological study, the impact of FRI was incorporated in SHM and the associated dynamics were explained. To this end, probable flood risk maps were distributed to people living in flood-prone areas across LKRB, Sri Lanka, and subsequent surveys were conducted. After 6 months, a follow-up survey was conducted to determine the memory of the floodplain communities related to FRI and their risk perception. Despite the small sample size, the impacts of FRI on improving collective flood memory were explained, and the associated dynamics were simulated. As the purpose of this study is to understand the impact of FRI on collective flood memories and risk perception, the sample size is adequate. However, the authors believe that a larger sample would increase the community engagement further. As per the results, the increase in risk perception from first to second surveys highlighted the impact of the FRI on collective flood memory. As such, access to FRI must be further strengthened so people can effectively respond to impending disasters under increasing climatic change. The importance of detailed awareness sessions was also highlighted, explaining how they help bring the community together by increasing community engagement, which is also essential during disaster situations. The model can be proposed as a practical way to understand, propose and effectively implement actions that can contribute to altering the floodplain dynamics, such that it could help to reduce the impacts of future flood disasters on homes and humanity.
Data availability statement
The raw data supporting the conclusions of this article will be made available by the authors, without undue reservation.
Ethics statement
Ethical review and approval was not required for the study on human participants in accordance with the local legislation and institutional requirements. The patients/participants provided their written informed consent to participate in this study.
Author contributions
CP: conceptualization, methodology, software, surveys, analysis, and writing. SN: conceptualization, methodology, supervision, review, and resources. All authors contributed to the article and approved the submitted version.
Funding
This study was supported by a Japanese Government (Monbukagakusho: MEXT) Scholarship, JST-Mirai Program (JPMJMI21I6), Japan, and JST-JICA-SATREPS Program (JPMJSA1909).
Acknowledgments
We extend our appreciation to the Irrigation Department, Meteorological Department, Survey Department, and Land Development Corporation, Sri Lanka for providing the data. Further, we appreciate the Divisional Secretariat Office-Kaduwela for facilitating and all the participants for their cooperation to the surveys.
Conflict of interest
The authors declare that the research was conducted in the absence of any commercial or financial relationships that could be construed as a potential conflict of interest.
Publisher's note
All claims expressed in this article are solely those of the authors and do not necessarily represent those of their affiliated organizations, or those of the publisher, the editors and the reviewers. Any product that may be evaluated in this article, or claim that may be made by its manufacturer, is not guaranteed or endorsed by the publisher.
Supplementary material
The Supplementary Material for this article can be found online at: https://www.frontiersin.org/articles/10.3389/frwa.2023.1131997/full#supplementary-material
References
Albertini, C., Mazzoleni, M., Totaro, V., Iacobellis, V., and Di Baldassarre, G. (2020). Socio-hydrological modeling: the influence of reservoir management and societal responses on flood impacts. Water 12, 1384. doi: 10.3390/w12051384
Anastasio, T. J., Ehrenberger, K. A., Watson, P., and Zhang, W. (2012). Individual and Collective Memory Consolidation: Analogous Processes on Different Levels. Cambridge, MA: MIT Press.
Ardaya, A. B., Evers, M., and Ribbe, L. (2017). What influences disaster risk perception? Intervention measures, flood and landslide risk perception of the population living in flood risk areas in Rio de Janeiro state. Brazil Int. J. Disast. Risk Reduct. 25, 227–237. doi: 10.1016/j.ijdrr.2017.09.006
Barlas, Y. (1996). Formal aspects of model validity and validation in system dynamics. Syst. Dyn. Rev. 12, 183–210. doi: 10.1002/(SICI)1099-1727(199623)12:3<183::AID-SDR103>3.0.CO;2-4
Cambridge University Press (2022a). Cambridge Dictionary. Available online at: https://dictionary.cambridge.org/dictionary/english/knowledge (accessed October 10, 2022).
Cambridge University Press (2022b). Cambridge Dictionary. Available online at: https://dictionary.cambridge.org/dictionary/english/memory (accessed October 10, 2022).
Carone, M. T., Melchiorri, L., Romagnoli, F., and Marincioni, F. (2019). Can a simulated flood experience improve social resilience to disasters? Prof. Geogr. 71, 604–615. doi: 10.1080/00330124.2019.1611457
Chan, N. W., Ghani, A. A., Samat, N., Hasan, N. N. N., and Tan, M. L. (2019). “Integrating structural and non-structural flood management measures for greater effectiveness in flood loss reduction in the Kelantan River Basin, Malaysia,” in AWAM International Conference on Civil Engineering (Penang), 1151–1162.
Chitsaz, N., and Banihabib, M. E. (2015). Comparison of different multi criteria decision-making models in prioritizing flood management alternatives. Water Res. Manag. 29, 2503–2525. doi: 10.1007/s11269-015-0954-6
Ciullo, A., Viglione, A., Castellarin, A., Crisci, M., and Di Baldassarre, G. (2017). Socio-hydrological modeling of flood-risk dynamics: comparing the resilience of green and technological systems. Hydrol. Sci. J. 62, 880–891. doi: 10.1080/02626667.2016.1273527
Cools, J., Innocenti, D., and O'Brien, S. (2016). Lessons from flood early warning systems. Environ. Sci. Policy. 58, 117–122. doi: 10.1016/j.envsci.2016.01.006
Cvetković, V. M., Roder, G., Öcal, A., Tarolli, P., and Dragićević, S. (2018). The role of gender in preparedness and response behaviors towards flood risk in Serbia. Int. J. Environ. Res. Public Health 15, 2761. doi: 10.3390/ijerph15122761
Department of Census and Statistics-Sri Lanka (2019). Household Income and Expenditure Survey - 2019. Battaramulla: Ministry of Economic Policies and Plan Implementation.
Di Baldassarre, G., Saccà, S., Aronica, G. T., Grimaldi, S., Ciullo, A., and Crisci, M. (2017). Human-flood interactions in Rome over the past 150 years. Adv. Geosci. 44, 9–13. doi: 10.5194/adgeo-44-9-2017
Di Baldassarre, G., Sivapalan, M., Rusca, M., Cudennec, C., Garcia, M., Kreibich, H., et al. (2019). Sociohydrology: scientific challenges in addressing the sustainable development goals. Water Resour. Res. 55, 6327–6355. doi: 10.1029/2018WR023901
Di Baldassarre, G., Viglione, A., Carr, G., Kuil, L., Salinas, J. L., and Blöschl, G. (2013). Socio-hydrology: conceptualising human-flood interactions. Hydrol. Earth Syst. Sci. 17, 3295–3303. doi: 10.5194/hess-17-3295-2013
Di Baldassarre, G., Viglione, A., Carr, G., Kuil, L., Yan, K., Brandimarte, L., et al. (2015). Debates-Perspectives on socio-hydrology: capturing feedbacks between physical and social processes. J. Amer. Water Resour. 51, 4770–4781. doi: 10.1002/2014WR016416
Dransch, D., Rotzoll, H., and Poser, K. (2010). The contribution of maps to the challenges of risk communication to the public. Int. J. Dig. Earth 3, 292–311. doi: 10.1080/17538941003774668
Elliot, A. J., Maier, M. A., Moller, A. C., Friedman, R., and Meinhardt, J. (2007). Color and psychological functioning: The effect of red on performance attainment. J. Exp. Psychol. Gen. 136, 154–168. doi: 10.1037/0096-3445.136.1.154
Fehrman, C., and Fehrman, K. (2018). Color the Secret Influence - Fourth Edition. New York, NY: Cognella Academic Publishing.
Fuchs, S., Karagiorgos, K., Kitikidou, K., Maris, F., Paparrizos, S., and Thaler, T. (2017). Flood risk perception and adaptation capacity: a contribution to the socio-hydrology debate. Hydrol. Earth Syst. Sci. 21, 3183–3198. doi: 10.5194/hess-21-3183-2017
Houston, D., Cheung, W., Basolo, V., Feldman, D., Matthew, R., Sanders, B. F., et al. (2019). The influence of hazard maps and trust of flood controls on coastal flood spatial awareness and risk perception. Environ. Behav. 51, 347–375. doi: 10.1177/0013916517748711
Kummer, T. F., and Mendling, J. (2021). The effect of risk representation using colors and symbols in business process models on operational risk management performance. J. Asso. Info. Syst. 22, 649–694. doi: 10.17705/1jais.00676
Lechowska, E. (2018). What determines flood risk perception? A review of factors of flood risk perception and relations between its basic elements. Nat. Hazard 94, 1341–1366. doi: 10.1007/s11069-018-3480-z
Li, J., He, Z., Plaza, J., Li, S., Chen, J., Wu, H., et al. (2017). Social media: New perspectives to improve remote sensing for emergency response. Proc. IEEE. 105, 1900–1912. doi: 10.1109/JPROC.2017.2684460
Lopez, M. G., Di Baldassarre, G., and Seibert, J. (2017). Impact of social preparedness on flood early warning systems. Water Resour. Res. 53, 522–534. doi: 10.1002/2016WR019387
Mikio, I., and Daisuke, S. (2021). Investments in Flood Protection Trends in Flood Damage and Protection in Growing Asian Economies. Tokyo: JICA Institute.
Pande, S., and Sivapalan, M. (2017). Progress in socio-hydrology: a meta-analysis of challenges and opportunities. Wiley Interdiscip. Rev.: Water. 4, e1193. doi: 10.1002/wat2.1193
Perera, C., and Nakamura, S. (2022). Improvement of socio-hydrological model to capture the dynamics of combined river and urban floods: a case study in Lower Kelani River Basin, Sri Lanka. Hydrol. Res. Lett. 16, 40–46. doi: 10.3178/hrl.16.40
Retchless, D. P. (2018). Understanding local sea level rise risk perceptions and the power of maps to change them: the effects of distance and doubt. Environ. Behav. 50, 483–511. doi: 10.1177/0013916517709043
Ridolfi, E., Mondino, E., and Di Baldassarre, G. (2021). Hydrological risk: modeling flood memory and human proximity to rivers. Hydrol. Res. 52, 241–252. doi: 10.2166/nh.2020.195
Sanders, B. F., Schubert, J. E., Goodrich, K. A., Houston, D., Feldman, D. L., Basolo, V., et al. (2020). Collaborative modeling with fine-resolution data enhances flood awareness, minimizes differences in flood perception, and produces actionable flood maps. Earths Fut. 8, 1–23. doi: 10.1029/2019EF001391
Sauer, I. J., Reese, R., Otto, C., Geiger, T., Willner, S. N., Guillod, B. P., et al. (2021). Climate signals in river flood damages emerge under sound regional disaggregation. Nat. Commun. 12, 1–11. doi: 10.1038/s41467-021-22153-9
Sawada, Y., Kanai, R., and Kotani, H. (2022). Impact of cry wolf effects on social preparedness and the efficiency of flood early warning systems. Hydrol. Earth Syst. Sci. 26, 4265–4278. doi: 10.5194/hess-26-4265-2022
Scolobig, A., De Marchi, B., and Borga, M. (2012). The missing link between flood risk awareness and preparedness: findings from case studies in an Alpine Region. Nat. Hazard 63, 499–520. doi: 10.1007/s11069-012-0161-1
Shibata, N., Nakai, F., Otsuyama, K., and Nakamura, S. (2022). Socio-hydrological modeling and its issues in Japan: a case study in Naganuma District, Nagano City. Hydrol. Res. Lett. 16, 32–39. doi: 10.3178/hrl.16.32
Shiru, M. S., Johnson, L. M., Ujih, O. U., and AbdulAzeez, O. T. (2015). Managing flood in Ilorin, Nigeria: structural and non-structural measures. Asian J. Appl. Sci. 3, 507–513.
Sivapalan, M., Savenije, H. H. G., and Blöschl, G. (2012). Socio-hydrology: a new science of people and water. Hydrol. Proc. 26, 1270–1276. doi: 10.1002/hyp.8426
Song, S., Wang, S., Fu, B., Dong, Y., Liu, Y., Chen, H., et al. (2021). Improving representation of collective memory in socio-hydrological models and new insights into flood risk management. J. Flood Risk Manag. 14, e12679. doi: 10.1111/jfr3.12679
UNDRR (2022). UNDRRDesInventar Sendai. Available online at: https://www.desinventar.net/DesInventar/profiletab.jsp (accessed October 20, 2022).
Viglione, A., Di Baldassarre, G., Brandimarte, L., Kuil, L., Carr, G., Salinas, J. L., et al. (2014). Insights from socio-hydrology modeling on dealing with flood risk - Roles of collective memory, risk-taking attitude and trust. J. Hydrol. 518, 71–82. doi: 10.1016/j.jhydrol.2014.01.018
Wertsch, J. V., and Roediger, H. L. (2008). Collective memory: conceptual foundations and theoretical approaches. Memory 16, 318–326. doi: 10.1080/09658210701801434
Keywords: socio-hydrology, flood risk information, flood maps, flood memory, risk perception, Kelani River Basin, Sri Lanka
Citation: Perera C and Nakamura S (2023) Conceptualizing the effectiveness of flood risk information with a socio-hydrological model: A case study in Lower Kelani River Basin, Sri Lanka. Front. Water 5:1131997. doi: 10.3389/frwa.2023.1131997
Received: 26 December 2022; Accepted: 24 March 2023;
Published: 11 April 2023.
Edited by:
Alessandro Pagano, Istituto di Ricerca Sulle Acque IRSA-CNR, ItalyReviewed by:
Antonio Annis, University for Foreigners Perugia, ItalyCristiano Franceschinis, Università di Padova, Italy
Copyright © 2023 Perera and Nakamura. This is an open-access article distributed under the terms of the Creative Commons Attribution License (CC BY). The use, distribution or reproduction in other forums is permitted, provided the original author(s) and the copyright owner(s) are credited and that the original publication in this journal is cited, in accordance with accepted academic practice. No use, distribution or reproduction is permitted which does not comply with these terms.
*Correspondence: Shinichiro Nakamura, c2hpbmljaGlyb0BjaXZpbC5uYWdveWEtdS5hYy5qcA==