 Douglas E. Meisenheimer
 Dorthe Wildenschild
- 1Stanford Doerr School of Sustainability, Stanford University, Stanford, CA, United States
- 2School of Chemical, Biological, and Environmental Engineering, Oregon State University, Corvallis, OR, United States
There is a need to better understand the presence and transport of bubbles in multi-phase subsurface porous media so that these processes can be accurately described, and more efficient engineered solutions can be developed. To this end, constitutive relationships between geometric state variables (fluid-fluid curvature, Jnw; non-wetting phase volume, Vn; fluid-fluid interfacial area, anw; and Euler characteristic, χn) have become increasingly more common in efforts to uniquely predict the state of a two-fluid flow system. Both lattice Boltzmann simulations and fast X-ray microtomography (μCT) imaging experiments have shown that a geometric state function using the non-dimensionalized invariant properties of saturation, specific interfacial area, and Euler characteristic can uniquely predict the mean curvature of the system for both quasi- and non-equilibrium conditions, however, the presence of bubble evolution and the subsequent transport phenomena have not been explored. This study investigates whether the geometric state function remains unique with the inclusion of bubble generation and transport under quasi- and non-equilibrium two-fluid flow. The data presented here suggests that bubble formation and entrapment occur in a manner that cannot be predicted by the more traditional capillary pressure-saturation-interfacial area, Pc(Sw, anw), relationship, and further extensions to the constitutive relationship are needed to fully capture these mechanisms.
1. Introduction
Bubble generation and transport phenomena contribute to many subsurface environmental engineering processes. For example, natural production or mobilization of gas is observed in biogenic production of methane in peats (e.g., Beckwith and Baird, 2001; Chen and Slater, 2015), in exsolution of gases during methanogenesis in organic rich aquifers (Fortuin and Willemsen, 2005), and in leakage from geologic CO2 storage systems (e.g., Oldenburg and Unger, 2003; Zuo et al., 2017). In engineered subsurface systems, remediation applications that rely on bubble formation and transport include in-situ air sparging/soil vapor extraction (e.g., Johnson et al., 1993; Bass et al., 2000; Li et al., 2014) and electrical resistance heating (e.g., Triplett Kingston et al., 2010; Hegele and Mumford, 2014). Both these techniques strip volatile organic compounds from contaminated groundwater via mass transfer, producing gas bubbles, which are then buoyantly transported to extraction points. Air sparging also plays a role in bioremediation of groundwater contaminated with low-volatility compounds, by increasing the dissolved oxygen availability in the groundwater, allowing for aerobic metabolism of the contaminant (Brown et al., 1994).
Bubble formation can also adversely affect many electrochemical systems involving aqueous solutions. Bubbles are known to affect energy and mass transfer in gas-evolving electrodes, including those in water splitting, chlorine generation, direct methanol fuel cells, and carbon dioxide generation (He et al., 2023). In these systems, either hydrogen or oxygen production are the major cause of bubble formation, potentially impeding flow of electrolytes.
Thus, there is a need to better understand the spatial arrangement and transport of bubbles such that accurate predictive numerical flow models can be reliably developed for multiphase flow and transport in porous media. Importantly, bubbles migrating through the porous medium, or those that have become entrapped, impede hydraulic conductivity of multiphase systems (e.g., Beckwith and Baird, 2001; Hunt and Manga, 2003). This disruption of flow within porous media, can have other compounding effects on the efficiency of engineered systems such as limiting dissolved oxygen for bioremediation (Fry et al., 1995). Focused effort has been made at numerically modeling bubble transport with continuum multiphase models such as TOUGH2 (Pruess et al., 1999) and NUFT (Hao et al., 2012) for a variety of applications such as CO2 storage (Johnson et al., 2004) and air sparging (Geistlinger et al., 2009). These continuum models are developed as extensions of Darcy's law and are, therefore, generally unable to model the behavior of dynamic gas flows that are not captured by stable displacement or continuous flow approaches (Molnar et al., 2019). Invasion percolation models have also been employed which are generally better equipped to model unstable gas flow (e.g., Glass and Yarrington, 2003; Krol et al., 2011).
Empirical relationships between state variables of a multiphase system have been instrumental to modeling multiphase flow in porous media. The most conventional example is the hysteretic relationship between the capillary pressure (Pc), the pressure difference between the non-wetting and wetting fluids (Pc = Pn – Pw), and the wetting saturation (Sw) of the system. There have been many studies aimed at expanding the Pc-Sw relationship to remove its dependence on the history of the system (e.g., hysteresis). Similarly, a number of studies (Joekar-Niasar and Hassanizadeh, 2012; Karadimitriou et al., 2014; Schlüter et al., 2014, 2016; Berg et al., 2016; McClure et al., 2016, 2018; Godinez-Brizuela et al., 2017; Singh et al., 2017; and most recently Meisenheimer et al., 2020a) have been dedicated to exploring differences between quasi-equilibrium and non-equilibrium conditions; the former represents a system where flow is periodically stopped to allow the fluid interfaces to relax, and the latter represents conditions of continuous flow.
One multiphase flow theory uses rational thermodynamics to introduce specific interfacial area of fluid-fluid interfaces, anw (interfacial area per unit volume of the porous medium), as a separate thermodynamic entity to extend the Pc-Sw relationship and better describe the history of the system (Hassanizadeh and Gray, 1993). Pore-network models (e.g., Held and Celia, 2001; Joekar-Niasar and Hassanizadeh, 2011), micromodel experiments (e.g., Cheng et al., 2004; Pyrak-Nolte et al., 2008) and μCT combined with lattice-Boltzmann simulations (e.g., Porter et al., 2009, 2010), have verified that the Pc(Sw, anw) relationship can uniquely describe two-phase flow under quasi-equilibrium conditions. However, this is not the case for non-equilibrium conditions where the Pc(Sw, anw) relationship was found to be hysteretic in both 2D micromodel (Godinez-Brizuela et al., 2017) and 3D μCT (Meisenheimer et al., 2020a) experiments. Other studies have included the Euler characteristic (χn), a measure of the connectivity of the fluid configurations within the pore space, to constrain the system. Briefly, the Euler characteristic (χn) is a topological invariant which we use in this work to characterize the connectivity of the non-wetting phase, and defined as the alternating sum of the first three Betti numbers (β0, β1, β2):
where β0 is the number of individual objects present, β1 is the number of redundant loops or handles present, and β2 is the number of holes or hollows present within the object(s). The Euler characteristic is an extensive property of a system in that the overall Euler characteristic for a domain is the sum of the values of all subdomains within it. In the context used in this manuscript, as Euler characteristic becomes more negative, the non-wetting phase fluid is becoming better connected. We refer to Herring et al. (2013) for further details about the Euler characteristic and its use as a measure of phase connectivity.
McClure et al. (2018) used a geometric state function that incorporates invariant geometric properties to describe the arrangement of fluid phases in a porous medium. Both lattice Boltzmann simulations (McClure et al., 2018) and fast μCT experiments (Meisenheimer et al., 2020a) have shown that a geometric state function using the non-dimensionalized invariant properties of saturation, specific interfacial area and Euler characteristic, can uniquely predict the mean curvature of the system for both quasi- and non-equilibrium conditions.
While the geometric state function can predict the state of a two-fluid flow system under these different flow conditions, the addition of bubble evolution and transport has not yet been investigated. This study will explore whether the geometric state function remains unique with the inclusion of bubble generation and transport under quasi- and non-equilibrium two-fluid flow.
2. Materials and methods
2.1. Fast x-ray μCT setup and bubble generation
All experiments were performed at the Advanced Photon Source (APS) on the GSECARS 13-BMD beamline using pink-beam fast microtomography (fast μCT). The experiments without bubble formation (Meisenheimer et al., 2020a) were performed as reported by Meisenheimer et al. (2020b) using a 1.0 mm copper in-line filter and platinum mirror angled at 1.5 mrad to modify the white beam of the synchrotron to a pink-beam, with x-ray intensities predominantly in the range of 40–60 keV.
Bubble generation and transport was studied using pink-beam with a higher flux of low-energy x-rays, resulting in bubble formation through hydrolysis. Figure 1 shows an example of a bubble that has formed near a developing fluid front within the porous medium. Bubbles were generated by modifying the pink-beam setup with a 1.0 mm titanium in-line filter and a platinum mirror angled at 2.0 mrad for an x-ray beam intensity predominantly in the range of 25–50 keV. Gas volume due to bubble formation was generated at an average rate of 8.7 10−4 cm3/min.
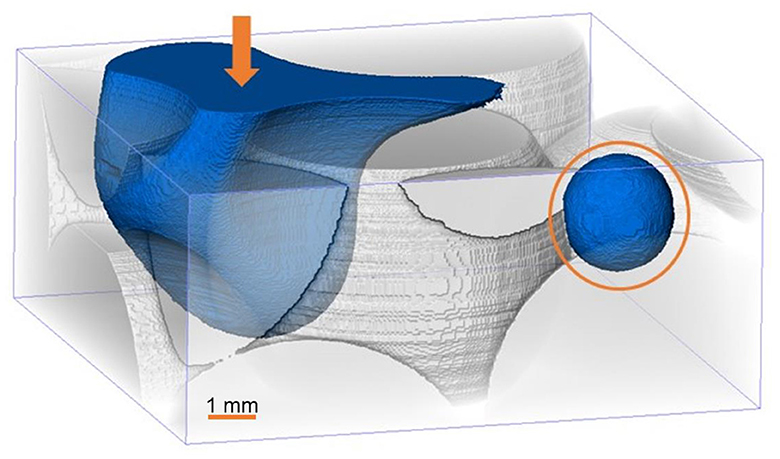
Figure 1. X-ray mCT-based rendering of a gas bubble (circled) growing separate from a developing fluid front that is invading from the top of the glass bead pack during primary drainage. The arrow indicates the flow direction. Relevant image processing steps (including filtering and segmentation steps) are detailed in Meisenheimer et al. (2020a).
2.2. Fluid flow experimental setup
All experiments were performed in soda-lime glass beads (0.8–1.2 mm diameter) that were randomly packed and sintered in 6 mm diameter borosilicate glass columns, the basic setup is illustrated in Figure 2. The two-fluid flow experiments were conducted with water (doped with a 1:6 weight ratio of potassium iodide for image contrast) and air. The wetting phase (water) flow rate was controlled by a Harvard Apparatus PhD 2000 precision syringe pump which prompted the flow of the non-wetting phase (air). A flow rate of 0.2 mL/h was used for all experiments, which corresponded to a capillary number of 2 10−7. For each experiment, the porous medium was initially saturated with wetting phase, then followed by primary drainage (PD), a main imbibition/drainage loop (MI/MD), and at least one imbibition and drainage scanning curve (SI, SD). For the non-equilibrium experiments, flow was continuous for each drainage or imbibition experiment. In contrast, flow was periodically stopped for 15 min at different saturation points along the drainage and imbibition curves (corresponding to ~10% change of saturation) during the quasi-equilibrium experiments to allow the fluid interfaces to relax toward hydrostatic equilibrium. Interfacial relaxation can occur over several hours (e.g., Gray et al., 2015; Schlüter et al., 2017), but the majority of saturation and pressure equilibration occurs within the first few minutes. A μCT scan was collected every minute during flow and relaxation periods.
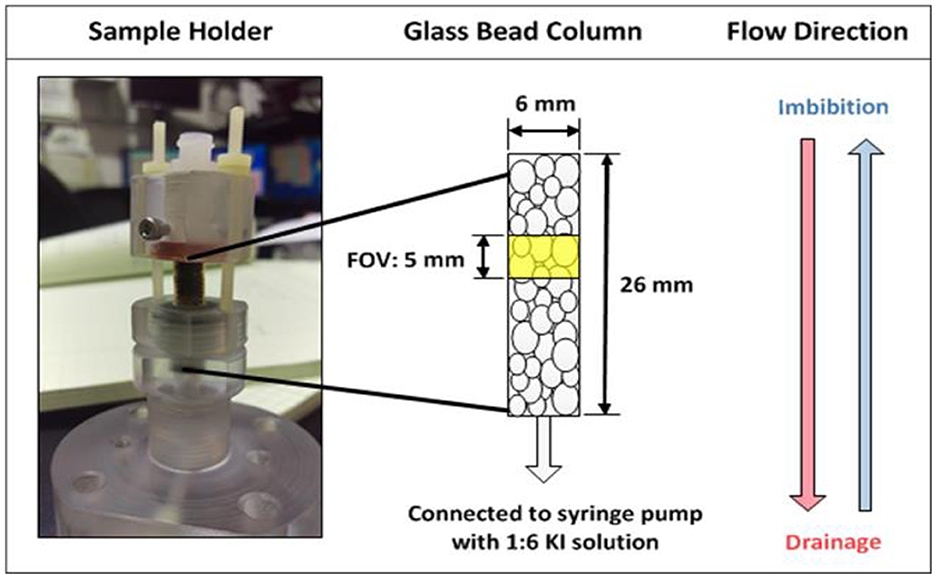
Figure 2. Schematic of experimental setup, showing the entire setup (left), the glass bead sample and dimensions (center), and the flow directions during drainage and imbibition (right).
The experiments were performed on different glass bead packed columns with average porosities of 0.375 ± 0.01. For more details regarding the experimental setup, we refer to Meisenheimer et al. (2020a).
2.3. Image and data processing
The reconstructed data was first passed through a ring-artifact removal step (using the software package ImageJ) to remove large, high-intensity ring artifacts caused by defects in the platinum mirror. The data was then denoised with a non-local means filter (Buades et al., 2005) to accurately preserve fluid interfaces and thereby obtain more accurate measurements of interfacial areas and curvatures. The data was then segmented into separate phases (solid, wetting fluid, and non-wetting fluid) using a watershed segmentation (Vincent and Soille, 1991) from which fluid saturations and Euler characteristics were calculated. During segmentation it was assumed that the fluid characteristics of introduced air and the x-ray generated bubbles were similar, allowing the grouping of the two gas phases into one non-wetting phase. Finally, isosurfaces were generated between the fluid phases so that fluid-fluid interfacial area and curvatures (from which capillary pressure is calculated via the Young-LaPlace equation) could be measured. Each processing step, except for the initial ring artifact removal, was completed in AvizoTM. We refer to Meisenheimer et al. (2020a) for a more detailed description of the image processing steps used in this study.
2.4. Estimating hysteresis of constitutive relationships
Traditionally, the Pc(Sw, anw) relationship has been fitted to the experimental data using a bi-quadratic polynomial expression (e.g., Joekar-Niasar et al., 2008; Porter et al., 2009, 2010). Hysteresis is then estimated by fitting surfaces to the drainage and imbibition data separately and measuring the difference between the surfaces. While this methodology is useful and generates adequate representations, it does not allow for extension to a higher-level dimensionality of the geometric state function.
The geometric state function is based on the generalized form of the Minkowski-Steiner formula (e.g., Federer, 1959; McClure et al., 2018):
where ci are coefficients determined by the shape of the non-wetting phase domain and dr is the radius of a small ball. Equation 2 provides a geometric state relationship that relates a change in the volume of the non-wetting phase (Vn) in terms of the invariant properties of the non-wetting phase: interfacial area (an), mean curvature (Jn), and Euler characteristic (χn). Theoretically, the Minkowski-Steiner formula can define a system independent of how the fluid phases arrived at that state, as long as it is geometrically viable. It follows that Equation 2 can, in theory, define a multi-phase system where non-wetting phase is being introduced outside of standard two-phase flow and transport (i.e., bubble generation).
It is helpful to non-dimensionalize these state variables (i.e., n, , ) using the Sauter mean diameter (the diameter of a sphere that has the same volume/surface area ratio as a particle of interest) to reduce any weighting factors when measuring differences between the experimental data and the model. A modified version of Equation 2 was used by McClure et al. (2018) and Meisenheimer et al. (2020a) to predict the mean curvature of the system using readily available geometric measures, (Sw, nw, ). Another version of Equation 2 was also tested, Vn(nw, , ), by Meisenheimer et al. (2020a) which uses non-wetting phase volume instead of wetting phase saturation; thereby, creating a relationship that is not limited to comparisons within a specific porous medium, as is the case for wetting phase saturation due to its dependence on porosity.
The relationships based on Equation 2 were fitted to locally-smooth spline surfaces using Generalized Additive Models (GAMs; Wood et al., 2015; McClure et al., 2016; Meisenheimer et al., 2020a). The variance within the data indicates the extent to which the functional form explains the observed behavior. Thus, the error associated with the GAM fit was used in this study as an estimate of the degree of hysteresis in the relationship, similar to the bi-quadratic fitting method. Two error values were evaluated for each GAM using the mgcv package in R (Wood, 2011): the coefficient of determination (R2) and the Generalized Cross-Validation (GCV) value. The R2 value measures the proportion of variance in the data, with a value of unity indicating a perfect fit. The GCV measures how well each data point is predicted by the rest of the data set (i.e., if it was not included in the construction of the GAM, Golub et al., 1979), where a value of zero would indicate a surface that perfectly predicts the data.
3. Results and discussion
3.1. Bubble generation; effect on traditional state variables
Figure 3 shows the state variable (Pc, anw, and χn) relationships as a function of wetting saturation for the quasi- and non-equilibrium cases, and with and without bubble formation. Each data point represents an average value for the scanned section of the sample for a given experiment. As can be seen from Figures 3A, B, the Pc(Sw) relationship is minimally affected by bubble formation in both the quasi- and non-equilibrium experiments. This is likely because capillary pressure is an area-averaged value (Meisenheimer et al., 2020a) and bubbles, which constitute small fluid volumes compared to bulk fluid phases, will not significantly affect the average capillary pressure of the system. These results are unsurprising, including the significant hysteresis observed between the main drainage and imbibition loop, but it illustrates uniformity of the various data sets, which originated from measurements on different glass bead columns.
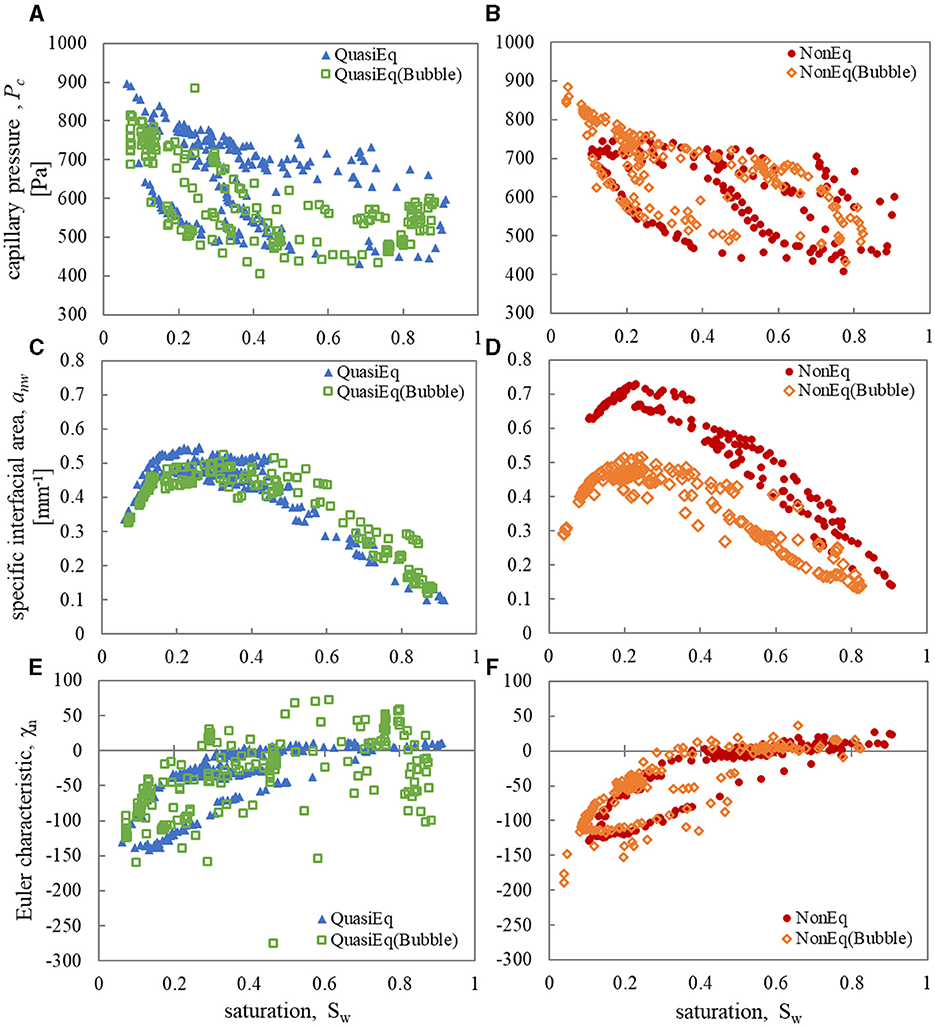
Figure 3. Capillary pressure (Pc) vs. wetting saturation (Sw) for quasi-equilibrium (A) and non-equilibrium (B) two-phase flow with bubble formation (open symbols) and without bubble formation (closed symbols). Similar plots show specific interfacial area (anw) vs. Sw (C, D) and Euler characteristic (χn) vs. Sw (E, F).
Multiple observations can be made regarding the effect of bubble formation on the specific interfacial area relationships. As has been shown in the literature (Gray et al., 2015; Schlüter et al., 2017; Meisenheimer et al., 2020a), interfacial relaxation will reduce interfacial area to a configuration that is thermodynamically more favorable. This is illustrated by the significant reduction of anw for the quasi-equilibrium experiment without bubble formation (Figure 3C, anw, max = 0.55 mm−1) compared to the non-equilibrium experiment without bubble formation (Figure 3D, anw, max = 0.73 mm−1). Interestingly, the non-equilibrium bubble experiment (Figure 3D, anw, max = 0.51 mm−1) produces much less interfacial area than the experiment without bubble formation to the point where the former approaches the magnitude of the quasi-equilibrium experiment. Intuitively, bubble interfaces are at an energetically minimized state when they are being transported and subsequently trapped in the porous media due to their spherical nature (i.e., a sphere has a minimum surface area for a given enclosed volume). These interfaces are therefore already in a thermodynamically favorable state resulting in a anw(Sw) relationship closer to that of a quasi-equilibrium experiment. Also of note is the fact that the quasi-equilibrium experiment with bubble formation (Figure 3C, anw, max = 0.52 mm−1) produces more interfacial area at high Sw and less interfacial area at low Sw compared to the quasi-equilibrium experiment without bubble formation. The increased anw at high wetting saturation is due to the increased amount of disconnected non-wetting phase from the bubbles, whereas the lower generation of anw at low wetting saturation is likely due to a similar mechanism between quasi- and non-equilibrium experiments, i.e., relaxation. While relaxation of fluid-fluid interfaces is already inherent to the quasi-equilibrium case, full relaxation occurs over many hours to days (Gray et al., 2015; Schlüter et al., 2017; Meisenheimer et al., 2020a) and the interfaces were only allowed 15 min of relaxation per quasi-equilibrium point. Therefore, including the more thermodynamically favorable disconnected phase configurations from bubble generation should reduce the overall interfacial area in the same way that relaxation would by itself.
The non-wetting Euler characteristic relationship is also impacted by the presence of bubbles, in particular for the quasi-equilibrium scenario (Figure 3E) where a large amount of scatter in the data is observed compared to the data without bubble generation. This scatter is due to the inherent formulation of the Euler characteristic (Equation 1) where the generation of disconnected non-wetting phase (i.e., bubbles) and its subsequent coalescence with the bulk phase have a large effect on the value of χn. The reason that the quasi-equilibrium experiment demonstrates higher variance is likely due to collection methodology. Bubbles are generated during flow relaxation periods which results in an increase in production of disconnected non-wetting phase compared with the non-equilibrium experiment. On average, both bubble data sets have greater χn values than their corresponding data sets without bubbles. This is because Euler characteristic increases with the number of distinct non-wetting phase regions and therefore bubbles would directly contribute to higher χn values. However, this trend is more significant at lower wetting saturations compared to higher saturations, where the inverse is even observed in the quasi-equilibrium data. By definition, the Euler characteristic is also inversely correlated to the number of redundant correlations within the non-wetting phase. Therefore, as bubbles start to fill multiple pore bodies, χn will decrease, which may explain this reduction in χn values at high saturations. Many of these quasi-equilibrium points at high saturation belong to a relaxation period where fluid flow was stopped, and bubbles were observed to form large multi-pore connected non-wetting phase regions. Therefore, this balance between bubble formation and coalescence into larger non-wetting phase regions is most likely the cause of the large variance in the bubble data, especially the quasi-equilibrium experiment which had more x-ray exposure and, therefore, more bubble generation.
3.2. Capillary pressure, saturation, and interfacial area (Pc-Sw-anw) surfaces
Figure 4 shows the unique bi-quadratic polynomial surface fits relating capillary pressure, saturation and interfacial area for the quasi-equilibrium (Figure 4A) and non-equilibrium (Figure 4B) experiments with bubble formation. The mean squared error of the quasi- and non-equilibrium Pc-Sw-anw surfaces to the experimental data was 9.96 10−4 and 1.32 10−3, respectively. Although the squared error is relatively low, there is still variance in the data relative to the unique surfaces as can be seen in Figure 4. Generating separate drainage and imbibition surfaces (Figure 5) shows the main cause of this variance: the drainage and imbibition surfaces do not overlap for either of the flow conditions, yet, the separation is much more pronounced for the non-equilibrium case. Table 1 shows the root mean squared error (RMSE) and mean absolute error (MAE) between the drainage and imbibition surfaces for each flow condition, as well as the error between the unique surfaces (Figure 4) and the drainage or imbibition surfaces shown in Figure 5. With maximum anw values for both bubble experiments around 0.5 mm−1, the error values between the drainage and imbibition surfaces are comparatively large which indicates a large amount of hysteresis in the relationship.
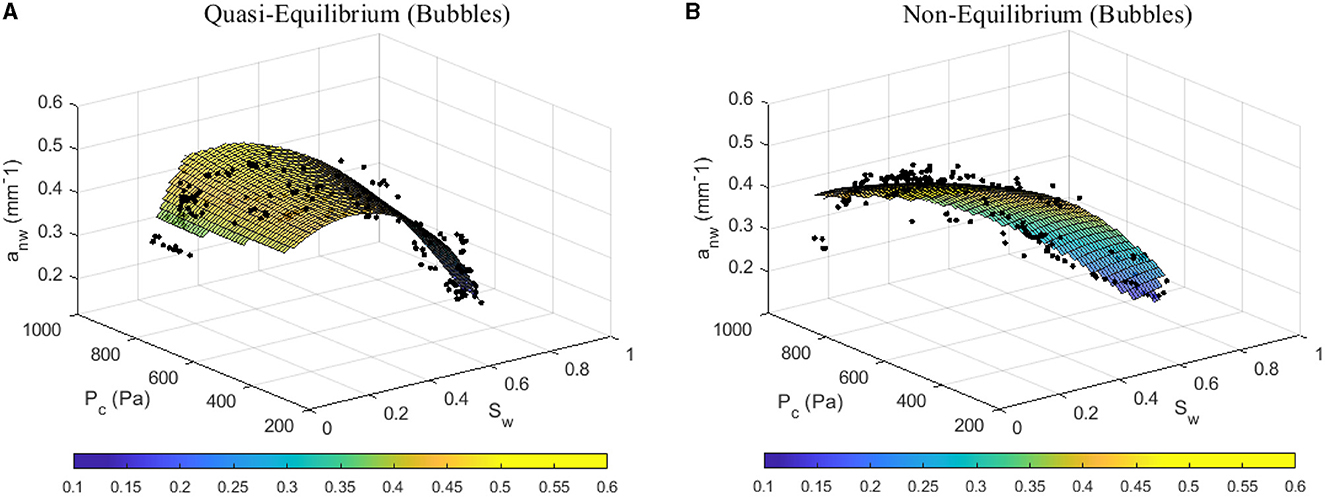
Figure 4. Unique Pc-Sw-anw surfaces for the quasi-equilibrium (A) and non-equilibrium (B) experiments with bubble formation.
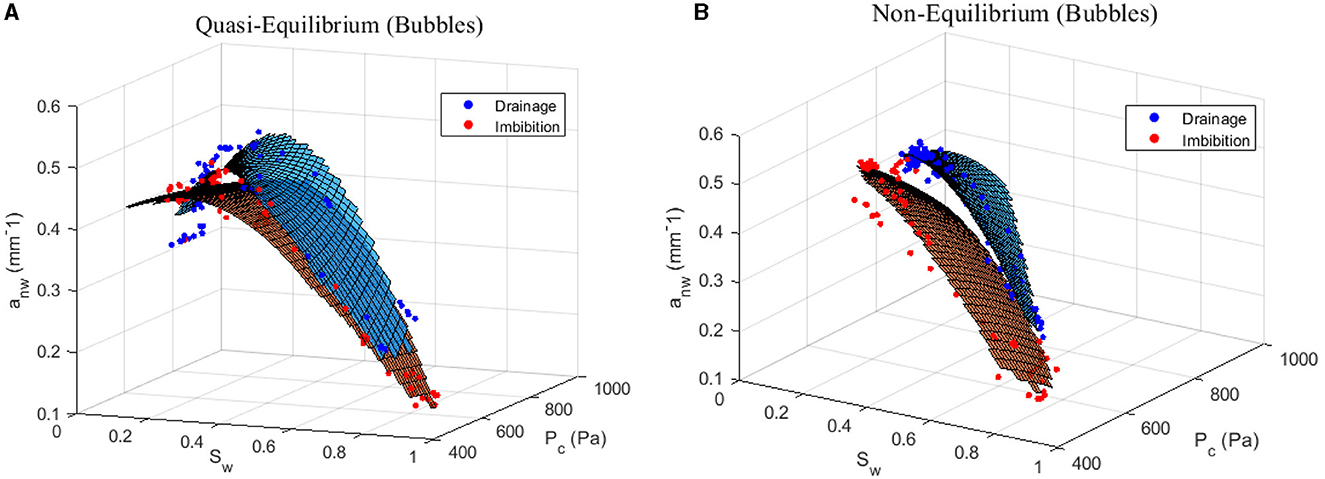
Figure 5. Separated drainage (blue) and imbibition (red) Pc-Sw-anw surfaces for the quasi-equilibrium (A) and non-equilibrium (B) experiments with bubble formation. Axes are rotated to best visualize the separation between the drainage and imbibition surfaces.
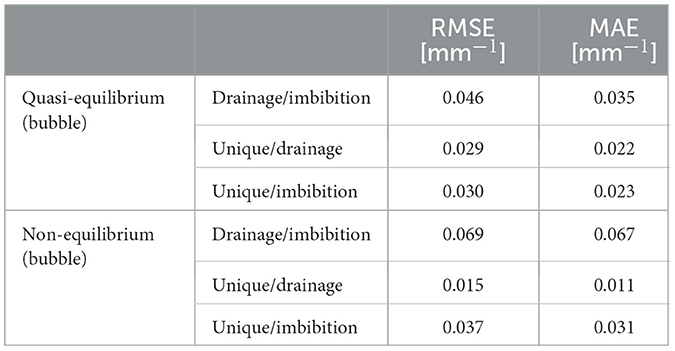
Table 1. Error estimates for the two scenarios (quasi-equilibrium and non-equilibrium).
The hysteresis in the Pc-Sw-anw surfaces for the non-equilibrium experiment with bubble formation corresponds with other studies that did not include bubbles (Godinez-Brizuela et al., 2017; McClure et al., 2018; Meisenheimer et al., 2020a), however, the large amount of hysteresis in the quasi-equilibrium experiment with bubbles runs contrary to many studies without bubble formation (e.g., Pyrak-Nolte et al., 2008; Porter et al., 2010; Joekar-Niasar and Hassanizadeh, 2011). This suggests that bubble formation and entrapment occur in a manner that cannot be predicted by the Pc(Sw, anw) relationship, and further extensions to the constitutive relationship are needed to fully capture these mechanisms.
3.3. The effect of bubbles on the geometric state function
The constitutive relationships for the quasi- and non-equilibrium bubble experiments were fitted using GAMs and the associated error in those relationships are presented in Figure 6. The (Sw) relationship, unsurprising, is highly hysteretic with only 58% of the variance in the data explained by the relationship for both flow conditions. With the inclusion of interfacial area, we find that the (Sw, nw) relationship is also hysteretic, and the quasi-equilibrium bubble data displays significantly more hysteresis (QuasiEq: R2 = 0.73, GCV = 0.053) compared to the non-equilibrium bubble data (NonEq: R2 = 0.82, GCV = 0.031). This corroborates the error observed in the bi-quadradic polynomial surfaces.
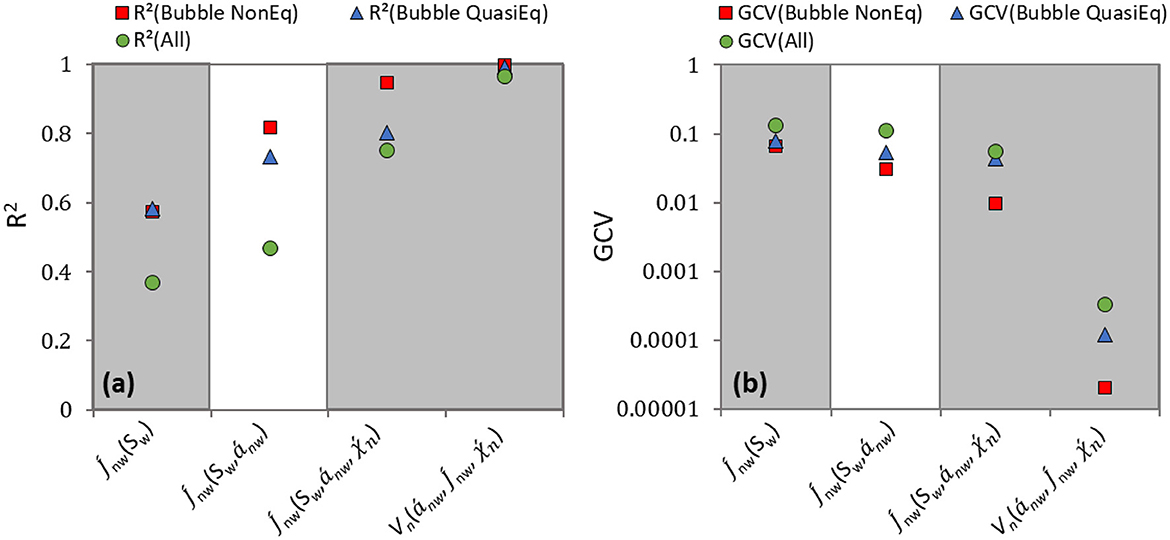
Figure 6. Associated quasi- and non-equilibrium R2 (a) and GCV (b) error values for GAM fits for various constitutive relationships. A combined dataset (“All”) is also presented which combines all the quasi- and non-equilibrium data with and without bubble formation (including data from Meisenheimer et al., 2020a). R2 values closer to 1.0 and GCV values closer to 0.0 indicate a better fit.
When the state function is further extended to include the Euler characteristic [(Sw, nw, )], it becomes increasingly appropriate for predicting the state of the system, as also seen in previous studies without bubble formation (McClure et al., 2018; Meisenheimer et al., 2020a). Interestingly, the non-equilibrium data with bubbles presented here and without bubble generation (Meisenheimer et al., 2020a), is associated with nearly the same error for the (Sw, nw, ) GAM fit (with bubbles: R2 = 0.95, GCV = 0.01; without bubbles: R2 = 0.95, GCV = 0.009). This is not the case for the quasi-equilibrium data where only 80% of the variance in the bubble experiment is explained by the GAM fit, compared to 98% in the experiment without bubbles in Meisenheimer et al. (2020a). Thus, further confirming the observation that bubble formation has a greater impact on the quasi-equilibrium data. The question remains whether this effect is entirely because the quasi-equilibrium experiment supports more bubble generation or whether other factors are at play.
The Vn(nw, , ) relationship was also tested for the bubble-affected data. This relationship should provide a better fit because the experiments were performed in similar, but not exact, glass bead packs and Vn is not dependent on the porosity of the porous medium unlike Sw. This seems to be the case as, seen in Figure 6, both the quasi- and non-equilibrium GAM fits for the bubble experiments provided statistically unique predictions of the state of the system (QuasiEq: R2 = 0.993, GCV = 1.19·10−4; NonEq: R2 = 0.998, GCV = 2.06·10−5).
Finally, the bubble and non-bubble data was combined into one dataset (“All” in Figure 6) to investigate whether the conclusions are independent of flow condition (quasi-equilibrium vs. non-equilibrium). As was also reported by Meisenheimer et al. (2020a) for the non-bubble scenario; the combined bubble-affected data set cannot explain the variance in the data for most of the presented constitutive relationships. The only exception is the Vn(nw, , ) relationship (R2 = 0.97, GCV = 3.0·10−3) with errors within experimental error. We therefore conclude that the Vn(nw, , ) relationship can uniquely predict the state of the system independent of flow condition (quasi-equilibrium vs. non-equilibrium), and whether the system is affected by bubble formation or not. This intuitively makes sense because the Minkowski-Steiner formula predicts the fluid configuration within a porous medium based on intrinsic state variables. Therefore, any fluid interface generated in the system (regardless of whether it was generated by multiphase flow or through bubble exsolution and transport) should be geometrically constrained and therefore accurately predicted by the Vn(nw, , ) relationship. As mentioned previously, this is not the case when the system is represented by theory based on rational thermodynamics using only the Pc(Sw, anw) relationship, but also to a lesser degree when the four-variable relationship that includes wetting phase saturation [(Sw, nw, )] is used.
4. Conclusions
Processes involving bubble formation and transport within porous media have many applications within environmental and engineered systems, yet most traditional models cannot predict the state of a multiphase system that is affected by transient bubble evolution and transport.
To that end, we present the use of constitutive relationships based on the Minkowski-Steiner formula for reliably predicting two-phase flow in glass beads using intrinsic geometric state variables. Because the Minkowski-Steiner formula can theoretically describe any configuration of fluid phases that is geometrically viable, it follows that it should be able to define a system with bubble generation. The analysis showed that the four-variable relationship that includes wetting phase saturation [(Sw, nw, )] was an improvement over lower dimensional relationships, such as the Pc(Sw, anw) relationship, which has previously been shown to be non-hysteretic, in the absence of bubble formation and transport. We demonstrate here that the Pc(Sw, anw) relationship fails to accurately capture the system behavior in the presence of bubbles. Further, the alternate four-variable relationship that omits wetting phase saturation and more closely represents the Minkowski-Steiner formula, Vn(nw, , ), uniquely predicted the state of a two-phase system independent of whether bubbles were forming or not, as well as the configuration of fluids under both quasi- and non-equilibrium flow conditions. We conclude that the Vn(nw, , ) relationship is a more versatile representation that can predict two-phase flow under the variety of circumstances presented in the study.
The findings presented here are valid for the air-water glass bead system studied under a flow regime described by a capillary number of 2·10−7. Expansion of the experimental methodology to include variations in flow rate is needed to further expand the applicability of these results. Also, experiments in more varied and environmentally representative porous media would be needed to investigate the effect of varying porous media, such as pore size distribution, surface roughness, etc. on this relationship.
Data availability statement
The raw data supporting the conclusions of this article will be made available by the authors, without undue reservation.
Author contributions
DW: funding acquisition, conceptualization, methodology, supervision, validation, resources, formal analysis, and writing—reviewing and editing. DM: data curation, investigation, software, methodology, visualization, formal analysis, and writing—original draft preparation, reviewing, and editing. All authors contributed to the article and approved the submitted version.
Funding
This work was supported by the U.S. National Science Foundation, Hydrologic Sciences Program under award #1344877. This work was performed at GeoSoilEnviroCARS (The University of Chicago, Sector 13), Advanced Photon Source (APS), Argonne National Laboratory. GeoSoilEnviroCARS was supported by the National Science Foundation—Earth Sciences (EAR—1634415) and Department of Energy—GeoSciences (DE-FG02-94ER14466). This research used resources of the Advanced Photon Source, a U.S. Department of Energy (DOE) Office of Science User Facility operated for the DOE Office of Science by Argonne National Laboratory under Contract No. DE-AC02-06CH11357.
Conflict of interest
The authors declare that the research was conducted in the absence of any commercial or financial relationships that could be construed as a potential conflict of interest.
Publisher's note
All claims expressed in this article are solely those of the authors and do not necessarily represent those of their affiliated organizations, or those of the publisher, the editors and the reviewers. Any product that may be evaluated in this article, or claim that may be made by its manufacturer, is not guaranteed or endorsed by the publisher.
References
Bass, D. H., Hastings, N. A., and Brown, R. A. (2000). Performance of air sparging systems: a review of case studies. J. Hazard. Mater. 72, 101–119. doi: 10.1016/S0304-3894(99)00136-3
Beckwith, C. W., and Baird, A. J. (2001). Effect of biogenic gas bubbles on water flow through poorly decomposed blanket peat. Water Resour. Res. 37, 551–558. doi: 10.1029/2000WR900303
Berg, S., Rücker, M., Ott, H., Georgiadis, A., van der Linde, H., Enzmann, F., et al. (2016). Connected pathway relative permeability from pore-scale imaging of imbibition. Adv. Water Res. 90, 24–35. doi: 10.1016/j.advwatres.2016.01.010
Brown, R. A., Hicks, R. J., and Hicks, P. M. (1994). “Use of air sparging for in situ bioremediation,” in Air Sparging for Site Remediation, eds R. E. Hinchee and B. Raton (Lewis Publishers), 38–55.
Buades, A., Coll, B., and Morel, J. M. (2005). “A non-local algorithm for image denoising,” in 2005 IEEE Computer Society Conference on Computer Vision and Pattern Recognition (CVPR'05), Vol. 2 (San Diego, CA), 60–65.
Chen, X., and Slater, L. (2015). Gas bubble transport and emissions for shallow peat from a northern peatland: the role of pressure changes and peat structure. Water Resour. Res. 51, 151–168. doi: 10.1002/2014WR016268
Cheng, J. T., Pyrak-Nolte, L. J., Nolte, D. D., and Giordano, N. J. (2004). Linking pressure and saturation through interfacial areas in porous media. Geophys. Res. Lett. 31, 1–4. doi: 10.1029/2003GL019282
Federer, H. (1959). Curvature measures. Trans. Amer. Math. Soc. 93, 418–491. doi: 10.1090/S0002-9947-1959-0110078-1
Fortuin, N. P. M., and Willemsen, A. (2005). Exsolution of nitrogen and argon by methanogenesis in Dutch ground water. J. Hydrol. 301, 1–13. doi: 10.1016/j.jhydrol.2004.06.018
Fry, V. A., Istok, J. D., Semprini, L., O'Reilly, K. T., and Buscheck, T. E. (1995). Retardation of dissolved oxygen due to a trapped gas phase in porous media. Ground Water 33, 391–398. doi: 10.1111/j.1745-6584.1995.tb00295.x
Geistlinger, H., Lazik, D., Krauss, G., and Vogel, H.-J. (2009). Pore-scale and continuum modeling of gas flow pattern obtained by high-resolution optical bench-scale experiments. Water Resour. Res. 45, 2007WR006548. doi: 10.1029/2007WR006548
Glass, R. J., and Yarrington, L. (2003). Mechanistic modeling of fingering, nonmonotonicity, fragmentation, and pulsation within gravity/buoyant destabilized two-phase/unsaturated flow. Water Resour. Res. 39, 2002WR001542. doi: 10.1029/2002WR001542
Godinez-Brizuela, O. E., Karadimitriou, N. K., Joekar-Niasar, V., Shore, C. A., and Oostrom, M. (2017). Role of corner interfacial area in uniqueness of capillary pressure-saturation- interfacial area relation under transient conditions. Adv. Water Resour. 107, 10–21. doi: 10.1016/j.advwatres.2017.06.007
Golub, G. H., Heath, M., and Wahba, G. (1979). Generalized cross-validation as a method for choosing a good ridge parameter. Technometrics 21, 215–223. doi: 10.1080/00401706.1979.10489751
Gray, W. G., Dye, A. L., McClure, J. E., Pyrak-Nolte, L. J., and Miller, C. T. (2015). On the dynamics and kinematics of two-fluid-phase flow in porous media. Water Resour. Res. 51, 5365–5381. doi: 10.1002/2015WR016921
Hao, Y., Sun, Y., and Nitao, J. J. (2012). “Overview of NUFT: a versatile numerical model for simulating flow and reactive transport in porous media,” in Groundwater Reactive Transport Models, eds F. Zhang, G.-T. Yeh, and C. P. Jack (Sharjah: Bentham Science Publishers) 212–239. doi: 10.2174/978160805306311201010212
Hassanizadeh, S. M., and Gray, W. G. (1993). Thermodynamic basis of capillary pressure in porous media. Water Resour. Res. 29, 3389–3405. doi: 10.1029/93WR01495
He, Y., Cui, Y., Zhao, Z., Chen, Y., Shang, W., and Tan, P. (2023). Strategies for bubble removal in electrochemical systems. Energy Rev. 2, 100015. doi: 10.1016/j.enrev.2023.100015
Hegele, P. R., and Mumford, K. G. (2014). Gas production and transport during bench-scale electrical resistance heating of water and trichloroethene. J. Contaminant Hydrol. 165, 24–36. doi: 10.1016/j.jconhyd.2014.07.002
Held, R. J., and Celia, M. A. (2001). Modelling support of functional relationships between capillary pressure, saturation, interfacial area and common lines. Adv. Water Resour. 24, 325–343. doi: 10.1016/S0309-1708(00)00060-9
Herring, A. L., Harper, E. J., Andersson, L., Sheppard, A., Bay, B. K., and Wildenschild, D. (2013). Effect of fluid topology on residual nonwetting phase trapping: implications for geologic CO2 sequestration. Adv. Water Resour. 62, 47–58. doi: 10.1016/j.advwatres.2013.09.015
Hunt, A. G., and Manga, M. (2003). Effects of bubbles on the hydraulic conductivity of porous materials—theoretical results. Transport Porous Media 52, 51–56. doi: 10.1023/A:1022312927606
Joekar-Niasar, V., and Hassanizadeh, S. M. (2011). Specific interfacial area: the missing state variable in two-phase flow equations? Water Resour. Res. 47, 1–14. doi: 10.1029/2010WR009291
Joekar-Niasar, V., and Hassanizadeh, S. M. (2012). Uniqueness of specific interfacial area-capillary pressure-saturation relationship under non-equilibrium conditions in two-phase porous media flow. Transp. Porous Med. 94, 465–486. doi: 10.1007/s11242-012-9958-3
Joekar-Niasar, V., Hassanizadeh, S. M., and Leijnse, A. (2008). Insights into the relationships among capillary pressure, saturation, interfacial area and relative permeability using pore-network modeling. Transport Porous Media 74, 201–219. doi: 10.1007/s11242-007-9191-7
Johnson, J. W., Nitao, J. J., and Knauss, K. G. (2004). Reactive transport modelling of CO2 storage in saline aquifers to elucidate fundamental processes, trapping mechanisms and sequestration partitioning. Geol. Soc. 233, 107–128. doi: 10.1144/GSL.SP.2004.233.01.08
Johnson, R. L., Johnson, P. C., McWhorter, D. B., Hinchee, R. E., and Goodman, I. (1993). An overview of in situ air sparging. Groundw. Monitor. Remediat. 13, 127–135. doi: 10.1111/j.1745-6592.1993.tb00456.x
Karadimitriou, N. K., Hassanizadeh, S. M., Joekar-Niasar, V., and Kleingeld, P. J. (2014). Micromodel study of two-phase flow under transient conditions: Quantifying effects of specific interfacial area. Water Resour. Res. 50, 8125–8140. doi: 10.1002/2014WR015388
Krol, M. M., Mumford, K. G., Johnson, R. L., and Sleep, B. E. (2011). Modeling discrete gas bubble formation and mobilization during subsurface heating of contaminated zones. Adv. Water Resour. 34, 537–549. doi: 10.1016/j.advwatres.2011.01.010
Li, H., Hu, L., Song, D., and Al-tabbaa, A. (2014). Subsurface transport behavior of micro-nano bubbles and potential applications for groundwater remediation. Int. J. Environ. Res. Public Health 11, 473–486. doi: 10.3390/ijerph110100473
McClure, J. E., Armstrong, R. T., Berrill, M. A., Berg, S., Gray, W. G., and Miller, C. T. (2018). Geometric state function for two-fluid flow in porous media. Phys. Rev. Fluids 3, 1–16. doi: 10.1103/PhysRevFluids.3.084306
McClure, J. E., Berrill, M. A., Gray, W. G., and Miller, C. T. (2016). Influence of phase connectivity on the relationship among capillary pressure, fluid saturation, and interfacial area in two-fluid-phase porous medium systems. Phys. Rev. E. 94, 1–12. doi: 10.1103/PhysRevE.94.033102
Meisenheimer, D. E., McClure, J. E., Rivers, M. L., and Wildenschild, D. (2020a). Exploring the effect of flow condition on the constitutive relationships for two-phase flow. Adv. Water Resour. 137. doi: 10.1016/j.advwatres.2020.103506
Meisenheimer, D. E., Rivers, M. L., and Wildenschild, D. (2020b). Optimizing pink-beam fast X-ray microtomography for multiphase flow in 3D porous media. J. Microsc. 277, 100–106. doi: 10.1111/jmi.12872
Molnar, I. L., Mumford, K. G., and Krol, M. M. (2019). Electro-thermal subsurface gas generation and transport: model validation and implications. Water Resour. Res. 55, 4630–4647. doi: 10.1029/2018WR024095
Oldenburg, C. M., and Unger, A. J. A. (2003). On leakage and seepage from geologic carbon sequestration sites: unsaturated zone attenuation. Vadose Zone J. 2, 287–296. doi: 10.2136/vzj2003.2870
Porter , M. L., Schaap, M. G., and Wildenschild, D. (2009), Lattice-Boltzmann simulations of the capillary pressure–saturation–interfacial area relationship in porous media. Adv. Water Resour. 32, 1632–1640. doi: 10.1016/j.advwatres.2009.08.009
Porter, M. L., Wildenschild, D., Grant, G., and Gerhard, J. I. (2010). Measurement and prediction of the relationship between capillary pressure, saturation, and interfacial area in a NAPL-water-glass bead system. Water Resour. Res. 46, 1–10. doi: 10.1029/2009WR007786
Pruess, K., Oldenburg, C., and Moridis, G. (1999). TOUGH2 User's Guide Version 2. Berkeley, CA: Ernest Orlando Lawrence Berkeley National Laboratory.
Pyrak-Nolte, L. J., Nolte, D. D., Chen, D., and Giordano, N. J. (2008). Relating capillary pressure to interfacial areas. Water Resour. Res. 44, 1–14. doi: 10.1029/2007WR006434
Schlüeter, S., Berg, S., Ruecker, M., Armstrong, R. T., Vogel, H.-J., Hilfer, R., and Wildenschild, D. (2016). Pore-scale displacement mechanisms as a source of hysteresis for two-phase flow in porous media. Water Resour. Res. 52, 2194–2205. doi: 10.1002/2015WR018254
Schlüeter, S., Sheppard, A., Brown, K., and Wildenschild, D. (2014). Image processing of multiphase images obtained via X-ray microtomography: A review. Water Resour. Res. 50, 3615–3639. doi: 10.1002/2014WR015256
Schlüter, S., Berg, S., Li, T., Vogel, H. J., and Wildenschild, D. (2017). Time scales of relaxation dynamics during transient conditions in two-phase flow. Water Resour. Res. 53, 4709–4724. doi: 10.1002/2016WR019815
Singh, K., Menke, H., Andrew, M., Lin, Q., Rau, C., Blunt, M. J., et al. (2017). Dynamics of snap-off and pore-filling events during two-phase fluid flow in permeable media. Sci. Rep. 7, 5192. doi: 10.1038/s41598-017-05204-4
Triplett Kingston, J. L., Dahlen, P. R., and Johnson, P. C. (2010). State-of-the-practice review of in situ thermal technologies. Ground Water Monitor. Remed. 30, 64–72. doi: 10.1111/j.1745-6592.2010.01305.x
Vincent, L., and Soille, P. (1991). Watersheds in digital spaces: an efficient algorithm based on immersion simulations. IEEE Trans. Pattern Anal. Mach. Intel. 13, 583–598. doi: 10.1109/34.87344
Wood, S. N. (2011). Fast stable restricted maximum likelihood and marginal likelihood estimation of semiparametric generalized linear models. J. Royal Stat. Soc. 73, 3–36. doi: 10.1111/j.1467-9868.2010.00749.x
Wood, S. N., Goude, Y., and Shaw, S. (2015). Generalized additive models for large data sets. J. Royal Stat. Soc. Ser. C-Appl. Stat. 64, 139–155. doi: 10.1111/rssc.12068
Keywords: two-phase flow, constitutive relationships, non-equilibrium flow, bubbles, interfacial relaxation, topology
Citation: Meisenheimer DE and Wildenschild D (2023) Incorporating bubble evolution and transport in constitutive relationships for quasi- and non-equilibrium two-phase flows in porous media. Front. Water 5:1167872. doi: 10.3389/frwa.2023.1167872
Received: 16 February 2023; Accepted: 31 July 2023;
Published: 16 August 2023.
Edited by:
Bjornar Sandnes, Swansea University, United KingdomReviewed by:
Grigori Chapiro, Juiz de Fora Federal University, BrazilRan Holtzman, Coventry University, United Kingdom
Copyright © 2023 Meisenheimer and Wildenschild. This is an open-access article distributed under the terms of the Creative Commons Attribution License (CC BY). The use, distribution or reproduction in other forums is permitted, provided the original author(s) and the copyright owner(s) are credited and that the original publication in this journal is cited, in accordance with accepted academic practice. No use, distribution or reproduction is permitted which does not comply with these terms.
*Correspondence: Dorthe Wildenschild, ZG9ydGhlLndpbGRlbnNjaGlsZEBvcmVnb25zdGF0ZS5lZHU=