 Olfa Gharsallah1
 Michele Rienzner1Alice Mayer1Darya Tkachenko1
 Stefano Corsi1
 Rina Vuciterna1Marco Romani2Andrea Ricciardelli2
 Elisa Cadei2
 Marco Trevisan3Lucrezia Lamastra3Alice Tediosi4
 Diego Voccia3Arianna Facchi1*
- 1Department of Agricultural and Environmental Sciences—Production, Landscape, Agroenergy, Università degli Studi di Milano, Milan, Italy
- 2Centro Ricerche sul Riso, Ente Nazionale Risi, Castello d'Agogna, Italy
- 3Dipartimento di Scienze e Tecnologie Alimentari per una filiera agro-alimentare Sostenibile, Università Cattolica del Sacro Cuore, Piacenza, Italy
- 4Aeiforia srl, Gariga di Podenzano, Italy
Italy is Europe's leading rice producer, with over half of total production almost totally concentrated in the north-western part of the Padana plain. In this area, rice irrigation has traditionally been carried out by wet seeding and continuous flooding. The replacement of this technique with the dry seeding and delayed flooding in the last 15 years brought economic benefits to farmers but also strong impacts to the water resource system of the area, characterized by a strong interaction between irrigation and shallow aquifer levels. Wet seeding and Alternate Wetting and Drying (AWD) could be seen as an alternative irrigation strategy; however, its environmental, economic and social sustainability must be investigated before supporting the dissemination of this “water-saving” irrigation technique over the territory in cooperation with decision-makers and water resource managers. In this paper, the results of an experimental activity carried out in a platform established in the main Italian rice district to compare three irrigation strategies (wet seeding and traditional flooding—WFL, dry seeding and delayed flooding from around the 3-leaf stage—DFL, wet seeding and alternated wetting and drying from the tillering stage—AWD) and data further provided by the farm holder (agronomic inputs and economic costs for the three options) were used to assess their economic and environmental sustainability through an assessment procedure based on quantitative indicators. Interviews with rice growers in the area were used to identify barriers to the adoption of AWD and subsequently propose ways to overcome them. AWD proved to be economically viable and to reduce the irrigation need in the peak month (June) without significantly affecting rice yield or quality (cadmium and arsenic content in rice grain). Additionally, it guarantees the recharging of the phreatic aquifer in the first period of the irrigation season, while reducing the methane (CH4) emissions, facing another significant environmental challenge of rice cultivation. Rice growers in the region stated their willingness to adopt AWD, although they would need technical, technological and financial support. The assessment procedure adopted in this paper proved to be effective for comparing rice irrigation techniques and is available for further studies.
1. Introduction
Rice is one of the most widely grown crops in the world and is the staple food for more than half of the global population. Rice is grown in most countries under flooding conditions using large volumes of water, which may also mobilize agrochemicals; moreover, anoxic conditions are responsible for the emission of an important greenhouse gas (methane). From 1961 to 2019, the rice area harvested globally increased from about 115 million ha to about 195 million ha, with significant conversions of natural to arable lands In the Mediterranean basin, rice is cultivated over an area of 1,000,000 ha. The most important rice-producing countries are Italy and Spain in southern Europe (80% of the southern EU production; 388,000 ha), and Egypt and Turkey among the extra-EU countries (almost totality of the production, which is 612,000 ha; FAOSTAT, 2021).
Italy is the leading rice producer in Europe, with more than half of the total production and a high-quality level. By far, the most important rice-growing area is the portion of the Padana plain located on the left bank of the Po River and along the Ticino River, straddling the regions of Lombardy and Piedmont in northern Italy (more than 200,000 ha, 92% of the Italian rice surface, Ente Nazionale Risi, 2020). This area has unique characteristics, mainly due to the following aspects: (i) large prevalence of rice cultivation, even if occasionally alternated with other crops in rotation; (ii) historical abundance of surface water resources, diverted from rivers; (iii) gravity irrigation systems, characterized by extensive networks of unlined irrigation and drainage canals and traditional irrigation methods (flooding); (iv) strong interactions between irrigation and groundwater dynamics, due to a huge percolation from paddies and channel networks and shallow aquifers in large portions of the irrigated areas; (v) reuse of irrigation water, since the shallow groundwater, fed by the huge percolation, contributes to water discharges in rivers and irrigation networks within the area, whose water is used for irrigating the agricultural areas downstream; (vi) multi-functionality and ecosystem services provided by the traditional irrigation systems (i.e., biodiversity and landscape quality); (vii) use of chemicals (fertilizers and plant protection products) which, if improperly used, can lead to surface water and groundwater pollution; (viii) limited availability of flow discharge and water quality measurements; (ix) changed environmental and economic conditions in recent years, leading to the need to revise the rice cultivation methods in the area.
The delicate hydrological balance that has characterized this area for centuries, based on the strong interconnection between irrigation and the shallow phreatic aquifer, has experienced major difficulties in the last decade due to a climatic situation increasingly characterized by short and intense rainfall alternated with periods of water scarcity, a wide conversion to the dry seeding of rice, which led to a decreased groundwater level in the first part of the agricultural season, and increased attention of public opinion toward sustainable use of water resources. As a consequence, rice cropping in the area is facing important challenges aimed at increasing its environmental sustainability, which concerns not only the rationalization of water use but also the increase in fertilization efficiency, the reduction of greenhouse gas emissions, and sustainable control of physiopathies. In this context, it has become particularly important to identify techniques that allow facing all these problems while preserving the qualitative and quantitative levels reached by Italian rice production.
The Alternate Wetting and Drying (AWD) technique, tested for 20–30 years in the rice fields of various countries, is based on the intermittent flooding of rice fields, allowing for a continuous alternation of soil aerobic and anaerobic conditions. In particular, starting for a certain rice development stage, when the soil water content in the soil layer explored by rice roots falls below a threshold value, a flooding event is started to bring the ponding water within the paddy back to a certain level (usually 8–12 cm). The AWD strategy can be applied after water or dry seeding. The soil water content threshold can be more or less severe and can be monitored by soil water status sensors or devices (e.g., soil water moisture or potential sensors or field water tubes—consisting of windowed tubes inserted vertically into the rooted soil, which allow monitoring the perched groundwater level while it falls, during dry days, below the ground level up to a certain depth). The timing of the flooding events depends on the climate, type of soil and rice growth stage.
Studies in the literature have shown that AWD management can lead to a yield reduction with respect to traditional continuous flooding (Linquist et al., 2015; Carrijo et al., 2017; Chlapecka et al., 2019); however, if the soil water content threshold adopted for the AWD management is safe enough, yield is commonly maintained. Carrijo et al. (2017) analyzed 56 studies from all over the world (80% were from Asia, including 30% from China). In most of the studies, AWD was associated with transplanting. With reference to the AWD severity, it was observed that a safe AWD (water level inside a water tube ≥ −15 cm from the soil surface or soil water potential measured with a tensiometer—SWP ≥ −20 kPa) leads to no yield reduction (Carrijo et al., 2017; Chlapecka et al., 2019). However, when the AWD severity increases (water level inside the water tube <15 cm or SWP <−20 kPa), the yield reduction increases up to about 23%. It was also observed that the seeding mode (transplanting or direct seeding) and the type of variety (hybrid or bred) did not affect the relative yield when adopting AWD (Carrijo et al., 2017). In the case of a safe AWD, the average water saving was observed to be about 23–24% with respect to continuous flooding, while in the case of a severe AWD, the water saving may increase up to 33–34% (Carrijo et al., 2017), but with a relevant yield loss.
Numerous studies on greenhouse gas emissions showed lower methane emissions when adopting AWD instead of continuous flooding (Linquist et al., 2015; Carrijo et al., 2017). However, the effectiveness of AWD in reducing CH4 emissions varies according to the length of the flooding and drying periods. In some cases, compared to the continuous flooding technique, AWD induces an increase in N2O emissions due to the more frequent and longer soil oxidation periods.
The large-scale adoption of a new irrigation technique which brings environmental benefits can take place in a territory only if this technique is economically advantageous for farmers and is socially accepted. In the last 20 years, several studies proposed methodological frameworks to assess the different dimensions of sustainability for the management practices adopted in agro-ecosystems (see, among the others: Sauvenier et al., 2005; Häni et al., 2006; Bechini and Castoldi, 2010; FAO, 2013; Paracchini et al., 2015; Gharsallah et al., 2021). Furthermore, the social acceptability of innovation can be investigated through theoretical approaches based on the technology acceptance model (TAM; Davis, 1989), which focuses on analyzing the determinants of technology adoption.
The social acceptability of innovation in agriculture can be evaluated considering a theoretical approach based on the Technology Acceptance Model (TAM; Davis, 1989). TAM is widely used in the analysis of the determinants of technology adoption. Focusing on attitude and perception aspects, the model identifies two main constructs, Perceived Usefulness and Perceived Ease of Use, as predictors of the final intention to adopt a technological innovation (User Acceptance). Several models and theories have been discussed in the field of information technology acceptance, such as the theory of planned behavior (TPB; Ajzen, 1991), the diffusion of innovation (DOI) theory (Rogers et al., 2019), and the unified theory of acceptance and use of technology (UTAUT; Venkatesh et al., 2003). Based on the literature, TAM still is the dominant model for investigating factors affecting users' acceptance of novel technical systems (Legris et al., 2003). TAM is based on the theory of reasoned action (TRA) proposed by Fishbein and Ajzen (1975), who demonstrated that behavior is best predicted by intentions determined both by the person's attitude and subjective norms concerning the behavior. The dominance of quantitative methods is particularly apparent in the acceptance research stream, but mixed (Khaksar et al., 2019) and fully qualitative methods have been recently published. In particular, Van Biljon and Renaud (2008) applied TAM to senior mobile phone users, Vogelsang et al. (2013) to Project Management Software, Campbell et al. (2017) to mobile health interventions, Saxena and Punekar (2020) to pro-poor mobile financial services.
This paper aims to investigate the economic, environmental and social sustainability of the wet seeding and Alternate Wetting and Drying (AWD) irrigation technique applied in northern Italy compared to the traditional Wet seeding and continuous FLooding (WFL), or the recently introduced and very widespread Dry seeding and delayed FLooding (DFL). The AWD is expected to: (i) reduce water use without compromising yield production and farmers' income; (ii) reduce the environmental impacts due to the continuous flooding conditions. Moreover, the paper explore the barriers of farmers in adopting AWD, in order to introduce and promote measures to increase their willingness to adopt the innovative water regime.
To test advantages and drawbacks of AWD in the Italian rice context, an experimental platform was set up at the National Rice Research Center (Pavia, Italy) in 2019 and 2020. The following three irrigation techniques were compared: (i) water seeding and continuous flooding (WFL); (ii) dry seeding and delayed flooding at the 3rd−4th leaf (DFL); and a safe wet seeding and Alternate Wetting and Drying (AWD). Data collected in the experimental platform and through questionnaires were used to calculate economic and environmental sustainability indicators [Farm Profitability; Labor Productivity; Grain Yield; Water Productivity; Relative Water Supply; Greenhouse Gas Emissions; N, P, and K Use Efficiency; Energy Productivity; Environmental Potential Risk Indicator for Pesticides (EPRIP); Percolation to Groundwater, and Food Safety], as well as to investigate the social acceptability of the AWD technique in the area through a model based on the TAM approach.
2. Materials and methods
2.1. Indicator framework
A literature review of the existing methodologies applied all over the world to assess the economic, environmental and social performance of rice production was carried out to identify an appropriate set of indicators to evaluate the techno-economic, social and environmental sustainability of different rice irrigation options at the farm scale, and to identify data to be collected for the sustainability assessment (Gharsallah et al., 2021). Among the indicators found in the literature, the following economic and environmental indicators proposed by the Sustainable Rice Platform (SRP) were selected in this study: Farm Profitability (Net Income); Labor Productivity; Productivity (Grain Yield); Water Productivity; Greenhouse Gas Emissions; N and P Use Efficiency (SRP, 2019). A K Use Efficiency indicator was added considering the same approach proposed by SRP (2019) for N and P Use Efficiency. To evaluate the effect of the irrigation strategies on water saving, the indicator Relative Water Supply was included (Molden et al., 1998; Malano and Burton, 2001; Kuscu et al., 2009; El-Agha et al., 2011; Pérez and Canas, 2013; Kartal et al., 2019). The Energy Productivity indicator was added to the indicator set to evaluate the amount of energy consumed during the agronomic and irrigation operations (Rao et al., 2017). For the assessment of the pesticides' impact on surface water and groundwater, the Environmental Potential Risk Indicator for Pesticides (EPRIP) described in Padovani et al. (2004) was selected and modified to account for rice specific growth conditions. The indicator Percolation to Groundwater was built to evaluate the effect of the irrigation strategies on groundwater recharge. Finally, an indicator describing the Food Safety risk was added, taking into account the Arsenic and Cadmium content in the rice grain under the different irrigation strategies.
The social acceptability of the projects' proposed irrigation strategies proposed in the project was evaluated through a qualitative approach based on the Technology Acceptance Model (TAM; Davis, 1989).
Flowchart illustrating the sustainability assessment methodologies applied to rice production under different irrigation strategies is shown in Figure 1.
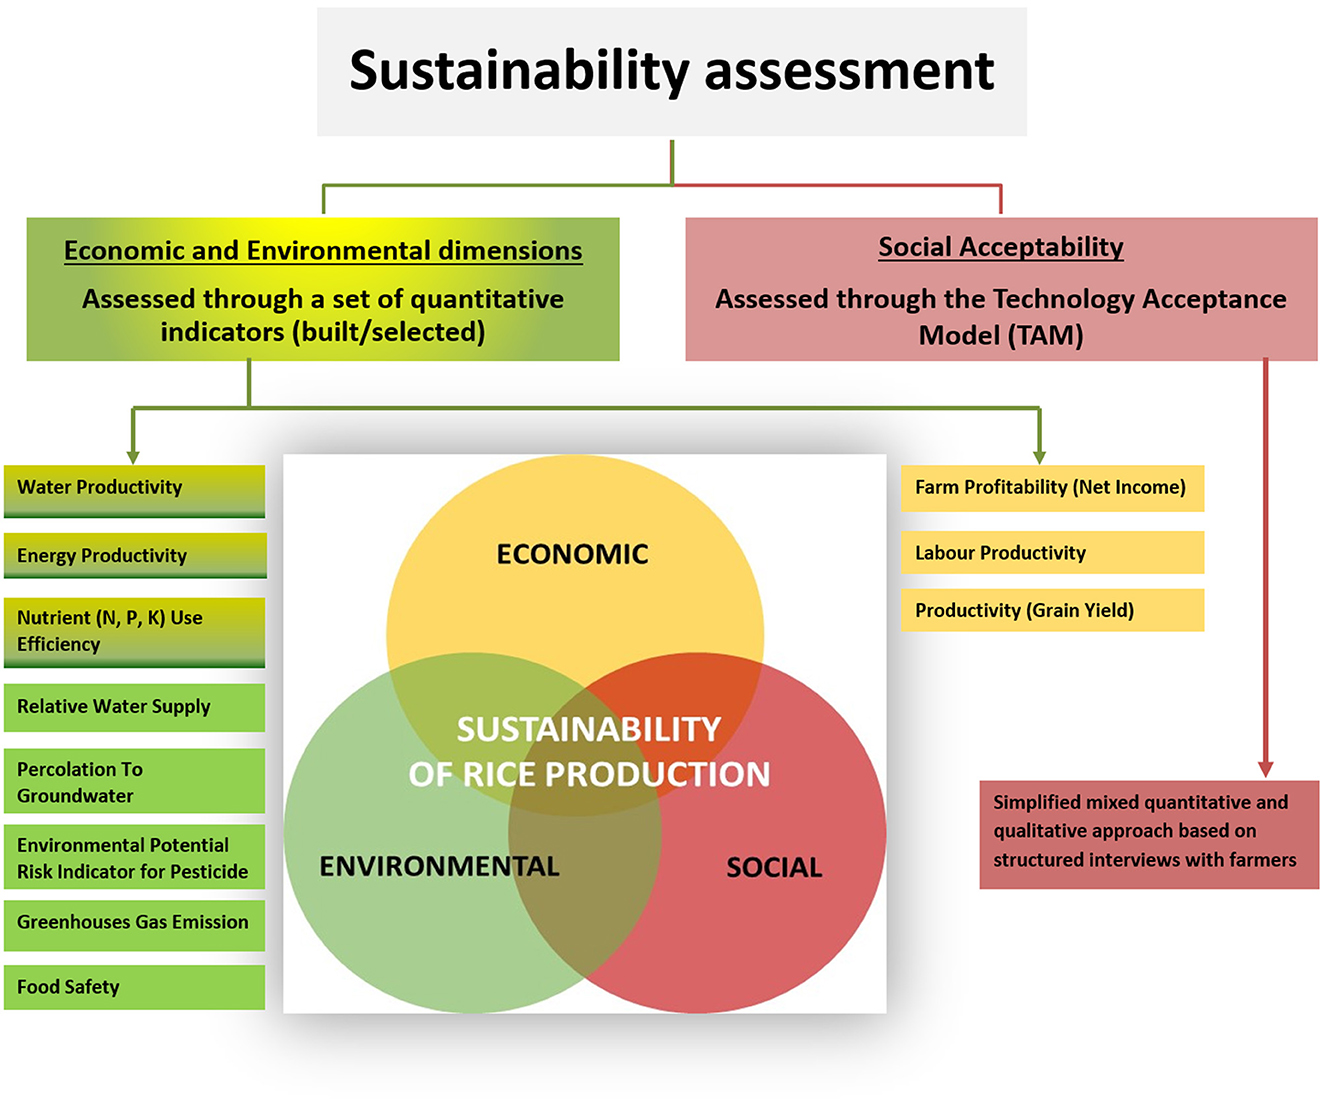
Figure 1. Flowchart of the sustainability assessment methodologies applied to rice production under different irrigation strategies at the farm scale.
2.2. Data collection
All the economic and environmental indicators, as well the social acceptability assessment cited in Figure 1, were based on data collected through questionnaires set-up to collect farm data. Questionnaires are available as Supplementary material. For this study, part of the data that may be collected through the environmental section of the questionnaire (Section 2.2.1) was replaced by data collected in the experimental platform set up in northern Italy (Section 2.2.2).
2.2.1. Questionnaires for data collection
A questionnaire was developed to collect data for the economic and environmental assessment. For each farm, only fields cropped with rice are considered. A separate questionnaire must be filled for each rice irrigation strategy adopted. All the processes involved in rice production, including postharvest processes under the farmer's control, are taken into account in the questionnaire.
The questionnaire is structured into four sections:
- General information: to be compiled once per farm (information under this section is general and does not depend on irrigation strategies adopted). It includes general information relative to the farm, such as the name and location of the farm, the gender and education level of the farmer, the total agricultural area of the farm, the total rice area cultivated within the farm, the source of water used for rice irrigation (irrigation consortium/authority providing the irrigation service or private concession for water pumping or diversion), the type of water resources (river, open channel, or well). This section also specifies, for each rice irrigation strategy adopted on the farm, cultivated rice varieties, sowing and harvest dates, rice area, grain and straw yield, as well as the current market price of grain and straw (if sold).
- Economic section: to be compiled for each rice irrigation strategy adopted in the farm. Data required under this section were used to calculate the Variable Costs (VC), the Fixed Costs (FC) and the Total Income (TI) to compute the farm economic balance (Farm Profitability). Some information was moreover used to compute further economic indicators such as Labor Productivity and Productivity: Grain Yield. The required data are the amount and the cost of production factors (seeds, fertilizers, and pesticides), the amount and the cost of energy and labor inputs consumed during the different agronomic operations and irrigation events carried out during the agricultural season, fixed costs such as irrigation fees, rice federation fees, insurance costs, maintenance of farm facilities, costs of qualified technicians, and the cost of rental land. In the case of adopting a new irrigation technology that required significant investment, additional costs were incurred, such as the cost of the equipment (instruments and sensors), installation costs, maintenance costs, and subsidies for adopting the new technology.
- Environmental section: to be compiled for each rice irrigation strategy adopted in the farm. Information collected under this section was used to compute environmental indicators such as Water Productivity; Relative Water Supply, Percolation to Groundwater, Energy Productivity; Nutrient (N, P, and K) Use Efficiency; Greenhouse Gas Emissions (CH4 and N2O), Environmental Potential Risk Indicator for Pesticide (EPRIP), and Food Safety. The following data were thus collected: the total irrigation use and rainfall over the season, mineral fertilizers (commercial name, amount and active ingredients), pesticides (e.g., active ingredient, amount, and application date), number of days of flooding prior to crop establishment, number and duration of drying events, information about the finality of the produced straw (incorporated, burned, or sold), information on pesticide applications, such as the application rate of active ingredients (a.i.), the mode of application (incorporated into the soil or not), the interval between applications, the phenological stage at which the a.i. is applied, days passed from application to irrigation (a.i.), the state of the paddy during application (dry or flooded), soil characteristics, the distance between the water body and the rice field, the type of water body (ditches, river, etc.), the dimensions of the rice field, the maximum daily rainfall, the average annual rainfall and the average annual temperature. Information regarding Cadmium, total arsenic and inorganic arsenic contents in the rice grain were moreover collected.
- Social acceptability was evaluated using a separate questionnaire compiled through face-to-face interviews focused on understanding factors that affect the rice farmers' decision to accept and adopt or reject the proposed technology/technique. The questionnaire was structured in three parts: (1) intention to adopt AWD technology and attitudes toward novel technology, (2) qualitative questions to explain their choices, and (3) grower demographics and main farm production and economic characteristics. Examples of data collected are: method of seeding (wet or dry), source of water used for irrigation, availability of water, advantages of dry seeding, awareness of environmental problems caused by water wastage, ability to use water seeding, effects of water seeding on yield, knowledge of AWD strategy, conditions for coming back to water seeding (financial and technical).
Questionnaires for the economic and environmental sections were compiled by the staff (researchers and technicians) of the Center for Rice Research of the Ente Nazionale Risi (CRR-ENR; https://www.enterisi.it/), which is the national authority responsible for the development of the rice sector in Italy. Rice growers were involved when needed to validate the representativeness of the information provided. The social questionnaire was compiled through face-to-face interviews with a sample of 10 rice growers in Lomellina, selected by CRR-ENR so that the farms were in areas characterized by varying water availability for irrigation, all adopting the dry seeding and delayed flooding irrigation strategy.
2.2.2. Data collection through the experimental platform
An experimental activity was carried out at the ENR—Rice Research Centre's experimental farm located in Castello d'Agogna (Pavia, Italy) during the agricultural seasons of 2019 and 2020. The experimentation was conducted in six plots of about 20 × 70 m each, with two replicates for each of the three following irrigation strategies: (i) Water seeded rice and continuous FLooding (WFL), (ii) Dry-seeded rice followed by a delayed continuous FLooding from around the 3-leaf stage (DFL), and (iii) water seeded rice followed by a safe Alternate Wetting and Drying regime from the tillering stage (AWD).
In the WFL irrigation strategy, plots were water seeded (16/05/2019 and 08/05/2020) and flooded almost continuously during the growing season, except for a 15–18-day period after sowing in which plots were drained to allow for root extension in a pint-point period, and two mid-season drainage periods of 3–7 days for fertilizer and herbicide applications. In the DFL strategy, plots were dry seeded (30/04/2019 and 24/04/2020) and maintained under aerobic conditions until the tillering stage, toward the end of May/beginning of June. They were subsequently flooded and managed as for the WFL strategy. The only drainage period was in the midseason. As for the AWD strategy, the water management was similar to WFL until N fertilization at the tillering stage. Subsequently, an Alternate Wetting and Drying irrigation was applied, with single flooding at 10 cm depth when the water level within the field dropped at −10 cm from the soil surface as an average in a couple of water tubes installed in each plot (also corresponding to a soil matrix potential of around −5 kPa at −5 cm from the soil surface, measured through hydraulic tensiometers). In all plots, the final drainage was carried out at the ripening stage, around 30–35 days before harvesting.
In the experimental platform, a soil survey was conducted in spring of 2019 through an Electro-Magnetic Induction (EMI) sensor, which led to the production of a soil variability map used to identify soil sampling points. Soil samples were collected at different soil depths and analyzed in the laboratory to determine physicochemical and hydraulic (soil retention curve) parameters. One out of the two plots irrigated with each irrigation strategy was instrumented with water inflow and outflow meters, water level sensors, a set of piezometers, tensiometers and water tubes (the last devices in both the AWD plots, for the intermittent flooding management). In the same three plots, periodic measurements of crop biometric parameters (LAI, crop height, and crop rooting depth) were performed during the agricultural seasons of 2019 and 2020. Additionally, agrometeorological data (air temperature, air humidity, rainfall, wind velocity and direction) were measured at a station installed in the experimental farm. All these data were used to parametrize a soil water balance Darcy-based model (Facchi et al., 2018) adopted to generalize the results obtained through the monitoring activity, since the soil variability in the platform was high. For all the plots in the platform, rice Grain Yield, rice grain and straw nitrogen uptake, and arsenic and cadmium analysis of rice grain were performed.
2.3. Economic indicators
2.3.1. Farm Profitability (Net income)
The farm economic balance also named Farm Profitability or Net Income, was calculated as the difference between the Total Income and the Total Costs (Equation 1, 2, and 3).
Where:
• TI: Total Income (euro/ha), subsidies are basic payment for the cultivated area;
• TC: Total Costs (euro/ha);
• VC: Variable Costs (euro/ha), computed considering all the variable inputs as seeds, fertilizers, pesticides, machinery energy consumption (either related to agronomic or irrigation operations) and labor (related to agronomic or irrigation operations).
• FC: Fixed Costs (euro/ha), which include irrigation fees, insurance costs, maintenance of farm facilities costs, and the rental land cost.
• CANIT: additional Costs for the Adoption of New Irrigation Technology (euro/ha), such as, for instance, surface drip or subsurface drip irrigation technologies.
2.3.2. Productivity (Grain yield)
This indicator illustrates the Productivity in terms of Grain Yield, defined as the recovered Grain Yield (ton or kg) per hectare.
2.3.3. Labor Productivity
This indicator estimates the Labor Productivity, defined as the amount of rice (kg/h) produced in 1 h of labor input used in all the agronomic and irrigation operations overall the agricultural season (Equation 4).
Where
• Grain Yield (kg/ha): the amount of rice produced in 1 ha, standardized at 14% moisture content;
• Labor input (h/ha): amount of hours spent to devote agronomic and irrigation operations in 1 ha.
2.4. Environmental indicators
2.4.1. Water Productivity
The indicator illustrates the Water Productivity (WP), defined as the amount of rice (kg) produced with one cubic meter (m3) of water used. Water used is defined as the net irrigation plus the amount of rainfall over the agricultural season (Equation 5).
Where
• NI (mm): net irrigation, which is the difference between QIN (mm) and QOUT (mm), which are the irrigation inflow and outflow to the rice field;
• R (mm): total rainfall over the agricultural season;
2.4.2. Relative Water Supply
Relative Water Supply (RWS) is defined as the water used (net irrigation plus rainfall) divided by the crop evapotranspiration over the agricultural season.
2.4.3. Percolation to Groundwater
The Percolation to Groundwater indicator is calculated as the residual term of a simple hydrological balance, illustrated in Equation 7:
Where:
• P (mm): residual term of the water balance (Percolation to Groundwater);
• ETc (mm): potential evapotranspiration from rice and the underlying soil and/or ponding water;
• ΔS (mm): includes both the variation in ponding water (ΔL) and in soil moisture (Δθ) in the soil explored by the rice root system.
Water balance components (Equation 4) were computed as follows: ΔL, Δθ, QIN, and QOUT were measured within the three plots, ETc was estimated by applying the single coefficient FAO-56 method (Allen et al., 1998) based on the FAO modified Penman-Monteith equation, in which the reference evapotranspiration, ET0, was multiplied by the rice crop coefficient Kc. This coefficient was assumed to be equal to the rice crop Kc when plots were dry (i.e., not flooded), while the maximum between rice crop Kc and Kw (i.e., 1.05, Kc for free water bodies; Allen et al., 1998) was assumed in case of flooded fields. The value of the rice crop Kc, which is time-varying, is defined according to the results of a previous study conducted nearby the pilot study area, in which for a dry-seeded rice the following Kc values were determined: Kc-ini = 0.35, Kc-mid = 1.1, Kc-end = 0.6 (Cesari de Maria et al., 2016; Mayer et al., 2019). Rice growth stages (ini, dev, mid, end; Allen et al., 1998) were obtained from crop phenology observed in the field and measured LAI data series.
P, obtained from Equation 4 due to the fact that all the other terms were measured/estimated, includes two main processes: net percolation P, namely the net vertical flux at the bottom of the root zone volume (directed downward in flooding conditions), and the net lateral seepage S through the bunds (Bouman et al., 2007; Facchi et al., 2018), which was negligible during the experiment. For each instrumented plot, a model based on the Darcy equation was calibrated and used for simulations. The original model, described in Facchi et al. (2018), was modified to be applied in a spatially distributed mode, to take into account the strong variability of soil characteristics and groundwater depth within the platform. As a matter of fact, the developed Darcy-type hydrological model was used to estimate the soil water balance term for the three irrigation strategies (WFL, DFL, and AWD) using the soil hydraulic parameters calibrated for the P1 and P3 plots (hosting WFL and DFL respectively, which showed indeed rather similar soil parameters), while excluding soil parameters for the P2 plot (hosting AWD, which were different). An average of the soil water balance terms obtained for each irrigation strategy in P1 and P3 were used to compute the following indicators: Water Productivity, Relative Water Supply, and Percolation to Groundwater.
2.4.4. Energy Productivity
Energy Productivity is defined as the amount of rice (kg) produced (Grain Yield) with one liter of fuel consumed during all the agronomic and irrigation operations conducted over the agricultural season.
Where:
• Total consumed fuel: amount of fuel consumed to carry out agronomic operations in 1 ha of rice (l/ha).
2.4.5. Nutrient (N, P, and K) Use Efficiency
Nutrient Use Efficiency is defined as the Grain Yield (kg) per unit of nutrient input (kg) applied with the mineral fertilizers. Nutrient input is calculated as described in Equation 9:
Rice grain and straw nitrogen N uptakes were determined for 2019 and 2020. Apparent N recovery was considered for each irrigation strategy and for each N fertilization rate. It was calculated as the difference between aboveground plant N uptake in fertilized (160 kg/ha N rate) and non-fertilized sub-plots (0 kg/ha N rate; see Figure 2) divided by the amount of N fertilizer applied. Data were analyzed with ANOVA and LSD (post-hoc). Rice grain and straw P and K uptakes cited in SRP 2019 were used.
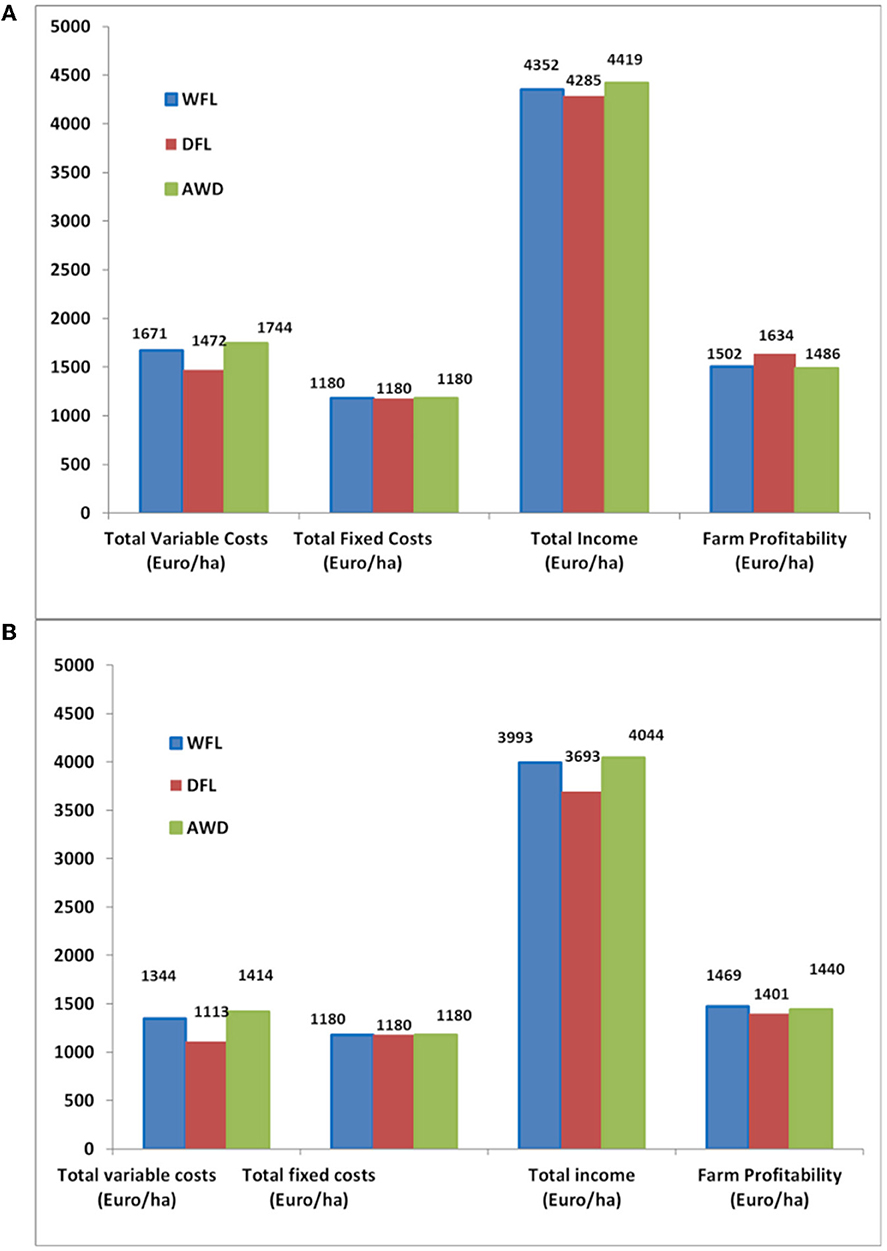
Figure 2. Farm economic balance components 2019 (A) and 2020 (B).
The obtained N, P, and K Use Efficiency values are then classified according to the approach proposed by Devkota et al. (2019):
• N Use Efficiency (kg Grain Yield/kg elemental N): Too high (Soil mining > 80), Desirable range (40–80) and Too low (Wasteful application <40);
• P Use Efficiency (kg Grain Yield/kg elemental P): Too high (Soil mining > 350), Desirable range (150–350) and Too low (Wasteful application <150);
• K Use Efficiency (kg Grain Yield/kg elemental K): Too high (Soil mining> 200), Desirable range (70–200) and Too low (Wasteful application <70).
2.4.6. CH4 emissions
The estimation of CH4 emissions was performed by applying the methodology implemented in the most updated guidelines from IPCC (International Panel on Climate Change, 2019a). CH4 emissions were estimated by multiplying the adjusted daily emission factor (EF) by the rice cultivation period (Equation 10).
Where:
• CH4 (kg CH4 yr−1): annual methane emissions from rice cultivation,
• EFi,j,k (kg CH4 ha-1 day−1): daily emission factor for i, j, and k conditions,
• t: cultivation period of rice for i, j, and k conditions, day;
• Ai,j,k (ha yr−1): annual harvested area of rice for i, j, and k conditions, (1 ha yr−1); i, j, and k: represent different ecosystems, water regimes, types and amounts of organic amendments, and other conditions under which CH4 Emissions from rice may vary.
The adjusted daily emission factor was calculated by multiplying the daily baseline emission factor (EFc) by various scaling factors (Equation 11):
Where:
• EFc: emission from the field with no pre-season flooding for <180 days prior to rice cultivation and continuously flooded without organic amendments. General values of baseline emission factors, divided by region, are provided by IPCC (International Panel on Climate Change, 2019a, Table 5.11). However, country-specific measurements of the baseline emission factors are strongly recommended in order to have an accurate estimation of the CH4 emissions;
• SFw: scaling factor to account for the differences in water regime during the cultivation period. General values, classified by water regime, are provided by IPCC (International Panel on Climate Change, 2019a, Table 5.12). However, site-specific calibration of SFw is strongly recommended;
• SFp: scaling factor to account for the differences in water regime in the pre-season before the cultivation period. General values are provided by IPCC (International Panel on Climate Change, 2019a, Table 5.13);
• SFo: scaling factor considering both the type and the amount of organic amendment applied. General values are provided by IPCC (International Panel on Climate Change, 2019a, Table 5.14).
2.4.7. N2O emissions
The estimation of N2O emissions from 1 ha of rice cultivation was performed through the methodology proposed by the most recent IPCC guidelines (International Panel on Climate Change, 2019b). N2O emissions were estimated as the sum of:
• Direct emissions (Nitrification and Denitrification process; Equation 12);
• Indirect emissions: N volatilization (Equation 13) and deposition and N leaching/runoff (Equation 14).
Where:
• N2ODirect –N (kg N2O–N yr−1): annual direct N2O–N emissions produced from managed soils;
• N2OATD –N (kg N2O–N yr−1): the annual amount of N2O–N produced from atmospheric deposition of N volatilized from managed soils;
• N2OL – N (kg N2O–N yr−1): the annual amount of N2O–N produced from leaching and runoff of N additions to managed soils in regions where leaching/runoff occurs;
• FSN: the annual amount of synthetic N fertilizers (kg N/year);
• FON (kg N/year): the annual amount of organic N applied as fertilizers (e.g., animal manure, compost, sewage sludge, rendering waste, and wastewater effluent);
• FCR (kg N/year): the annual amount of N in crop residues (above ground and below ground), including from N-fixing crops and from forages during pasture renewal;
• EF1i: (kg N2O–N (kg N input)-1): emission factors developed for N2O Emissions from synthetic fertilizer and organic N application under conditions i =1, …n (International Panel on Climate Change, 2019b, Table 11.1);
• EF1 (kg N2O–N (kg N input)-1): emission factor for N2O emissions from N inputs, International Panel on Climate Change, 2019b, Table 11.1);
• FSOM: the annual amount of N in mineral soils that are mineralized in association with loss of soil organic matter resulting from a change of land use or management of mineral soils (kg N/year);
• EF1i (kg N2O–N (kg N input)-1): Emission factor for N2O emissions from N inputs (International Panel on Climate Change, 2019b, Table 11.1);
• FPRP: the annual amount of urine and dung N deposited on pasture, range and paddock by grazing animals (kg N/year);
• FOS (ha): annual area of drainage/management of organic soils (i.e., Histosols).
The conversion of N2O-N Emissions to N2O was performed through the Equation 15.
2.4.8. Environmental Potential Risk Indicator for Pesticide (EPRIP)
The EPRIP indicator (Reus et al., 2002; Padovani et al., 2004) is based on the Exposure Toxicity Ratio (ETR) of the Predicted Environmental Concentration (PEC). ETR of the PEC is calculated as the ratio of PEC with eco-toxicological chronic concentration (Equation 16):
ETR and PEC are estimated at the local scale (i.e., the field where plant protection products are applied and its surroundings) and using short-term toxicological parameters (i.e., NOEC, that is the “No Observed Effect Concentration”). Therefore, the PEC reflects a worst-case scenario, assuming that organisms are subjected to maximum exposure both in time and space.
Currently, methods for EPRIP calculations (Padovani et al., 2004) are dedicated mainly to other cereal cultivations and are not fully appropriate for paddy fields. Therefore, EPRIPrice was developed starting from the traditional EPRIP considering MedRice guidance (MED-Rice, 2003) for PEC calculation in paddy rice cropped under flooding conditions (e.g., WFL, AWD, and DFL).
In the EPRIPrice, the PECs in the following compartments were taken into account: surface water (PEC SW), sediment (PEC SED) and groundwater (PEC GW). It is important to note that the term “surface water” (SW) refers to water in non-target areas (e.g., drainage canals). The term “sediment” (SED) refers to sediment associated with surface water in non-target areas, and PEC GW calculations are defined for water in the saturated zone (1 m below the soil surface). The MedRice equations (MED-Rice, 2003) were modified) and used to assess PEC in SW, SED, and GW when paddy water is present. The paddy water level is set at 10 cm.
The EPRIP model is based on a daily water balance, computed as shown in Equation 17. A control volume ranging from the top of the ponding water to the bottom of the rice root zone was considered. Finally, leakage, which is the average water percolated during the entire year (mm/d), is calculated according to Equation 17.
where: P is the percolation evaluated in Equation 7, OSR is the rainfall out of the agricultural season (mm), and RC (-) is assumed as the groundwater recharge coefficient (0.8 in this case study), determining the rainfall out of the agricultural season reaching the groundwater.
In EPRIPrice, other information considered in the calculation are: the time period (days) in which the paddy is flooded (tflood); the number of days between the active ingredient application (in dry mode) and the flooding (tdry); and the number of days between application and the soil drainage (tdrain).
The PEC for each compartment (GW, SW, and SED) are then converted in ETR (Exposure Toxicity Ratio) using pesticide toxicity for non-target organisms in surface and paddy water (minimum value between the NOEC for algae, Daphnia and fish) and in sediment (NOEC values for Eisenia fetida) derived from international eco-toxicological and toxicological databases (PPDB). The legal limit of 0.1 μg/L is used as the legal end-point for GW. ETR are converted consecutively into Risk Points (RPs); in particular, the following ETR ranges: <0.01, 0.01–0.1, 0.1–1.0, 1.0–10.0, and >10.0 are assumed to correspond to RPs 1, 2, 3, 4, and 5, respectively (Trevisan et al., 2009).
The overall EPRIP indicator is based on RPs and evaluates the probability of a predicted concentration of contaminants in the environment to overcome a supposed threshold. The EPRIP can be evaluated using two approaches:
- The probability of not exceeding the Risk Point 3 (EP3%) assuming a Poisson cumulative function (Equation 18), valid in the case of the application of at least six active ingredients:
Where λ is the average risk points, and k is the risk threshold (RP = 3).
- EPRIPscore is used when Poisson cumulative function cannot be used (e.g., the low number of applied active ingredients). EPRIPscore is calculated as in Padovani et al. (2004) and Trevisan et al. (2009) to assess the environmental impact of the substances applied. Briefly, the equation adopted is:
RPgw, max is the maximum risk point for groundwater; RPsw, max is the maximum risk point for surface water; RPsed, max is the maximum risk point for sediment; N4 is the number of RP values equal to 4; and N5 is the number of RP values equal to 5. EPRIPscore and judgements are as follows: EPRIPscore 1, 2–16, 17–81, 82–256, 257–400, >400 correspond to EPRIPjudgements 0 (none), 1(negligible), 2 (small), 3 (intermediate), 4 (large), and 5 (very large), respectively.
In the present paper, the Poisson cumulative function is applied, and even if the number of applied active ingredients is sufficient, the EPRIPscore is moreover considered.
2.4.9. Food Safety
A risk assessment due to the heavy metal (Arsenic and Cadmium) contents in the rice grain was performed thanks to the availability of laboratory analysis. Rice grain arsenic and cadmium concentrations were determined (using 12 samples) for the 160 kg/ha N rate sub-plots.
Results were compared with the maximum tolerated values established by European legislation. The limit concerning only inorganic As [As (III) plus As (V)] and has been set at 0.20 mg/kg for white rice, 0.25 mg/kg for husked and parboiled rice, 0.10 mg/kg for rice for infants and young children food products. The European Commission has recently approved a new maximum limit for Cd concentration in rice of 0.15 mg/kg (EU Commission Regulation n. 1323/2021 of 10th August 2021), while the legal limit for rice for infants and young children food products is 0.04 mg/kg.
2.5. Social assessment of the AWD acceptability
The social acceptability of AWD was evaluated considering a theoretical approach based on the Technology Acceptance Model (TAM; Davis, 1989).
A simplified mixed quantitative and qualitative approach based on structured interviews with farmers to reveal factors which impact the acceptance of water regimes in the Italian case study. The analysis was implemented in collaboration with ENR.
Following the TAM approach, a simplified mixed quantitative and qualitative approach based on structured interviews with farmers was set up to assess the farmers' intention to adopt AWD. The questionnaire includes potential direct or indirect determinants of the Perceived Usefulness and Perceived Ease of Use (PEU and PUF) constructs. The requirements to join the survey were that farmers were responsible for decision-making on their farm, adopted mainly dry seeding, and have not still adopted the AWD technique. A sample of representative farmers with those characteristics was selected with CRR-ENR support.
The results of the assessment are expected to be useful in defining, introducing and promoting measures aimed at increasing the level of acceptance of the innovative water regime, including economic measures, such as direct and indirect subsidies, and information campaigns (Dolnicar et al., 2011; Aznar-Sánchez et al., 2017).
3. Results and discussion
3.1. Economic indicators
3.1.1. Productivity (Grain yield)
Yields produced in 2019 and 2020, as well as the average values for the three irrigation techniques, are shown in Table 1.
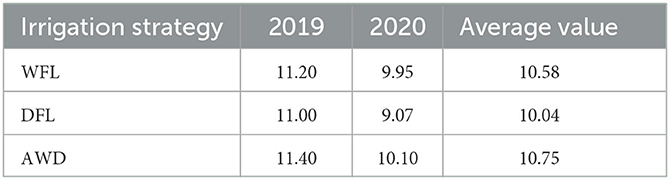
Table 1. Productivity (Grain Yield; t/ha).
Table 1 shows the difference in rice yield achieved in the 2019 and 2020 agricultural seasons under the three irrigation solutions. Yields obtained in 2020 were slightly lower than in 2019. For both years, rice Grain Yields were similar for the two water seeding treatments (WFL and AWD) and slightly higher than those obtained with dry seeding (DFL). These results align with previous studies reporting a yield comparable to WFL in the case of a safe-AWD (Linquist et al., 2015; Nalley et al., 2015; LaHue et al., 2016).
3.1.2. Farm Profitability
Table 2 shows the results of the farm economic balance achieved in 2019 and 2020.
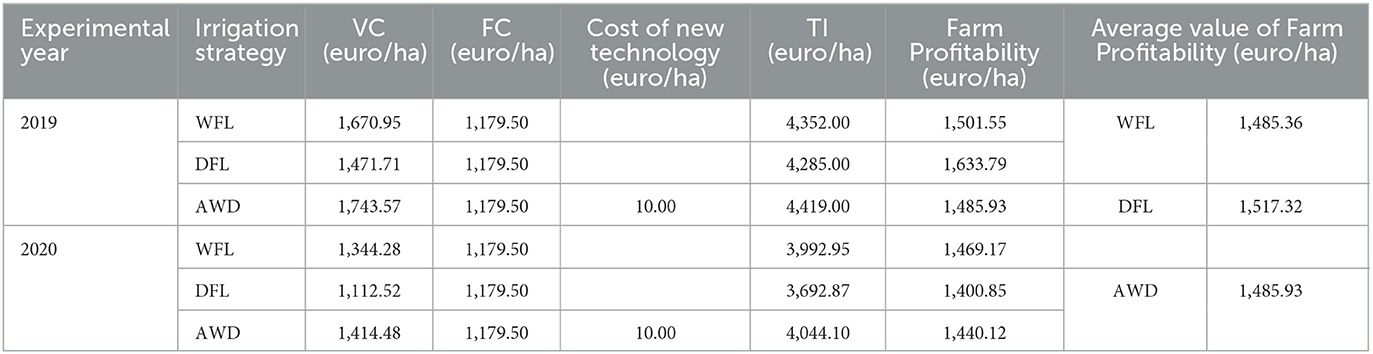
Table 2. Farm economic balance 2019 and 2020 (euro/ha).
Table 2 shows that by adopting the DFL and AWD irrigation strategies, the Farm Profitability increased by about 32 euros/ha and remained the same when compared to WFL, respectively. Farm Profitability shall be considered as a good approximation of the overall Net Income, although not completely coinciding with it, since in its computation, some small Fixed Costs were neglected (i.e., telephonic, postal, and internet charges, administration costs, and other small expenses); the missing costs were independent of the irrigation management strategy adopted and thus were expected to affect all the irrigation strategies at the same way. The most important Fixed Costs (irrigation fees, insurance costs, maintenance of farm facilities costs, rental land, if any) were taken into account.
The highest Farm Profitability achieved when considering DFL pushed rice growers in the Lomellina area to change their habits and switch from wet seeding and continuous flooding (WFL) to dry seeding and delayed flooding (DFL) in recent years. In the Pavia province, in 2021, 82% of the total rice surface, which is about 82,000 ha, was cropped, adopting dry seeding (ENR data).
To grow 1 ha of rice adopting the DFL irrigation strategy, the Total Variable Costs (VC) are about 215.50 euros lower with respect to the WFL irrigation strategy, as an average value for the period 2019–2020 (Figure 2).
Details of Variable Costs (VC) spent in 2019 and 2020 to grow 1 ha of rice are reported in Figure 3, which shows that the difference in VC was due to the cost of the labor input, lower for DFL compared to WFL. In addition, the cost of weed control was also taken into account, which was slightly higher for DFL than for WFL since DFL received one extra treatment (six weed treatments) compared to WFL (five weed treatments). In the case of AWD, VCs are about 71 euros higher compared to WFL as an average value for the period 2019–2020. This was again due to the labor input, which was higher for this irrigation strategy (the irrigation management required more labor).
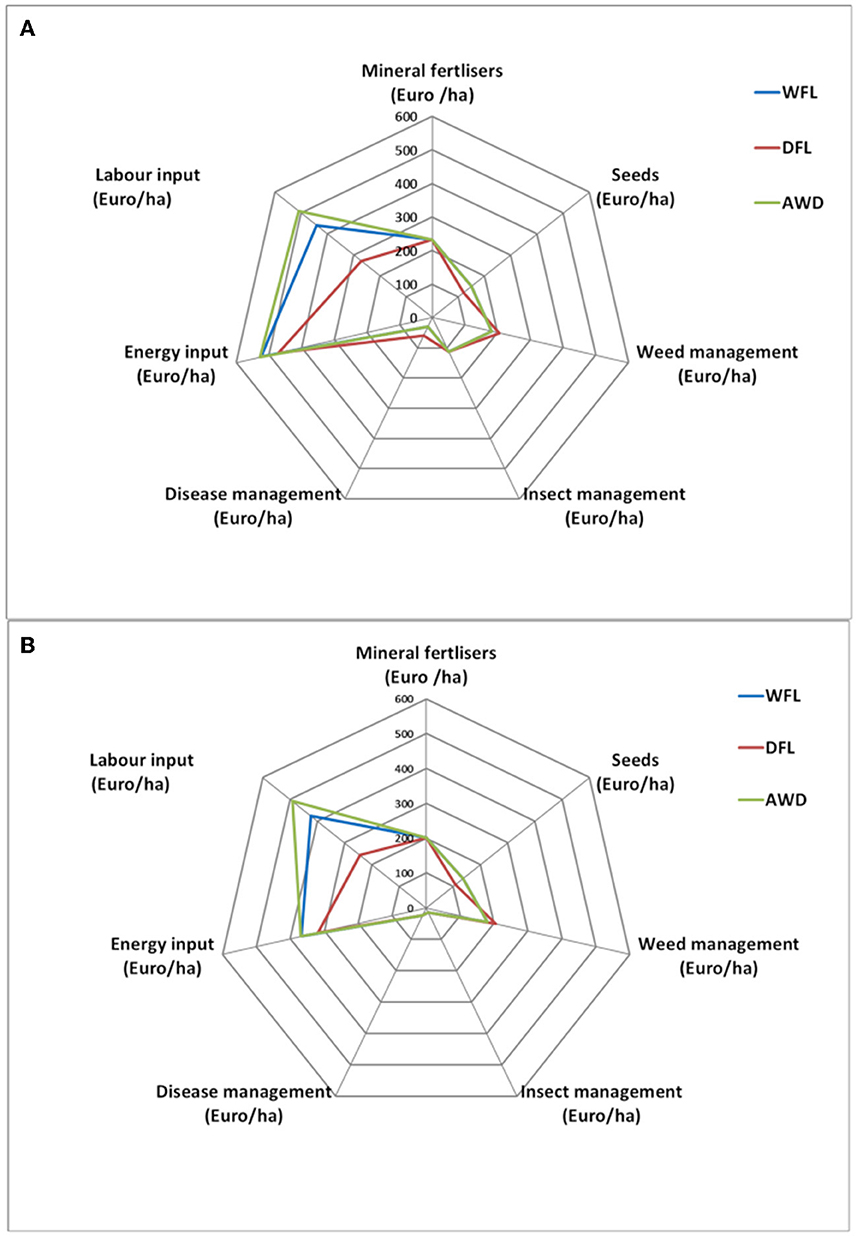
Figure 3. Variable Costs 2019 (A) and 2020 (B).
3.1.3. Labor Productivity
Table 3 shows that Labor Productivity was higher in DFL than in WFL and AWD. This difference was mainly related to the difference in the total labor input, on average was about 52.13 h/ha for WFL, 35.07 h/ha for DFL, and 61.48 h for AWD. This was in particular due to: (i) the difference in hours spent in the irrigation operations, which was about 6 h/ha for DFL, 22 h/ha for WFL, and 31 h/ha for AWD; (ii) with WFL and AWD many agronomic operations (water seeding, pesticide treatments, and fertilization) were carried out when paddies were flooded, and this doubled the time devoted to these operations compared to the WFL since machinery with iron wheels was needed. Furthermore, for the same agronomic operations, it is important to consider the time spent transporting the tractor with iron wheels, estimated as 6 min/ha.
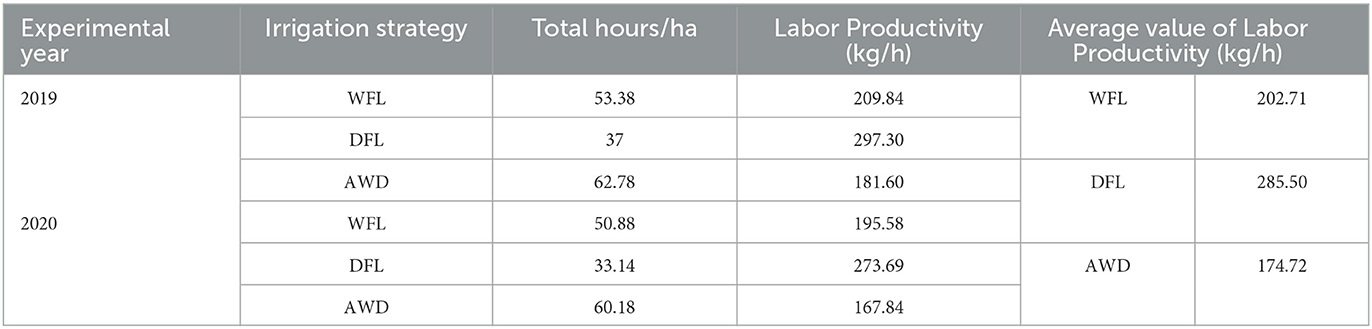
Table 3. Labor Productivity (kg/h).
3.2. Environmental indicators
3.2.1. Water Productivity
Table 4 shows that when AWD was adopted, the average net irrigation input showed to be 20.4% less than the amount found for WFL, while WP reached an average value of about 0.48 kg/m3. The water saving is in good agreement with what is reported in the literature for a “mild” AWD, which is about 24% compared to WFL (Carrijo et al., 2017; Pan et al., 2017; Song et al., 2019). The average value of the increase in WP of AWD compared to WFL is about 24%, which is in line with the average value for different case studies shown by Carrijo et al. (2017), which is about 26%.
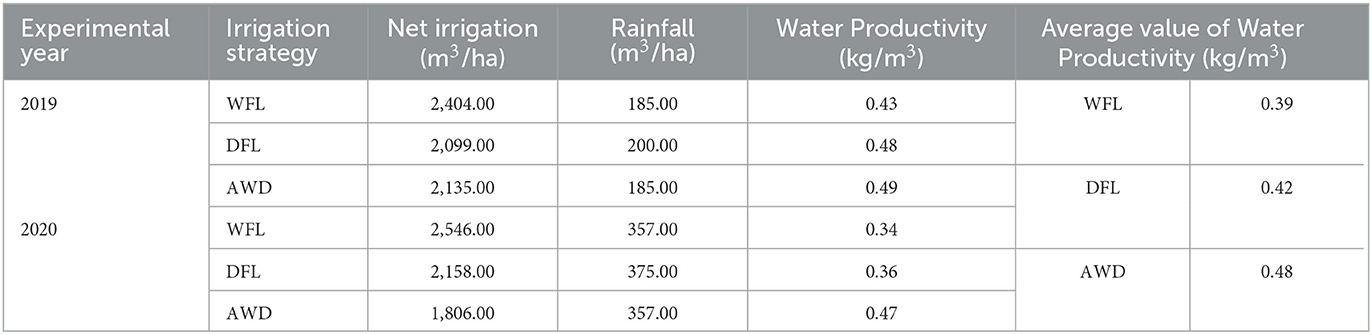
Table 4. Water Productivity (kg/m3).
A water saving of 14% in net irrigation was achieved by adopting DFL instead of WFL. WP for the two irrigation strategies was found to be 0.42 vs. 0.39 kg/m3, respectively. For DFL, this reduction is in accordance with results shown by Cesari de Maria et al. (2017), reporting an average reduction in irrigation volumes of 17% over two experimental years compared to WFL. Despite the total water savings achieved throughout the agricultural season by adopting DFL, this technique becomes unsuitable when the specific conditions of June are taken into account. In fact, June is considered a critical month due to the high water demand required by all the crops. As reported in Figure 4, DFL has the highest irrigation demand for rice in June, being the month in which DFL fields are usually submerged. This is mainly due to the higher number of dry soil days in the 1st month of the agricultural season, since in the DFL technique the rice fields were dry seeded (30/04/2019 and 24/04/2020) and maintained under aerobic conditions until the tillering stage, toward the end of May—beginning of June. They were subsequently flooded (07/06/2019 and 27/05/2020) and managed as for the WFL and AWD strategies, which induced a higher percolation in the DFL plots and, consequently, a higher water need in the period of the first flooding. This explains the increased competition for water between rice and other crops in the area after the massive conversion to the DFL technique.
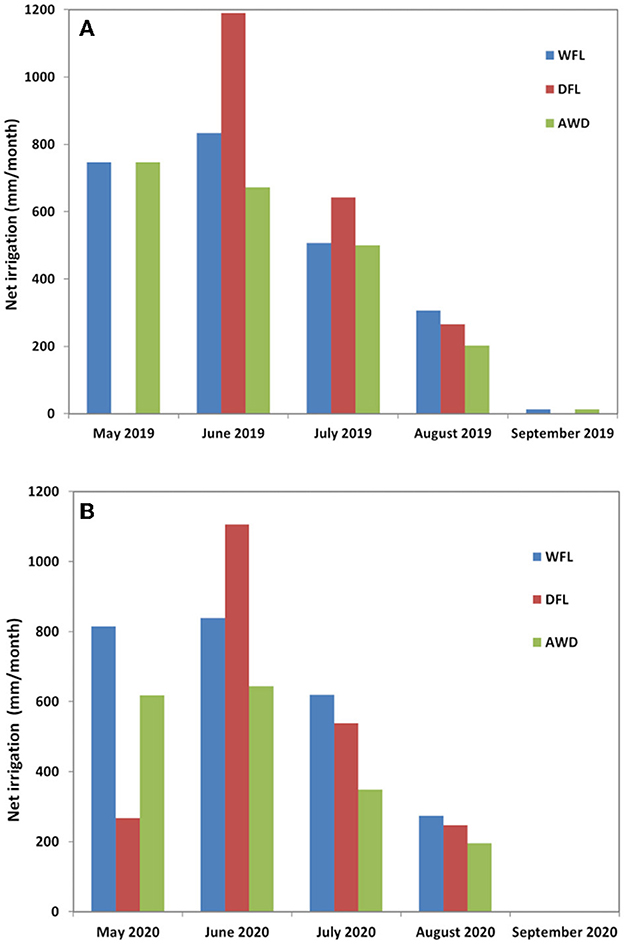
Figure 4. Monthly net irrigation (mm/month) along the agricultural seasons 2019 (A) and 2020 (B).
3.2.2. Relative Water Supply
Table 5 shows that the RWS decreased for AWD (3.42) compared to the other two techniques (4.14 for WFL and 3.75 for DFL), which means that AWD is more efficient than WFL and DFL in terms of water use.
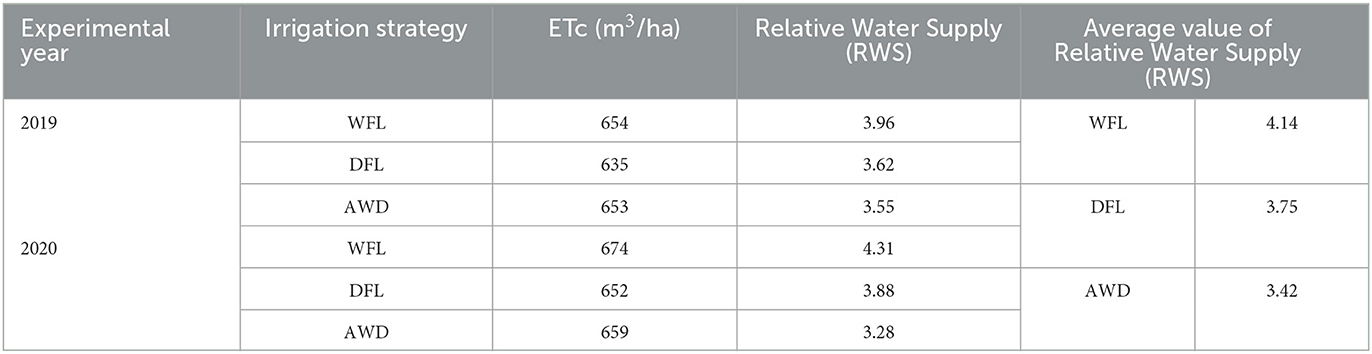
Table 5. Relative Water Supply (RWS).
3.2.3. Percolation to groundwater (% compared to WFL)
DFL and AWD reduced the average percolation by 15% (13% in 2019 and 16% in 2020) and 23% (14% in 2019 and 32% in 2020) compared to WFL, respectively. Although seasonal percolation values are considered in the calculation of the indicator (19,340 m3/ha in WFL, 16,730 m3/ha in DFL, 16,630 m3/ha in AWD for 2019 and 21,670 m3/ha in WFL, 18,150 m3/ha in DFL, and 14,740 m3/ha in AWD for 2020), the cumulated percolation values distributed throughout the 2019 and 2020 agricultural seasons are also assessed. Figure 5 shows that the percolation of the dry seeding technique (DFL) is null during the 1st month of the agricultural season (May), which corresponds to the dry period that usually starts at the sowing stage and ends around the 3rd−4th leaf. However, the wet seeding techniques (WFL and AWD) support the aquifer recharge in the months of April and May, when water is not required by other crops. Observing the graphs, it can be understood why the massive adoption of DFL led to a lowering of the shallow water table level at the beginning of the irrigation season in the rice areas of northern Italy. Figure 5 also shows that AWD feeds the phreatic aquifer at the beginning of the agricultural season, while reducing irrigation requirements and, thus percolation in the following months.
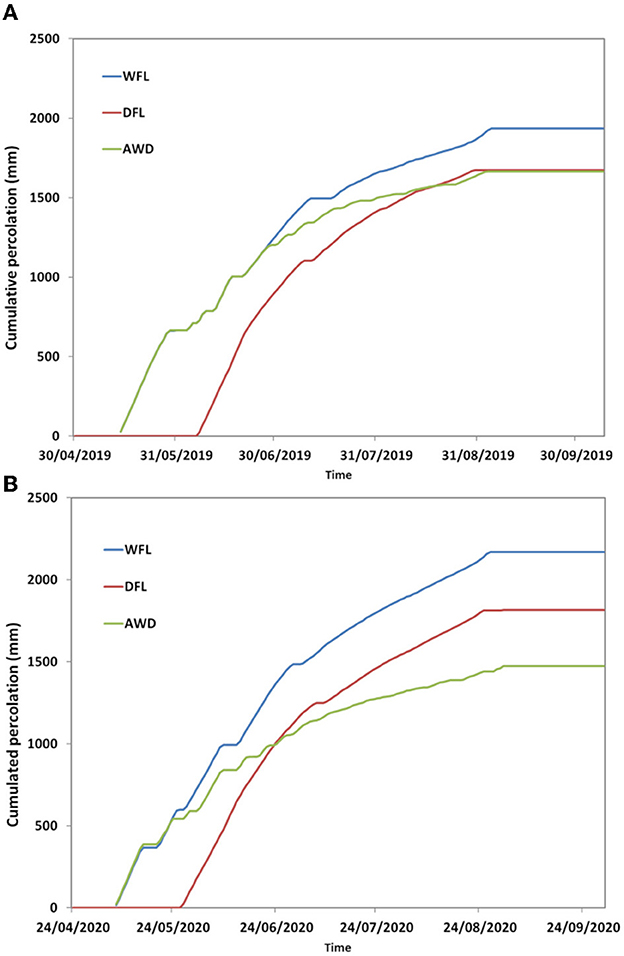
Figure 5. Cumulated percolation (mm) along the agricultural seasons 2019 (A) and 2020 (B).
3.2.4. Energy Productivity
Table 6 shows that the Energy Productivity was lower for WFL (15.49 kg/l) and AWD (15.64 kg/l) than for DFL (16.60 kg/l). This difference was mainly due to the following factors: (i) when adopting WFL and AWD, the agronomic operations, such as water seeding, pesticide, and fertilization treatments, are carried out when the fields are flooded, which need more fuel consumed compared to DFL (682.5 l/ha for WFL, 687 l/ha for AWD, and 603 l/ha for DFL); (ii) a slight difference can be moreover observed in the amount of fuel consumed during post-harvesting operations (264.5, 251, and 268.75 l/ha, respectively for WFL, DFL, and AWD) as a consequence of the slight difference in Grain Yield.
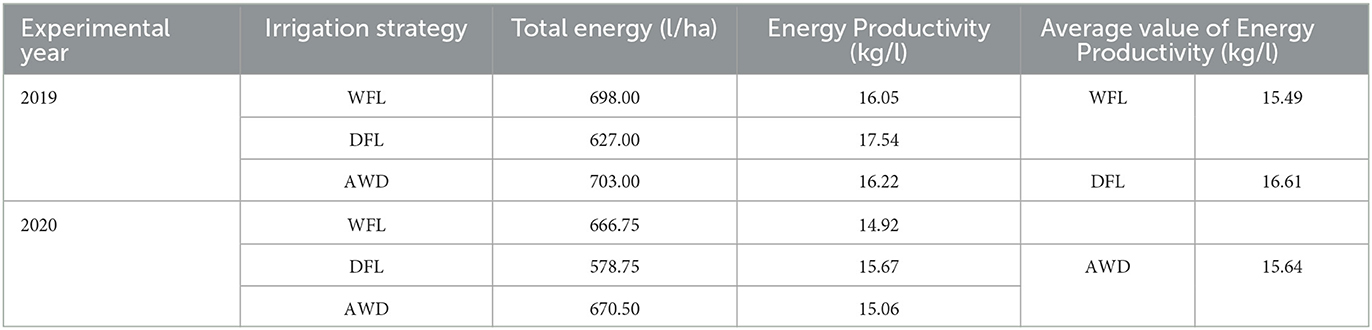
Table 6. Energy Productivity (kg/l).
3.2.5. Nutrient (N, P, and K) Use Efficiency
Results of N, P, and K Use Efficiency estimation are reported in Table 7, together with the evaluation carried out according to the classification proposed by Devkota et al. (2019). K Use Efficiency (kg Grain Yield/kg elemental K): Too high (soil mining> 200), Desirable range (70–200) and Too low (wasteful application <70).
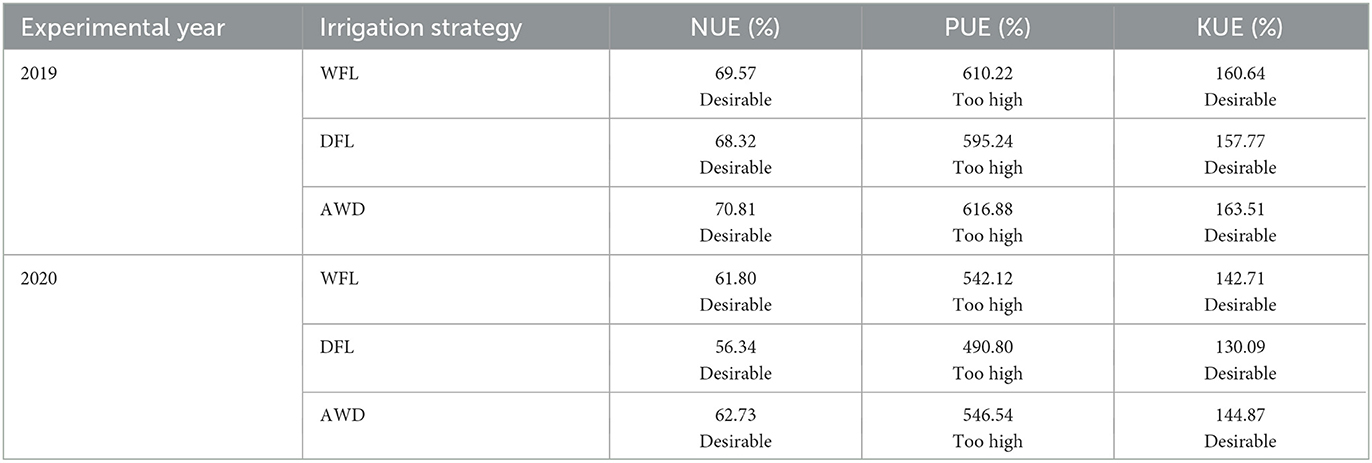
Table 7. Nutrients (N, P, and K) Use Efficiency.
Table 7 shows that Nitrogen and Potassium Use Efficiency can be classified within the ‘Desirable range' for all three irrigation strategies, which means that the applied amounts of N and K were well-defined. However, Phosphorous Use Efficiency can be classified for the three irrigation strategies as “Too high,” which means that the soil was probably over-exploited with respect to this element.
3.2.6. CH4 emissions
CH4 emissions were estimated by applying the methodology proposed by IPCC (International Panel on Climate Change, 2019a). Actually, parameters that should be used for the calculation of methane emission are provided by the IPCC (International Panel on Climate Change, 2016, 2019a,b). Country-specific measurements of the baseline emission factors (EFc) for rice cultivated in Italy were considered (National Inventory Report of Italy, 2017). Table 8 shows that the adoption of the DFL and AWD instead of the WFL reduced, on average, CH4 emissions by about 29.7 and 18.0%, respectively.
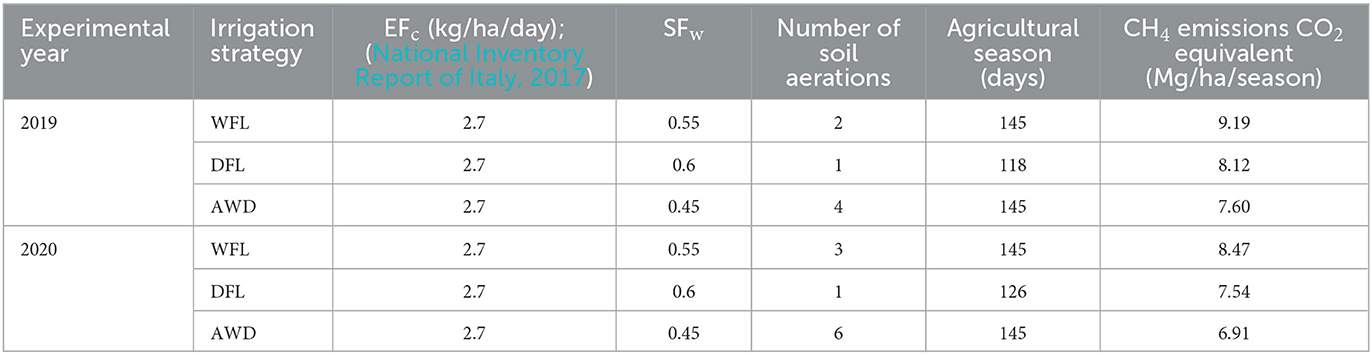
Table 8. Parameters used for the calculation of CH4 emissions and results in terms of CH4 emissions.
When considering WFL, the average value for the period 2019 and 2020 of the estimated CH4 emissions (8.86 Mg CO2 eq/ha/season) was in good agreement with the values obtained in the previous studies for rice grown in Italy, such as 9.6 Mg CO2 eq/ha/season measured in Meijide et al. (2011), 10 Mg CO2 eq/ha/season measured in Peyron et al. (2016), and 8.12 Mg CO2 eq/ha/season estimated in National Inventory Report of Italy (2017). Moreover, when DFL was applied, the average value of the estimated CH4 emissions (6.23 Mg CO2 eq/ha/season) was in line with the value estimated in National Inventory Report of Italy (2017) for rice grown in Italy under DFL (6.21 Mg CO2 eq/ha/season).
Unfortunately, the results obtained for AWD cannot be compared with measured/estimated data obtained in other studies, since there are no studies in the literature so far reporting gas emissions from rice irrigated under AWD technique in northern Italy.
3.2.7. N2O emissions
The assessment of N2O emissions was performed through the methodology illustrated by the most recent IPCC guidelines (International Panel on Climate Change, 2019b), in which N2O depends essentially on the amount of synthetic fertilizers N (kg/N/year; FSN) applied and on the amount of N in crop residues (above ground and underground; kg N/year; FCR). The estimation of N2O emissions includes a unique parameter linked to the adopted irrigation strategy, which is the default N2O emission factor EF1 for estimating direct emissions, provided by International Panel on Climate Change (2019b; Table 11.1). Unfortunately, this parameter has the same value (0.003) for single and multiple aerations, and it is not very different from the one suggested for continuous flooding (0.005). Therefore, adopting EF1 values proposed by International Panel on Climate Change (2019a,b), no significant difference in N2O emissions can be observed among the irrigation strategies adopted in this study.
To obtain a more accurate estimates, the EF1 factor provided by International Panel on Climate Change (2019a,b) was calibrated using measured values cited in literature studies conducted in the proximity of the study area (last column in Table 9). The calibrated value for DFL was found to be 0.0024, obtained using site-specific data measured during a previous study (Peyron et al., 2016). Differently, the calibrated value of EF1 for WFL was 0.0020, obtained considering data reported by Cayuela et al. (2017). Nevertheless, no measured data are available so far for AWD, and a value equal to DFL was considered in this study. Parameters used for the calculation of N2O emissions and results obtained in 2019 and 2020 are reported in Table 9.
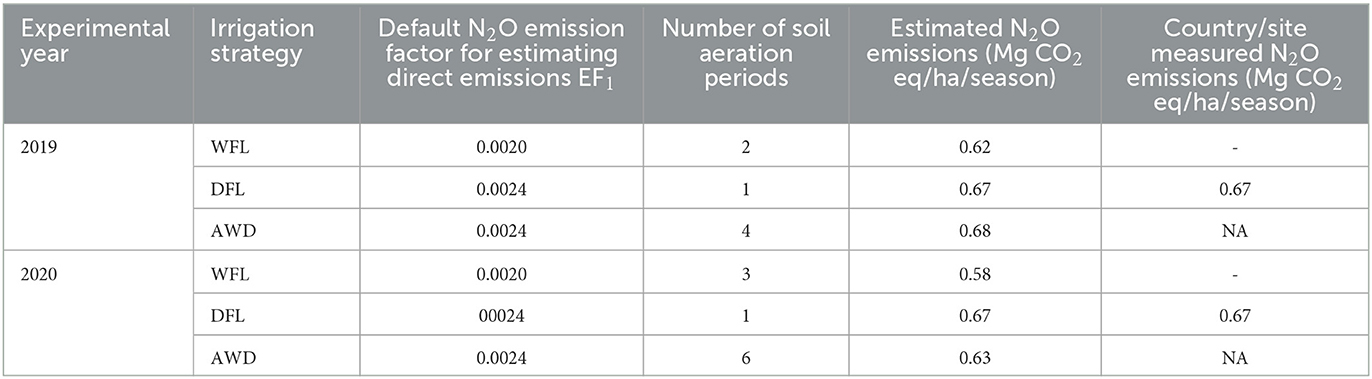
Table 9. Parameters used for the calculation of N2O Emission and results in terms of N2O Emissions.
Literature shows that N2O emissions under AWD increase compared to WFL. An increment of about 47–48 and 25–26% were reported by Samoy-Pascual et al. (2019) and Hoang et al. (2019), respectively.
3.2.8. Environmental Potential Risk Indicator for Pesticide (EPRIP)
Risk Points (RPs) were calculated for the three irrigation methods for both experimental years (2019 and 2020), and the different active ingredients were used for EP3% and EPRIPscore calculation. Note that RP3 means PECs from 1 to 1/10 of the eco-toxicological or legal end-point.
The active ingredients applied in 2019 and 2020 in the plots irrigated with the three strategies are: Clomazone, MCPA, Oxadiazon, Cyhalofop-butyl, Lambda-cyhalothrin, Halosulfuron-methyl, and Azoxystrobin. Moreover, Pendimethalin was applied only in the DFL as an additional treatment.
Considering both EPRIPscore and EP3%, DFL is the method with the lowest impact, which means a lower risk for the contaminant to be released into the environment (i.e., surface water, groundwater, sediment). In particular, for both years, an EP3% value of 7.10% and EPRIPscore of 130 out of 1,325 (MAX EPRIPscore) were found for DFL, followed by AWD and WFL with and EP3% value of 8.83% and EPRIPscore of 155 out of 1,175 (MAX EPRIPscore), respectively. MAX EPRIPscore is obtained considering a maximum RP (5) for each compartment and each active ingredient.
Results show that AWD and WFL reported identical results in 2019 and 2020, not only in terms of probability but also in terms of EPRIPscore. This means that: (i) the different weather data of the 2 years did not affect results for the two techniques; (ii) the two irrigation strategies entail the same environmental risk linked to the use of the same active ingredients.
Results show that DFL performed slightly better than AWD and WFL despite the additional treatment with Pendimethalin; this can be explained considering that in DFL irrigation, the field was left dry for the longest period before flooding in comparison with the other irrigation methods, and this allowed the longest degradation of Clomazone. This phenomenon leads to a lower concentration in paddy water after flooding and, consequently, a lower mass available for leaching into groundwater. Despite this slight difference, considering the EPRIPjudgement, we can conclude that all the irrigation methods have the same environmental impact (Intermediate).
3.2.9. Food Safety
Results for Cadmium, total and inorganic Arsenic in polished rice grain are reported in Table 10.
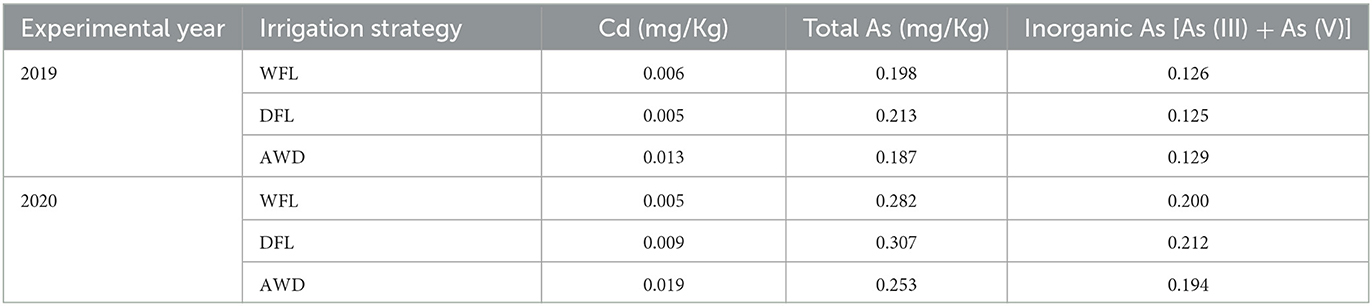
Table 10. Cadmium, total arsenic and inorganic arsenic grain content.
Table 10 shows that the total Arsenic content in grain was not so different among irrigation strategies. However, the inorganic Arsenic content in the DFL treatment in the 2020 experimentation was slightly above the legal limit. Rice Cadmium level was higher in the AWD treatment, although under the legal limits set in the EU for baby food (EU Commission Regulation n. 1323/2021 of 10th August 2021).
3.3. Social acceptability
Results of the social analysis aimed to define, introduce and promote measures for increasing the acceptance level of innovative water regimes, including economic measures, such as direct and indirect subsidies, and information campaigns (Dolnicar et al., 2011; Aznar-Sánchez et al., 2017).
Most farmers in the area receive water from different water sources, either as a continuous discharge or on a rotational schedule. In the case of a turned irrigation service, farmers closer to the water source showed to be more confident in receiving enough irrigation water at the planned time, while the further away they are, the higher the uncertainty about water availability they perceive. Only 36% of farmers complained about the lack of water; however, over 60% reported water shortage problems in the last few years.
Farmers are highly conscious of the advantages and disadvantages of dry seeding. They highlight the benefits of machinery management and, thus, the practicality of dry seeding. In fact, with the water seeding, the farmers need dedicated tractors with metal wheels adapted to the rice paddies. This aggravates the overall farm management, including the movement of metal-wheeled tractors across roads. Especially in the case of fragmented farms where the movement of tractors and machinery is very burdensome, dry seeding guarantees a more efficient and inexpensive seeding management. In sandy soils (like those in the area), dry seeding improves the effectiveness of seeding. Furthermore, dry seeding avoids the spread of algae and specific weeds.
When asked about their willingness to switch from dry to water seeding, 55% of the farmers gave a positive answer, although they were not convinced that water seeding could improve productivity, quality of work, and weed control. Their confidence in their ability to manage water seeding plays a crucial role in their willingness to change. It is noteworthy that young farmers are more hesitant due to their lack of experience with water seeding. Among the farmers willing to shift, 60% stated that they would be willing to shift to water seeding if they received adequate financial support.
Finally, the farmers are asked about the application of AWD. Although only a small number of farmers had already heard about this irrigation technique, most of them expressed interest in adopting it or at least trying it on their farms after receiving relevant information. All emphasized the need for financial and technical support and stated that they would not adopt it in case of a lack of support.
The application of AWD would benefit from the technological skills and propensity toward the technology of farmers. The majority of farmers (more than 80%) declared to be proficient in using computers for farm management. The use of sensors to drive AWD emerged as a relevant issue since none of the farmers is familiar with these technologies.
4. Conclusive remarks
Water management practices alternative to continuous flooding are highly required to enhance water use efficiency and safeguard environmental quality in rice agro-ecosystems. In this study, a novel and multidisciplinary approach to evaluate the overall sustainability (economic, environmental, and social) of water-saving irrigation techniques alternative to the traditional continuous flooding was proposed and applied to a set of alternative irrigation strategies tested in an experimental platform. The results achieved highlight the methodology's effectiveness in summarizing the main economic, environmental and social aspects that emerged from the application of the water-saving irrigation solutions tested in the context of the Italian rice area. This approach can be applied in the future to rice in other geographical contexts.
Concerning the specific achieved results, economic indicators show that the dry seeding and delayed flooding (DFL) irrigation technique is economically more advantageous than wet seeding (WFL and AWD), due to lower production costs resulting from lower labor and energy inputs. In addition, environmental indicators show that compared to WFL, DFL saves 14% on irrigation use, reduces percolation by about 15% and decreases methane emissions by around 30%. Although the higher economic return and the decrease in CH4 emissions, the massive adoption of DFL in the area in the last 15 years led to a reduction of the contribution of groundwater to rivers and unlined irrigation networks at the beginning of the irrigation season and to an increased irrigation need for rice in June incrementing the rice competition for water with other crops.
In this context, Alternate Wetting and Drying (AWD) was found to be a very promising irrigation technique for rice cultivated in Lomellina. It proved to be economically reliable (even if <DFL), and to allow a reduction of water use without strongly penalizing the rice yield or grain quality (cadmium and arsenic content in rice grain). Based on the effects of the DFL on the water resource system in recent years and on the results of studies such as the one presented in this paper, the Lombardy regional authority decided to subsidize the return to water seeding as part of the EU Rural Development Plan with about 200 euros. This amount of money is well in line with the difference in the production costs between the wet seeding and the dry seeding identified in this study (216 euros/ha). Concerning the environmental aspects, AWD is characterized by an irrigation reduction of 20% with respect to WFL, and it reduces the irrigation needs of rice in June by about 23% compared to WFL. It supports the groundwater recharge during April and May when other crops do not need water. Methane emissions are lower than for WFL, even if site-specific studies should be carried out to better investigate this aspect. The risk of groundwater contamination by pesticides is no greater for AWD than for WFL, even if it is slightly higher than for DFL. Results from the social acceptability assessment showed that the farmers understood the potential of the technique, however technical, financial and technological (i.e., devices to guide the wetting and drying cycles) support is requested to adopt it in their farm.
The Irrigation Consortium AIES (Associazione Irrigua Est Sesia), which manages irrigation water in the main Lombardy rice area, is willing to support the spread of AWD throughout the area, as this could lead to an increase in the availability of irrigation water in the canal distribution networks at the beginning of the irrigation season. However, the concern of the Irrigation Consortium in introducing AWD, is that if this technique would be implemented in the area as in the experimental fields (i.e., by watering the paddies when the soil humidity reaches a certain threshold determined by means of devices installed in the fields), the Consortium should move from an irrigation service based on scheduled turns to an “on-demand” irrigation supply. This critical issue needs further experimental investigations and modeling extrapolations to be properly addressed and will be the next step in the research presented in this article.
Data availability statement
The original contributions presented in the study are included in the article/Supplementary material, further inquiries can be directed to the corresponding author.
Author contributions
AF and OG: conceptualization and methodology. OG, AF, MRi, AM, DT, SC, RV, MRo, AR, EC, MT, LL, AT, and DV: validation. OG, AF, SC, RV, MRo, EC, MT, LL, DV, and AT: formal analysis. OG, RV, AT, and DV: resources. OG, AF, MRi, AM, SC, RV, AR, EC, DV, and AT: data curation. OG, EC, RV, AT, and DV: writing—original draft preparation. AF, OG, SC, RV, EC, AT, and DV: writing—review and editing. OG: visualization. AF: supervision and project administration. AF, MRo, and MT: funding acquisition. All authors contributed to the article and approved the submitted version.
Funding
This research was conducted within the Project MEDWATERICE: Toward a sustainable water use in Mediterranean rice-based agro-ecosystems, financed in the context of PRIMA Programme (PRIMA-Section2-2018; Topic: 1.1.3: Irrigation technologies and practices). Italian researchers are co-funded by the Italian Ministry of Instruction, University and Research (MUR).
Conflict of interest
AT was employed by Aeiforia srl.
The remaining authors declare that the research was conducted in the absence of any commercial or financial relationships that could be construed as a potential conflict of interest.
Publisher's note
All claims expressed in this article are solely those of the authors and do not necessarily represent those of their affiliated organizations, or those of the publisher, the editors and the reviewers. Any product that may be evaluated in this article, or claim that may be made by its manufacturer, is not guaranteed or endorsed by the publisher.
Supplementary material
The Supplementary Material for this article can be found online at: https://www.frontiersin.org/articles/10.3389/frwa.2023.1213047/full#supplementary-material
References
Ajzen, I. (1991). The theory of planned behavior. Organ. Behav. Hum. Decis. Process. 50, 179–211. doi: 10.1016/0749-5978(91)90020-T
Allen, R., Pereira, L. S., Raes, D., and Smith, M. (1998). Crop Evapotranspiration: Guidelines for Computing Crop Water Requirements, Irrigation and Drainage Paper 56. Rome: United Nations FAO.
Aznar-Sánchez, J. A., Belmonte-Ureña, L. J., and Valera, D. L. (2017). Perceptions and acceptance of desalinated seawater for irrigation: a case study in the Níjar District (Southeast Spain). Water 9, 408. doi: 10.3390/w9060408
Bechini, L., and Castoldi, N. (2010). On-farm monitoring of economic and environmental performances of cropping systems: results of a 2-year study at the field scale in northern Italy. Ecol. Indic. 9, 1096–1113. doi: 10.1016/j.ecolind.2008.12.008
Bouman, B. A. M., Feng, L., Tuong, T. P., Lu, G., Wang, H., and Feng, Y. (2007). Exploring options to grow rice using less water in northern China using a modelling approach: II. Quantifying yield, water balance components, and water productivity. Agric. Water Manag. 88, 23–33. doi: 10.1016/j.agwat.2006.10.005
Campbell, J. I., Aturinda, I., Mwesigwa, E., Burns, B., Santorino, D., Haberer, J. E., et al. (2017). The technology acceptance model for resource-limited settings (TAM-RLS): a novel framework for mobile health interventions targeted to low-literacy end-users in resource-limited settings. AIDS Behav. 21, 3129–3140. doi: 10.1007/s10461-017-1765-y
Carrijo, D. R., Lundy, M. E., and Linquist, B. A. (2017). Rice yields and water use under alternate wetting and drying irrigation: a meta-analysis. Field Crops Res. 203, 173–180. doi: 10.1016/j.fcr.2016.12.002
Cayuela, M. L., Aguilera, E., Sanz-Cobena, A., Adams, D. C., Abalos, D., Barton, L., et al. (2017). Direct nitrous oxide emissions in Mediterranean climate cropping systems: emission factors based on a meta-analysis of available measurement data. Agri. Ecosyst. Environ. 238, 25–35. doi: 10.1016/j.agee.2016.10.006
Cesari de Maria, S., Bischetti, G. B., Chiaradia, E. A., Facchi, A., Miniotti, E. F., Rienzner, M., et al. (2017). The role of water management and environmental factors on field irrigation requirements and water productivity of rice. Irrig. Sci. 35, 11–26. doi: 10.1007/s00271-016-0519-3
Cesari de Maria, S., Rienzner, M., Facchi, A., Chiaradia, E. A., Romani, M., and Gandolfi, C. (2016). Water balance implications of switching from continuous submergence to flush irrigation in a rice-growing district. Agri. Water Manag. 171, 108–119. doi: 10.1016/j.agwat.2016.03.018
Chlapecka, J. L., Hardke, J. T., Roberts, T. L., Frizzell, D. L., Castaneda-Gonzalez, E., Clayton, T., et al. (2019). Allowable Water Deficit When Utilizing Alternative Rice Irrigation Strategies. (University of Arkansas, Fayetteville, B. R. Wells Arkansas Rice Research Studies), 170–174.
Davis, F. D. (1989). Perceived usefulness, perceived ease of use, and user acceptance of information technology. MIS Q. Manag. Inf. Syst. 1989, 249008. doi: 10.2307/249008
Devkota, P. K., Pasuquin, E., Elmido-Mabilangan, A., Dikitanan, R., Singleton, G. R., Stuart, A. M., et al. (2019). Economic and environmental indicators of sustainable rice cultivation: A comparison across intensive irrigated rice cropping systems in six Asian countries. Ecol. Indicat. 105, 199–214. doi: 10.1016/j.ecolind.2019.05.029
Dolnicar, S., Hurlimann, A., and Grün, B. (2011). What affects public acceptance of recycled and desalinated water? Water Res. 45, 2011. doi: 10.1016/j.watres.2010.09.030
El-Agha, D. E., Molden, D. J., and Ghanem, A. G. (2011). Performance assessment of irrigation water management in old lands of the Nile delta of Egypt. Irrigat. Drainage Syst. 25, 9116. doi: 10.1007/s10795-011-9116-z
Ente Nazionale Risi (2020). Bilancio Di Collocamento 2019/2020- Consuntivo Definitive, Pavia, Italy.
Facchi, A., Rienzner, M., Cesari de Maria, S., Mayer, A., Chiaradia, E. A., Masseroni, D., et al. (2018). Exploring scale-effects on water balance components and water use efficiency of toposequence rice fields in Northern Italy. Hydrol. Res. 49, 1711–1723. doi: 10.2166/nh.2018.125
FAOSTAT (2021). Food and Agriculture Organization Corporate Statistical Database. Available online at: http://www.fao.org/faostat/en (accessed August 2, 2021).
Fishbein, M., and Ajzen, I. (1975). Belief, Attitude, Intention and Behavior: An Introduction to Theory and Research. Boston, MA: Addison-Wesley.
Gharsallah, O., Gandolfi, C., and Facchi, A. (2021). Methodologies for the sustainability assessment of agricultural production systems, with a focus on rice: a review. Sustainability 13, 11123. doi: 10.3390/su131911123
Häni, F. J., Stämpfli, A., Gerber, T., Porsche, H., Thalmann, C., and Studer, C. (2006). “RISE: a tool for improving sustainability in agriculture: a case study with tea farms in southern India,” in Sustainable Agriculture from Common Principles to Common Practice. Proceedings and Outputs of the First Symposium of the International Forum on Assessing Sustainability in Agriculture (INFASA). (Bern: International Institute for Sustainable Development), 121–148.
Hoang, T. T. H., Do, D. T., Tran, T. T. G., Ho, T.D., and Rehman, H. (2019). Incorporation of rice straw mitigates CH4 and N2O emissions in water saving paddy fields of Central Vietnam. Arch. Agronom. Soil Sci. 65, 113–124. doi: 10.1080/03650340.2018.1487553
International Panel on Climate Change (2019a). Refinement to the 2006 IPCC Guidelines for National Greenhouse Gas Inventories, Volume 4: Agriculture, Forestry and Other Land Use. Chapter 5: Cropland, Hayama: Institute for Global Environmental Strategies (IGES).
International Panel on Climate Change (2019b). Refinement to the 2006 IPCC Guidelines for National Greenhouse Gas Inventories, Volume 4: Agriculture, Forestry and Other Land Use. Chapter 11: N2O Emissions from Managed Soils, and CO2 Emissions from Lime and Urea Application, Hayama: Institute for Global Environmental Strategies (IGES).
International Panel on Climate Change. (2016). “Cropland,” in 2006 IPCC Guidelines for National Greenhouse Gas Inventories, Volume 4: Agriculture, Forestry and Other Land Use (Hayama: Institute for Global Environmental Strategies).
Kartal, S., Degirmenci, H., and Arslan, F. (2019). Assessment of irrigation schemes with performance indicators in south eastern irrigation district of Turkey. J. Agri. Sci. 2019, 512677. doi: 10.15832/ankutbd.512677
Khaksar, S. M. S., Khosla, R., Singaraju, S., and Slade, B. (2019). Carer's perception on social assistive technology acceptance and adoption: moderating effects of perceived risks. Behav. Inform. Technol. 2019, 1690046. doi: 10.1080/0144929X.2019.1690046
Kuscu, H., Bölüktepe, F. E., and Demir, A. O. (2009). Performance assessment for irrigation water management: a case study in the Karacabey irrigation scheme in Turkey. Afri. J. Agri. Res. 4, 124–132.
LaHue, G. T., Chaney, R. L., Adviento-Borbe, M. A., and Linquist, B. A. (2016). Alternate wetting and drying in high yielding direct-seeded rice systems accomplishes multiple environmental and agronomic objectives. Agri. Ecosyst. Environ. 229, 30–39. doi: 10.1016/j.agee.2016.05.020
Legris, P., Ingham, J., and Collerette, P. (2003). Why do people use information technology? A critical review of the technology acceptance model. Inf. Manag. 40, 191–204. doi: 10.1016/S0378-7206(01)00143-4
Linquist, B. A., Anders, M. M., Adviento-Borbe, M. A. A., Chaney, R. L., Nalley, L. L., Da Rosa, E. F. F., et al. (2015). Reducing greenhouse gas emissions, water use and grain arsenic levels in rice systems. Glob. Change Biol. 21, 407–417. doi: 10.1111/gcb.12701
Malano, H., and Burton, M. (2001). Guidelines for Benchmarking Performance in the Irrigation and Drainage Sector. Rome: IPTRID Secretariat Food and Agriculture Organization of the United Nations.
Mayer, A., Rienzner, M., Cesari de Maria, S., Romani, M., Lasagna, A., and Facchi, A. (2019). A comprehensive modelling approach to assess water use efficiencies of different irrigation management options in rice irrigation districts of northern Italy. Water 11, 1833. doi: 10.3390/w11091833
MED-Rice (2003). “Guidance document for environmental risk assessments of active substances used on rice in the EU for Annex I Inclusion,” in Document Prepared by Working Group on MED-Rice, EU Document Reference SANCO/1090/2000 – rev.1. (Brussels), 108.
Meijide, A., Manca, G., Goded, I., Magliulo, V., di Tommasi, P., Seufert, G., et al. (2011). Seasonal trends and environmental controls of methane emissions in a rice paddy field in Northern Italy. Bio-geosciences 8, 3809–3821. doi: 10.5194/bg-8-3809-2011
Molden, D., Christopher, R., Perry, C. J., de Fraiture, C., and Kloezen, W. H. (1998). Indicators for Comparing Performance of Irrigated Agricultural Systems, Colombo: International Water Management Institute (IWMI). doi: 10.3910/2009.028
Nalley, L., Linquist, B. A., Kovacs, K., and Anders, M. (2015). The economic viability of alternative wetting and drying irrigation in arkansas rice production. Agron. J. 107, 579–587. doi: 10.2134/agronj14.0468
Padovani, L., Trevisan, M., and Capri, E. (2004). A calculation procedure to assess potential environmental risk of pesticides at the farm level. Ecol. Indicat. 4, 111–123. doi: 10.1016/j.ecolind.2004.01.002
Pan, J., Liu, Y., Zhong, X., Lampayan, R. M., Singleton, G., Huang, N., et al. (2017). Grain yield, water productivity and nitrogen use efficiency of rice under different water management and fertilizer-N-inputs in South China. Agri. Water Manag. 184, 191–200. doi: 10.1016/j.agwat.2017.01.013
Paracchini, M. L., Bulgheroni, C., Borreani, G., Tabacco, E., Banterle, A., Bertoni, D., et al. (2015). A diagnostic system to assess sustainability at a farm level: the SOSTARE model. Agric. Syst. 133, 35–53. doi: 10.1016/j.agsy.2014.10.004
Pérez, M. F. M., and Canas, J. R. (2013). Assessment of irrigation water management in the Genil-Cabra (Córdoba, Spain) irrigation district using irrigation indicators. Agri. Water Manag. 120, 98–106. doi: 10.1016/j.agwat.2012.06.020
Peyron, M., Bertora, C., Pelissetti, S., Pullicino, D. S., Celia, L., Miniotti, E., et al. (2016). Greenhouse gas emissions as affected by different water strategy practices in temperate rice paddies. Agri. Ecosyst. Environ. 232, 17–28. doi: 10.1016/j.agee.2016.07.021
Rao, K. V., Gangwar, S., Keshri, R., Chourasia, L., Bajpai, A., and Soni, K. (2017). Effects of drip irrigation system for enhancing rice (Oryza sativa L.) yield under system of rice intensification management. Appl. Ecol. Environ. Res. 15, 487–495. doi: 10.15666/aeer/1504_487495
Reus, J., Leendertse, P., Bockstaller, C., Fomsgaard, I., Gutsche, V., Lewis, K., et al. (2002). Comparison and evaluation of eight pesticide environmental risk indicators developed in Europe and recommendations for future use. Agri. Ecosyst. Environ. 90, 177–187. doi: 10.1016/S0167-8809(01)00197-9
Rogers, E. M., Singhal, A., and Quinlan, M. M. (2019). “Diffusion of innovations,” in An Integrated Approach to Communication Theory and Research, 3rd Edn (Oxfordshire: Taylor and Francis), 415–433.
Samoy-Pascual, K., Sibayan, E. B., Grospe, F. S., Remocal, A. T., Padre, A. T., Tokida, T., et al. (2019). Is alternate wetting and drying irrigation technique enough to reduce methane emission from a tropical rice paddy? Soil Sci. Plant Nutr. 65, 203–207. doi: 10.1080/00380768.2019.1579615
Sauvenier, X., Valckx, J., Van Cauwenbergh, N., Wauters, E., Bachev, H., Biala, K., et al. (2005). Final Report: Framework for Assessing Sustainability Levels in Belgian Agricultural Systems (CP/28). Scientific Support Plan for a Sustainable Development Policy (SPSD II) CP 28; Belgian Science Policy. (Brussels: Belgian Science Policy), 125.
Saxena, R., and Punekar, R. M. (2020). Designing pro-poor mobile financial services: learning from the financial diaries of urban poor in India. World Dev. Perspect. 20, 100266. doi: 10.1016/j.wdp.2020.100266
Song, T., Xu, F., Yuan, W., Chen, M., Hu, Q., Tian, Y., et al. (2019). Combining alternate wetting and drying irrigation with reduced phosphorus fertilizer application reduces water use and promotes phosphorus use efficiency without yield loss in rice plants. Agri. Water Manag. 223, 105686. doi: 10.1016/j.agwat.2019.105686
SRP (2019). The SRP Performance Indicators for Sustainable Rice Cultivation (Version 2.0), Sustainable Rice Platform. (Bangkok). Available online at: http://www.sustainablerice.org
Trevisan, M., Di Guardo, A., and Balderacchi, M. (2009). An environmental indicator to drive sustainable pest management practices. Environ. Modell. Softw. 24, 994–1002. doi: 10.1016/j.envsoft.2008.12.008
Van Biljon, J., and Renaud, K. (2008). “A qualitative study of the applicability of technology acceptance models to senior mobile phone users,” in Presented at: International Workshop on Modeling Mobile Applications and Services; 20-23 Oct 2008. (Barcelona), 228–237.
Venkatesh, V., Morris, M. G., Davis, G. B., and Davis, F. D. (2003). User acceptance of information technology: toward a unified view. MIS Q. Manag. Inf. Syst. 27, 425–478. doi: 10.2307/30036540
Vogelsang, K., Steinhüser, M., and Hoppe, U. (2013). “A qualitative approach to examine technology acceptance,” in Proceedings of the International Conference on Information Systems. Milano.
Glossary
WFL, Wet seeding and traditional FLooding; DFL, Dry seeding and delayed FLooding (from around the 3-leaf stage); AWD, wet seeding and Alternated Wetting and Drying from the tillering stage; TAM, Technology Acceptance Model; TPB, Theory of Planned Behavior; DOI, Diffusion Of Innovation; UTAUT, Unified Theory of Acceptance and Use of Technology; TRA, Theory of Reasoned Action; EPRIP, Environmental Potential Risk Indicator for Pesticides; SRP, Sustainable Rice Platform; N, P and K, Nitrogen, Phosphorus and Potassium; EMI, Electro-Magnetic Induction; LAI, Leaf Area Index; TI, Total Income; TC, Total Costs; VC, Variable Costs; FC, Fixed Costs; CANIT, Additional Costs for the Adoption of New Irrigation Technology; WP, Water Productivity; RWS, Relative Water Supply; NI, Net Irrigation; QIN, Irrigation INflow to the rice field; QOUT, Irrigation OUtflow to the rice field; R, Total rainfall over the agricultural season; P, Percolation to groundwater; ETc, Potential evapotranspiration; ΔL, Variation in ponding water; Δθ, Variation in soil moisture; ET0, Reference evapotranspiration; Kc, Crop coefficient; CH4, Methane emissions; N2O, Nitrous oxide emissions; ETR, Exposure Toxicity Ratio; PEC, Predicted Environmental Concentration; PEC SW, PEC for surface water; PEC SED, PEC for sediment; PEC GW, PEC for groundwater; OSR, Rainfall out of the agricultural season; RC, Groundwater recharge coefficient; RP, Risk Point; RPgw, max, Maximum Risk Point for groundwater; RPsw, max, Maximum Risk Point for surface water; RPsed, max, Maximum Risk Point for sediment; As, Arsenic; Cd, Cadmium
Keywords: water-saving, Alternate Wetting and Drying, rice, indicator, social acceptability, sustainability dimension
Citation: Gharsallah O, Rienzner M, Mayer A, Tkachenko D, Corsi S, Vuciterna R, Romani M, Ricciardelli A, Cadei E, Trevisan M, Lamastra L, Tediosi A, Voccia D and Facchi A (2023) Economic, environmental, and social sustainability of Alternate Wetting and Drying irrigation for rice in northern Italy. Front. Water 5:1213047. doi: 10.3389/frwa.2023.1213047
Received: 27 April 2023; Accepted: 19 June 2023;
Published: 06 July 2023.
Edited by:
Abdelazim Negm, Zagazig University, EgyptReviewed by:
Ismail Abd-Elaty, Zagazig University, EgyptPantazis Georgiou, Aristotle University of Thessaloniki, Greece
Copyright © 2023 Gharsallah, Rienzner, Mayer, Tkachenko, Corsi, Vuciterna, Romani, Ricciardelli, Cadei, Trevisan, Lamastra, Tediosi, Voccia and Facchi. This is an open-access article distributed under the terms of the Creative Commons Attribution License (CC BY). The use, distribution or reproduction in other forums is permitted, provided the original author(s) and the copyright owner(s) are credited and that the original publication in this journal is cited, in accordance with accepted academic practice. No use, distribution or reproduction is permitted which does not comply with these terms.
*Correspondence: Arianna Facchi, YXJpYW5uYS5mYWNjaGlAdW5pbWkuaXQ=