 Carol J. Friedland
 Fatemeh Orooji
 Ayat Al Assi
 Matthew L. Flynn4
 Rubayet Bin Mostafiz
- 1LaHouse Research and Education Center, Department of Biological and Agricultural Engineering, Louisiana State University Agricultural Center, Baton Rouge, LA, United States
- 2Coastal Studies Institute, Louisiana State University, Baton Rouge, LA, United States
- 3School of Engineering and Applied Sciences, Western Kentucky University, Bowling Green, KY, United States
- 4Bert S. Turner Department of Construction Management, Louisiana State University, Baton Rouge, LA, United States
- 5Department of Oceanography and Coastal Sciences, College of the Coast and Environment, Louisiana State University, Baton Rouge, LA, United States
Much of the U.S. petrochemical infrastructure is heavily concentrated along the western coast of the Gulf of Mexico within the impact zone of major tropical cyclone events. Flood impacts of recent tropical disturbances have been exacerbated by an overall lack of recognition of the vulnerabilities to process systems from water intrusion, as well as insufficient disaster mitigation planning. Vulnerability assessment methods currently call for the aggregation of qualitative data to survey the susceptibility of industrial systems to floodwater damage. A means to quantify these consequences is less often employed, resulting in a poor translation of the threat of flood hazards to a crucial element of the economy. This paper reviews flood damage assessment for industrial facilities and presents a component-level conceptual methodology to assess the consequences of flood events. To more effectively communicate loss potential from flood events, the proposed methodology utilizes synthetic estimation to calculate repair requirements, shutdown time, and direct cost.
1 Introduction
Flood vulnerability assessments are fundamental to optimal decision-making for flood mitigation strategies (Mostafiz et al., 2022a), but little academic attention has been devoted to improve assessment of industrial infrastructure vulnerabilities (Merz et al., 2010; Ryu et al., 2016; Girgin et al., 2019). Insurance companies and others dedicate significant economic resources toward damage modeling, but the focus of these studies is generally an overall risk assessment of the landscape, rather than a specific facility-level vulnerability study to identify and mitigate components and systems vulnerable to flood damage. Current loss evaluations are based on qualitative estimates (Changnon, 2003; Li et al., 2019; Figueiredo et al., 2021) leaving a gap in translation from descriptions to numerical calculation of waterborne threats. The quantification of loss potential is essential for understanding and communicating the inherent liabilities of the constructed environment in response to natural hazards (Downton and Pielke, 2005; Scawthorn et al., 2006; Yildirim et al., 2022).
The U.S. Gulf Coast is an industrialized landscape marked by an array of process facilities extending from Alabama to the Texas/Mexico border (Harris et al., 2020). This area faces flood threats both from riverine flooding in the spring as well as coastal surges accompanying the Atlantic hurricane season's storms (Needham et al., 2012). Bolstering the U.S. oil and gas industry's resilience to coastal hazards has the promise to decrease an estimated $350 billion in expected hurricane reconstruction expenditures over the next two decades, an amount nearly three percent of the regional GDP (Entergy, 2010). It is estimated that ~95% of flood losses can be mitigated by following proper flood protection techniques (Rose et al., 2007; Sun et al., 2020), thereby increasing the impetus for developing appropriate means to understand flood damage within the confines of individual industrial sites. A more resilient infrastructure capable of resisting the impacts of flood hazards would reduce the risks of materials release following a major event (Pine, 2006; Stout et al., 2007; Ebad Sichani et al., 2020; Méndez-Lázaro et al., 2021). Therefore, risks posed to the surrounding community and environment due to infrastructure failure can be reasonably lessened by refining flood damage assessment and developing prevention strategies. Local communities that are economically tied to the operation of plants would similarly benefit from better understanding and mitigation of flood hazards by reducing plant shutdowns and outages, providing more stable employment for workers.
Flood damage is most often conceptualized either through historically- or synthetically-derived depth-damage functions, in which flood consequences are calculated as a function of inundation depth (Mostafiz et al., 2021a). The variability of components in process plants, however, creates an obstacle for the implementation of a standard vulnerability assessment (Seifert et al., 2010; Schoppa et al., 2020). This fact results in a scientific necessity to develop a vulnerability assessment process (VAP) that can appropriately quantify industrial flood losses for individual facilities through the application of synthetic estimation practices. Awareness can then be focused on developing anticipative, rather than reactive, disaster mitigation strategies; and resiliency may be better achieved by modifying a facility's tolerance to loss or failure (Klein et al., 2003; Aoki et al., 2017; Van Veelen et al., 2018).
Barriers to the development of industrial infrastructure vulnerability assessment methodologies to flooding have been identified by several scholars. The foremost of these barriers is the wide range of systems and components within the broad industrial structure classification (Booysen et al., 1999; Sultana et al., 2018). Building use is the key difference between the evaluation of industrial facility susceptibility and other occupancies. It is not possible to define industrial facilities within the same taxonomic systems used for residential and commercial structures. Standard damage may be assessed for the latter in terms of loss per unit area (Blong, 2003; Gulzar et al., 2021) due to the lack of material and construction variance across the landscape. However, production processes vary significantly (e.g., textile mills, breweries, oil refineries), precluding the implementation of a standardized approach across all industrial structures. Moreover, the effort required to detail object behavior and aggregate flood performance metrics into a standard approach for the entire industrial landscape of a region would be too great (Merz et al., 2010).
In spite of these previous findings, the economic value of industrial process facilities, their importance to national security, and the potential economic and environmental consequences of flood damage to those facilities are so great that development of methodologies to estimate the shutdown and economic impacts of flood events is an imperative. By taking advantage of computational power and relational databases, it is possible to construct component-based depth-consequence relationships for specific facilities, which can be later extended to the network level. As the predecessor to the conceptualization of industrial flood vulnerability analysis, Kates (1963) proposed the use of synthetic flood functions to clarify the benefits of alternative adjustments to structures and land use change through the use of a five-step process that crudely quantified impacts within the entire industrial flood zone. Of particular interest is his fourth point, the focus of this research, which is to design a matrix in which appropriate stage-unit functions are applied to the specified structure, contents, and production components.
Although a keystone in the development of modern flood vulnerability assessment techniques, Kates (1963) noted that his system was lacking, and that the ideal synthesis of information would grow from individual facilities, with inventories being developed, and consequence functions realized. Perhaps it may be “science fiction of the highest order” (Kates, 1963, p. 26), but by anticipating failures in the system before they develop, mitigation can be proactive in preventing possible future disruptions.
This proposed process reconciles the barriers identified by previous scholars with the aims of Kates (1963) to synthesize a holistic method for the identification and quantification of the vulnerabilities of not only individual plants, but also of an industrialized region as a total system. Foremost, by combining the noted weaknesses detailed throughout the existing literature, the assessment commences at the component level and is extended on a systems basis only to the boundaries of the facility. By analyzing the effects of inundation starting with the most basic elements of plant functions, a better means to understand and mitigate flood damage is not only realized through this ground-up approach, but a general template is also constructed for application to all elements of the industrial built environment.
As a step toward achieving this goal, this paper details a conceptual VAP to estimate the repair requirements, shutdown/outage time (i.e., schedule), and economic cost consequences for petrochemical facilities using a component-based approach. A conceptual framework is proposed and includes the identification and definition of flood parameters, facility and construction information, flood impact assessment, restoration action assessment, and vulnerability cost assessment. A simple case study is presented to demonstrate the methodology and concluding remarks and future extensions of this research.
This paper presents a valuable contribution to the field of industrial sector by introducing a novel VAP to increase the understanding of inundation threats to process systems. The primary contribution of this paper is the component-based approach that focuses on the vulnerability of individual components of industrial facilities, the indirect impact of damage from one component to others through the relationship matrix, and the development of a more comprehensive understanding of the potential economic losses caused by flooding. Therefore, the proposed VAP enhances the quality of information used by plant managers in determining the benefits of mitigation techniques in light of mitigation costs. The methodology presented in this paper is developed generally to be flexible with regard to the input data associated with flood depth functions, industry types and components, and cost data. Therefore, as improved input data are developed, the framework will accommodate their use and generate improved results.
2 Development of VAP framework
2.1 Concept of vulnerability
Vulnerability generally refers to the degree to which a system is likely to experience harm due to exposure to a hazard (Brooks, 2003; Turner et al., 2003; Dewan, 2013; Mohd Fadzer et al., 2017; Miranda and Ferreira, 2019; Pathak et al., 2021). For flood hazards, it can therefore be understood to mean “susceptibility to damage” posed by floodwaters, with the inundation level acting as the independent variable. Additionally, floodwater type (e.g., saltwater, freshwater, contaminated water) and duration of inundation are also key parameters in the ultimate effects of flooding (Ngo et al., 2022). In turn, a thorough vulnerability assessment involves examining system elements and design, as well as identifying component failure modes in response to a given set of threats (Baker, 2005; Peterson et al., 2019). This comprehensive facility vulnerability assessment establishes the framework to organize a system of components with associated damage functions and failure modes in response to hazard impacts. The database formed from consequence risk matrix (Peace, 2017; Li et al., 2018; Bao et al., 2022) that serves as the foundation for the synthetic estimation analysis proposed in this paper.
2.2 Flood vulnerability assessment and management
The approach to flood management has evolved from earlier practices employed by land developers, which primarily focused on containing the hazard through flood control structures such as dikes and levee systems. However, with the expansion of built environments in flood-prone areas, there is now a greater need to consider the performance of at-risk elements exposed to flood hazards, rather than just mitigating the flood risk (Merz et al., 2010; Yildirim et al., 2022). Contemporary practices acknowledge the significance of system elements and layout, and aim to assess their failure modes in the context of natural threats in order to determine the overall vulnerability of the system to flooding. These practices tend to identify “critical” components where a loss of function would immediately lead to downstream failures within the process system. However, the failure to recognize the importance of “non-critical” elements on overall system performance may have devastating consequences. For example, an oil spool piece has flange gaskets that, should they fail in a flood event, will allow contaminated water to enter the lubrication system, potentially causing damage to the efficiency and alignment of rotating machinery, thus transforming a seemingly non-critical element into an essential component within the function of the total system. To account for this, the operation, design, and interrelationships of the plant (i.e., plant subsystems and subsystem components) are detailed within the proposed VAP to determine failure modes and system repair requirements. From this point of view, the importance of individual process subsystems is recognized and recommendations can be made to reduce the vulnerability of the subsystem, and in turn the total facility system (Baker, 2005).
2.3 Damage estimation
The contemporary approach to determining costs associated with natural hazards is economic estimation of direct damage (i.e. monetary loss) by applying depth-damage functions (Krzysztofowicz and Davis, 1983; Dutta et al., 2003; Van der Sande et al., 2003; Merz et al., 2004; Apel et al., 2006; Pistrika and Tsakiris, 2007; Friedland, 2009; Mostafiz et al., 2021b; Rahim et al., 2021; Gnan et al., 2022a; Mostafiz, 2022; Al Assi et al., 2023a). Rather than using the term “depth-damage,” this paper utilizes a more appropriate “depth-consequence” conceptualization to characterize inundation impacts. The depth-consequence function integrates the idea of physical damage with an estimate of facility loss to define the quantifiable effects of flooding within a single plant. To clarify disparity between the terms within the context of the framework, the following distinction between damage, loss, and risk is incorporated.
• Damage is a direct consequence, expressed as a physical attribute that can be directly measured in terms of a level of degradation, spoil, removal or destruction (Friedland, 2009).
• Loss is an indirect consequence, measured as the monetary obligation required to return a physically damaged condition to its full, undamaged state, expressed in absolute or relative economic terms and its consequences (Friedland, 2009).
• Risk is the product of the probability of event occurrence and its consequences. Recent studied tend to quantify the average annual loss to represent the flood risk (Quinn et al., 2019; Gnan et al., 2022b,c; Mostafiz et al., 2022b; Rahim et al., 2022; Wing et al., 2022; Al Assi et al., 2023b,c; Friedland et al., 2023).
Messner and Meyer (2006) emphasized the importance of spatial scale for flooding characteristics, differentiating macro-, meso-, and micro-scale approaches. As this VAP focuses on an individual facility, and more specifically, components and subsystems within that facility, a micro-level approach is taken, “as small-scale analyses tend to use more accurate methods” (Messner and Meyer, 2006, p.13). Further, absolute depth-loss functions, in which increased inundation is directly correlated with increased consequences (Penning-Rowsell and Chatterton, 1977; Penning-Rowsell et al., 2003), are disregarded in favor of a relative depth-consequence function so that Kates' (1963) adaptation option function can be incorporated.
2.4 Failure modes
Rinaldi et al. (2001) proposed a hierarchy of terms for a taxonomic identification of plant components, which is modified here with specific examples for oil and gas process facilities. Parts are individually identifiable components (e.g., a length of pipe or a bearing within a motor). Units are a collection of parts (e.g., insulated piping assemblies and complete motors). A subsystem refers to an entity of interdependent units (e.g., the oil house for a gas turbine containing motors, pumps, electrical systems, and piping). The system is an aggregation of all subsystems fulfilling a common task (e.g., a mechanical starting package, a generator, a gas turbine, and a boiler, with all auxiliary subsystems, produce the steam supply for an oil refinery). Infrastructure is understood as the complete network of systems within a particular field (e.g., an oil refinery's process systems are fed by steam created from a cogeneration system, which also supplies surplus electricity to instrumentation and control systems). Descriptions of failure modes allow separation of the characteristics of impact upon the system through the failure of parts, units, and subsystems (Rinaldi et al., 2001). A cascading failure is a disruption affecting each downstream process from the initial failure (Braun et al., 2018) (e.g., a water-permeated gasket in one unit results in a water intrusion into the lube oil subsystem, leading to damage in the mechanical function of the entire gas turbine system). An escalating failure is a disruption in one system that causes a failure in a second, independent system (Rehak and Hromada, 2018) (e.g., an unscheduled outage resulting from water intrusion in the gas turbine system forces a refinery to shutdown coker processes due to decreased steam feedstock). Finally, isolated failures are those disruptions that do not affect production processes or other elements of the system. Cognizance of the interactions within the infrastructure is vital to recognizing the scope of potentially small threats to overall resiliency.
3 Component-level vulnerability assessment process
The component-based approach for assessing industrial flood vulnerability assessment is outlined in Figure 1. While traditional flood loss assessment methods (e.g., Kates, 1968; Sangrey et al., 1975; Penning-Rowsell and Chatterton, 1977; Su et al., 2005) and recent implementations such as Hazus (FEMA, 2021) involves the use of depth-damage curves to determine facility-level damage based on an input flood depth, the component-based approach here involves a three-phase process. In Phase 1, flood parameters are identified, and facility and construction information are collected and loaded into databases. In Phase 2, data processing occurs, and in Phase 3, synthetic damage and economic loss modeling is conducted. This approach provides a more detailed and comprehensive analysis of flood vulnerability by examining the vulnerability of individual components of industrial facilities rather than just inventory losses.

Figure 1. Component-based methodology.
3.1 Flood parameters and facility and construction databases
3.1.1 Flood parameters
The determination of flood model parameters is achieved through various approaches, such as analyzing past or projected events, or using a combination of probabilistic events within a comprehensive risk modeling framework. The key parameters that need to be identified as per USACE (2006) guidelines include floodwater elevation (FE), which is crucial in determining the components most likely to be impacted by flooding (Ahmadisharaf et al., 2015). Additionally, the type of floodwater (FT), such as saltwater, freshwater, brackish water, or contaminated water, must be considered as different types of floods can have varying causes and potential impacts on components. For example, saltwater intrusion would increase corrosion rates of pipes made of corrodible metals or alloys (Tansel and Zhang, 2022). Lastly, the duration of the flood (FD) should also be taken into account as the extent of restoration required can depend on the length of exposure to floodwater. Longer-duration floods may cause more severe damage and long-lasting effects (Ahmadisharaf et al., 2015). The Flood Parameters Matrix (FPM) is comprised of an S×3 matrix with S flood scenarios that will be considered by FE, FT, and FD (Equation 1), with column values defined by Equations 2–4.
3.1.2 Facility database
In the first phase of the infrastructure VAP, the site is thoroughly analyzed by utilizing 3-D models, facility documents, or digital copies of plant information. Piping and instrumentation (P&ID) diagrams and equipment drawings are carefully examined to compile a comprehensive inventory of all components.
The complete component inventory from the facility is recorded into a database, and the Facility Data Matrix (FDM) is created. The FDM is an N×6 matrix with N components (Equation 5), with column values defined by Equations 6–11. To proceed with this matrix, obtaining all the necessary data requires direct input from the industrial sector.
The primary objective of this matrix is to provide essential information for every component that can potentially contribute to flood risk and aid in creating efficient emergency response plans in case of an actual flood. For example, the site plans of the facility are used to determine the elevation of each component at which flood damage would occur (CE) for synthetic modeling. Additionally, identifying the quantity (Q) and material type (M) of each component helps estimate the material cost of flood damage.
The interdependencies are examined to understand whether potential failures are isolated or have a cascading effect through the system, and escalating effects can be determined by further implementation of the same process in neighboring systems throughout the infrastructure. This step of the methodology necessitates obtaining direct input from the industry to access all required data, whether in hardcopy or electronic format.
The process involves identifying and documenting system interdependencies, which are then organized and stored in a matrix format referred to as the Relationship Matrix (RM), describing the effect of part inundation on other parts of the analyzed system. RM can be created for all the components of the system based on the technical specification of the system. If N is the number of the components of the system, the RM is an N × M matrix in binary format (i.e., either 0 or 1), where N = M. RMn,m is the element of the RM in row n and column m, illustrated by Ecn:cm (Equation 12), and it represents the effect of component n on component m. Each matrix element equal to zero if component m is not affected by faulty component n, and it would be one if component m is affected by faulty component n, for each n and m from 1 through N (Equation 13).
3.1.3 Construction database
The construction database serves as a valuable source of productivity and cost data, including the required manpower for restoring equipment to production. This encompasses general labor, specialty services, and management resources needed to complete the task. Historical invoices from previous maintenance activities can be used as references to establish typical productivity rates and labor costs for part and unit repairs.
The construction database provides comprehensive information on all components required for an industrial contractor to restore the subsystem to processing capacity. The complete elements inventory is recorded into a database, which primarily relies on historical data or expert knowledge. The Construction Database (CM) is an N×4 matrix with N components (Equation 14), with column values defined by Equations 15–17.
A manhour is used as the measuring unit, each part is assigned a total number of manhours necessary for each restoration action. Additionally, the labor rates, equipment types, and the equipment rental rates are required as a part of the construction database.
3.2 Data processing
3.2.1 Flood impact assessment
In order to determine the restoration requirements, flood parameters are compared with individual entries in the FDM. The component level VAP starts with the initial system and progresses sequentially through each part of that system before moving on to the next system. The first evaluation is to determine if the FE is greater than the CE. Flood direct impact for component n (FDIn) is equal to one if component elevation (CEn) is less than or equal to FE, and is equal to zero if CEn is more than FE (Equation 18).
If the FE is higher than the CE, the component is assumed to be inundated, the direct restoration actions, whether to repair or replace, are determined, and the system is incremented to the next part in the system. If the FE is below the CE, no direct consequence to the component is considered; however, there may be a consequence to other parts due to the process flow. Each part is evaluated to determine indirect consequences. Therefore, in the proposed model to investigate the proper restoration action, two flood impacts are consider, flood direct impact (FDI), and flood indirect impact (FII).
When a component is exposed directly to the water, it may or may not cause damage to other components indirectly. To understand FII for component n (FIIn), RM is used. FIIn is equal to one if component n impacts by flood indirectly, and it means that component n has relationship with other components and any of those components‘ elevation is less than or equal to FE, otherwise FIIn is equal to as zero (Equation 19).
The amount of damage to the directly and indirectly exposed components depends on the components' type and function, and also depends on the FT and FD. Some components such as electronic parts are damaged immediately and need to be replaced, where other components such as stainless steel pipe remain undamaged and no restoration action is required. However, for many of the components the amount of damage is not clear before conducting an inspection after the flood.
3.2.2 Restoration action assessment
The first step in determining restoration actions is inspection. Therefore, for each n component, the probability of inspection, defined as P(I)n, is zero or one. Following inspection, a review of available technical data, this review process ensures a thorough understanding of the technical aspects associated with the components. Following the inspection and technical data review, the assessment of the flood impact on the components is conducted. This assessment spans all four permutation states of flood direct and indirect impact (0–0, 0–1, 1–0, 1–1). Building upon the outcomes of the inspection, technical data review, and flood impact assessment, the proper restoration action (RA) (e.g., no action, repair, replacement, clean, repacking) for any component of the system is selected. The probability of each restoration action is listed in a Restoration Action Matrix (RAM). RAM is a three-dimensional matrix comprised of an N×4×(A+1) where N is the number of components, 4 is the permutation states of flood direct and indirect impact, and A is the number of all possible restoration actions (Equation 20). The RAM is filled through Equations 21–28 where P(I) is the probability of inspection, and P(RAa) is the probability of the ath restoration action. The summation of the probability of all restoration actions for component n; P(RA)n equals one (Equation 29).
The RAM is based on FT, and FD. Under consideration are four flood types: fresh, brackish, salt, contaminated, and three flood durations: <24 h, between 24 and 48 h, and more than 24 h. Therefore, for each system, 12 restoration action matrices are available.
3.3 Synthetic damage and economic loss modeling
3.3.1 Component information matrix
To assess the vulnerability for a system, a computational framework is generated (Figure 2), and all facility and construction databases serve as inputs to the framework to generate the Component Information Matrix (CIM) which contains all required information about the components of the system. CIM is an N × 6 matrix where N is the number of components (Equation 30).
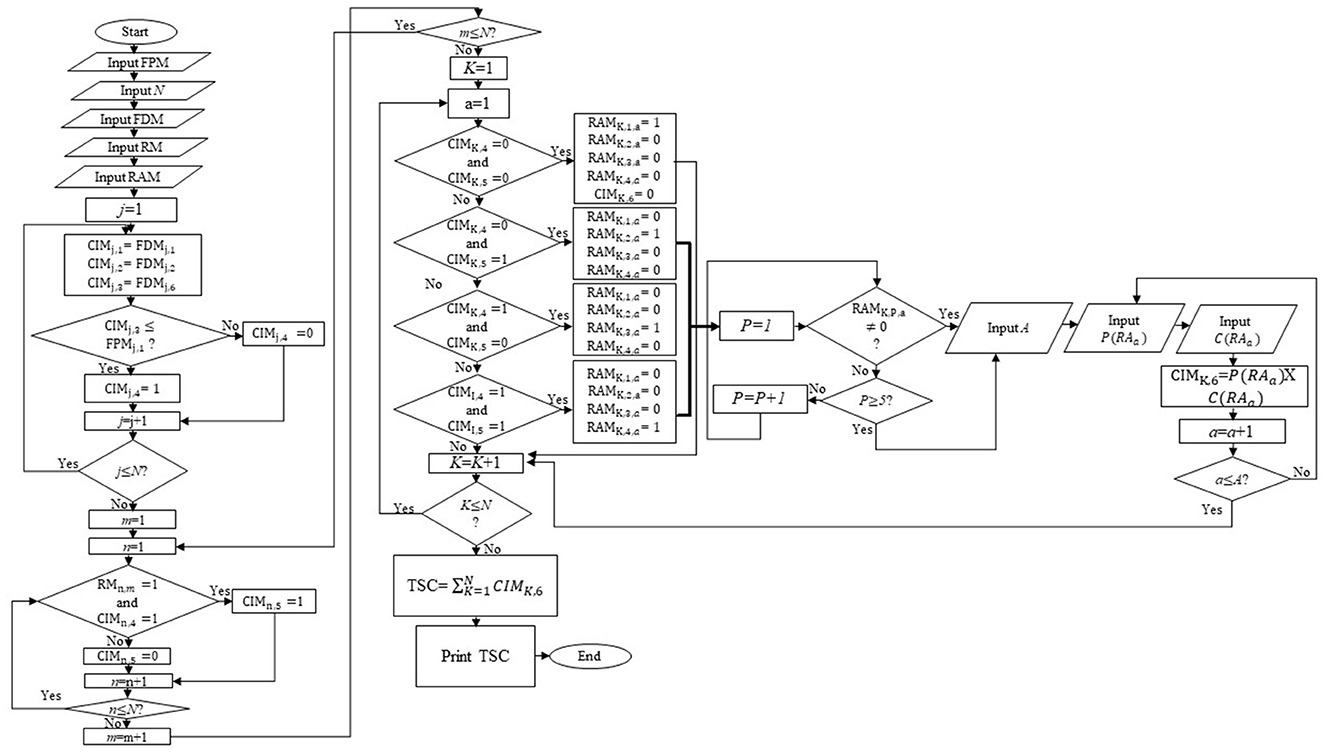
Figure 2. Vulnerability assessment process flow.
The first three columns of CIM (CIMn,1, CIMn,2, CIMn,3) are filled from FDM. The fourth column (CIMn,4) defines FDI for component n (FDIn) using Equation 18. The fifth column (CIMn,5) defines FII for component n (FIIn) using Equation 19. The sixth column (CIMn,6) is filled by total cost (TC) related to the restoration action for component n using Equation 31 where P(I) and TDC(I) are the probability and the cost of inspection, respectively, and P(RAa) and TDC(RAa) are the probability and the cost of the ath restoration action, respectively.
The total cost for the system (TSC) is calculated by mathematical summation of all component repair or replacement costs which are available in column sixth of the CIM (Equation 32).
3.3.2 Vulnerability cost assessment
3.3.2.1 Determination of total manhours for system restoration
In order to calculate the total manhours required for system restoration, the manhour factor data from the construction database is utilized. This involves the quantities of damaged material (C) for each part, and the application of historic manhour factors (MF) to determine the required manhours (D) for system restoration based on labor type (e.g., pipefitter, boilermaker) as shown in Equation 33. This process is repeated for each part within the FDM and summed to determine the total hours required for system restoration for the entire facility.
3.3.2.2 Labor, material, equipment, and overhead costs
The Labor cost (LC) is calculated by multiplying the required D with the labor pay rates (B) for each trade, plus any premium pay from scheduled overtime (Equation 34). On the other hand, the material cost (MC) is determined by identifying the permanent materials (e.g., parts, components) and expendable materials needed for the repairs, including C. Once the requirements are determined, material costs are calculated on a unit basis (CR) plus costs for expendable materials (E; Equation 35). Based on the previously created schedule, an estimate of equipment requirements is performed and equipment cost (EC) is calculated for each type of equipment by the number of equipment required (X) times the company or outside rental rates (R) for the required duration (T; Equation 36). The overhead cost (OC) is estimated based on the schedule using management requirements as the basis. The overall estimated total direct cost (TDC) of the repair or replacement is therefore the sum of LC, MC, EC, and OC (Equation 37).
4 Application example
To facilitate discussion of the proposed methodology, the following pump and motor assembly example are used to demonstrate the methodology (Figure 3). The location for the system under investigation is St. Bernard, Louisiana. The site general elevation is 4 ft (1.2 m) NAVD88. Although this is a simple application example, it effectively demonstrates the methodology and provides valuable insights into the key factors that must be considered when conducting a comprehensive flood vulnerability assessment of industrial facilities.
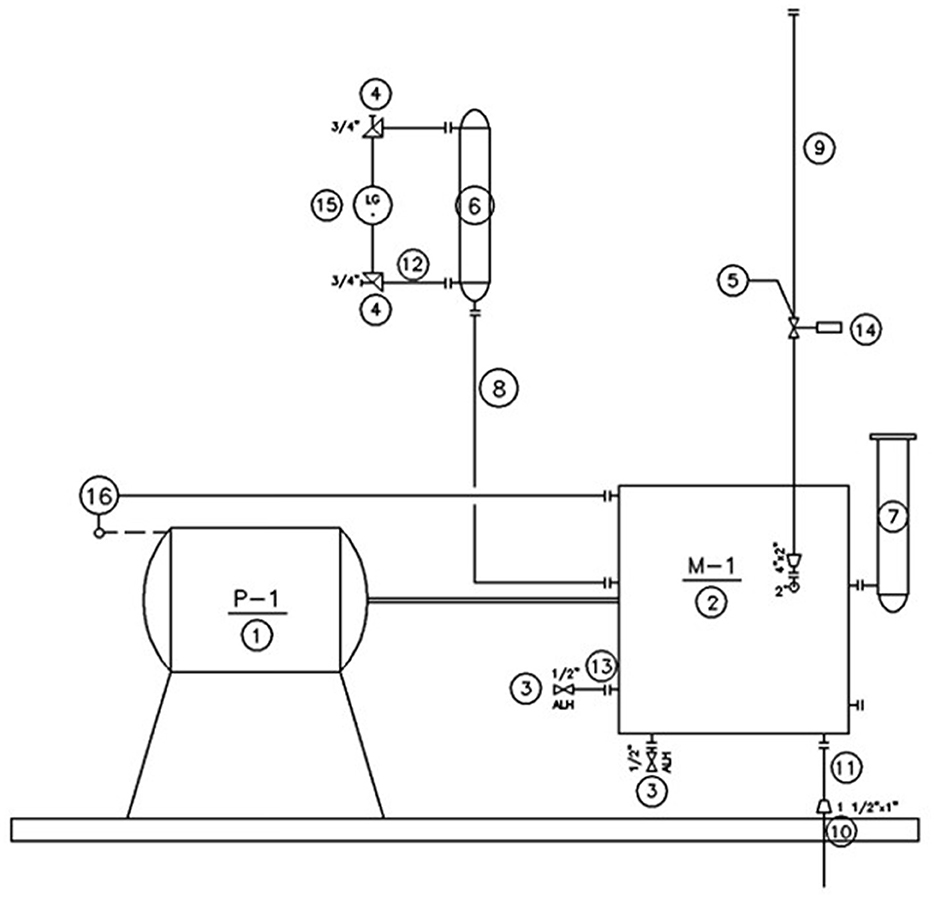
Figure 3. Piping and instrumentation diagrams (P&ID) for a raw product tank and pumps.
4.1 Flood parameters and facility and construction database
4.1.1 Flood parameters
In this example, the analysis focuses solely on the flood elevation and will not consider flood duration and flood type. Flood insurance rate maps (FIRMs) generated by FEMA provide comprehensive information about the flooding characteristics of a particular area. These maps specify the base flood elevation (BFE), which represents the 1% chance of flooding. Additionally, the FIRMs for the site also identify the potential sources of inundation. Based on the FIRM for the study area, the site is located in a leveed area, which protects it from the 100-year flood event. In this example consider a Category 2 event which water height reaches 12.6ft (3.8 m) within the protected zone following an overtopping of the north levee (Flynn, 2016). These flood data are then referenced against the facility database.
4.1.2 Facility database
The subsystem is separated into parts using the P&ID. Characteristics of the parts are ascertained from the drawings, and elevations where damage would initiate are identified from isometric documents (Table 1). This step is obtained directly from industrial sources, similar to the facility and construction databases in Tables 1–5.
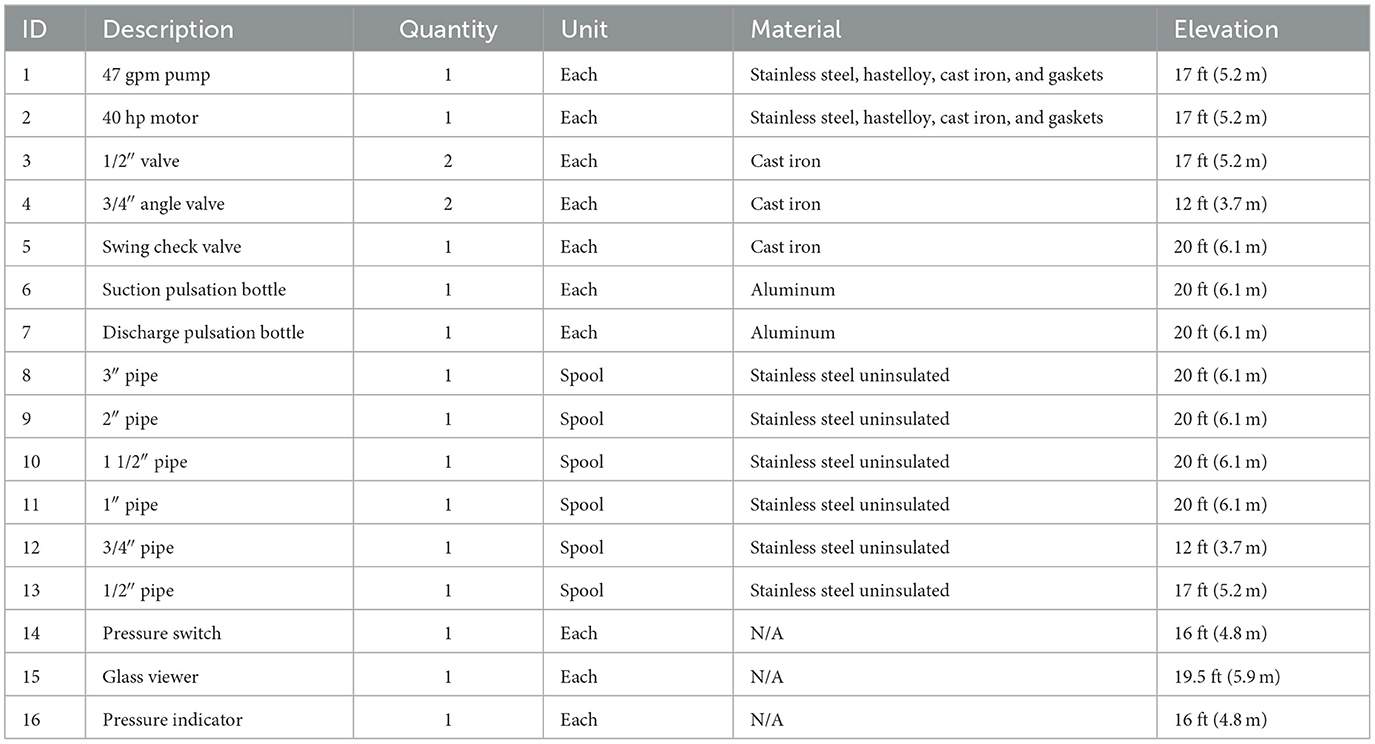
Table 1. Facility database matrix.
Table 2 shows the system interdependencies shown in binary format, reflecting the influence of one part on another part. The pump, component 1, is the critical element to the system in that the failure of the pump translates into the failure of the subsystem in its entirety. Whereas, the motor, component 2, is for the most part isolated, simply existing to drive component 1, component 1 pressurizes the system and facilitates the flow of product throughout the subsystem to the exit points. Foreign material incursion into component 1 is anticipated to occur at the gasketed flanges and seals of the component, thereby contaminating the product, and affecting all downstream members internally. Due to the relatively small size of components 1 and 2, repair requirements exceed the liability posed by simply replacing them following exposure. Valves and piping in the subsystem, components 3–5 and 8–13, even if only subjected to external exposure, require, at a minimum, disassembly, cleaning, inspection, and reassembly with new gasket material. Instrumentation and control components, components 6–7 and 14–16, require complete replacement following any level of inundation.
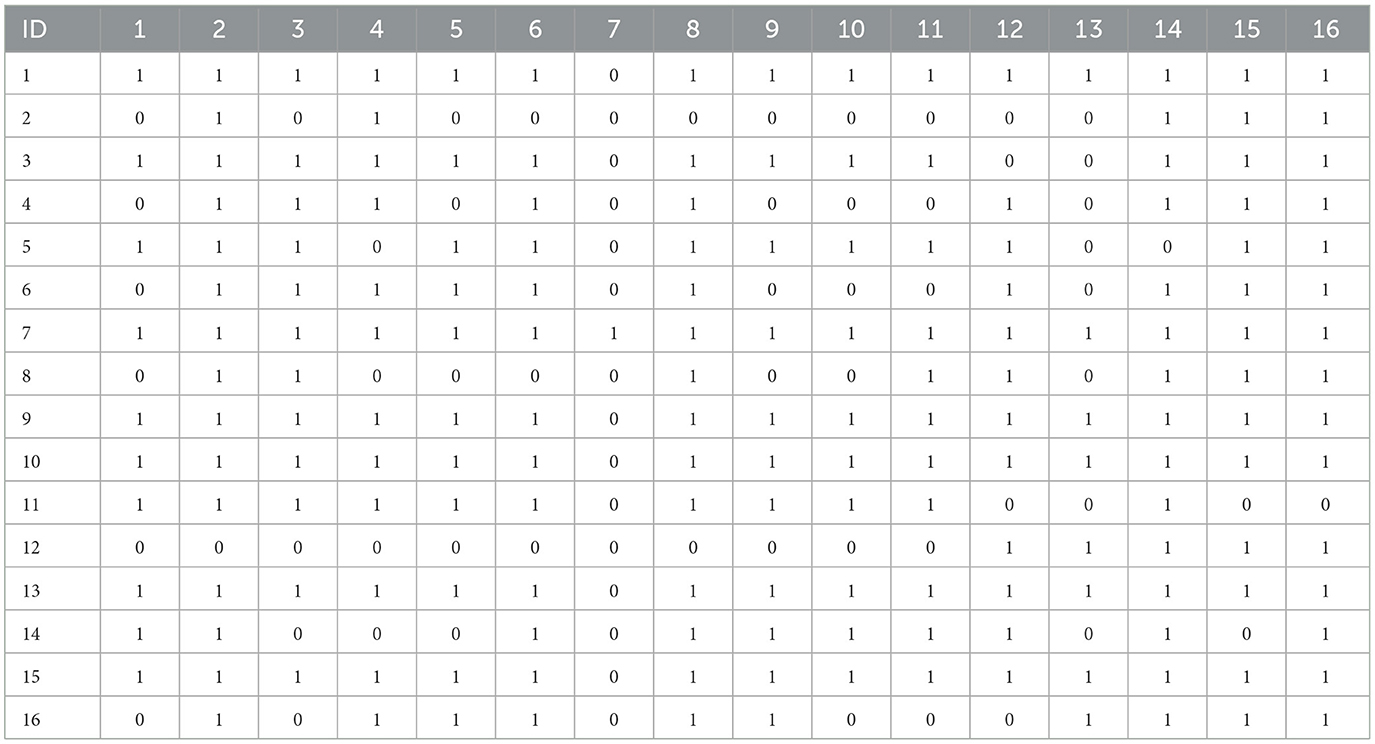
Table 2. Case study interdependencies matrix by part within the facility database.
4.1.3 Construction database
Table 3 presents the labor type, manhour factors and material cost associated with repairing and replacing each part within the subsystem. The repair estimates encompass various activities such as disassembly, correcting consequences resulting from foreign fluids and debris, cleaning, assembly with replacement of necessary materials, and inspection for quality at each phase of the activity. Components with repair values shown as '–' indicate that repair is not feasible, and replacement is necessary. This decision is made from an industrial perspective, taking into account key factors including cost-effectiveness, safety considerations, as well as the age and condition of the components. In such cases, the calculations for repair utilize the replacement manhour factors and material costs. Labor rates for the trades needed to carry out repairs or replacements are provided in Table 4. Additionally, Table 5 provides construction equipment rental rates, which are utilized in estimating equipment costs.
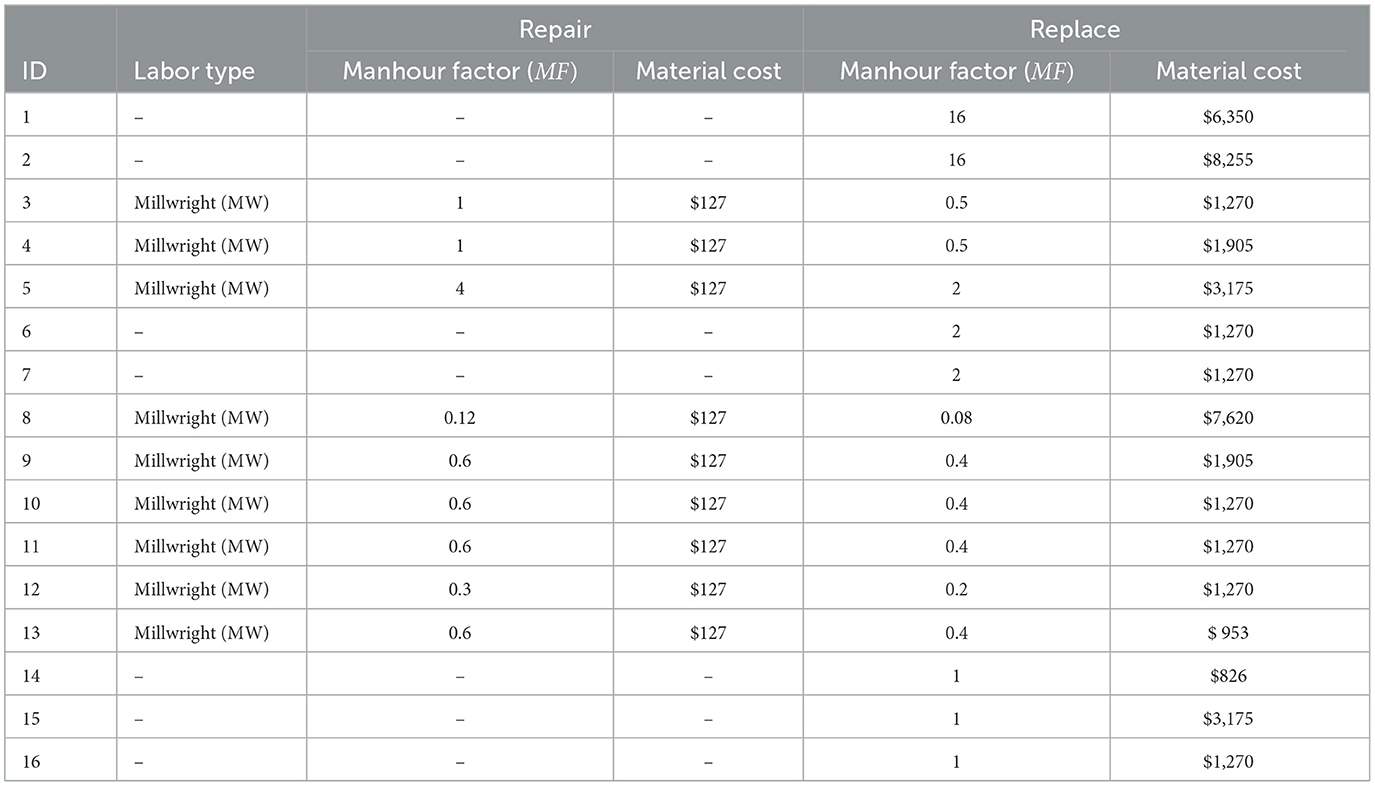
Table 3. Construction database matrix (repair and replacement requirements for each part).
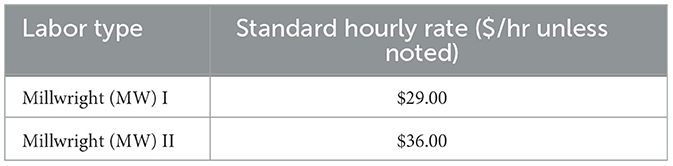
Table 4. Labor rate for indicated labor type within construction database.
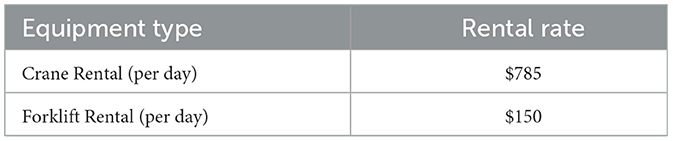
Table 5. Case study equipment rental rates.
4.2 Data processing
4.2.1 Flood impact assessment
Considering the water height reaches 12.6 ft, the FDI (Equation 18) depends on CE and FE. The elevation where damage initiates for components 4 and 12 is below the water surface, indicating component damage has occurred. Therefore, these are the only components that have flood direct impact as shown in Table 6.
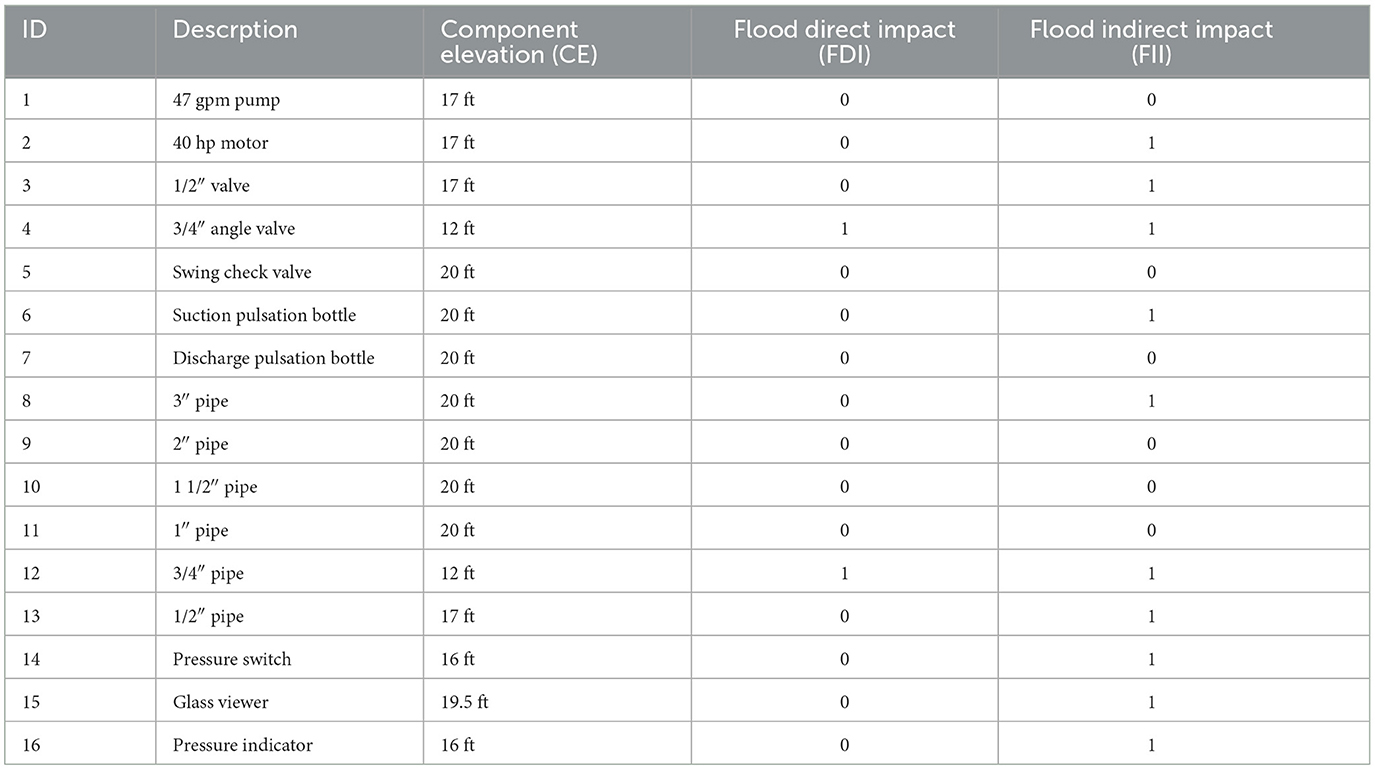
Table 6. Case study flood direct and indirect impact for each component.
RM (Table 2) is used to understand the FII (Equation 19) of these components on other components. Therefore, two components will be inundated, and the consequences of that water intrusion will necessitate maintenance of not only those two components, but also another eight components due to subsystem relationships and position (Table 6).
4.2.2 Restoration action assessment
Table 7 demonstrates the RAM for the case study. The ten components that have at least indirect impact will be assessed against the construction database, in which the minimum repair requirement and a maximum replacement requirement are quantified for understanding. Therefore, to demonstrate the methodology in a simple way and determine the minimum and maximum requirements, two RAM's are constructed, where the probability of repair and replacement are assumed to either equal zero or one for all components, respectively. For simplicity, inspection is ignored for the case study.
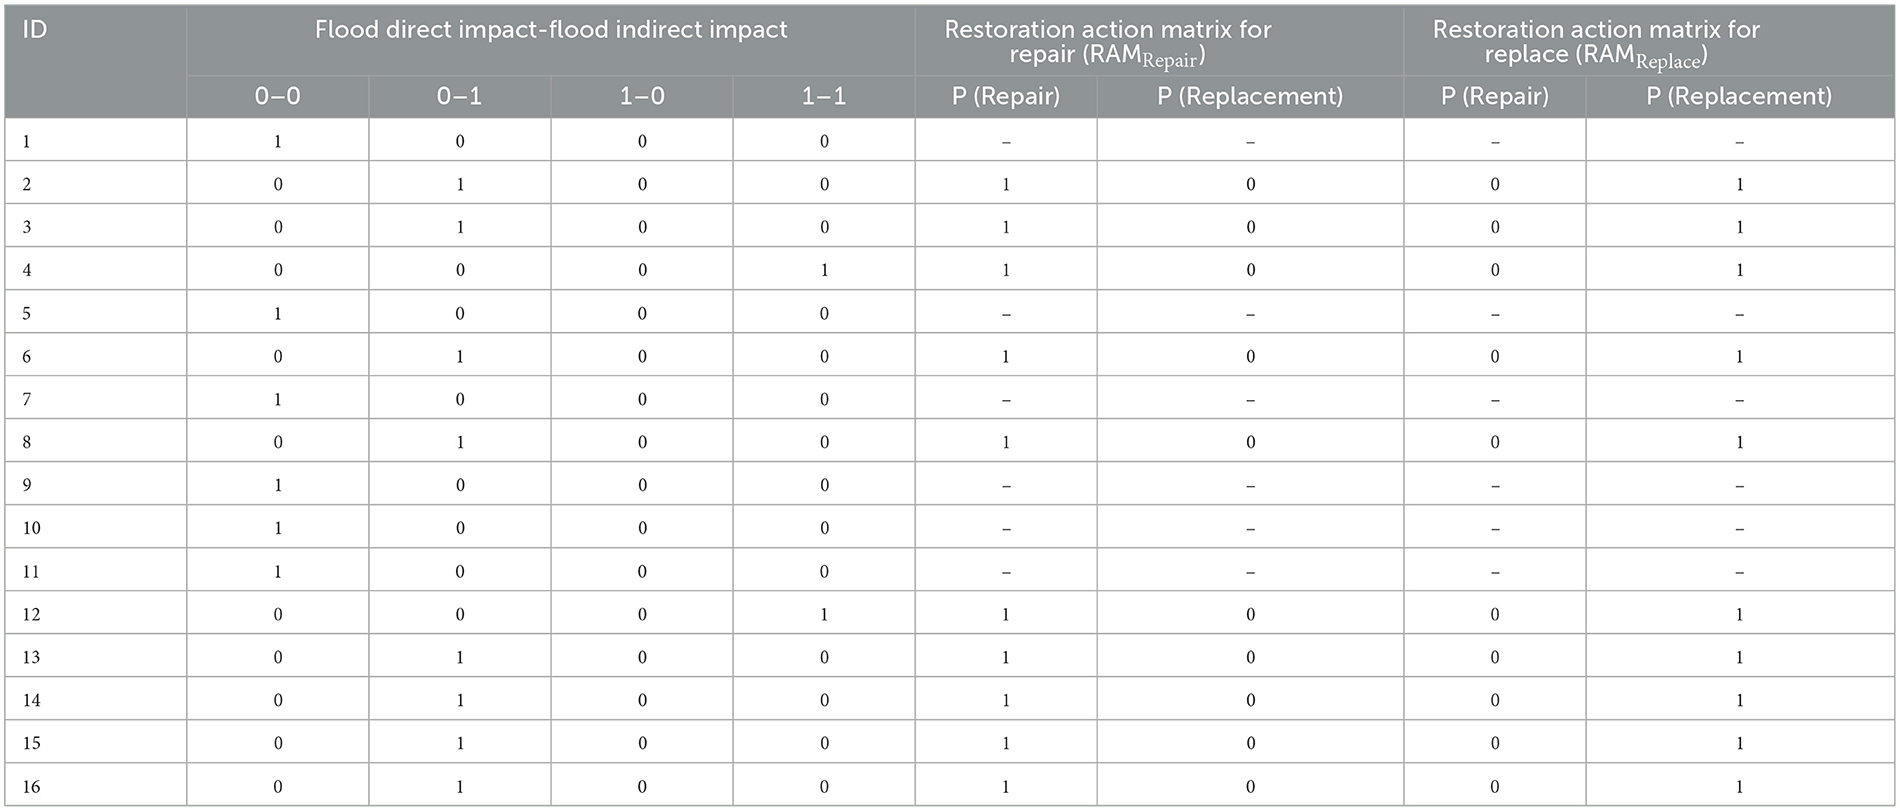
Table 7. Case study restoration action matrix components (RAM).
4.3 Synthetic damage and economic loss modeling
4.3.1 Vulnerability cost assessment
4.3.1.1 Determination of total manhours for system restoration
Table 8 shows the total number of D for each component for each restoration action (repair or replacement) using data from the construction database (Tables 2, 3). The total time needed to repair the identified components is 26.0 h and the time needed for replacement is 23.7 h, which represents the expected shutdown time for the system, as these components are critical for the proper functioning of the system and to guarantee that all actions can be executed with safety protocols.
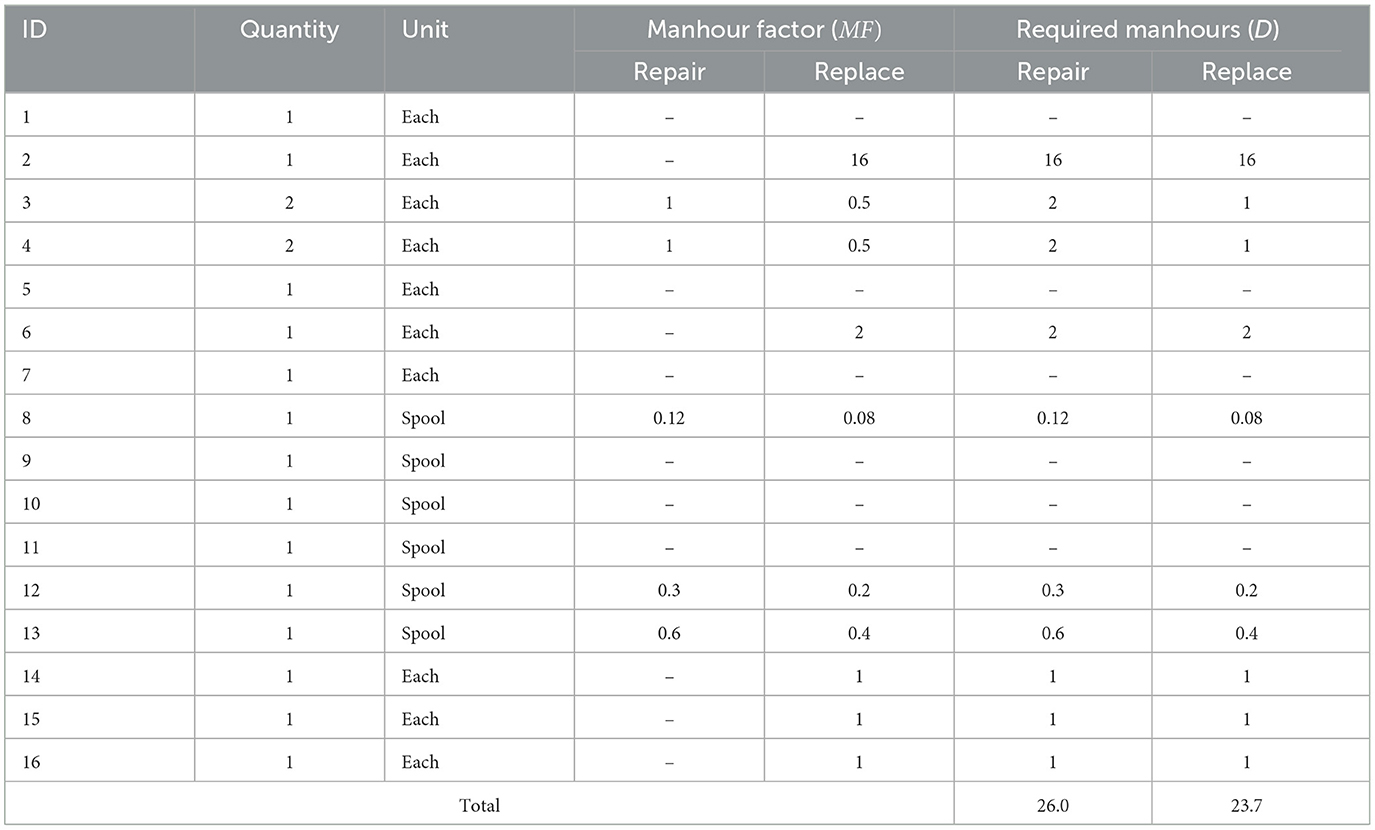
Table 8. Case study manhour required (D) calculations.
4.3.1.2 Labor cost
The LC is calculated considering the requirements for repair and replacement. It is assumed that a two-person team consisting of one MWI and one MWII is employed, with an hourly crew rate of $32.50. Labor burdens are estimated at 14.5% for payroll taxes on all wages, 10% for insurance, and 8% for benefits on straight time wages only. Using these assumptions, the labor cost to repair the damaged components is $1,120 and to replace the damaged components is $1,020 (Table 9).
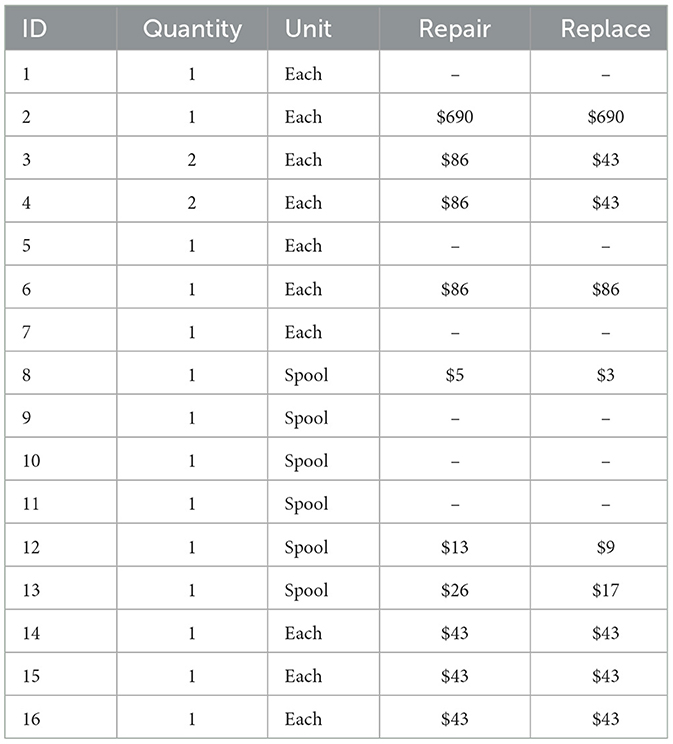
Table 9. Case study labor cost (LC).
4.3.1.3 Material cost
The MC is calculated based on the data in the construction database for this specific case study (Table 3). As previously noted that certain components may become unserviceable after exposure to inundation and would require replacement instead of repair, indicated by '–'. The estimated material costs for repair are $15,685, while the material costs for replacement are estimated as $30,719 (Table 10).
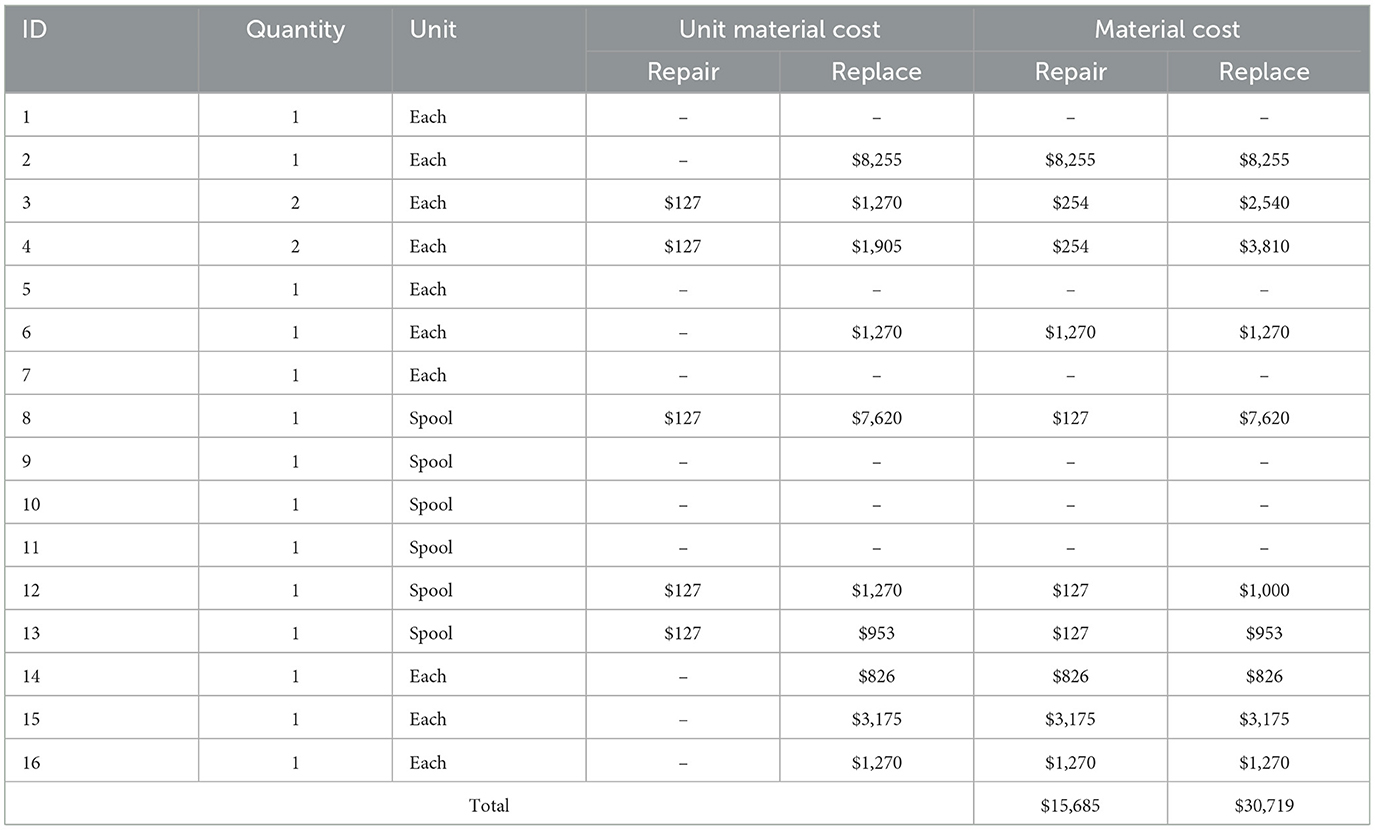
Table 10. Case study material.
4.3.1.4 Equipment cost
The EC is calculated for the entire system, taking into consideration the anticipated need for a crane and forklift throughout the repair or replacement process (Table 11). Rental rates from Table 4 are used to estimate the EC for the duration of these activities, assuming an 8-h rental day. The total EC for this scenario $1,496 (repair) and $1,403 (replace).
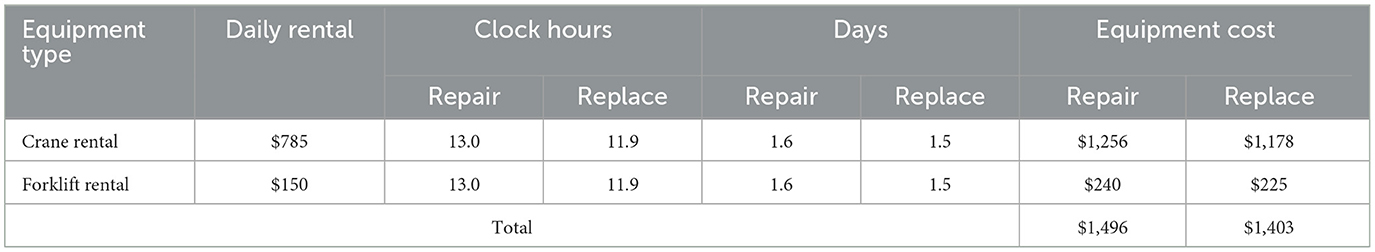
Table 11. Case study equipment cost.
4.3.2 Component information matrix
Because the equipment cost calculations are computed for the whole system, TC for each component includes only the LC and MC (Table 12). The EC is added to the TC for repair and replace cases (Table 13).
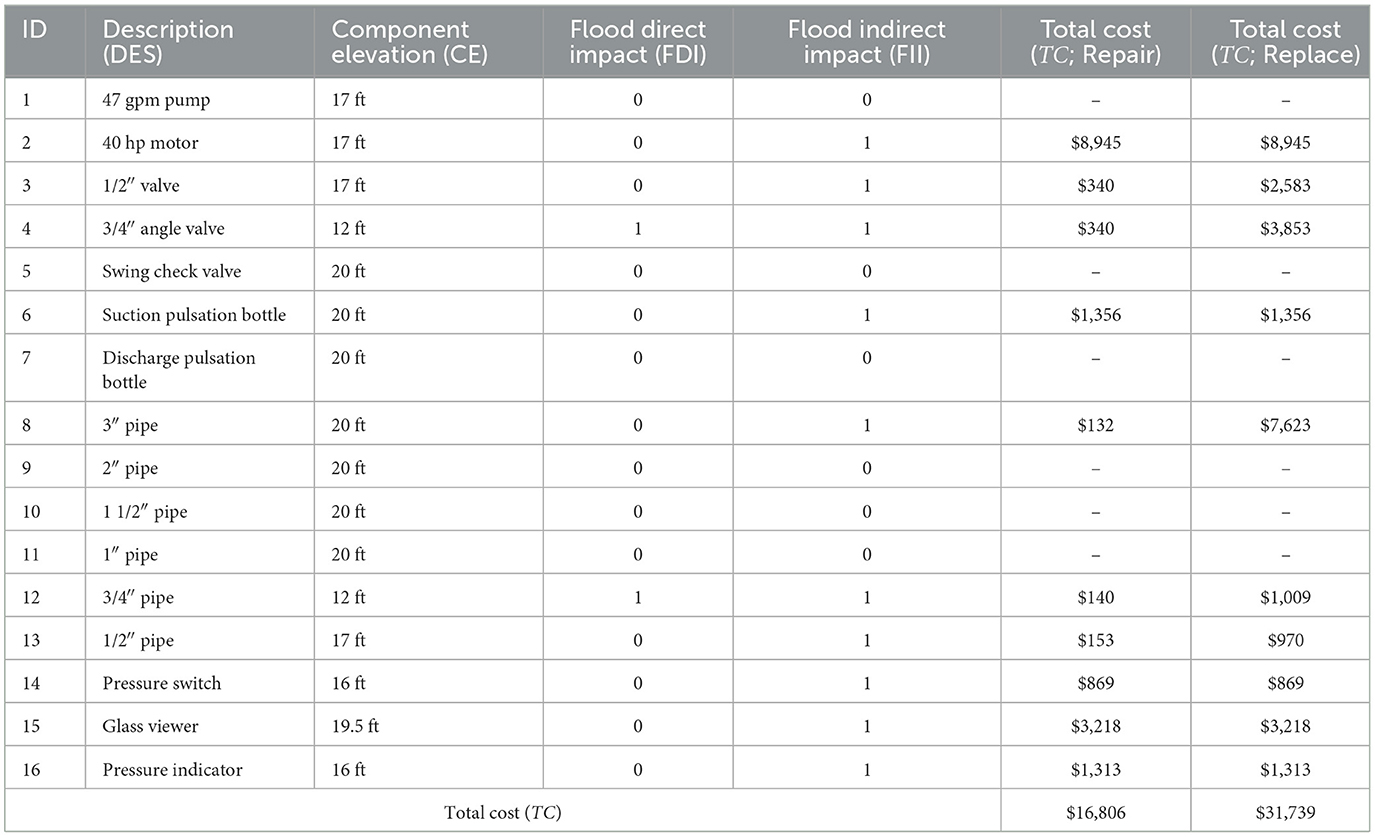
Table 12. Case study component information matrix (CIM).

Table 13. Case study total system cost.
5 Summary and conclusions
Vulnerability assessments for flood hazards within process facilities are necessary to fully understand the potential for loss posed by water intrusion. The existing literature provides insight into how to conduct such a process but falls short of providing a methodology to conduct a quantitative approach to estimate damage from flood hazards. This paper proposes a conceptual methodology, and delineates specific terms and ideas presented to achieve quantitative flood vulnerability assessments beyond the barriers identified by others. The approach outlined in the methodology section leverages data-rich industrial environments, such as detailed plant information management system (PIMS) data, where much of the required information is already available and stored and provides a more detailed and comprehensive analysis of flood vulnerability by examining the vulnerability of individual components of industrial facilities. Rather than focusing on entire industrial areas or complete infrastructure networks, this approach offers a tailored vulnerability assessment model specific to individual facility systems.
In addition, while most other papers consider whether there is damage or not, this paper offers three important contributions. The specific methodological contributions are the consideration of indirect impact when one component is damaged, the evaluation of other's components based on their relationship matrix, and inclusion of the concept of restoration action based on flood elevation, flood type, and flood duration. The application of this framework is demonstrated, from the collection of data to the analysis of the vulnerability matrix composed of the aggregated raw data.
This process paper sets the foundation for a new methodology to estimate the cost of vulnerabilities to specific industrial sites based on actual component and system configurations subjected to flood hazards. The proposed process offers several key benefits: Firstly, it introduces a method for quantifying the consequences of flood hazards at both subsystem and facility system levels. This provides a valuable facility-level methodology that is used in disaster mitigation planning for industrial process facilities. Secondly, the methodology incorporates a flexible database framework that can easily updates whenever facility information (e.g., facility database) or market conditions (e.g., the construction database) evolve. This adaptability ensures the creation of a long-term, customizable VAP solution for individual facilities.
Further development and implementation of the proposed VAP, utilized by multiple facilities within a geographical network, would streamline information on the vulnerabilities exposed by hazardous events. It would also allow for the aggregation of data into a regional vulnerability portfolio, to better understand infrastructure-wide performance, and where public and private mitigation investment would be best allocated. Additionally, indirect costs of unplanned facility shutdowns significantly affect plant owners, commodities, and local economies. Understanding scenario-specific flood consequences is the first step in modeling and mitigating these indirect costs.
6 Limitations and future work
The proposed methodology serves as a conceptual framework for component-based vulnerability assessment, representing a significant first step toward predicting and enhancing vulnerability assessments for flood hazards within process facilities. However, there are some important factors that must be taken into consideration. Firstly, the current input matrices used in the framework may not account for all relevant parameters. Thus, expanding these matrices in the future to include more parameters (e.g., flood velocity) will provide a more comprehensive analysis. Secondly, it is important to consider interaction within the construction database matrix to avoid potential inaccuracies and misinterpretations, and the relationship matrix should be improved to include other interdependent parameters, such as access, control, and co-location. Inclusion of these future enhancements will provide increased accuracy. Finally, it is essential to acknowledge that our study makes certain assumptions regarding the costs associated with renting and the time required for repairs. These assumptions assume a level of consistency between normal operating conditions and flood-affected scenarios. However, it is evident that floods can introduce disruptions. Factors such as the availability of personnel, materials, and transportation infrastructure may be adversely affected, leading to potential cost escalations.
To address these challenges and improve accessibility, particularly given the current reliance on historical data and expert knowledge, future plans involve expanding our approach by incorporating a comprehensive industrial information database. In this refined framework, users will only need to specify simple inputs such as the location and elevation of plant components. This simplification of our methodology aims to make it adaptable and well-suited for more industrial applications.
Data availability statement
The original contributions presented in the study are included in the article/supplementary material, further inquiries can be directed to the corresponding author.
Author contributions
CF: Conceptualization, Formal analysis, Funding acquisition, Methodology, Supervision, Validation, Writing—original draft, Writing—review & editing. FO: Conceptualization, Formal analysis, Methodology, Writing—original draft, Writing—review & editing. AA: Formal analysis, Methodology, Validation, Writing—review & editing. MF: Conceptualization, Methodology, Writing—original draft. RM: Methodology, Writing—review & editing.
Funding
The author(s) declare financial support was received for the research, authorship, and/or publication of this article. The authors gratefully acknowledge funding from the Longwell Family Foundation Fund for Innovation in Engineering Research Fund (FIER) at Louisiana State University. The publication of this article is subsidized by the LSU Libraries Open Access Author Fund.
Conflict of interest
The authors declare that the research was conducted in the absence of any commercial or financial relationships that could be construed as a potential conflict of interest.
Publisher's note
All claims expressed in this article are solely those of the authors and do not necessarily represent those of their affiliated organizations, or those of the publisher, the editors and the reviewers. Any product that may be evaluated in this article, or claim that may be made by its manufacturer, is not guaranteed or endorsed by the publisher.
References
Ahmadisharaf, E., Kalyanapu, A. J., and Chung, E. S. (2015). Evaluating the effects of inundation duration and velocity on selection of flood management alternatives using multi-criteria decision making. Water Res. Manage. 29, 2543–2561. doi: 10.1007/s11269-015-0956-4
Al Assi, A., Mostafiz, R. B., Friedland, C. J., Rahim, M. A., and Rohli, R. V. (2023a). Flood risk assessment for residences at the neighborhood scale by owner/occupant type and first-floor height. Front. Big Data 5, 997447. doi: 10.3389/fdata.2022.997447
Al Assi, A., Mostafiz, R. B., Friedland, C. J., Rohli, R. V., and Rahim, M. A. (2023c). Homeowner flood risk and risk reduction from home elevation between the limits of the 100-and 500-year floodplains. Front. Earth Sci. 11, 1051546. doi: 10.3389/feart.2023.1051546
Al Assi, A., Mostafiz, R. B., Friedland, C. J., Rohli, R. V., Taghinezhad, A., Rahim, M. A., et al. (2023b). Cost-effectiveness of federal CDBG-DR Road Home Program mitigation assistance in Jefferson Parish, Louisiana. Nat Hazards 117, 1291–1319. doi: 10.21203/rs.3.rs-2126597/v1
Aoki, M., Itoi, T., and Sekimura, N. (2017). “Resilience-based framework of engineered systems for continuous safety improvement,” in 12th International Conference on Structural Safety and Reliability, Vienna.
Apel, H., Thieken, A. H., Merz, B., and Blöschl, G. (2006). A probabilistic modelling system for assessing flood risks. Nat. Hazards 38, 79–100. doi: 10.1007/s11069-005-8603-7
Baker, G. H. (2005). A Vulnerability Assessment Methodology for Critical Infrastructure Sites. Paper presented at the Working Together. Boston, MA: R&D Partnerships in Homeland Security.
Bao, C., Li, J., and Wu, D. (2022). Different Types of Risk Matrices and Typical Applications. Risk Matrix. Singapore: Springer, 13–26.
Booysen, H., Viljoen, M., and De Villiers, G. (1999). Methodology for the calculation of industrial flood damage and its application to an industry in Vereeniging. Water SA, 25, 41–46.
Braun, T., Fung, B. C. M., Iqbal, F., and Shah, B. (2018). Security and privacy challenges in smart cities. Sust. Cities Soc. 39, 499–507. doi: 10.1016/j.scs.2018.02.039
Brooks, N. (2003). Vulnerability, Risk and Adaptation: A Conceptual Framework Working Paper. Norwich: Tyndall Centre for Climate Change Research, 1–16.
Changnon, S. D. (2003). Measures of economic impacts of weather extremes. Bullet. Am. Meteorol. Soc. 84, 1231–1235. doi: 10.1175/BAMS-84-9-1231
Dewan, A. (2013). Floods in a Megacity: Geospatial Techniques in Assessing Hazards, risk and Vulnerability, Vol. 6. Dordrecht: Springer, 1–199.
Downton, M. W., and Pielke, R. A. (2005). How accurate are disaster loss data? The case of US flood damage. Nat. Hazards 35, 211–228. doi: 10.1007/s11069-004-4808-4
Dutta, D., Herath, S., and Musiake, K. (2003). A mathematical model for flood loss estimation. J. Hydrol. 277, 24–49. doi: 10.1016/S0022-1694(03)00084-2
Ebad Sichani, M., Anarde, K. A., Capshaw, K. M., Padgett, J. E., Meidl, R. A., Hassanzadeh, P., et al. (2020). Hurricane risk assessment of petroleum infrastructure in a changing climate. Front. Built Environ. 6, 104. doi: 10.3389/fbuil.2020.00104
Entergy (2010). Building a Resilient Energy Gulf Coast: Executive Report. Available online at: https://www.entergy.com/userfiles/content/our_community/environment/GulfCoastAdaptation/Building_a_Resilient_Gulf_Coast.pdf
FEMA (2021). Hazus Inventory Technical Manual. U.S. Department of Homeland Security. Available online at: https://www.fema.gov/sites/default/files/documents/fema_hazus-inventory-technical-manual-4.2.3.pdf (accessed November 9, 2023).
Figueiredo, R., Romão, X., and Paupério, E. (2021). Component-based flood vulnerability modelling for cultural heritage buildings. Int. J. Disaster Risk Reduc. 61, 102323. doi: 10.1016/j.ijdrr.2021.102323
Flynn, M. (2016). Lane “Flood Damage and Shutdown Times for Industrial Process Facilities” (Master's Theses). Louisiana State University, Baton Rouge, LA, United States
Friedland, C. J. (2009). Residential Building Damage From Hurricane Storm Surge: Proposed Methodologies to Describe, Assess and Model Building Damage. (Ph.D. Dissertation). Baton Rouge, LA: Louisiana State University.
Friedland, C. J., Lee, Y. C., Mostafiz, R. B., Lee, J., Mithila, S., Rohli, R. V., et al. (2023). FloodSafeHome: evaluating financial benefits and savings of freeboard for improved decision-making in flood risk mitigation. Front. Commun. 8, 1060901. doi: 10.3389/fcomm.2023.1060901
Girgin, S., Necci, A., and Krausmann, E. (2019). Dealing with cascading multi-hazard risks in national risk assessment: the case of Natech accidents. Int. J. Disaster Risk Reduc. 35, 101072. doi: 10.1016/j.ijdrr.2019.101072
Gnan, E., Friedland, C., Mostafiz, R. B., Rahim, M. A., Gentimis, T., Rohli, R., et al. (2022b). Economically optimizing elevation of new, single-family residences for flood mitigation via life-cycle benefit-cost analysis. Front. Environ. Sci. 10, 889239. doi: 10.3389/fenvs.2022.889239
Gnan, E., Friedland, C. J., Rahim, M. A., Mostafiz, R. B., Rohli, R. V., Orooji, F., et al. (2022a). Improved building-specific flood risk assessment and implications for depth-damage function selection. Front. Water 4, 919726. doi: 10.3389/frwa.2022.919726
Gnan, E., Mostafiz, R. B., Rahim, M. A., Friedland, C. J., Rohli, R. V., Taghinezhad, A., et al. (2022c). Freeboard life-cycle benefit-cost analysis of a rental single-family residence for landlord, tenant, and insurer. Natural Hazards 12, 1–22. doi: 10.5194/nhess-2022-222
Gulzar, S. M., Mir, F. U. H., Rafiqui, M., and Tantray, M. A. (2021). Damage assessment of residential constructions in post-flood scenarios: a case of 2014 Kashmir floods. Environ. Dev. Sust. 23, 4201–4214. doi: 10.1007/s10668-020-00766-2
Harris, J. B., Joyner, T. A., Rohli, R. V., Friedland, C. J., and Tollefson, W. C. (2020). It's all downhill from here: a forecast of subsidence rates in the lower mississippi river industrial corridor. Appl. Geography 114, 102123. doi: 10.1016/j.apgeog.2019.102123
Kates, R. W. (1963). “The synthetic estimation of flood damages: A new approach,” in Paper Presented at the Fifth Conference of Pennsylvania Economists, Pennsylvania, PA.
Kates, R. W. (1968). Industrial Flood Losses: Damage Estimation in the Lehigh Valley. Chicago, IL: University of Chicago.
Klein, R. J. T., Nicholls, R. J., and Thomalla, F. (2003). Resilience to natural hazards: how useful is this concept? Global Environ. Change Environ. Hazards 5, 35–45. doi: 10.1016/j.hazards.2004.02.001
Krzysztofowicz, R., and Davis, D. R. (1983). Category-unit loss functions for flood forecast-response system evaluation. Water Res. Res. 19, 1476–1480. doi: 10.1029/WR019i006p01476
Li, J., Bao, C., and Wu, D. (2018). How to design rating schemes of risk matrices: a sequential updating approach. Risk Anal. 38, 99–117. doi: 10.1111/risa.12810
Li, W., Wen, J., Xu, B., Li, X., and Du, S. (2019). Integrated assessment of economic losses in manufacturing industry in shanghai metropolitan area under an extreme storm flood scenario. Sustainability 11, 10126. doi: 10.3390/su11010126
Méndez-Lázaro, P. A., Bernhardt, Y. M., Calo, W. A., Pacheco Díaz, A. M., García-Camacho, S. I., Rivera-Lugo, M., et al. (2021). Environmental stressors suffered by women with gynecological cancers in the aftermath of hurricanes irma and maría in Puerto Rico. Int. J. Environ. Res. Pub. Health 18, 183. doi: 10.3390/ijerph182111183
Merz, B., Kreibich, H., Schwarze, R., and Thieken, A. (2010). Assessment of economic flood damage. Nat. Hazards Earth Syst. Sci. 10, 1697–1724. doi: 10.5194/nhess-10-1697-2010
Merz, B., Kreibich, H., Thieken, A., and Schmidtke, R. (2004). Estimation uncertainty of direct monetary flood damage to buildings. Nat. Hazards Earth Syst. Sci. 4, 153–163. doi: 10.5194/nhess-4-153-2004
Messner, F., and Meyer, V. (2006). Flood Damage, Vulnerability and Risk Perception–Challenges for Flood Damage Research. Flood Risk Management: Hazards, Vulnerability and Mitigation Measures. Dordrecht: Springer, 149–167.
Miranda, F. N., and Ferreira, T. M. (2019). A simplified approach for flood vulnerability assessment of historic sites. Nat. Hazards 96, 713–730. doi: 10.1007/s11069-018-03565-1
Mohd Fadzer, S., Zahid, Z., da Sheikh Hussin, A. I., and Alam, S. (2017). Flood vulnerability assessment using data envelopment analysis. Discov. Mathematic. 39, 1–7. Available online at: https://myjms.mohe.gov.my/index.php/dismath/article/view/13563
Mostafiz, R. B. (2022). Estimation of Economic Risk from Coastal Natural Hazards in Louisiana [Doctoral Dissertations]. Baton Rouge, LA: Louisiana State University.
Mostafiz, R. B., Assi, A. A., Friedland, C. J., Rohli, R. V., and Rahim, M. A. (2022b). “A numerically-integrated approach for residential flood loss estimation at the community level,” in EGU General Assembly 2022, Vienna, Austria.
Mostafiz, R. B., Bushra, N., Rohli, R. V., Friedland, C. J., and Rahim, M. A. (2021b). Present vs. future property losses from a 100-year coastal flood: a case study of Grand Isle, Louisiana. Front. Water 3, 763358. doi: 10.3389/frwa.2021.763358
Mostafiz, R. B., Friedland, C. J., Rahman, M. A., Rohli, R. V., Tate, E., Bushra, N., et al. (2021a). Comparison of neighborhood-scale, residential property flood-loss assessment methodologies. Front. Environ. Sci. 9, 734294. doi: 10.3389/fenvs.2021.734294
Mostafiz, R. B., Rohli, R. V., Friedland, C. J., and Lee, Y. C. (2022a). Actionable information in flood risk communications and the potential for new web-based tools for long-term planning for individuals and community. Front. Earth Sci. 10, 840250. doi: 10.3389/feart.2022.840250
Needham, H., Brown, D., and Carter, L. (2012). Impacts and Adaptation Options in the Gulf Coast. Prepared for C2ES Impacts and Adaptation Options in the Gulf Coast iii. Available online at: https://www.c2es.org/wp-content/uploads/2012/05/gulf-coast-impacts-adaptation.pdf
Ngo, H., Ranasinghe, R., Zevenbergen, C., Kirezci, E., Maheng, D., Radhakrishnan, M., et al. (2022). An efficient modeling approach for probabilistic assessments of present-day and future fluvial flooding. Front. Climate 4, 798618. doi: 10.3389/fclim.2022.798618
Pathak, S. D., Kulshrestha, M., and Kulshreshtha, M. (2021). Flood vulnerability assessment using data envelopment analysis – the case of Narmada river basin districts in central India. Water Policy 23, 1089–1106. doi: 10.2166/wp.2021.063
Peace, C. (2017). The risk matrix: Uncertain results?. Policy Prac. Health Safety 15, 131–144. doi: 10.1080/14773996.2017.1348571
Penning-Rowsell, E. C., and Chatterton, J. B. (1977). The Benefits of Flood Alleviation: A Manual of Assessment Techniques. Farnborough: Saxon House Farnborough.
Penning-Rowsell, E. C., Johnson, C., Tunstall, S. M., Tapsell, S. M., Morris, J., Chatterton, J. B., et al. (2003). The Benefits of Flood and Coastal Defence: Techniques and Data for 2003. London: Middlesex University Flood Hazard Research Centre.
Peterson, J., Haney, M., and Borrelli, R. A. (2019). An overview of methodologies for cybersecurity vulnerability assessments conducted in nuclear power plants. Nuclear Eng. Design 346, 75–84. doi: 10.1016/j.nucengdes.2019.02.025
Pine, J. C. (2006). Hurricane Katrina and oil spills: Impact on coastal and ocean environments. Oceanography 19, 37–39. doi: 10.5670/oceanog.2006.61
Pistrika, A., and Tsakiris, G. (2007). Flood Risk Assessment: A Methodological Framework. Paper Presented at the Water Resources Management: New Approaches and Technologies, Chania, Crete, Greece.
Quinn, N., Bates, P. D., Neal, J., Smith, A., Wing, O., Sampson, C., et al. (2019). The spatial dependence of flood hazard and risk in the United States. Water Resour. Res. 55, 1890–1911. doi: 10.1029/2018WR024205
Rahim, M. A., Freidland, C., Rohli, R., Bushra, N., and Mostafiz, R. B. (2021). “A data-intensive approach to allocating owner vs. NFIP portion of average annual flood losses,” in American Geophysical Union Fall Meeting 2021, New Orleans, LA.
Rahim, M. A., Gnan, E. S., Friedland, C. J., Mostafiz, R. B., and Rohli, R. V. (2022). “An improved micro scale average annual flood loss implementation approach,” EGU General Assembly 2022. Vienna, Austria.
Rehak, D., and Hromada, M. (2018). Failures in a Critical Infrastructure System. System of System Failures. InTech: Chantilly, VA.
Rinaldi, S. M., Peerenboom, J. P., and Kelly, T. K. (2001). Identifying, understanding, and analyzing critical infrastructure interdependencies. Control Syst. IEEE 21, 11–25. doi: 10.1109/37.969131
Rose, A., Porter, K., Dash, N., Bouabid, J., Huyck, C., Whitehead, J., et al. (2007). Benefit-cost analysis of FEMA hazard mitigation grants. Nat. Hazards Rev. 8, 97–111. doi: 10.1061/(ASCE)1527-6988(2007)8:4(97)
Ryu, J. E., Lee, D. K., Park, C., Ahn, Y., Lee, S., Choi, K., et al. (2016). Assessment of the vulnerability of industrial parks to flood in South Korea. Nat. Hazards 82, 811–825. doi: 10.1007/s11069-016-2222-3
Sangrey, D. A., Murphy, P. J., and Nieber, J. L. (1975). Evaluating the Impact of Structurally Interrupted Flood Plain Flows. Ithaca, NY: Cornell University Water Resources and Marine Sciences Center
Scawthorn, C., Flores, P., Blais, N., Seligson, H., Tate, E., Chang, S., et al. (2006). HAZUS-MH flood loss estimation methodology. II damage and loss assessment. Nat. Hazards Rev. 7, 72–81. doi: 10.1061/(ASCE)1527-6988(2006)7:2(72)
Schoppa, L., Sieg, T., Vogel, K., Zöller, G., and Kreibich, H. (2020). Probabilistic flood loss models for companies. Water Resour. Res. 56, 649. doi: 10.1029/2020WR027649
Seifert, I., Kreibich, H., Merz, B., and Thieken, A. H. (2010). Application and validation of FLEMOcs–a flood-loss estimation model for the commercial sector. Hydrol. Sci. J. 55, 1315–1324. doi: 10.1080/02626667.2010.536440
Stout, S. A., Liu, B., Millner, G. C., Hamlin, D., and Healey, E. (2007). Use of chemical fingerprinting to establish the presence of spilled crude oil in a residential area following Hurricane Katrina, St. Bernard Parish, Louisiana. Environ. Sci. Technol. 41, 7242–7251. doi: 10.1021/es070909i
Su, M. D., Kang, J. L., Chang, L. F., and Chen, A. S. (2005). A grid-based GIS approach to regional flood damage assessment. J. Marine Sci. Technol. 13, 184–192. doi: 10.51400/2709-6998.2125
Sultana, Z., Sieg, T., Kellermann, P., Müller, M., and Kreibich, H. (2018). Assessment of business interruption of flood-affected companies using random forests. Water 10, 149. doi: 10.3390/w10081049
Sun, W., Bocchini, P., and Davison, B. D. (2020). Policy-based disaster recovery planning model for interdependent infrastructure systems under uncertainty. Struct. Infr. Eng. 17, 555–578. doi: 10.1080/15732479.2020.1843504
Tansel, B., and Zhang, K. (2022). Effects of saltwater intrusion and sea level rise on aging and corrosion rates of iron pipes in water distribution and wastewater collection systems in coastal areas. J. Environ. Manage. 315, 115153. doi: 10.1016/j.jenvman.2022.115153
Turner, B. L., Kasperson, R. E., Matson, P. A., McCarthy, J. J., Corell, R. W., Christensen, L., et al. (2003). A framework for vulnerability analysis in sustainability science. Proc. Nat. Acad. Sci. 100, 8074–8079. doi: 10.1073/pnas.1231335100
USACE (2006). Depth-Damage Relationships for Structures, Contents, and Vehicles and Content-to-Structure Value Ratios (CSVR) in Support of the Donaldsonville to the Gulf, Louisiana, Feasibility Study. Washington, DC: United States Army Corps of Engineers.
Van der Sande, C., De Jong, D., and De Roo, S. A. (2003). A segmentation and classification approach of IKONOS-2 imagery for land cover mapping to assist flood risk and flood damage assessment. Int. J. Appl. Earth Obs. Geoinf. 4, 217–229. doi: 10.1016/S0303-2434(03)00003-5
Van Veelen, P. C., Stone, K., and Jeuken, A. (2018). Planning Resilient Urban Waterfronts Using Adaptive Pathways. ICE Themes Flood Resilience. London: ICE Publishing, 3–15.
Wing, O. E., Lehman, W., Bates, P. D., Sampson, C. C., Quinn, N., Smith, A. M., et al. (2022). Inequitable patterns of US flood risk in the Anthropocene. Nat. Clim. Change 12, 156–162. doi: 10.1038/s41558-021-01265-6
Keywords: industrial facilities, flood damage, vulnerability assessment process (VAP), component-level assessment, Facility Data Matrix (FDM)
Citation: Friedland CJ, Orooji F, Al Assi A, Flynn ML and Mostafiz RB (2023) Flood damage and shutdown times for industrial process facilities: a vulnerability assessment process framework. Front. Water 5:1292564. doi: 10.3389/frwa.2023.1292564
Received: 11 September 2023; Accepted: 03 November 2023;
Published: 29 November 2023.
Edited by:
Daniel Eisenberg, Naval Postgraduate School, United StatesReviewed by:
Chiara Arrighi, University of Florence, ItalyAshraf Dewan, Curtin University, Australia
Copyright © 2023 Friedland, Orooji, Al Assi, Flynn and Mostafiz. This is an open-access article distributed under the terms of the Creative Commons Attribution License (CC BY). The use, distribution or reproduction in other forums is permitted, provided the original author(s) and the copyright owner(s) are credited and that the original publication in this journal is cited, in accordance with accepted academic practice. No use, distribution or reproduction is permitted which does not comply with these terms.
*Correspondence: Ayat Al Assi, YWFsYXNzMUBsc3UuZWR1