 Luana Lavagnoli Moreira1
 Franciele Maria Vanelli2
 Dimaghi Schwamback3,4
 Masato Kobiyama2
 Mariana Madruga de Brito5*
- 1Division of Environmental Engineering, Federal Institute of Education Science and Technology of Espírito Santo, Ibatiba, Brazil
- 2Institute of Hydraulic Research, Federal University of Rio Grande Do Sul, Porto Alegre, Brazil
- 3Division of Water Resources Engineering, Lund University, Lund, Sweden
- 4Department of Hydraulic Engineering and Sanitary, São Carlos School of Engineering, University of São Paulo, São Carlos, Brazil
- 5Department of Urban and Environmental Sociology, Helmholtz-Zentrum für Umweltforschung, Leipzig, Germany
The assessment of flood vulnerability is a complex task that involves numerous uncertainties. Within this context, sensitivity analyses are crucial to better understand the variability of vulnerability index outcomes according to different input parameters. The present study sheds light on the importance of assessing the sensitivity of different criteria weights to construct flood vulnerability indexes using the Maquiné basin (Brazil) as a case study. Specifically, we compared vulnerability scores based on weights derived from a participatory survey with 44 stakeholders to those based on an equal weighting scheme. Results helped us identify areas with low and high uncertainty and the variables contributing to this. Overall, the preference for indicator weights did not vary significantly among stakeholders with distinct socioeconomic characteristics. Furthermore, the choice of weights only had an impact on the spatial distribution of flood vulnerability in certain regions. Compared to equal weights, the flood vulnerability outcomes obtained by averaging the stakeholder scenarios were similar, indicating that the results were robust and not highly sensitive to the choice of weights. By adopting a participatory approach, we were able to consider multiple stakeholders' views, which helped to provide a more comprehensive perspective of flood vulnerability and potentially increased the acceptance of the results. Based on our findings, end-users can better understand the relative importance of each indicator and how they contribute to vulnerability. Furthermore, our results can help identify points where stakeholders disagree, which can be used to facilitate dialogue and consensus building. The methodology applied is straightforward and could be easily adapted to other multi-criteria decision-making problems.
1. Introduction
Together with hazard and exposure, vulnerability is one of the components of risk and accounts for the susceptibility of the assets exposed to the damaging effects of a hazard (Moreira et al., 2021a,b). Vulnerability assessments are essential to understand the conditions which increase or decrease the likelihood that exposed elements will be affected by floods (Birkmann et al., 2013). These assessments can deepen our knowledge of flood risk and provide a starting point for determining effective measures to reduce flood impacts (Kelly and Adger, 2000; Nasiri et al., 2016; Moreira et al., 2021a). They are also fundamental for planning and responding to flood disasters (Nigusse and Adhanom, 2019).
Among the methods used to analyze flood vulnerability, index-based approaches are the most popular because they enable a holistic evaluation of the vulnerability by considering its different dimensions (Balica et al., 2013; Birkmann et al., 2013; Nasiri et al., 2016). Indexes are considered particularly helpful as they allow the combination of different data types at different scales. However, each step of the index construction procedure introduces uncertainty as researchers face several choices between plausible alternatives (Tate, 2012; Nasiri et al., 2016). Indeed, steps such as the selection of indicators and their normalization, aggregation, weighting and classification greatly influence index outcomes (Moreira et al., 2021a). Among these steps, weighting is deemed as the main contributor to uncertainty (Chen et al., 2013; Rogelis et al., 2016; Becker et al., 2017; de Brito et al., 2019). Even minor adjustments in indicators' weights may impact index results, leading to the over-or underestimation of flood vulnerability and consequent inaccurate outcomes (Feizizadeh and Blaschke, 2017). Hence, the weighting step can significantly determine the accuracy and validity of flood vulnerability maps (Membele et al., 2022).
Although each of the indicators that compose an index contributes differently toward flood vulnerability, most indexes use an equal weighting scheme, i.e., all indicators are given the same weight (Fekete, 2012). According to Tate (2012), researchers often use equal weights as a default option, given the lack of understanding of the relationship among indicators. As such, it is easier to imply that all indicators are “worth” the same (Wang et al., 2009; Oulahen et al., 2015). Despite the growing interest in vulnerability assessments (Moreira et al., 2021b), meta-analytical syntheses of the variables contributing to vulnerability are largely missing, and the existing studies are inconclusive (Bamberg et al., 2020). Hence, there are no established guidelines for determining which indicators should be considered and how important they are for assessing vulnerability. Previous research by de Brito and Evers (2016) has demonstrated that, in most cases, researchers conducting the study define the weights without clearly explaining the assumptions used. This reduces the transparency and hampers the study's replicability as indicator weights vary depending on each person's opinion and experience (de Brito et al., 2017).
Overall, the attribution of indicators' weights can be done by following: (i) equal weighting approach, where all indicators are given the same weight (Hernández-Uribe et al., 2017); (ii) statistical approach, where weights are defined using methods such as Principal component analysis (PCA) (Gu et al., 2018); (iii) multi-criteria decision-making (MCDM)—using tools such as the analytical hierarch process (Evers et al., 2018; Roy et al., 2021a,b) and (iv) participatory approach—by soliciting expert (Shah et al., 2018) or public opinion (Schuster-Wallace et al., 2018).
In order to address the subjectivity in determining indicator weighs and minimize the narrow and siloed view on flood vulnerability, participatory approaches that rely on stakeholders' knowledge have been widely employed in recent years (de Brito et al., 2019; Kanani-Sadat et al., 2019; Ekmekcioglu et al., 2022). They support exploring complexity and uncertainties by creating multiple scenarios according to their different opinions (Kowalski et al., 2009). The hypothesis is that fewer biases will occur if practitioners or affected citizens are involved in creating an index that they find useful (Herk et al., 2011). Furthermore, they are likely to incorporate the index outcomes into policy decisions (Oulahen et al., 2015). However, stakeholders' participation does not necessarily eliminate the subjectivity inherent in the weighting of indicators (Chen et al., 2013; de Brito et al., 2019), as the entire process is still based on personal opinions.
Hence, to better understand the uncertainties involved in indexes built using participatory approaches and ascertain their robustness, sensitivity analyses applied to the weighting of indicators are crucial (Abebe et al., 2018; Membele et al., 2022). Sensitivity analysis is defined here as a local measure of the effect of a given input on a given output (Shi and Land, 2021). While some researchers have addressed uncertainty and sensitivity analyses in the context of flood vulnerability assessment (e.g., Feizizadeh and Blaschke, 2017; de Brito et al., 2019), the use of spatial sensitivity analysis in combination with participatory approaches remains an open research topic. We believe such an approach is suitable for tackling challenges related to assessing complex concepts such as flood vulnerability, where experts have no consensus on the choice of weights.
The aim of this study is, thus, to evaluate the sensitivity of flood vulnerability indexes by considering different weighting schemes derived from a participatory approach. In doing so, we address the following questions: (i) Which indicators are more relevant for assessing flood vulnerability in the study area, according to stakeholders? (ii) Are there any differences or similarities in the weights assigned by different stakeholders? (iii) Does the choice of weights by different stakeholders significantly affect the spatial outputs of flood vulnerability assessment? (iv) Are there significant changes in spatial outputs of flood vulnerability when using equal weights or attributing relative importance to indicators through a participatory approach? To explore these questions, we use the Maquiné river basin in southern Brazil as a case study.
2. Material and methods
This study followed several steps, as depicted in Figure 1. In the first step, we selected and normalized social, physical, and economic indicators contributing to flood vulnerability. Next, we conducted a participatory survey with 44 stakeholders to attribute weights to each indicator. The data were then aggregated for sensitivity analysis and later classified into different vulnerability classes to construct the vulnerability maps. The following subsections provide further details of the experimental setup and methodological steps considered.
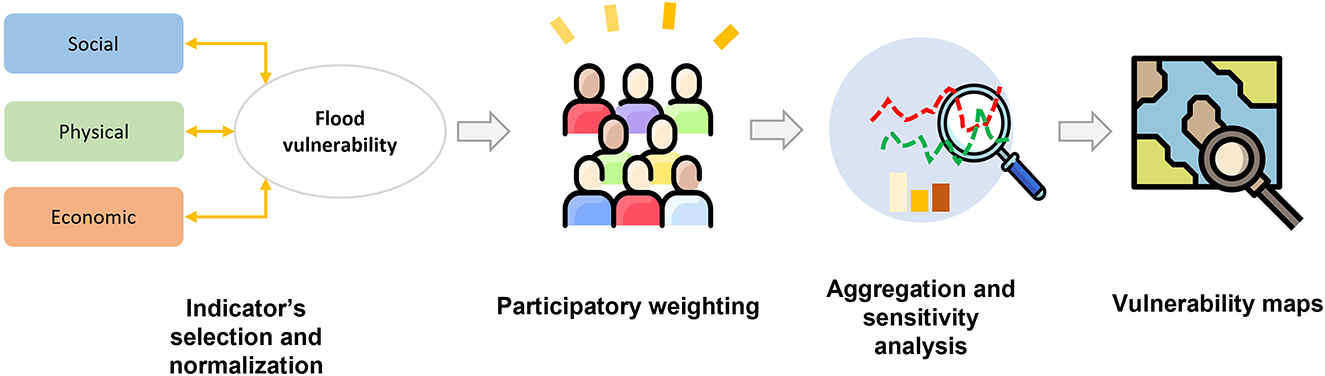
Figure 1. Methodological approach adopted in this study.
2.1. Study area
This study was carried out in the Maquiné river basin (510 km2), located in Rio Grande do Sul state in southern Brazil (Figure 2). The area presents a typical mountain landscape with altitudes ranging from 1 to 975 m. According to the Köppen-Geiger classification system, the climate is mostly humid subtropical (Cfa) (Peel et al., 2007), with a mean annual rainfall between 1.700 and 2.109 mm. The basin land is covered mainly by forests (78.3%), followed by crops (11.7%), bare soil (5.5%), reforestation areas (3.0%), water (0.9%), and urban areas (0.7%). Floods occur annually in the region, affecting houses and displacing people. For example, a severe flood occurred in May 2008, increasing the river flow from its typical 15.2–568 m3/s (de Castro et al., 2013). About 70% of the 6,024 residents of Maquiné's river basin live in rural areas (IBGE, 2010). The basin is divided into twenty census blocks (CB), which correspond to Brazil's smallest territorial administrative unit. The CBs 8 and 9 were removed from our analyses since these areas are uninhabited (Figure 2).
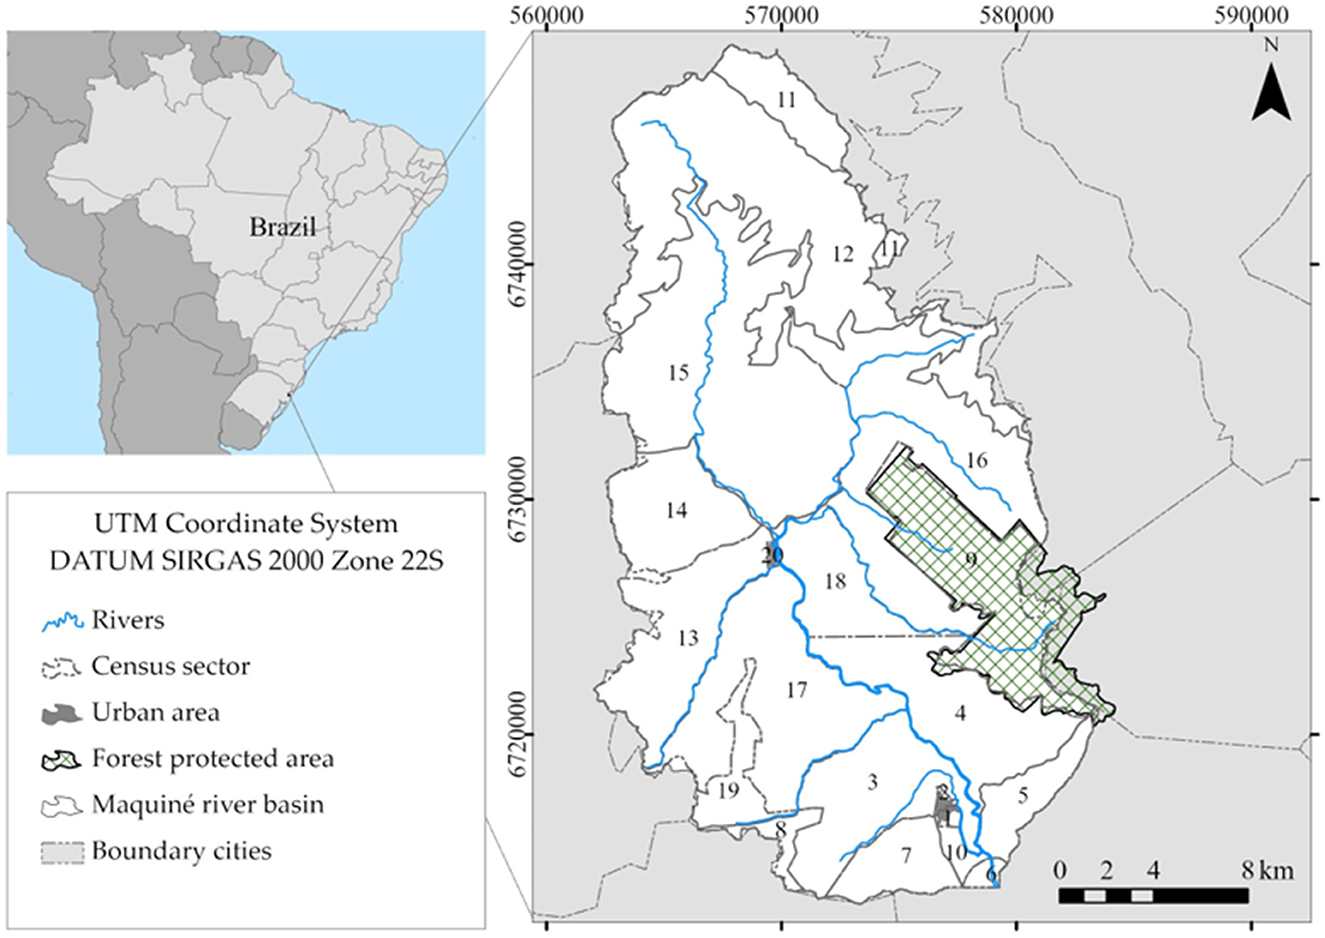
Figure 2. Location of Maquiné river basin and the 20 census blocks (CB) it encompasses. The urban area is located in CB 1.
2.2. Selection and normalization of vulnerability indicators
To assess the flood vulnerability in the Maquiné river basin, we selected 13 indicators (Figure 3). This selection was based on: (i) the indicators' relevance evidenced by a systematic literature review (Moreira et al., 2021b), (ii) the availability of spatial data in the study area, and (iii) the indicators' suitability to the case study context. A detailed description of the reasoning for indicator selection was provided in a previous paper by the authors (Moreira et al., 2021a).
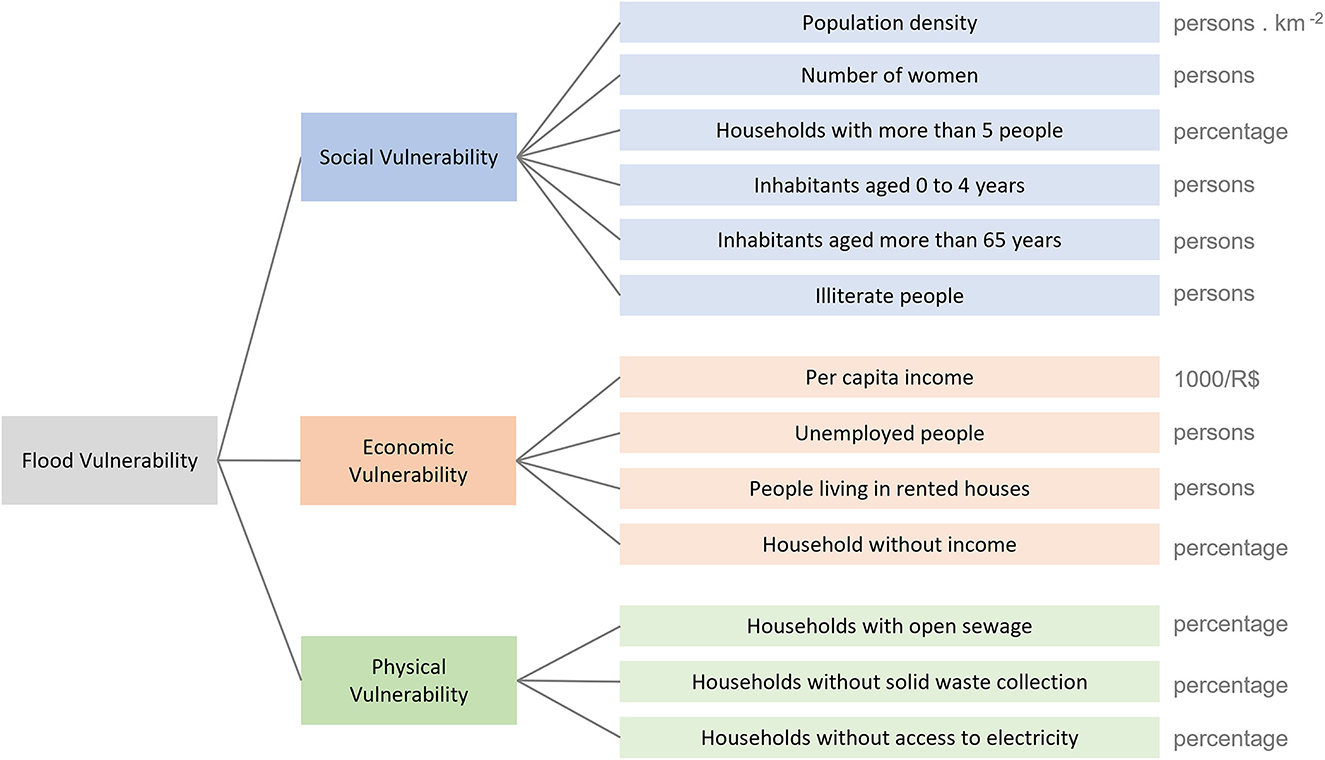
Figure 3. Input flood vulnerability indicators organized hierarchically. The units used to measure each indicator are indicated in gray.
The selected indicators were grouped into social, economic, and physical vulnerability categories. The data used to represent them were obtained from the Brazilian 2010 Census (IBGE, 2010) and were normalized by using the min-max method (Equation 1). This normalization method was chosen once it easily communicates the numerical information by rescaling values between 0 (worst rank) and 1 (best rank), being the most used method in vulnerability studies (Moreira et al., 2021a). Since the “per capita income” indicator reduces the vulnerability, it was normalized inversely. This was done by multiplying the “per capita income” indicator by minus one and then adding their minimum value. As a result, we obtained a dataset where high values indicate a high vulnerability, and low values correspond to a low vulnerability (Figure 4).
where yin is the normalized indicator; and xin is the indicator value.
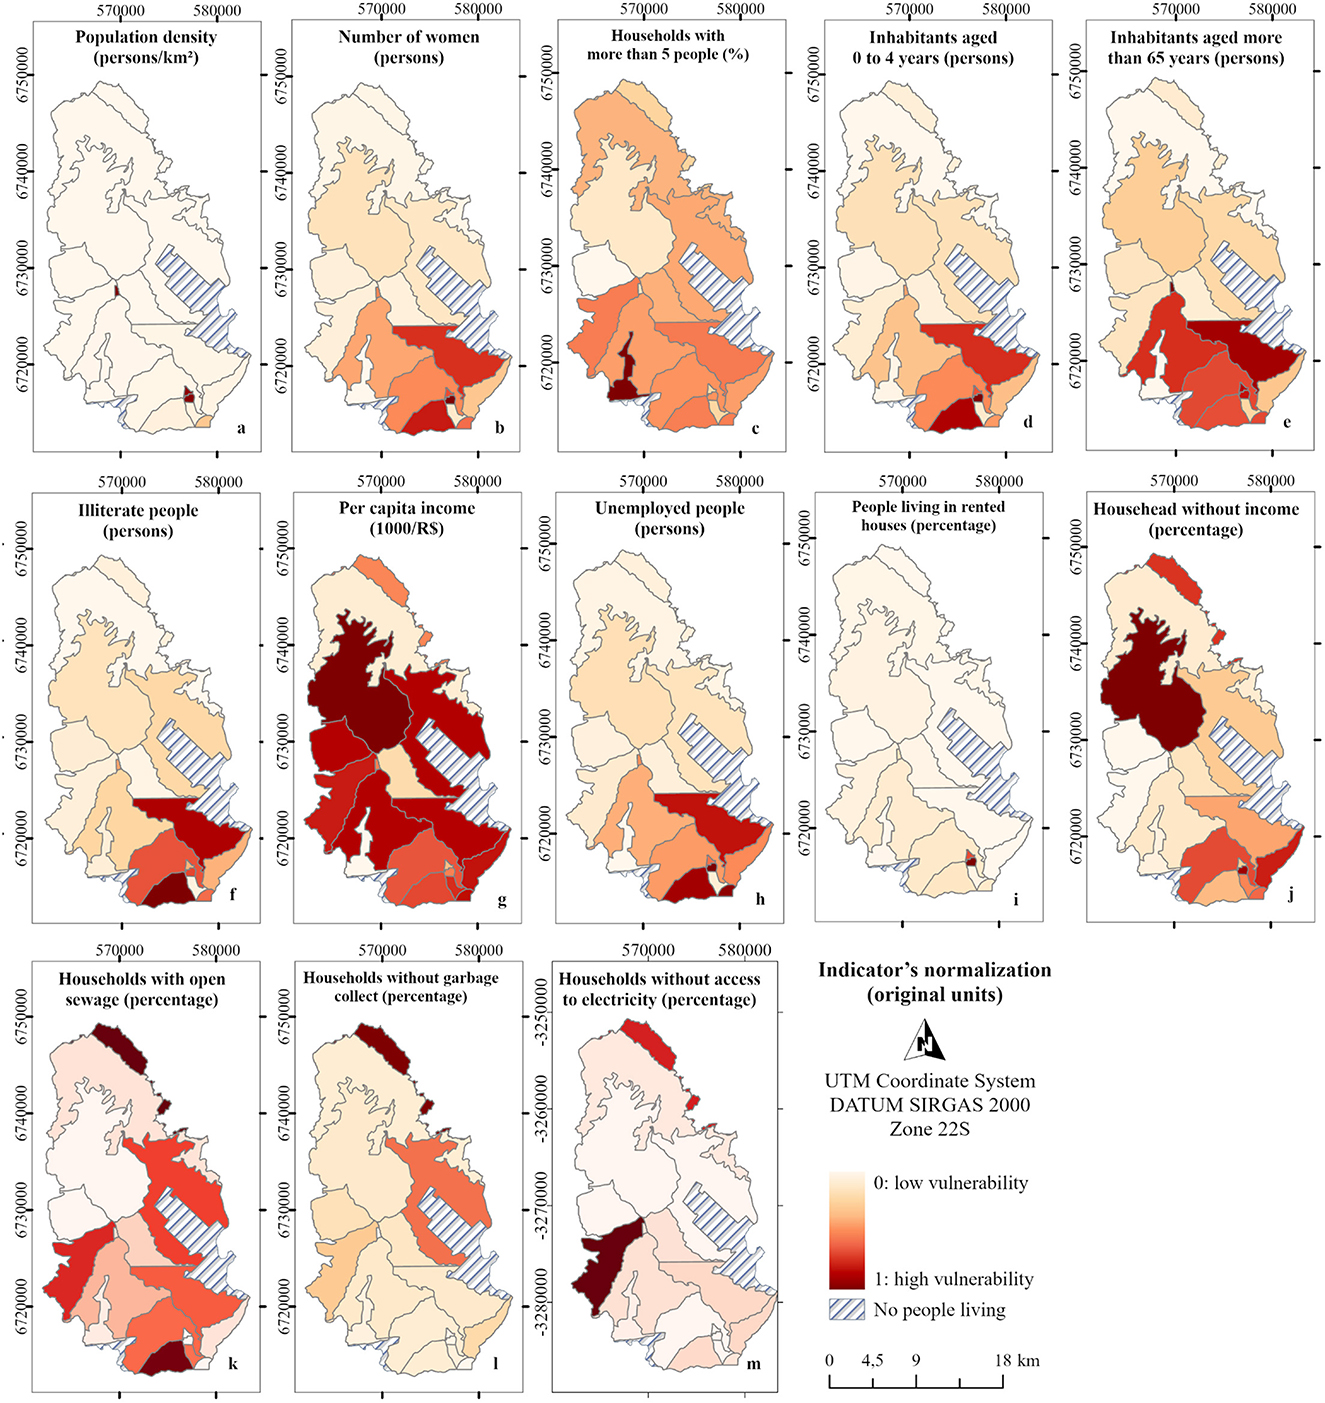
Figure 4. Maps with the normalized flood vulnerability indicators. The original units used to represent the indicator are shown in parentheses.
2.3. Participatory weighting of indicator's contribution to flood vulnerability
We investigated the sensitivity of the vulnerability index by employing different indicators' weights obtained through a participatory survey. The survey was carried out using the Survio platform (Supplementary material SM1) and shared with stakeholders who (i) have knowledge on flood vulnerability analysis acquired through experience or education, and/or (ii) who were familiar with the study area (i.e., by living in risk-prone areas or by conducting research there). The survey was administered in Portuguese because the target individuals were all Brazilians. A total of 300 stakeholders identified via snowball and convenience sampling were invited to participate in our study. It should be noted that this technique was used here as a method of contact rather than a formal, statistical sampling method (Atkinson and Flint, 2001).
The survey was used to estimate preferences for the relative importance of each indicator. It comprised three parts: (i) general information about the stakeholders, including their knowledge of flood vulnerability, familiarity with the study area, age, professional sector (e.g., governmental organizations, universities, private companies, academic, and other), and level of education; (ii) weights attributed to social, economic, and physical indicators; and (iii) open questions about suggestions of additional relevant vulnerability indicators to include and other recommendations.
The participants attributed weights using the “point allocation” approach, first across indicators' main categories (economic, social and physical in Figure 3), and second across indicators within each category. This method was chosen due to its simplicity and easiness of implementation in online surveys (Esangbedo et al., 2021). It allows for flexibility in weight assignments, promotes transparency, and ensures consistency in weight assignments, as it allows all criteria to be evaluated on the same scale. For example, for social vulnerability (Figure 3), the participants were asked to give weights to six indicators on a scale from 0 to 100, where the total sum must be equal to 100%. To obtain the global weights for each indicator, we normalized the local weight values according to the weights given to each category.
2.4. Aggregation and sensitivity analysis of indicators' weights
In order to generate the flood vulnerability maps, the normalized indicators were multiplied by the participatory weights obtained and, subsequently, summed (Equation 2). The results were then classified into different vulnerability classes: “very low,” “low,” “medium,” “high,” and “very high,” by considering the natural breaks methods. These choices were made because they performed better than other aggregation and classification techniques, as shown by Moreira et al. (2021a).
where w is the weight associated with a normalized value (I) for the indicator i; and q is the number of indicators.
We calculated a vulnerability index for each participant to analyze the index's sensitivity according to the different weights proposed by stakeholders. We then computed the mean and standard deviation of the indexes' values. This enabled us to identify and depict areas with high variability (i.e., census blocks with greater sensitivity in flood vulnerability outcomes). The scenario with the mean weighting was also compared with an index developed using equal weighting.
2.5. Statistical analysis of survey results
We performed a statistical analysis of the survey results using the software SPSS® (version 18.0.3) to determine whether there were significant differences in the weights derived by the stakeholders. We applied the Shapiro-Wilk test to examine if the weights were normally distributed in the sample. If the sample presented a non-normal distribution, we used the Kruskal-Wallis test to analyze the indicator's weights according to the stakeholders' characteristics (e.g., level of knowledge of flood vulnerability analysis, knowledge of the study area, age, and profession). In both tests, the confidence interval was set to 95%.
2.6. Comparison with flood hazard maps
To date, no data on the socioeconomic vulnerability of the population or previous impact assessments exist for the study area. The data availability limitation, thus, constrains the validation of our results. Nevertheless, we compared the resulting vulnerability maps with a worldwide flood map by FM Global.1 This hazard map displays high (100-year) and moderate (500-year) hazard flood zones via a 90 × 90 m grid, mapping potential flood zone worldwide derived from physically based hydrology and hydraulic data. It should be emphasized that this comparison should not be treated as validation as the maps by FM Global were derived from physically-based hydrology models, while our results are based on socioeconomic characteristics that make exposed people susceptible to the adverse effects of floods. As such, this comparison can serve to point out areas with an increased flood risk.
3. Results
3.1. Characteristics of the survey participants
A total of 44 persons replied to our survey (response rate of 14.7%), predominantly 26–65 years old (Table 1). Most participants had a Ph.D. degree, were unfamiliar with the Maquiné river basin, and had reasonable knowledge of flood vulnerability assessment.
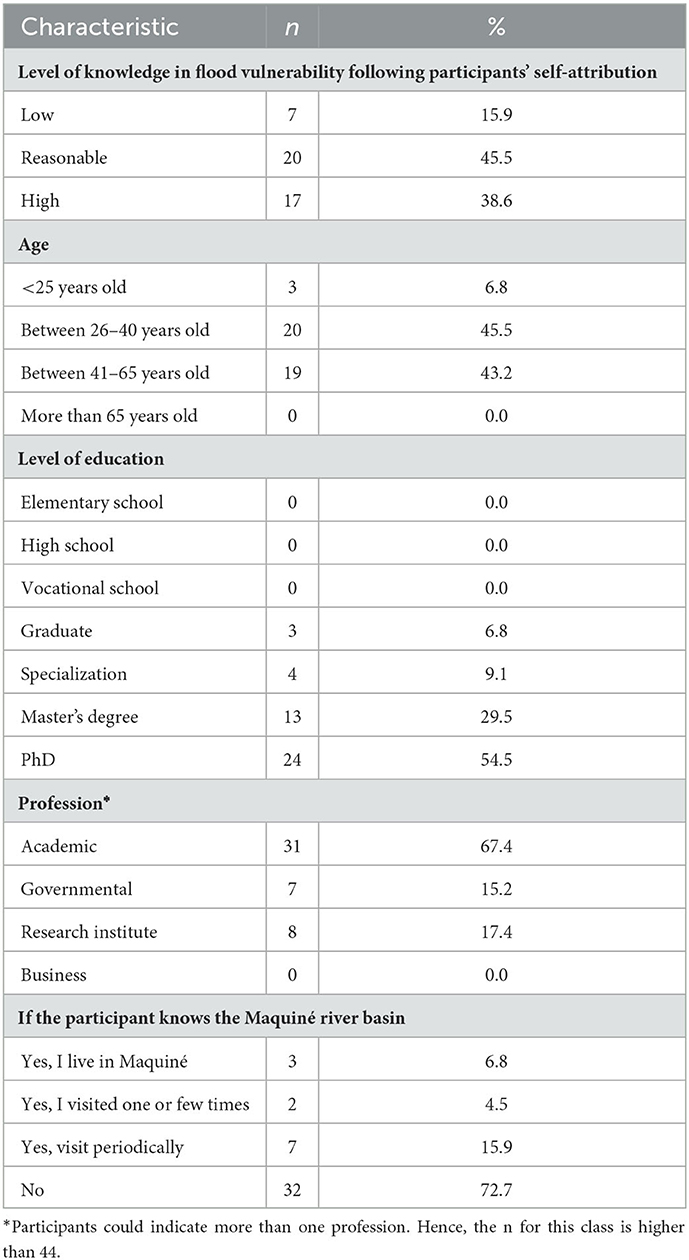
Table 1. Participants' characteristics.
3.2. Indicators' weights
With regard to the weights given to each vulnerability category, the social dimension was the most important one (mean weight of 35.9%), followed by economic (34.7%) and physical (29.4%), respectively (Figure 5). Within each category, local weights defined the importance of a single indicator. For example, “households with open sewage” was given more weight (37.5% out of 100%) than the other two in the physical category. Within the social category, “population density” was rated the most important (24.8%), while the “number of women” was deemed the least important indicator (8.7%).
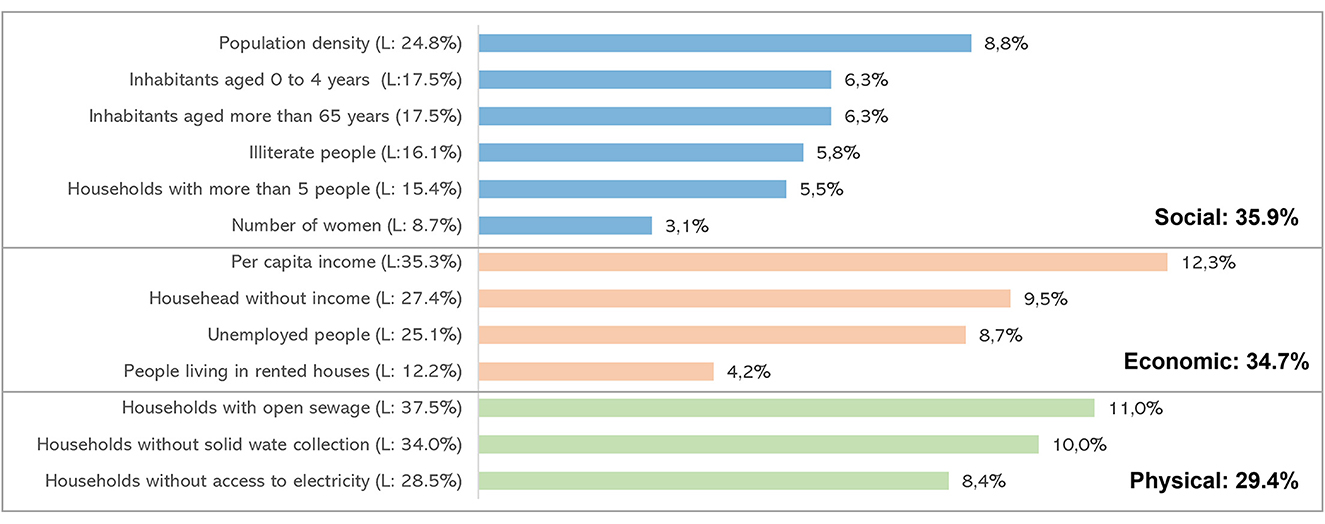
Figure 5. Global weights in percentage (indicator importance considering the weights attributed to social, economic, and physical categories). The color blue represents the social vulnerability category, orange is the economic, and green is the physical. The local weights (indicator importance within each category) are denoted by “L”.
We also computed the global weights by multiplying each indicator's local weight with its corresponding vulnerability category's relative weight. For example, “unemployed people,” belonging to the economic vulnerability category, had a mean global weight of 8.7%, as a result of a product of 25.1 (local weight) and 34.7% (vulnerability category's relative weight). When considering the global weights (Figure 5), the indicator “per capita income” obtained the highest importance (12.3%), followed by “households with open sewage” (11.0%) and “households without solid waste collection” (10.0%).
Figures 6, 7 illustrate how the weights differed according to the participants' opinions. Overall, the mean standard deviation (SD) of the global weights was 1.2 on a scale ranging from 7.4 (very low vulnerability) to 58.9 (very high vulnerability). This result indicates that there were no extensive discrepancies between the opinion of surveyed participants on the importance each indicator. The indicators “per capita income” and “population density” were the ones that varied the most (SD = 1.8 and 1.7 respectively), whereas, for the indicator “inhabitants aged more than 65 years,” the weights were relatively stable (SD = 0.8).
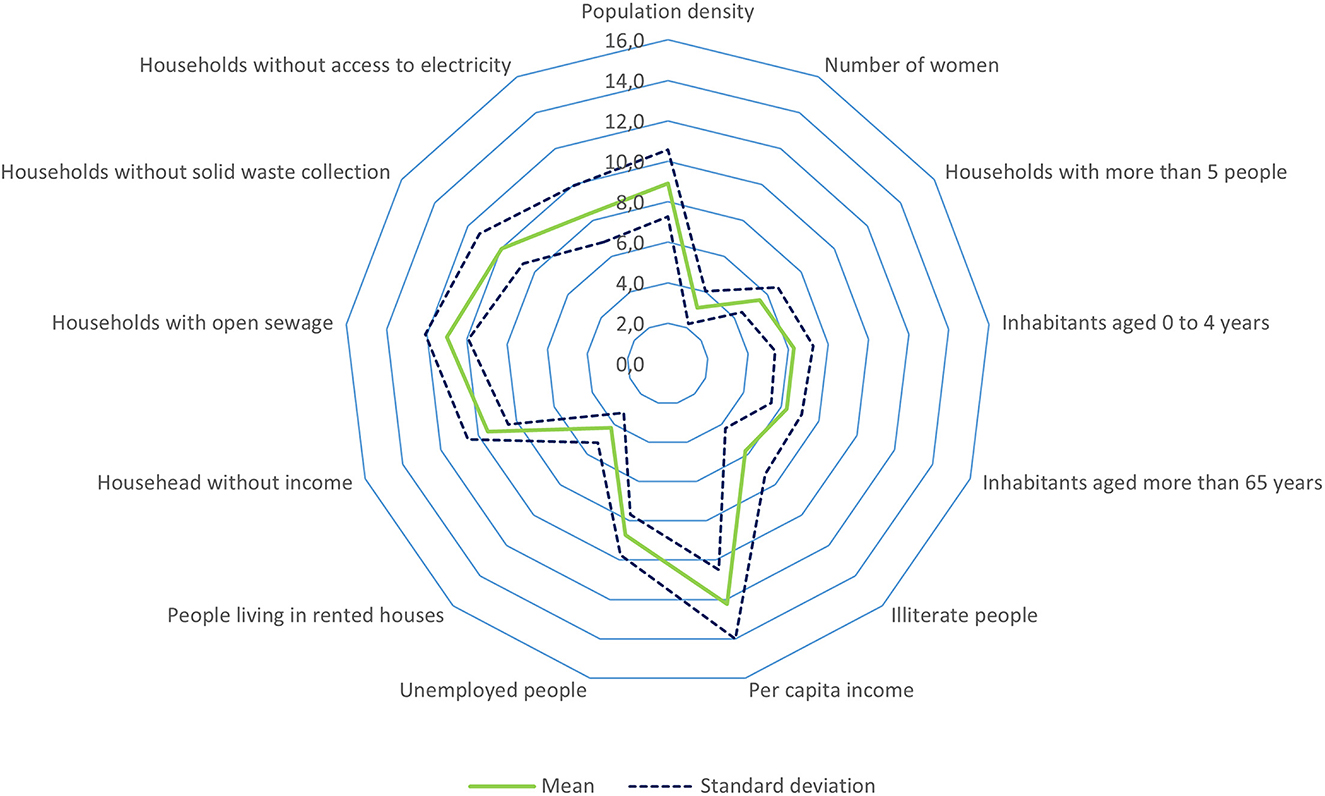
Figure 6. Radar chart illustrating how the mean and standard deviation of the indicator's global weights varied.
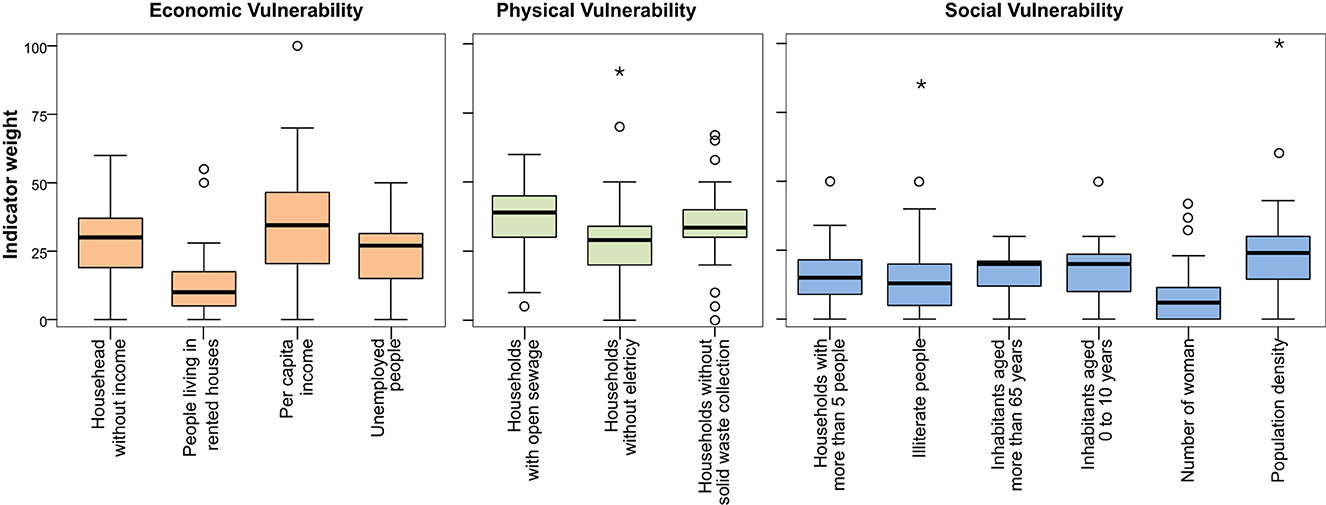
Figure 7. Box plots showing how the indicator's local weights varied according to the 44 survey participants.
In general, the indicators' weights presented non-normal distributions (Supplementary material SM2). The Kruskal–Wallis test showed that the population mean ranks of weights of indicators did not significantly differ among the stakeholders' characteristics. We also performed a cluster analysis to further investigate similarities in the weights given by the stakeholders to the three vulnerability categories. Overall, there were no significant differences according to the participant's age, education level, level of knowledge in flood vulnerability assessment, work sector, and familiarity with the Maquiné river basin (Supplementary material SM3).
3.3. Vulnerability maps
Based on the individual weighting schemes, we created vulnerability maps for each of the 44 stakeholders. Figure 8A shows the mean vulnerability results obtained by averaging the spatial outcomes of the individual maps; Figure 8B shows the results obtained using equal weights; and Figure 8C shows the standard deviation of the 44 indexes. Overall, the mean vulnerability scores ranged from 7.4 to 58.9 for the participatory weighting approach (Figure 8A) and from 7.0 to 61.1 for the equal weights approach (Figure 8B). The results were then classified into “very low,” “low,” “medium,” “high,” and “very high” using the natural breaks method. The CBs 1, 4, and 7 in the south had overall the highest vulnerability scores, classified with very high vulnerability. This is mainly because they are the most populated CBs, encompassing 38.9% of the population in the Maquiné river basin. Furthermore, these areas present a high proportion of illiterate and unemployed people (Figure 4). In contrast, CBs 12, 14, 18, and 19 were classified as “very low” flood vulnerability. Such results are linked to the population density as these CBs encompass only 3.4% of the total population in the basin. In addition, for most indicators, the CBs 12, 14 and 18 present low vulnerability scores (Figure 4).
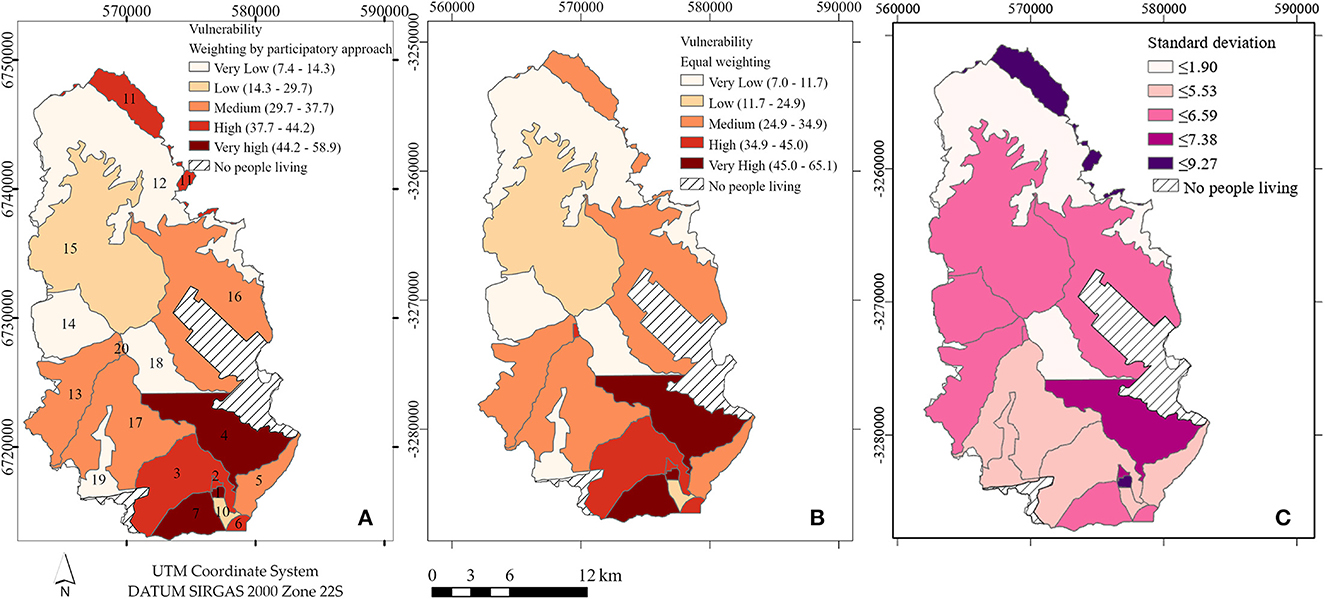
Figure 8. Final vulnerability maps: (A) mean vulnerability obtained by averaging the results of each individual map; (B) considering equal weights; and (C) standard deviation of the vulnerability maps obtained by considering each stakeholder weighting scheme.
When comparing the map in Figure 8A to the flood hazard map by FM Global2, we found that CBs in the south of the study area (1, 2, 6, 7 and 10) are located in flood-prone areas (Supplementary material SM4). As such, these regions present a higher flood risk. Conversely, the CB 11 presents a low risk even though the vulnerability is high, given that CB 11 is not located in a flood-prone zone.
In terms of spatial sensitivity, the CBs 1, 2, 4, and 11 (Figure 8C) had the highest variability in terms of vulnerability outcomes due to the range of stakeholders' weights. The CBs 1 and 4 present a high “population density” (Figure 4), which was one of the indicators with the highest weights as well as highest standard deviation (Figure 8C). The CB 11 has the largest number of households without solid waste collection (90%) in the Maquiné basin. Furthermore, this area presents a high vulnerability when considering the “per capita income” indicator, which also presented a high SD (Figure 8C), indicating high sensitivity concerning stakeholder opinion.
In most CBs, the flood vulnerability classes generated with weights by the stakeholders are similar to those obtained via equal weights (Figure 8). Indeed, the only differences are in: (i) CB 11, whose scores changed from “high” to “medium” vulnerability; and (ii) CB 20, whose scores changed from “medium” to “high.” This indicates that the vulnerability results exhibit a low spatial sensitivity to the indicator weights.
4. Discussion
In this study, we investigated the sensitivity of flood vulnerability assessments according to different indicators' weights. From the outputs, we can derive the following general summary: (i) the most relevant indicators for assessing flood vulnerability in the study area according to stakeholders are related to economic aspects followed by physical ones; (ii) the weight choices are not dependent on the stakeholders' characteristics, they rather depend on their individual opinions and personal experience; (iii) the choice of the weights by different stakeholders has a significant effect on flood vulnerability quantification only in a few CBs; and (iv) the mean results obtained by the participatory approach are similar to those obtained with equal weighting.
With regard to the indicator weights (Question i), we found that similar to other flood vulnerability studies (de Brito et al., 2018; Schuster-Wallace et al., 2018; Shah et al., 2018), the “per capita income” was the most important variable for determining flood vulnerability. In contrast, “gender” received a lower weight despite being one of the most used indicators (Rufat et al., 2022) and appearing in 28.4% of the vulnerability studies included in a recent systematic review on flood vulnerability using indexes (Moreira et al., 2021b). The role of gender in shaping vulnerability is controversial and subject to many interpretations (Cutter and Emrich, 2006; de Brito et al., 2017; et al., 2022). While some studies consider women as being particularly vulnerable, especially in the aftermath of floods in low-income countries (Fatouros and Capetola, 2021), a large-scale database of flood fatalities in Europe found that most flood victims are men under 50 years and who are in good health conditions (Papagiannaki et al., 2022).
As such, the importance of vulnerability indicators varies widely depending on each case study area's economic and development conditions (e.g., industrialized vs. unindustrialized country). For instance, a Pakistani study that considered expert and public opinions to attribute indicator weights found that “poor/improper building material” was one of the most relevant indicators (Shah et al., 2018). Conversely, a study by Canadian researchers (Schuster-Wallace et al., 2018) and a recent survey of 150 experts working in Europe (Rufat et al., 2022) showed that “age” is more relevant than the “per capita income” for monitoring vulnerability. Hence, worldwide guidelines regarding which indicators are relevant for vulnerability assessment seem unlikely as vulnerability is mostly case-specific (Boyd and Juhola, 2015). In this regard, participatory weighting techniques such as the one illustrated here can be valuable for understanding the specificities of each locality.
In the present study, the characteristics of stakeholders were not the main drivers of variations in the indicators' weights (Question ii). This is similar to the findings by de Brito et al. (2017). Hence, we assume that the stakeholders' previous experiences, worldviews, and perspectives resulted in differences in the weighting of indicators. As shown in Supplementary material SM3, there are groups of people who have a similar opinion. However, they cannot be clustered according to their age, education level, level of knowledge in flood vulnerability assessment, work sector, and if they are familiar with the Maquiné river basin. Hence, the weighting of indicators is influenced people's subjective opinion (Akter and Simonovic, 2005; Chen et al., 2013; Slater and Robinson, 2020).
Concerning Question (iii), we found that despite the relative robustness, the vulnerability outcomes are locally sensitive to weight changes, especially in the CBs 1 and 11. In these areas, the SD was 9.27, which is considered a high value since the vulnerability scores ranged between 7.4 and 58.9. These areas are located where a significant percentage of an indicator with a high weight was assigned. For example, in CB 11, about 90% of houses do not have solid waste collection, which was considered one of the most relevant indicators in the study, even though this sector accounts for 1% of the basin's population. The other main uncertainties are observed in high population density areas (CBs 1, 2, and 20). Hence, these variables require careful measurement because they have the highest impact on the vulnerability outcomes.
In this case study, the use of equal weights resulted in similar vulnerability values compared to the situation where the weights chosen by participants were applied (Question iv). This can be a positive aspect, as in the case of limited resources, the construction of indexes can be facilitated. The equal weights method enables easy computation and interpretation of composite indicators and has been shown to lead to robust outcomes (Shi and Land, 2021). As such, this method is one of the most used (Moreira et al., 2021a,b). However, considering different stakeholders in building indexes can minimize a narrow and siloed view on flood vulnerability. The heterogeneities of different societies can result in differences in dealing with flood vulnerability, and stakeholders' participation can provide a more comprehensive understanding of this issue. For instance, Asare-Kyei et al. (2015) demonstrated that different indicators and weightings are considered even within the same country, depending on the scale of assessment and persons involved. Within this context, the UNDRR (2015) highlights that building disaster resilience requires an integrative approach and all-of society engagement. Stakeholders' involvement can contribute to this goal and reduce the gap between the knowledge from the scientific community and the practices in policies and social programmes (White et al., 2001). As such, we recommend the use of participatory approaches for co-developing indexes as they democratize science and ultimately redistribute power and expertise among different groups within society (Jagannathan et al., 2020).
5. Study limitations
Despite the advances of the present study, some limitations should be acknowledged. The first refers to the lack of validation of vulnerability results against independent vulnerability data. For our study area, no data on the socioeconomic impact of floods exist (e.g., economic losses, number of affected persons), which restricts results validation. There are also no previous vulnerability studies in the study area. As shown in a review by Moreira et al. (2021b), <14% of flood vulnerability studies performed any form of validation. This limitation relies on the difficulty of conducting experimental studies with vulnerability, given its multidimensional characteristics (Fekete, 2009). Nonetheless, the authors acknowledge that the validation of results is needed to improve the reliability of the findings of the proposed approach throughout future studies. We partially addressed this by comparing our results with an existing flood hazard map (see Supplementary material SM4).
A second limitation concerns the analyses of other weighting methods, such as the Analytical Hierarchy Process (AHP), the Analytical Network Process (ANP), Best-Worst Method (BWM) (e.g., de Brito et al., 2018 and Ekmekcioglu et al., 2022). Previous studies have shown that multi-criteria methods can be cognitive demanding for stakeholders when multiple criteria are involved (Cinelli et al., Morton et al.). Therefore, to reach a broad range of stakeholders, we opted for using a point allocation approach, which is straightforward to implement in a survey format. Within this context, further research could also be conducted by considering the interrelationships between the criteria. Probability-based approaches could also help in dealing with vagueness and uncertainty, along with fuzzy approaches (Guo et al., 2014). Therefore, comparing several methods could be a valuable research direction for future studies.
6. Conclusions
By using the Maquiné river basin, the present study investigated the effects of indicators' weighting to construct a flood vulnerability index. Our research revealed several key insights: (i) the per capita income was identified as the most vital indicator for assessing flood vulnerability according to study participants; (ii) the preference for indicator weights by different stakeholders was found to be influenced by their individual experiences rather than their socio-economic characteristics; (iii) the obtained spatial results were robust, even different weighting approaches were considered; and (iv) the use of equal weights did not result in major changes in flood vulnerability spatial outcomes when compared to the participatory weighting approach.
Our study's scientific value lies in combining a participatory approach with a scenario-based sensitivity analysis. This approach relies on the active involvement of the affected community and experts, incorporating their expertise, personal experiences, and socio-cultural influences. This, in turn, can increase transparency, as all stakeholders are able to understand the reasoning behind each decision. It can also increase acceptability, as stakeholders feel that their input has been considered and valued. Additionally, participatory weighting approaches can help to initiate discussion and facilitate the sharing of knowledge and perspectives. The combination of the participatory approach with a sensitivity analysis allowed us to capture spatial particularities of flood vulnerability, highlighting the importance of including stakeholders in scientific endeavors. Based on our findings, end-users can better understand the relative importance of each indicator and how they contribute to vulnerability. Furthermore, our results can help identify points where stakeholders disagree, which can be used to facilitate dialogue and consensus building.
The present study sheds light on the importance of assessing the sensitivity of different criteria weights. We identified which areas present higher uncertainty and which indicators contribute to such results. For instance, we found that the areas with higher uncertainty are those which are more populated. Decision-makers should, thus, focus their mitigation efforts on areas with a high mean vulnerability (Figure 8A) and low standard deviation (Figure 8C). Conversely, areas with high uncertainty and vulnerability need to be examined in depth as they are potentially vulnerable but present high uncertainty. Although the differences obtained here are small, it is important to check them for each case study area. Based on analyses such as the one proposed here, researchers can guide their efforts to reduce the uncertainty in vulnerability assessment.
Data availability statement
Publicly available datasets were analyzed in this study. This data can be found here: www.ibge.gov.br.
Author contributions
LM: methodology, formal analysis, investigation, and writing—original draft. MB: methodology, investigation, writing—original draft, writing—review and editing, and supervision. FV and DS: formal analysis and writing—review and editing. MK: writing-review and editing and supervision. All authors contributed to the article and approved the submitted version.
Funding
The article processing charges for this open-access publication were covered by the Helmholtz Centre for Environmental Research—UFZ. The authors would like to thank the Brazilian National Council for Scientific and Technological Development (CNPq, grant numbers 165101/2018-0) and the São Paulo Research Foundation - FAPESP (grant numbers 2019/24292-7 and 2021/14016-2) for the financial support.
Conflict of interest
The authors declare that the research was conducted in the absence of any commercial or financial relationships that could be construed as a potential conflict of interest.
Publisher's note
All claims expressed in this article are solely those of the authors and do not necessarily represent those of their affiliated organizations, or those of the publisher, the editors and the reviewers. Any product that may be evaluated in this article, or claim that may be made by its manufacturer, is not guaranteed or endorsed by the publisher.
Supplementary material
The Supplementary Material for this article can be found online at: https://www.frontiersin.org/articles/10.3389/frwa.2023.970469/full#supplementary-material
Footnotes
1. ^Available at: https://www.fmglobal.com/research-and-resources/nathaz-toolkit/flood-map.
2. ^Available at: https://www.fmglobal.com/research-and-resources/nathaz-toolkit/flood-map.
References
Abebe, Y., Kabir, G., and Tesfamariam, S. (2018). Assessing urban areas vulnerability to pluvial flooding using GIS applications and Bayesian belief network model. J. Clean. Prod. 174, 1629–1641. doi: 10.1016/j.jclepro.2017.11.066
Akter, T., and Simonovic, S. P. (2005). Aggregation of fuzzy views of a large number of stakeholders for multi-objective flood management decision-making. J. Environ. Manag. 77, 133–143. doi: 10.1016/j.jenvman.2005.02.015
Asare-Kyei, D. K., Kloos, J., and Renaud, F. G. (2015). Multi-scale participatory indicator development approaches for climate change risk assessment in West Africa. Int. J. Disast. Risk Reduct. 11, 13–34. doi: 10.1016/j.ijdrr.2014.11.001
Atkinson, R., and Flint, J. (2001). Accessing hidden and hard-to-reach populations: Snowball research strategies. Soc. Res. Update. 33.
Balica, S. F., Popescu, I., Beevers, L., and Wright, N. G. (2013). Parametric and physically based modelling techniques for flood risk and vulnerability assessment: a comparison. Environ. Model. Softw. 41, 84–92. doi: 10.1016/j.envsoft.2012.11.002
Bamberg, S., Masson, T., Brewitt, K., and Nemetschek, N. (2020). “Threat, coping and flood prevention—a meta-analysis”: corrigendum. J. Environ. Psychol. 67, 101364. doi: 10.1016/j.jenvp.2019.101364
Becker, W., Saisana, M., Paruolo, P., and Vandecasteele, I. (2017). Weights and importance in composite indicators: closing the gap. Ecol. Indic. 80, 12–22. doi: 10.1016/j.ecolind.2017.03.056
Birkmann, J., Cardona, O. D., Carreño, M. L., Barbat, A. H., Pelling, M., Schneiderbauer, S., et al. (2013). Framing vulnerability, risk and societal responses: the MOVE framework. Nat. Hazards 67, 193–211. doi: 10.1007/s11069-013-0558-5
Boyd, E., and Juhola, S. (2015). Adaptive climate change governance for urban resilience. Urban Stud. 52, 1234–1264. doi: 10.1177/0042098014527483
Chen, Y., Yu, J., and Khan, S. (2013). The spatial framework for weight sensitivity analysis in AHP-based multi-criteria decision making. Environ. Model. Softw. 48, 129–140. doi: 10.1016/j.envsoft.2013.06.010
Cigala, V., Roder, G., and Kreibich, H. (2022). Invited perspectives: “Natural hazard management, professional development and gender equity: let's get down to business.” Nat. Hazards Earth Syst. Sci. 22, 85–96. doi: 10.5194/nhess-22-85-2022
Cutter, S. L., and Emrich, C. T. (2006). Moral hazard, social catastrophe: The changing face of vulnerability along the hurricane coasts. Ann. Acad. Polit. Soc. Sci. 604, 102–112. doi: 10.1177/0002716205285515
de Brito, M. M., Almoradie, A., and Evers, M. (2019). Spatially-explicit sensitivity and uncertainty analysis in a MCDA-based flood vulnerability model. Int. J. Geogr. Inform. Sci. 33, 1788–1806. doi: 10.1080/13658816.2019.1599125
de Brito, M. M., and Evers, M. (2016). Multi-criteria decision-making for flood risk management: a survey of the current state of the art. Nat. Hazards Earth Syst. Sci. 16, 1019–1033. doi: 10.5194/nhess-16-1019-2016
de Brito, M. M., Evers, M., and Delos Santos Almoradie, A. (2018). Participatory flood vulnerability assessment: a multi-criteria approach. Hydrol. Earth Syst. Sci. 22, 373–390. doi: 10.5194/hess-22-373-2018
de Brito, M. M., Evers, M., and Höllermann, B. (2017). Prioritization of flood vulnerability, coping capacity and exposure indicators through the Delphi technique: a case study in Taquari-Antas basin, Brazil. Int. J. Disast. Risk Reduct. 24, 119–128. doi: 10.1016/j.ijdrr.2017.05.027
de Castro, D., Mello, R., Si., P. (2013). Bacia Hidrográfica do Rio Tramandaí: Atlas Ambiental. Porto Alegre: Via Sapiens.
Ekmekcioǧlu, Ö., and Koc, K. (2022). Explainable step-wise binary classification for the susceptibility assessment of geo-hydrological hazards. CATENA 216, 106379. doi: 10.1016/j.catena.2022.106379
Esangbedo, M. O., Bai, S., Mirjalili, S., and Wang, Z. (2021). Evaluation of human resource information systems using grey ordinal pairwise comparison MCDM methods. Exp. Syst. Appl. 182, 115151. doi: 10.1016/j.eswa.2021.115151
Evers, M., Almoradie, A., and de Brito, M. M. (2018). “Enhancing flood resilience through collaborative modelling and multi-criteria decision analysis (MCDA),” in The Urban Book Series (New York, NY: Springer International Publishing), 221–236. doi: 10.1007/978-3-319-68606-6_14
Fatouros, S., and Capetola, T. (2021). Examining gendered expectations on women's vulnerability to natural hazards in low to middle income countries: a critical literature review. Int. J. Disast. Risk Reduct. 64, 102495. doi: 10.1016/j.ijdrr.2021.102495
Feizizadeh, B., and Kienberger, S. (2017). Spatially explicit sensitivity and uncertainty analysis for multicriteria-based vulnerability assessment. J. Environ. Plann. Manag. 60, 2013–2035. doi: 10.1080/09640568.2016.1269643
Fekete, A. (2009). Validation of a social vulnerability index in context to river-floods in Germany. Nat. Hazards Earth Syst. Sci. 9, 393–403. doi: 10.5194/nhess-9-393-2009
Fekete, A. (2012). Spatial disaster vulnerability and risk assessments: challenges in their quality and acceptance. Nat. Hazards 61, 1161–1178. doi: 10.1007/s11069-011-9973-7
Gu, H., Du, S., Liao, B., Wen, J., Wang, C., Chen, R., et al. (2018). A hierarchical pattern of urban social vulnerability in Shanghai, China and its implications for risk management. Sustain. Cit. Soc. 41, 170–179. doi: 10.1016/j.scs.2018.05.047
Guo, P., Chen, X., Li, M., and Li, J. (2014). Fuzzy chance-constrained linear fractional programming approach for optimal water allocation. Stoch. Environ. Res. Risk Assess. 28, 1601–1612. doi: 10.1007/s00477-013-0810-2
Herk, S., Zevenbergen, C., Rijke, J., and Ashley, R. (2011). Collaborative research to support transition towards integrating flood risk management in urban development. J. Flood Risk Manag. 4, 306–317. doi: 10.1111/j.1753-318x.2011.01113.x
Hernández-Uribe, R. E., Barrios-Piña, H., and Ramírez, A. I. (2017). Análisis de riesgo por inundación: metodología y aplicación a la cuenca Atemajac. Tecnologia y Ciencias del Agua 8, 5–25. doi: 10.24850/j-tyca-2017-03-01
IBGE (2010). Censo Demográfico 2010. Rio de Janeiro: IBGE. Available online at: https://www.ibge.gov.br/estatisticas/sociais/populacao/9662-censo-demografico-2010.html?edicao=9678andt=downloads (accessed June 30, 2019).
Jagannathan, K., Arnott, J. C., Wyborn, C., Klenk, N., Mach, K. J., Moss, R. H., et al. (2020). Great expectations? Reconciling the aspiration, outcome, and possibility of co-production. Curr. Opin. Environ. Sustain. 42, 22–29. doi: 10.1016/j.cosust.2019.11.010
Kanani-Sadat, Y., Arabsheibani, R., Karimipour, F., and Nasseri, M. (2019). A new approach to flood susceptibility assessment in data-scarce and ungauged regions based on GIS-based hybrid multi criteria decision-making method. J. Hydrol. 572, 17–31. doi: 10.1016/j.jhydrol.2019.02.034
Kelly, P. M., and Adger, W. N. (2000). Theory and practice in assessing vulnerability to climate change and facilitating adaptation. Clim. Change 47, 325–352. doi: 10.1023/A:1005627828199
Kowalski, K., Stagl, S., Madlener, R., and Omann, I. (2009). Sustainable energy futures: methodological challenges in combining scenarios and participatory multi-criteria analysis. Eur. J. Oper. Res. 197, 1063–1074. doi: 10.1016/j.ejor.2007.12.049
Membele, G. M., Naidu, M., and Mutanga, O. (2022). Examining flood vulnerability mapping approaches in developing countries: a scoping review. Int. J. Disast. Risk Reduct. 69, 102766. doi: 10.1016/j.ijdrr.2021.102766
Moreira, L. L., de Brito, M. M., and Kobiyama, M. (2021a). Effects of different normalization, aggregation, and classification methods on the construction of flood vulnerability indexes. Water 13, 98. doi: 10.3390/w13010098
Moreira, L. L., de Brito, M. M., and Kobiyama, M. (2021b). Review article: a systematic review and future prospects of flood vulnerability indices. Nat. Hazards Earth Syst. Sci. 21, 1513–1530. doi: 10.5194/nhess-21-1513-2021
Nasiri, H., Mohd Yusof, M. J., and Mohammad Ali, T. A. (2016). An overview to flood vulnerability assessment methods. Sustain. Water Resour. Manag. 2, 331–336. doi: 10.1007/s40899-016-0051-x
Nigusse, A. G., and Adhanom, O. G. (2019). Flood hazard and flood risk vulnerability mapping using geo-spatial and mcda around adigrat, Tigray Region, Northern Ethiopia. MEJS. 11, 90. doi: 10.4314/mejs.v11i1.6
Oulahen, G., Mortsch, L., Tang, K., and Harford, D. (2015). Unequal vulnerability to flood hazards: “ground truthing” a social vulnerability index of five municipalities in Metro Vancouver, Canada. Ann. Assoc. Am. Geogr. 105, 473–495. doi: 10.1080/00045608.2015.1012634
Papagiannaki, K., Petrucci, O., Diakakis, M., Kotroni, V., Aceto, L., Bianchi, C., et al. (2022). Developing a large-scale dataset of flood fatalities for territories in the Euro-Mediterranean region, FFEM-DB. Sci. Data 9, 166. doi: 10.1038/s41597-022-01273-x
Peel, M. C., Finlayson, B. L., and McMahon, T. A. (2007). Updated world map of the Köppen-Geiger climate classification. Hydrol. Earth Syst. Sci. 11, 1633–1644. doi: 10.5194/hess-11-1633-2007
Rogelis, M. C., Werner, M., Obregón, N., and Wright, N. (2016). Regional prioritisation of flood risk in mountainous areas. Nat. Hazards Earth Syst. Sci. 16, 833–853. doi: 10.5194/nhess-16-833-2016
Roy, S., Bose, A., and Chowdhury, I. R. (2021a). Flood risk assessment using geospatial data and multi-criteria decision approach: a study from historically active flood-prone region of Himalayan foothill, India. Arab. J. Geosci. 14, 999. doi: 10.1007/s12517-021-07324-8
Roy, S., Bose, A., Singha, N., Basak, D., and Chowdhury, I. R. (2021b). Urban waterlogging risk as an undervalued environmental challenge: an integrated MCDA-GIS based modeling approach. Environ. Challenges 4, 100194. doi: 10.1016/j.envc.2021.100194
Rufat, S., de Brito, M. M., Fekete, A., Comby, E., Robinson, P. J., Arma?, I., et al. (2022). Surveying the surveyors to address risk perception and adaptive-behaviour cross-study comparability. Nat. Hazards Earth Syst. Sci. 22, 2655–2672. doi: 10.5194/nhess-22-2655-2022
Schuster-Wallace, C. J., Murray, S. J., and McBean, E. A. (2018). Integrating social dimensions into flood cost forecasting. Water Resour. Manag. 32, 3175–3187. doi: 10.1007/s11269-018-1983-8
Shah, A. A., Ye, J., Abid, M., Khan, J., and Amir, S. M. (2018). Flood hazards: household vulnerability and resilience in disaster-prone districts of Khyber Pakhtunkhwa province, Pakistan. Nat. Haz. 93, 147–165. doi: 10.1007/s11069-018-3293-0
Shi, C., and Land, K. C. (2021). The data envelopment analysis and equal weights/minimax methods of composite social indicator construction: a methodological study of data sensitivity and robustness. Appl. Res. Qual. Life 16, 1689–1716. doi: 10.1007/s11482-020-09841-2
Slater, K., and Robinson, J. (2020). Social learning and transdisciplinary co-production: A social practice approach. Sustainability 12, 7511. doi: 10.3390/su12187511
Tate, E. (2012). Social vulnerability indices: a comparative assessment using uncertainty and sensitivity analysis. Nat. Haz. 63, 325–347. doi: 10.1007/s11069-012-0152-2
UNDRR (2015). Sendai Framework for Disaster Risk Reduction 2015–2030. Geneva: UNDRR. Available online at: https://www.preventionweb.net/files/43291_sendaiframeworkfordrren.pdf (accessed May 30, 2022).
Wang, J., Jing, Y., and Zhang, C. (2009). Weighting methodologies in multi-criteria evaluations of combined heat and power systems. Int. J. Energy Res. 33, 1023–1039. doi: 10.1002/er.1527
Keywords: composite indicators, index, flood vulnerability, weighting, sensitivity analysis, participation
Citation: Moreira LL, Vanelli FM, Schwamback D, Kobiyama M and de Brito MM (2023) Sensitivity analysis of indicator weights for the construction of flood vulnerability indexes: A participatory approach. Front. Water 5:970469. doi: 10.3389/frwa.2023.970469
Received: 16 June 2022; Accepted: 16 January 2023;
Published: 06 February 2023.
Edited by:
Marlies Barendrecht, VU Amsterdam, NetherlandsReviewed by:
Ömer Ekmekcioğlu, Istanbul Technical University, TürkiyeSubham Roy, University of North Bengal, India
Copyright © 2023 Moreira, Vanelli, Schwamback, Kobiyama and de Brito. This is an open-access article distributed under the terms of the Creative Commons Attribution License (CC BY). The use, distribution or reproduction in other forums is permitted, provided the original author(s) and the copyright owner(s) are credited and that the original publication in this journal is cited, in accordance with accepted academic practice. No use, distribution or reproduction is permitted which does not comply with these terms.
*Correspondence: Mariana Madruga de Brito,  bWFyaWFuYS5icml0b0B1ZnouZGU=