 Bowen He
 Han Zheng2
- 1Department of Civil and Environmental Engineering, Vanderbilt University, Nashville, TN, United States
- 2Hefei University of Technology Design Institute (Group) Co Ltd., Hefei, China
- 3College of Civil Engineering, Hefei University of Technology, Hefei, China
The water-energy-food (WEF) nexus has emerged as a critical research interest to support integrated resource planning, management, and security. For this reason, many tools have been developed recently to evaluate the WEF nexus security and monitor progress toward the WEF-related sustainable development goals. Among these, calculating the WEF composite index model is critical since it can provide a quantitative approach to demonstrate the WEF nexus security status. However, the current WEF nexus index model framework needs to include the incorporation of governance indicators, neglecting the importance of governance in the WEF nexus framework. Thus, this article develops a new WEF nexus composite index model that incorporates governance indicators in each subpillar. The principal component analysis (PCA) is adopted to reduce the variables’ collinearity and the model’s dimensionality. A quasi-Monte Carlo-based uncertainty and global sensitivity analysis are applied to the index model to assess its effectiveness. Finally, the new WEF index model is applied to the 16 South African Development Community (SADC) countries as a case study. A critical synergy effect within the WEF nexus framework is identified that nations with better WEF governance ability tend to perform better in improving the WEF accessibility capability, suggesting the importance of governance in the WEF nexus security framework.
1 Introduction
Water, energy, and food (WEF) are critical resources for the development and survival of modern society. The global demand for water, energy, and food resources is expected to escalate tremendously in the forthcoming decade because of the rapid growth of the worldwide population and the increasing threat of climate change, such as occurrences of extreme weather events (He and Ding, 2021, 2023; He and Guan, 2021a, 2022a), as well as the unstable international-regional economic situation (Biggs et al., 2015). Although modern technology has been dramatically developed and improved to secure the WEF nexus’s stability for human general life wellbeing, it is believed that billions of people are still facing WEF insecurity, especially for those developing countries in the South Africa Development Community (SADC) region (United Nations, 2018; He et al., 2024). Thus, investigating and understanding the WEF nexus systematically is vital to helping local governments improve the WEF resources management capabilities and thus enhance WEF security efficiently (Scott et al., 2016).
Many different research methodologies have been applied to evaluate WEF nexus security. For example, risk assessment is one of the research methodologies that are widely adopted in environmental assessment and hazard mitigation evaluation and contributes to the critical WEF nexus evaluation (He and Guan, 2021b, 2022b). Specifically, Wa’el et al. (2018) presented a new risk-based approach to assess the impacts on household water, energy, and food consumption by seasonal variability. Wang et al. (2021) developed a Bayesian network (BN) model to construct a supply–demand risk assessment framework of the regional WEF nexus in the Beijing–Tianjing–Hebei region as a case study. Additionally, statistical and data analysis has also served as a critical method for understanding WEF nexus interrelationships. For instance, Ding et al. (2019) applied a data-driven statistical approach to evaluate WEF interrelationships among the essential water, energy, and food resources in the sub-Saharan Africa region. By using a cross-validated stepwise regression analysis in their statistical methodology, they successfully revealed that the insufficient access to WEF services and health outcomes of the population in the sub-Saharan Africa region is significantly impacted by poor governance and socioeconomic capacity instead of lack of primary resources (Ding et al., 2019).
Another critical WEF research methodology is developing a composite index model to spatially assess the WEF nexus security. The composite index model is a modeling methodology that combines numerous sub-indices that are related to the target theme to produce a final numeric index that can be used to quantify the final modeling output. The advantage of the composite index model is that it provides a quantitative method to quantify an abstract modeling concept, such as WEF nexus security, so that further research can be implemented, such as comparing WEF nexus security between countries. Thus, it has been widely adopted to evaluate a community’s social vulnerability and social fabric associated with natural hazards’ mitigation evaluations (Cutter et al., 2003; Camp et al., 2023; He, 2023; He et al., 2023a, 2023b). Additionally, the WEF index model is a critical concept that recognizes the interconnections and interdependencies among water, energy, and food systems to evaluate and manage these interlinkages. Specifically, the index can facilitate integrated planning and decision-making by considering the interactions and trade-offs between the water, energy, and food sectors. Moreover, the WEF index can help identify opportunities for resource efficiency and optimization to reduce water and energy consumption. Policymakers can use the WEF index to inform the development of policies and regulations that promote the sustainable management of water, energy, and food resources by understanding the trade-offs and synergies between these sectors. Thus, the WEF nexus and its index are critical concepts and tools to improve water, energy, and food security.
In terms of applying the composite index model to the WEF nexus security evaluation, Simpson et al. (2022) developed a WEF nexus index model to evaluate the WEF nexus security of the SADC countries. Their WEF index model selected 21 indicators from water, energy, and food subpillars to constitute the WEF nexus index from 87 water-energy-food-related variables and indicators. However, these 21 indicators only cover the WEF resources availability and accessibility aspects, neglecting the effectiveness of governance in the WEF nexus framework. Although their developed WEF nexus index model can be used as a testbed to support integrated resource planning and management, the current WEF nexus model still lacks critical information regarding governance in each subpillar. As previous research has successfully identified the importance of governance in determining the WEF nexus security for sub-Saharan African countries (Ding et al., 2019), we believe incorporating governance indicators in each of the subpillar is a critical step toward improving the comprehensiveness and validity of the current WEF nexus index model framework.
Thus, based on the literature review and research gap identified above, we propose a new WEF index model framework that incorporates a series of governance-related variables in each WEF subpillar, including water governance, energy governance, and food governance. The newly developed WEF nexus composite index model is designed with an inductive model structure with more governance-related variables compared to the current WEF nexus model framework. To overcome the collinearity caused by adding more governance variables in the model structure, the principal component analysis (PCA) is adopted to reduce the model dimensions and diminish the collinearity between individual variables. Additionally, to overcome the misrepresentation of the uncertainty associated with the WEF nexus index construction processes, uncertainty and global sensitivity analysis was conducted to assess the model’s effectiveness on the SADC application. Thus, the innovation of this study is incorporating more governance-related variables in the traditional WEF index model and adopting the principal component analysis (PCA) to reduce its dimension and conduct an uncertainty and sensitivity analysis to test its robustness. The detailed methodology regarding the WEF composite index model structure, construction steps, and uncertainty and sensitivity analysis algorithm are elaborated in the following methodology section.
Finally, based on the illustration above, this study is developed to further advance the current WEF composite index framework by incorporating governance indicators for each subpillar in the WEF nexus framework. This study presents a newly developed WEF nexus composite index model that incorporates a series of governance indicators in each water, energy, and food subpillar to enrich the current WEF composite index model framework. Additionally, we applied this newly developed WEF composite index model to the 16 developing countries of the South Africa Development Community (SADC) to understand the nexus interrelationships of the WEF framework from two dimensions. The first dimension is between water, energy, and food, which are core elements of the WEF nexus framework. The second dimension is between availability, accessibility, and governance, which contributes to the security of each WEF subpillar. Finally, an uncertainty and sensitivity analysis was conducted to evaluate the WEF nexus composite index model on the 16 SADC countries.
This article is organized as follows: Section 2 elaborates on the methodology of the PCA-based WEF nexus composite index construction procedure adopted in this study. Section 3 illustrates the results and discussions associated with the new WEF composite index model developed in this study. Moreover, the take-away of governance-related variables incorporated in the WEF nexus index model’s application on the 16 SADC countries, as well as the uncertainty and sensitivity analysis results, are elaborated in this section. Section 4 delivers the conclusion and future research direction.
2 Study area
In the context of the 16 Southern African Development Community (SADC) countries in the South Africa region, the water-energy-food (WEF) index holds significant implications for understanding and addressing the complex challenges facing the region. Given the region’s vulnerability to climate variability and change, climatological factors play a critical role in shaping water availability, energy production, and food security across these countries. The WEF index provides a valuable framework for assessing the interconnections between water, energy, and food systems in the region, highlighting the need for integrated and sustainable approaches to resource management. In this context, the WEF index can help identify climate-related risks and vulnerabilities within the nexus, guiding the development of policies and strategies to enhance resilience and adaptability. By integrating climatological data and modeling approaches specific to the SADC region, the WEF index facilitates evidence-based decision-making and promotes coordinated action among member countries to address common challenges related to water, energy, and food security. Ultimately, the WEF index serves as a tool for promoting regional cooperation and fostering sustainable development in the face of climate change impacts in the SADC region. Thus, we selected the 16 SADC countries in the South Africa region as our study region.
2.1 South African development community nations
Figure 1 shows the 16 Southern African Development Community (SADC) countries that serve as the case study area in this study. The Southern African Development Community (SADC) is an intergovernmental organization that aims to further the regional socioeconomic, political, and security cooperation and integration among its member countries. It consists of 16 member countries, including Angola, Botswana, Comoros, Democratic Republic of the Congo, Eswatini, Lesotho, Madagascar, Malawi, Mauritius, Mozambique, Namibia, Seychelles, South Africa, Tanzania, Zambia, and Zimbabwe. The total area of the SADC countries is reported as around 3,734,651 square miles, and the total population is around 363,222,621 to the year 2020 (World Bank, 2021b,c). The total GDP of the area is around $597.8 billion, leading to $1,649 as the GDP per capita (World Bank, 2021a). It is believed that the SADC nations are ideal study regions for assessing the WEF nexus index model since these countries share many natural resources and complicated political and social systems that influence the WEF nexus availability, accessibility, and security.
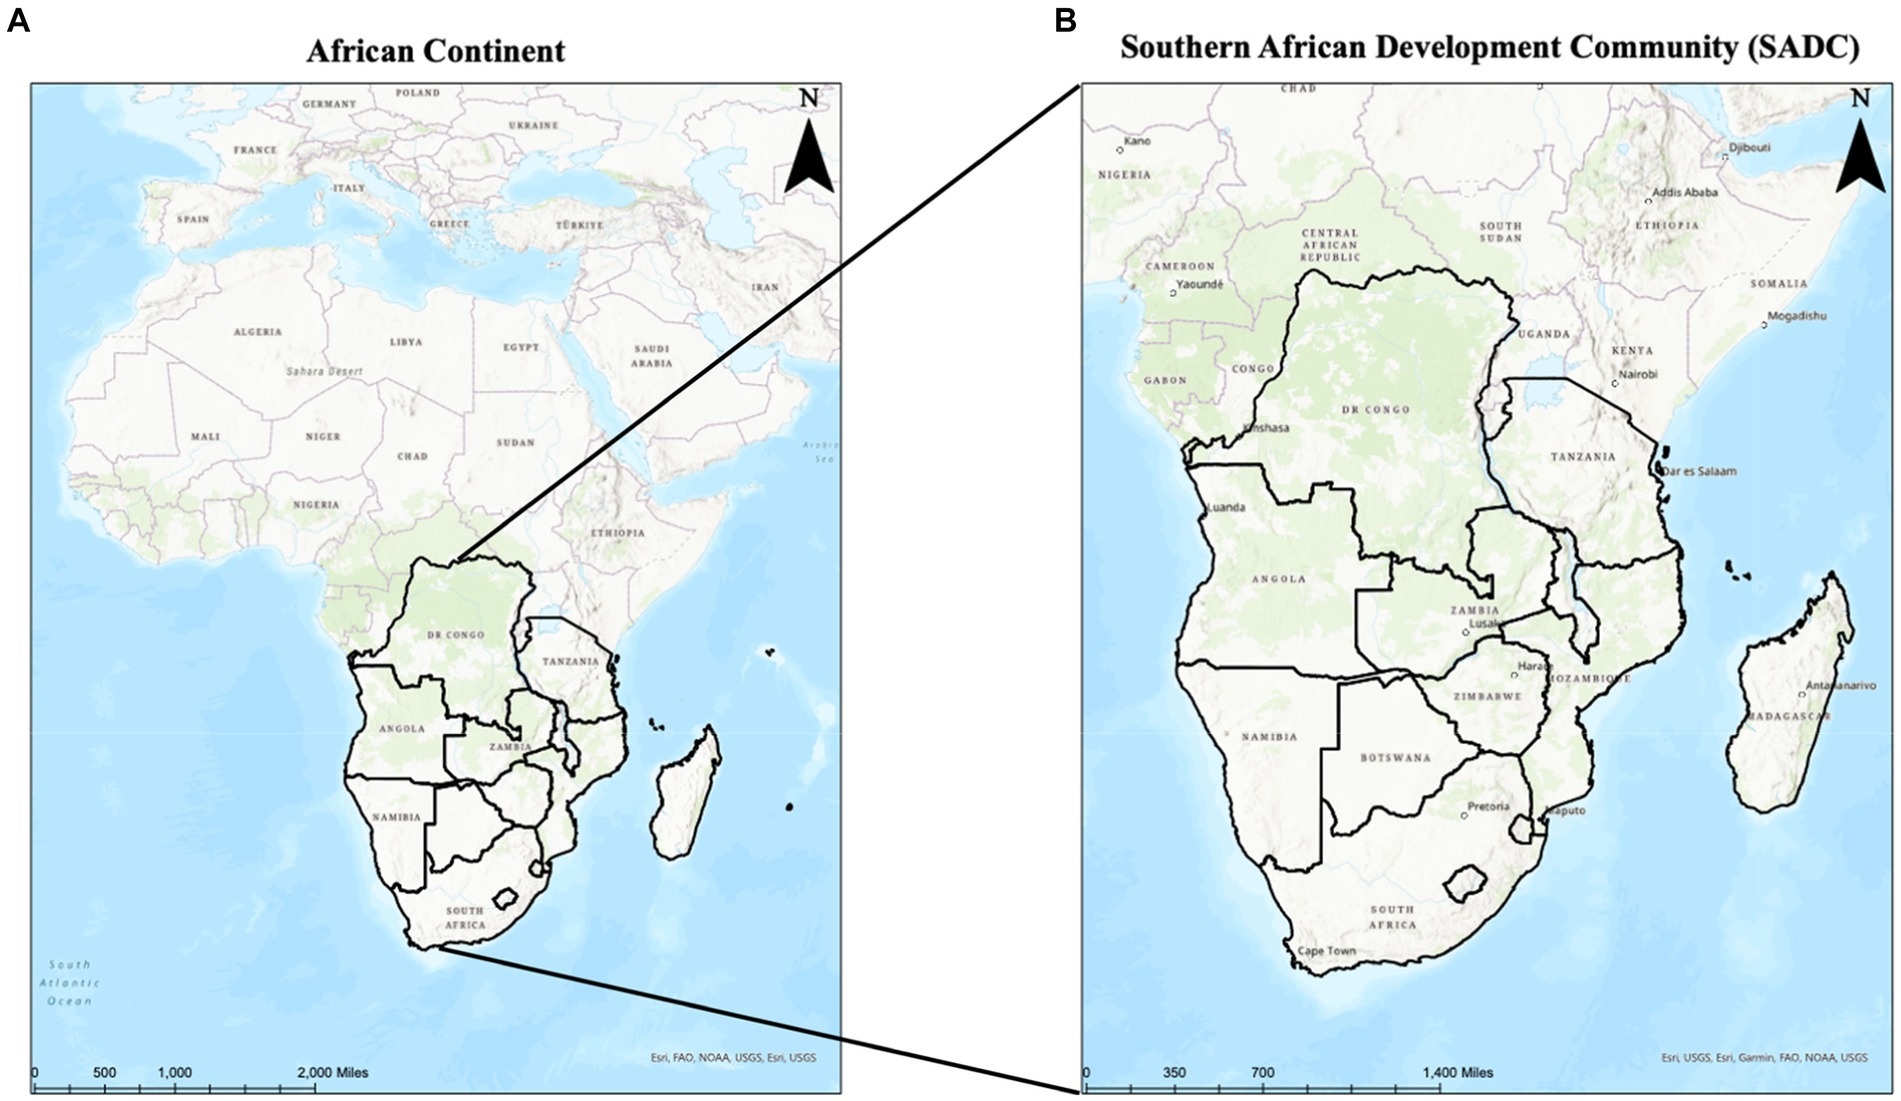
Figure 1. (A, B) Southern African Development Community (SADC).
3 Methodology
In this methodology section, we discuss the scope of the WEF nexus index model, the inductive index model design, and its construction process, as well as the quasi-Monte Carlo-based uncertainty and global sensitivity analysis simulation approach. Additionally, we applied the proposed WEF index model to the 16 SADC nations as a case study. The detailed research procedure is exhibited in Figure 2.
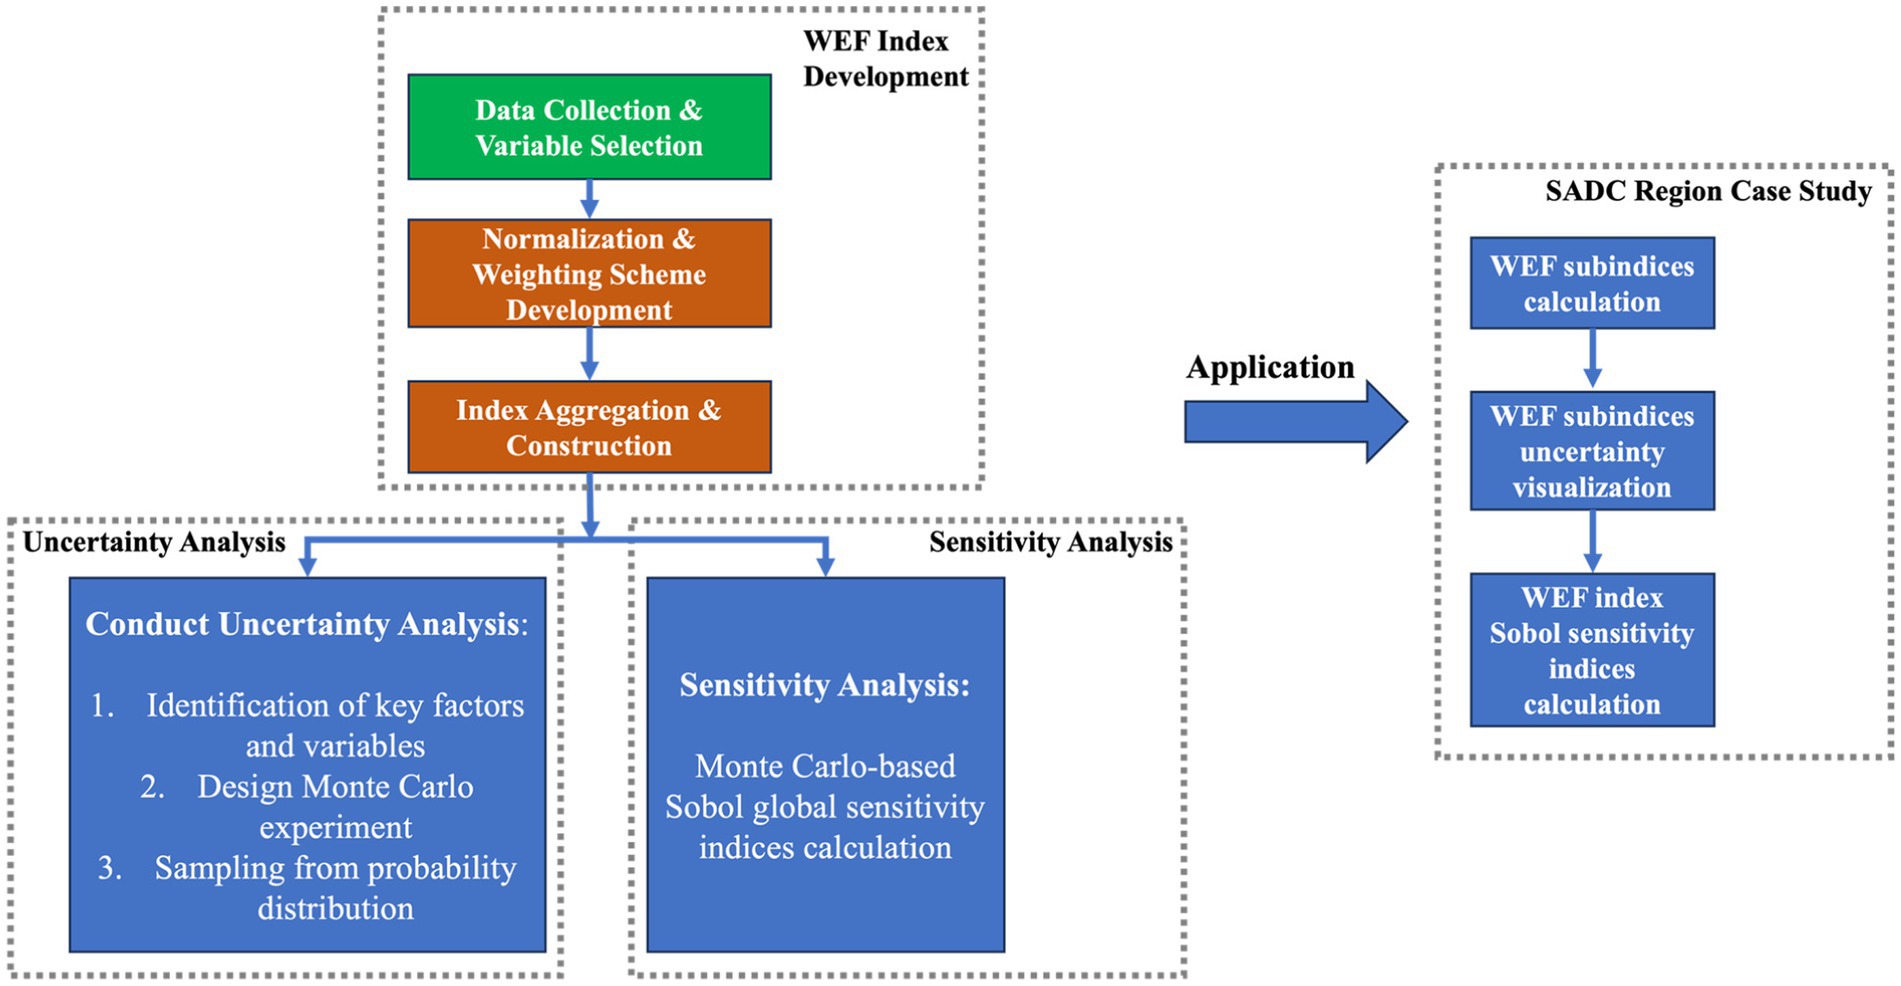
Figure 2. Methodology and research activities within this study’s scope.
3.1 Scope of WEF index model
The scope of the WEF nexus index model proposed in this study is presented in Figure 3. Similar to the current WEF nexus model proposed in the study by Simpson et al. (2022), the new WEF nexus composite index model developed in this study consists of three critical subpillars: W (water), E (energy), and F (food). Different from the previous WEF index model, in addition to the WEF availability and accessibility dimensions, the new WEF index model incorporates a new governance dimension in each of the subpillars, including water governance, energy governance, and food governance. The governance-related indicators describe the impacts and support from government and local authorities on the WEF resources management and planning, which has been verified by a previous study (Ding et al., 2019) to play a more critical role in determining a nation’s WEF security. Taking water governance as an example, we incorporated an indicator that measures water and sanitation-related official development budget that is part of a government-coordinated spending plan from the World Bank (2023). This indicator can provide a good description of how much public assistance resources have been put into improving the water and sanitation services, which can certainly influence a nation’s water availability and accessibility. Similarly, in the energy governance section, we incorporated governance-related indicators such as energy import and export variables since a government’s support for energy export and import businesses certainly influences a nation’s energy availability and accessibility. For the food governance section, indicators such as the allocation of the government budget for the implementation of the national nutrition plan, strategy, or policy are included. In summary, a total of 103 individual indicators are selected to be included in the WEF nexus model, among which 41 indicators are governance-related indicators in each of the subpillars. For the SADC case study, the latest available indicators were retrieved to produce the WEF nexus index. It should be noted that for some of these indicators, data are not available for all the SADC nations. Thus, the mean value is adopted to fill in the missing data, and k-means categorization is used to interpolate the missing data if the indicator is binary. For the inductive model that begins with a large number of individual indicators, a PCA analysis-based index construction structure can be vital to diminish the number of initially correlated individual indicators. The WEF composite index model construction and calculation procedure are elaborated on in the following section.
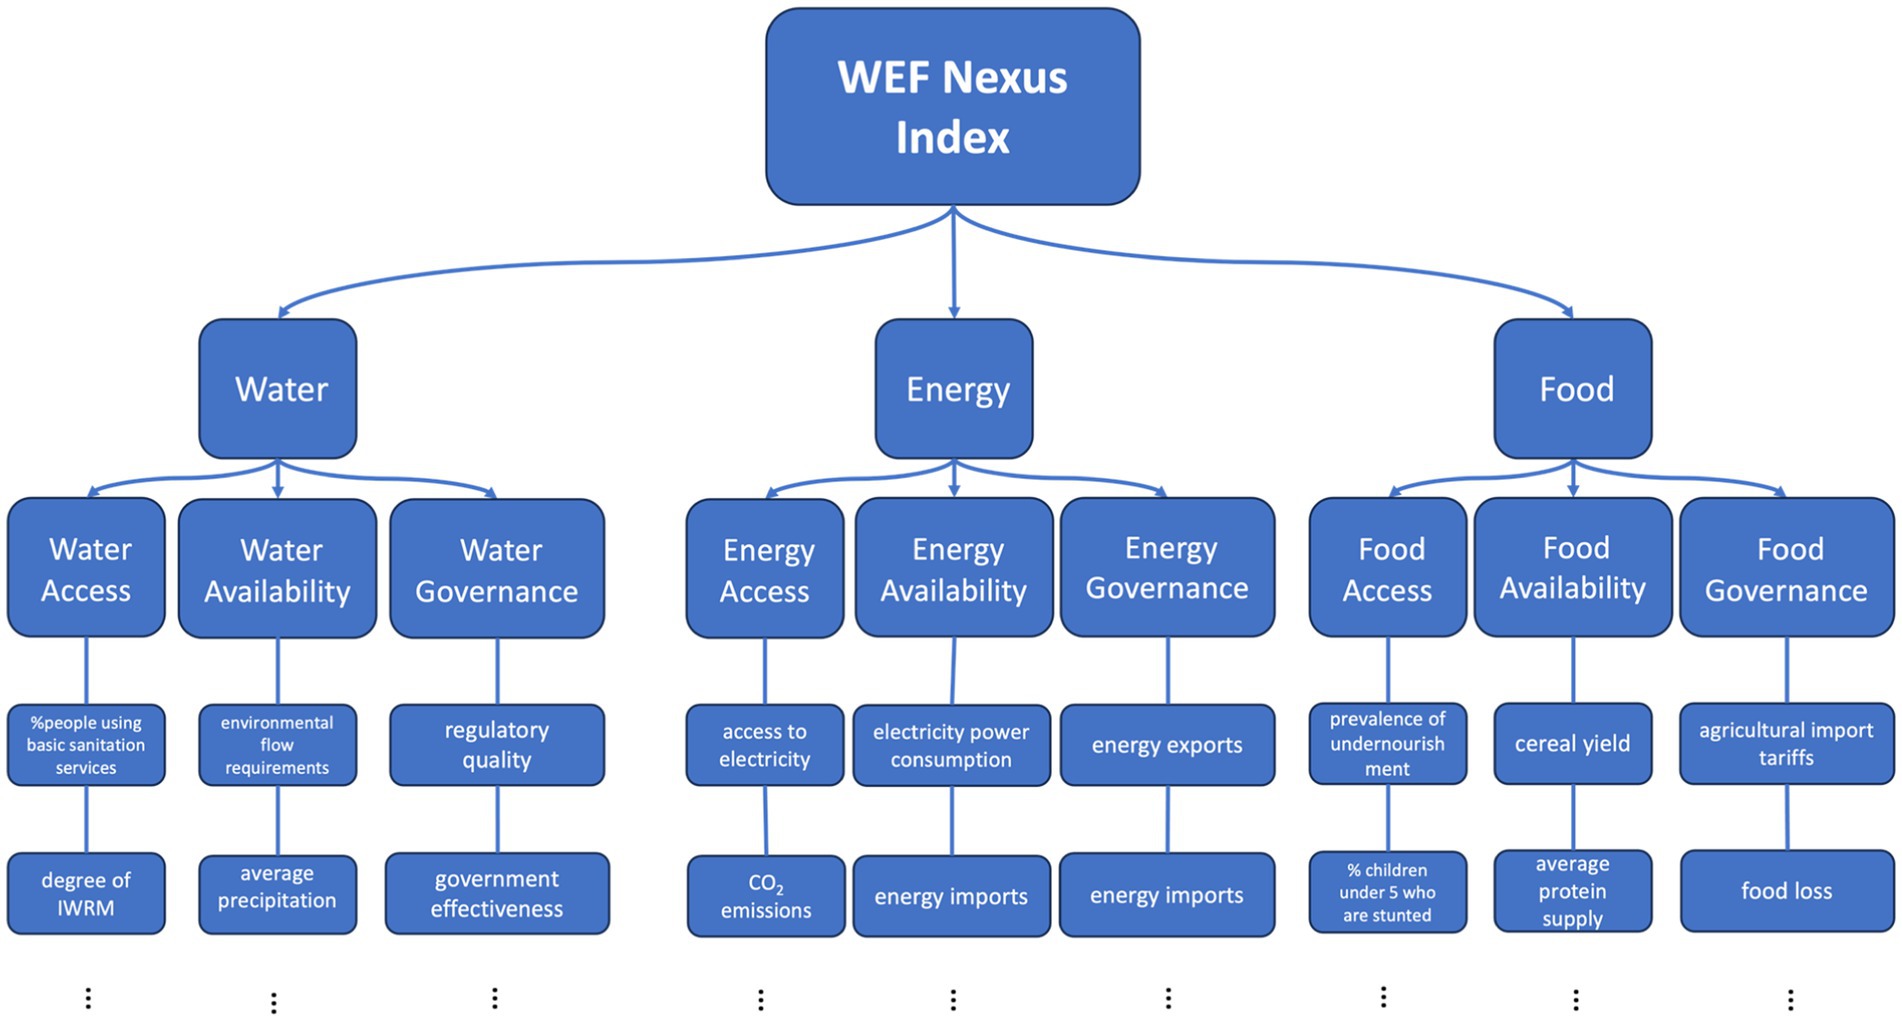
Figure 3. Scope of WEF composite index model.
Detailed information regarding each selected individual indicator included in the new WEF composite index model proposed in this study is shown in the Supplementary material.
3.2 Composite index construction structure and procedure
The governance-incorporated WEF nexus composite index model proposed in this study adopts an inductive index model design. As shown in Figure 4, the inductive model structure begins with a large set of individual variables, which are aggregated into a smaller group of orthogonal latent factors using principal component analysis. Then, the principal component factors are usually finalized into a numeric index to quantify the abstract modeling object (Figure 4). The inductive model structure has been applied in modeling many research interests, such as the social vulnerability index (Cutter et al., 2003) and the social fabric index (Camp et al., 2023; He et al., 2024).
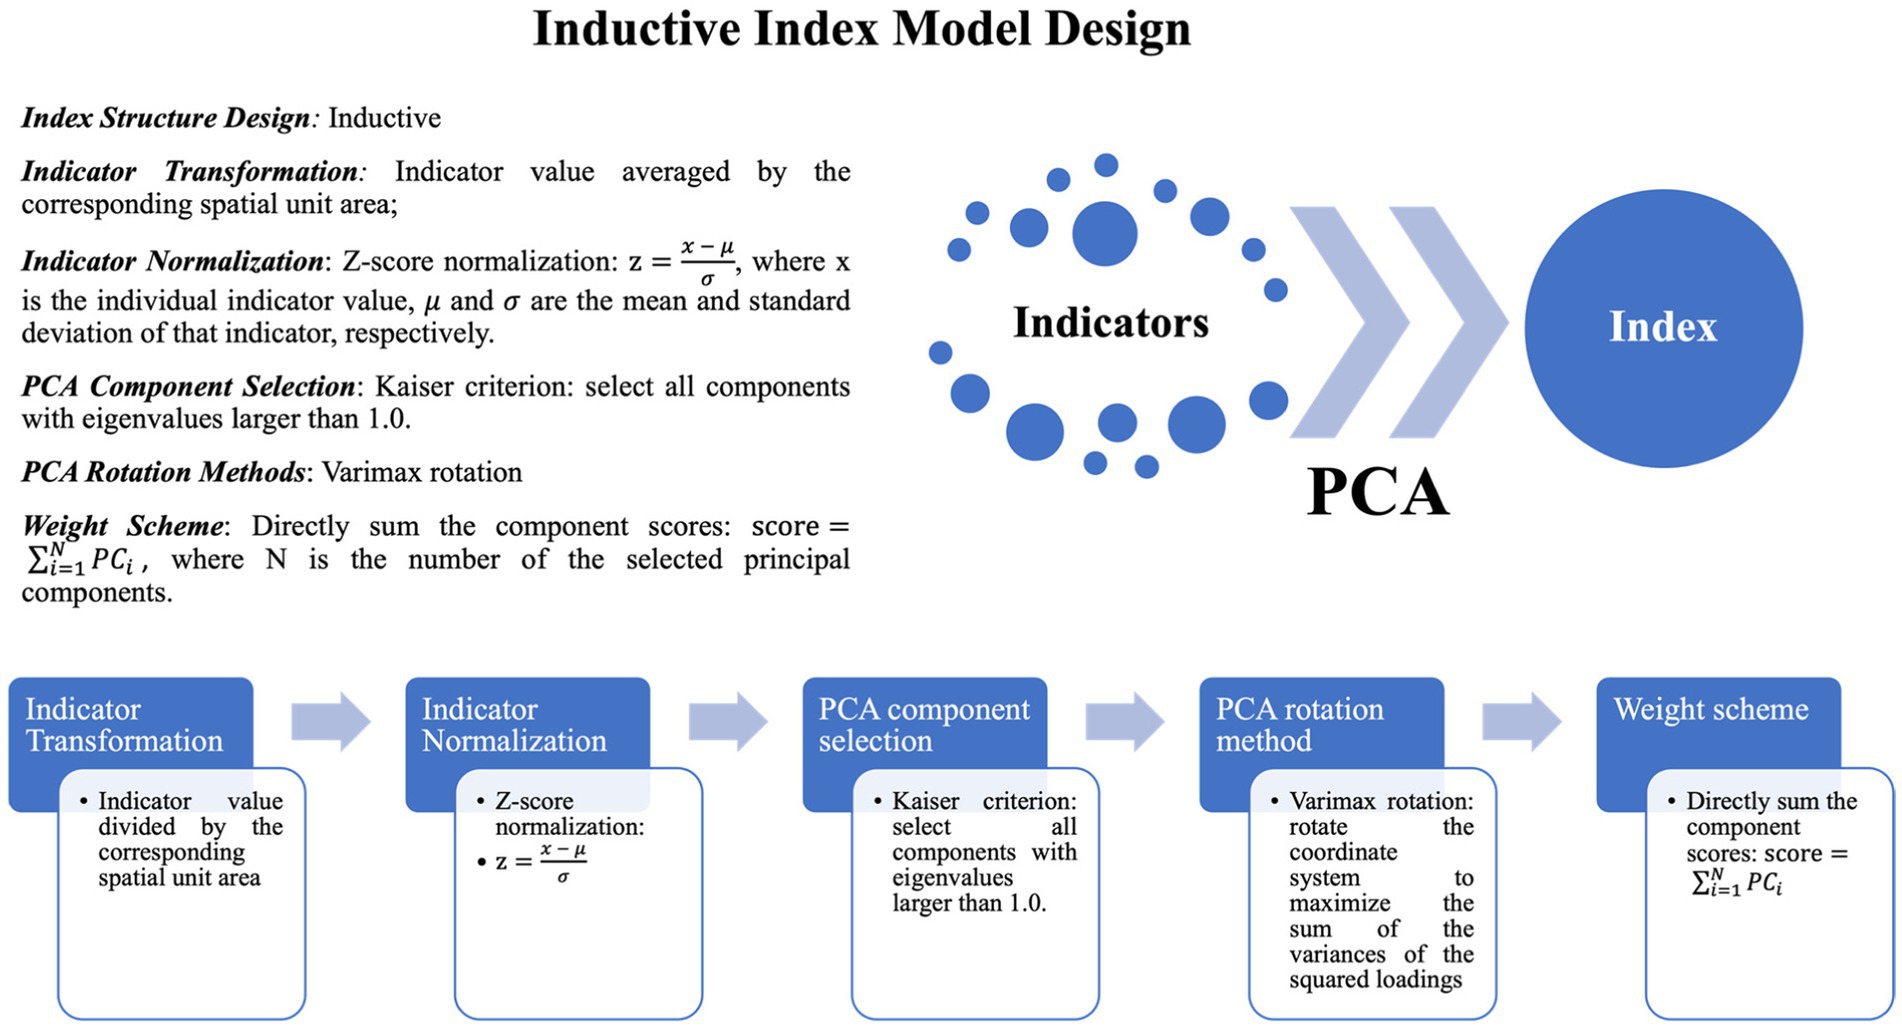
Figure 4. Inductive index model design proposed in this study.
Here, as for the WEF nexus composite index model, Figure 4 displays the proposed model construction structure, which requires a series of index construction steps to transform these individual WEF nexus variables to form the final index. Specifically, based on Figure 4, the selected variables are first transformed by their spatial unit area to eliminate the impact of the measuring area. Then, the transformed indicators are normalized by the z-score calculation algorithm to measure their deviations from the mean based on the Gaussian assumption. The PCA-based analysis procedures that include the process of PCA component selection and rotation are implemented to produce and select a certain number of the orthogonal principal components that are produced by the originally correlated variables. Finally, the selected principal components are directly summed up to form the final index value. Nonetheless, it should be noted that there are alternative approaches associated with each of the WEF index construction calculation steps, and different combinations of these alternatives can cause variability in the model’s final output. This is called the model’s aleatoric uncertainty, which accounts for the natural variation of inputs and parameters. Thus, conducting an uncertainty and sensitivity analysis is critical and is elaborated in the following section. Detailed information regarding the principal components associated with the proposed WEF nexus index model’s application on the SADC nations is included in the Supplementary material.
3.3 Uncertainty and global sensitivity analysis
In this study, the proposed governance-incorporated WEF nexus composite index model is subjected to an uncertainty and global sensitivity analysis. Figure 5 shows the index construction alternatives associated with each model construction step of the proposed WEF nexus index. For instance, the individual variables can either be directly put into the calculation process or averaged by area of the country. Then, these variables can be normalized by different normalization algorithms that include no normalization, z-score normalization, and min-max normalization. Table 1 summarizes the uncertain model factors in each WEF index construction step assessed in this study. The alternatives marked in the red italic fonts serve as the baseline WEF nexus index model. By evaluating the model’s output uncertainty caused by the different combinations of these construction alternatives using a quasi-Monte Carlo simulation experiment, the aleatoric uncertainty of the proposed WEF nexus composite index model can be comprehensively evaluated. To summarize, the purpose of conducting uncertainty analysis is to answer the following research questions: (a) How much uncertainty is associated with the WEF nexus index model? (b) What is the connection between the WEF nexus index model and uncertainty? Specifically, a 95% confidence interval was used as the uncertainty statistical metric to represent the WEF index model’s uncertainty quantification in this study.
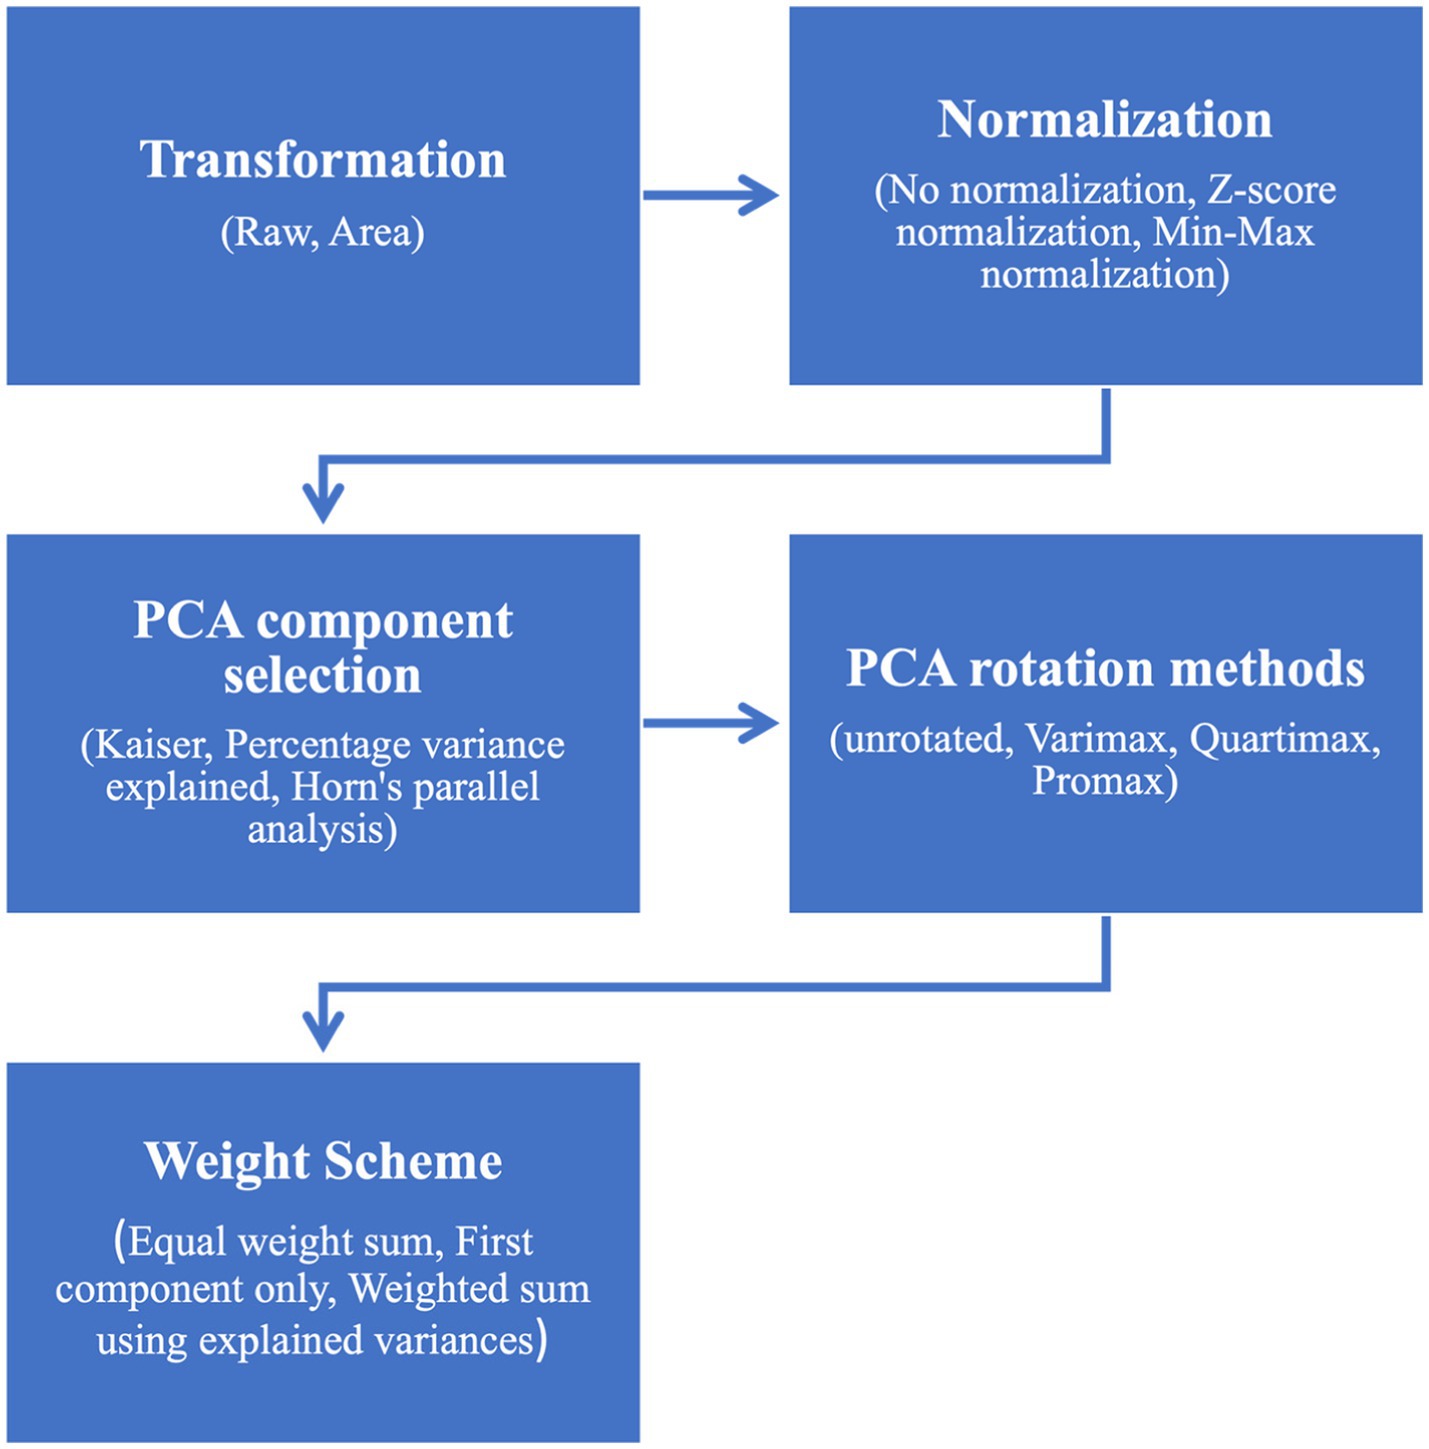
Figure 5. Diagram of WEF nexus composite index model construction alternatives assessed by uncertainty analysis.
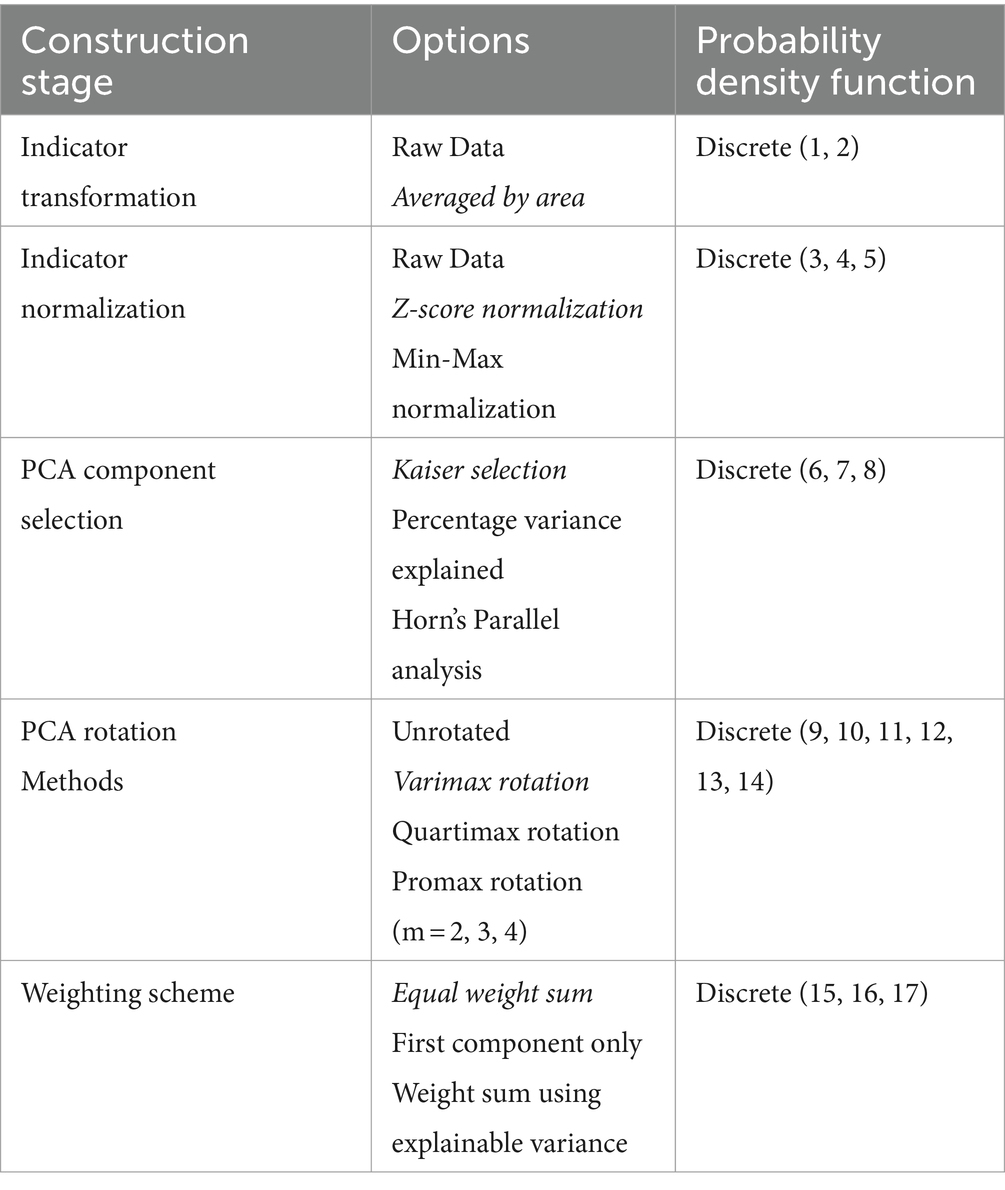
Table 1. Uncertain WEF nexus model factors.
Another essential piece is to understand which modeling decision contributes the most to the model’s uncertainty. The variance-based global sensitivity analysis is considered an appropriate approach to decompose the uncertainty contributions to the model’s final output from each construction step. Two sensitivity indices were calculated in this study: the first-order sensitivity index and the total-order sensitivity index. The first-order sensitivity index measures the effects of varying a single uncertain factor, whereas the total-order sensitivity index measures the variance’s contributions from each uncertain element and interactions between each other. Thus, the calculation of the two sensitivity indices can provide us with a comprehensive view of how the model’s output uncertainty is distributed between its uncertain factors.
To calculate global sensitivity indices, the estimator by Saltelli et al. (2010) was used to compute the first-order sensitivity index that unconditionally contributes to the model’s total output variability, which can be computed using equation 1. For more detailed mathematical derivation, refer Saltelli et al. (2010). Additionally, the total-order sensitivity index can be calculated using the method by Jansen (1999) (Equation 2) that considers interaction effects among all modeling uncertain factors. In Equations 1, 2, A and B are sampling matrices where any sampling point in either A or B sampling matrix can be indexed as , where and index the row and the column of the sampling matrices, respectively. The choice of the total-order estimator is based on the best practices identified in the study by Puy et al. (2020), and estimators for both first- and total-order sensitivity indices were reviewed by Chan et al. (2000).
In this study, we adopted Sobol’s approach (Sobol, 1967) of the quasi-Monte Carlo sampling algorithm to select the input factors. The computation of the sensitivity indices pair ( , ) requires 2 simulations for producing model output Y corresponding to matrices A, B, where N represents the sample size of A, B sampling matrices. N typically varies between 100 and 1,000, and it is set up as 29 in this study (Table 1). Additionally, computing model output Y from requires simulations, where indicates the number of the model’s uncertain factors that is five in this case (Figure 5). As a result, a total number of model evaluations are required to give a good description of the model sensitivities. It should be noted that all computations regarding the uncertainty and global sensitivity analysis computation procedure were implemented in the RStudio software. Table 2 displays detailed information regarding the experiment design of the global sensitivity analysis simulation conducted in this study.
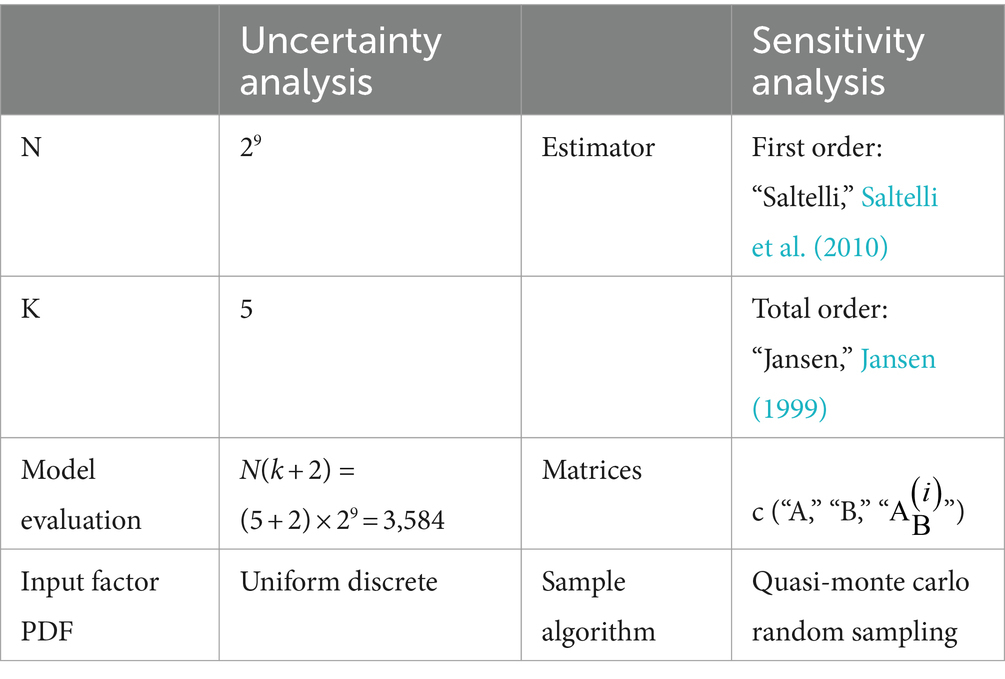
Table 2. Experiment design of global sensitivity analysis simulation.
Detailed information regarding the mathematical approach and derivation of the variance-based global sensitivity analysis algorithm is elaborated in the Supplementary material.
4 Results and discussions
The WEF nexus subindices have been calculated for the 16 SADC nations using the latest data available. Figure 6 displays the water-energy-food (WEF) subindices in the SADC region calculated using the WEF composite index construction structure and procedure elaborated above in the methodology section. For each of these subindices, only variables that are associated with that specific pillar or dimension were included to calculate the index. It should be noted that a more sophisticated and richer selection of WEF-related variables adapted in this WEF nexus composite index model makes producing a series of WEF-subindices possible. For instance, for the water subindex shown in Figure 6A, we only included all variables that are related to water availability, water accessibility, and water governance and excluded all variables that are related to energy and food subpillars. Taking another example of the WEF availability subindex shown in Figure 6D, only variables that are associated with the availability of each subpillar were incorporated in the model, including water availability, energy availability, and food availability. All variables that are related to accessibility and governance dimensions were excluded to produce the WEF availability subindex. Meanwhile, the transparency alpha value was adopted to reveal the uncertainty associated with each SADC nation’s subindex value. Specifically, an alpha value of 0 was used to present the nation’s subindex’s value with the largest confidence interval, while an alpha value of 1 was used to show the nation’s subindex’s value with the smallest confidence interval value. The benefit of this specific alpha setting is to enlarge the visual comparison between the smallest and largest confidence interval values presented on the map.
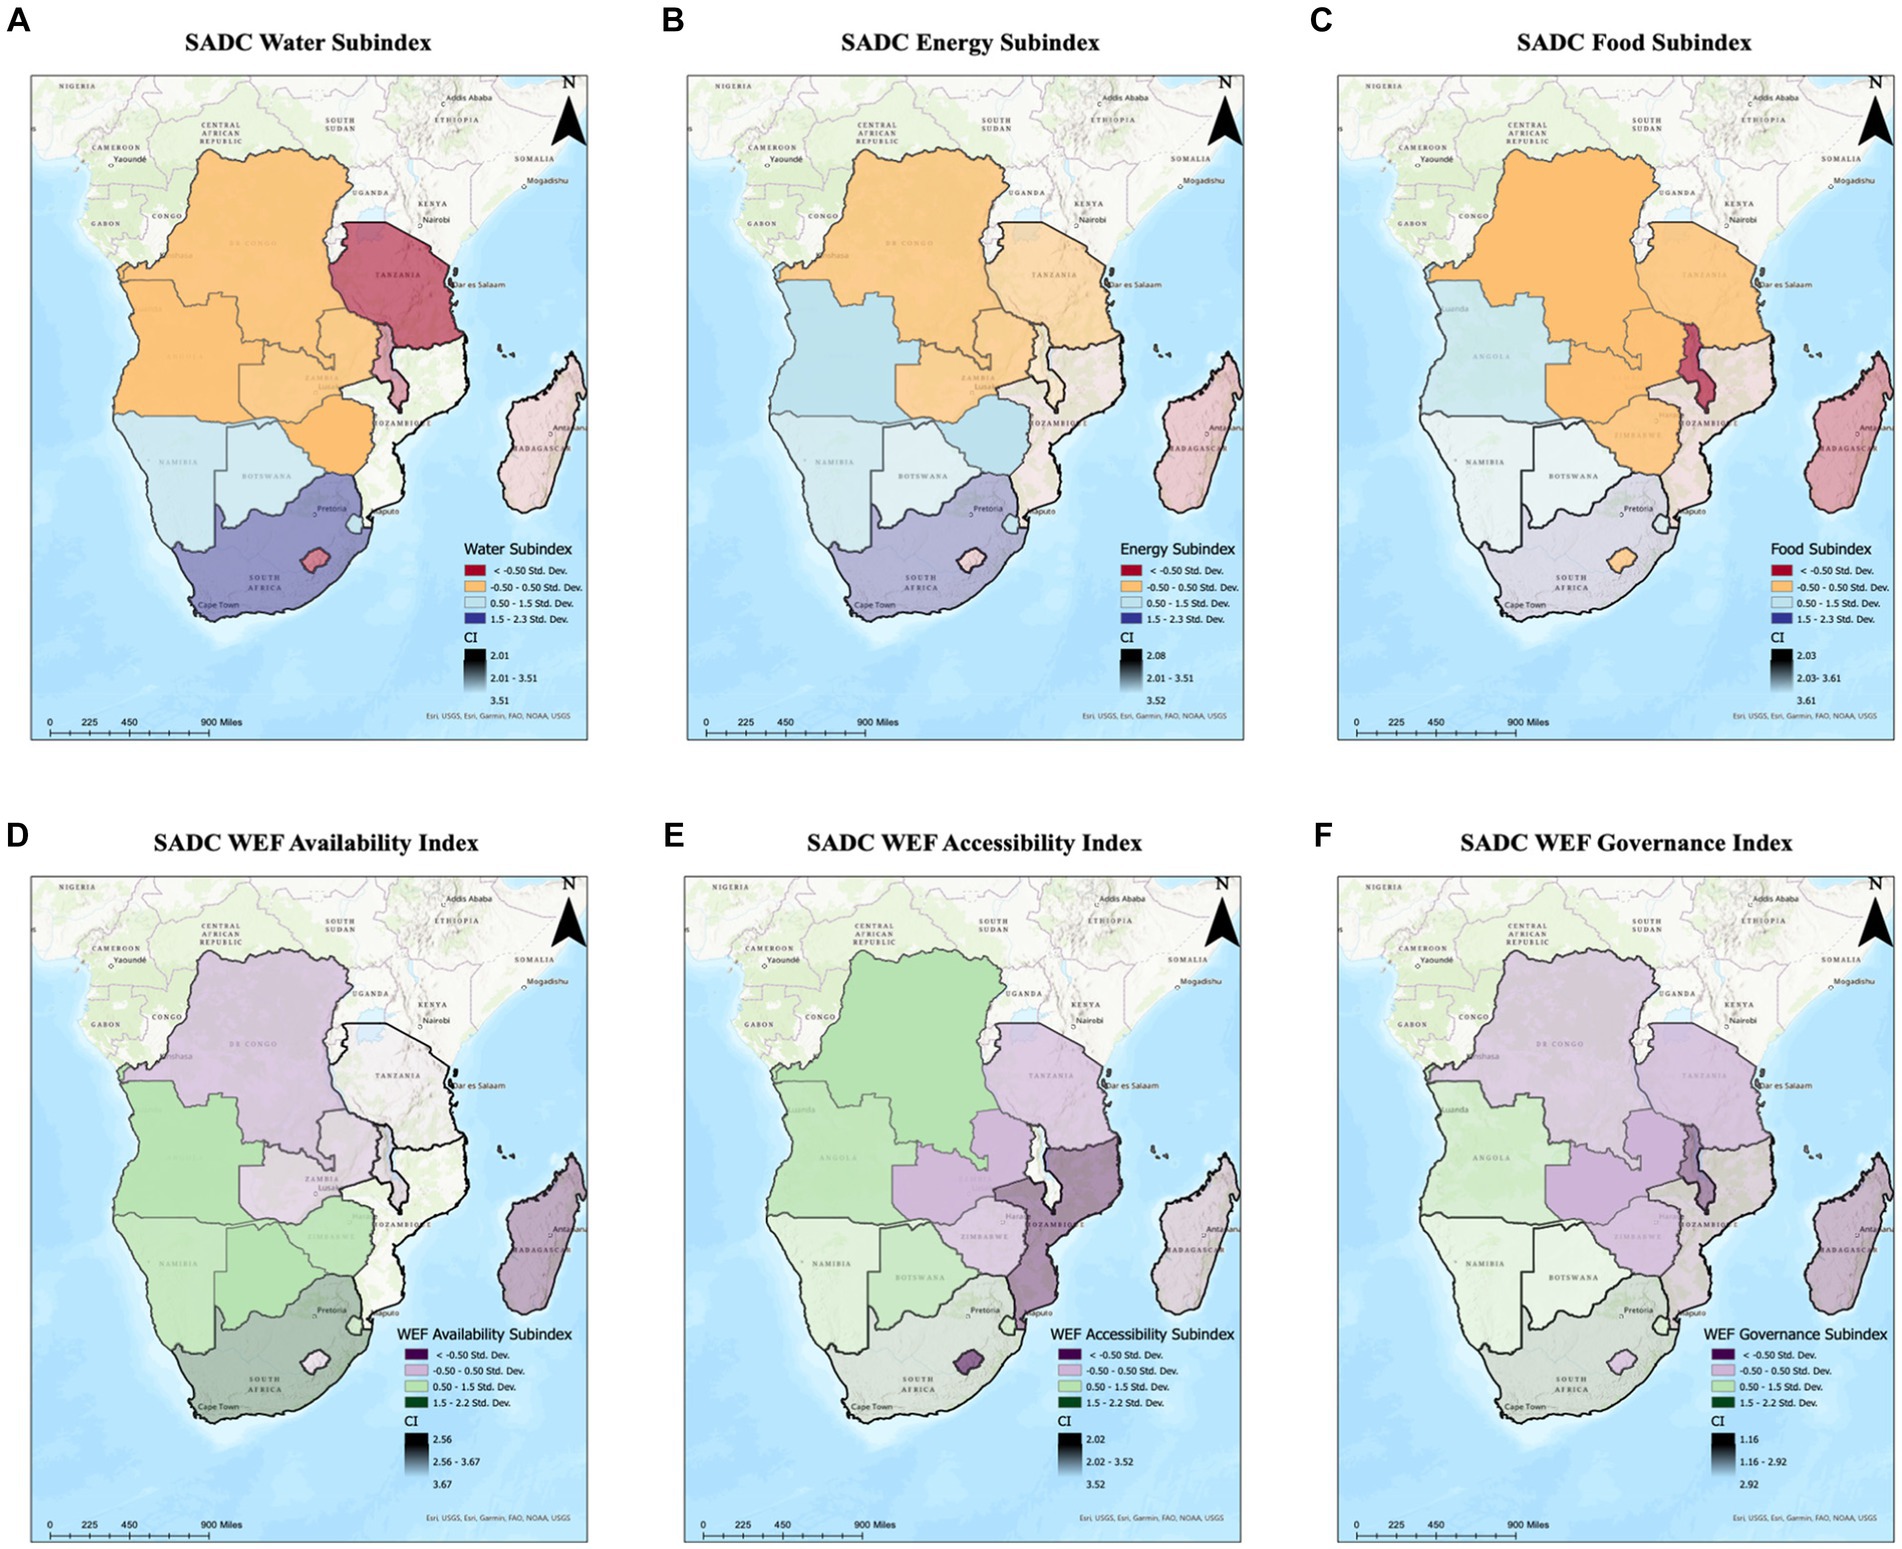
Figure 6. SADC WEF subindices: (A) water subindex; (B) energy subindex; (C) food subindex; (D) availability subindex; (E) accessibility subindex; (F) governance subindex.
The WEF nexus subindices values for 16 SADC nations are summarized in Table 3. While the WEF nexus indices themselves do not have a specific physical meaning, the comparison between nations can reveal the nation’s security in each water-energy-food subpillar and from management subindices perspective that consists of availability, accessibility, and governance. The WEF nexus index shows that the two highest-ranking SADC nations are Seychelles (59.61) and Mauritius (62.83), which echoes the previous WEF nexus index study by Simpson et al. (2022). Meanwhile, the two lowest-ranking WEF nexus indices show that Madagascar (38.92) and Mozambique (34.54) are the two nations that are currently facing severe WEF nexus security challenges. Specifically in the water subpillar, the nation with the highest pillar value is Mauritius (54.82), with Mozambique (11.82) having the lowest water pillar value. Similar results can also be recognized in energy and food subpillars that Mauritius (energy: 61.32; food: 62.94) and Seychelles (energy: 58.95; food: 60.24) are the highest in the ranking, while Madagascar and Mozambique are among the lowest ranking in energy and food subpillars. This again highlights the critical interactions and connections between WEF subpillars resources, in which any of the three resources within the WEF nexus tends to determine the security status of the other two resources for a nation.
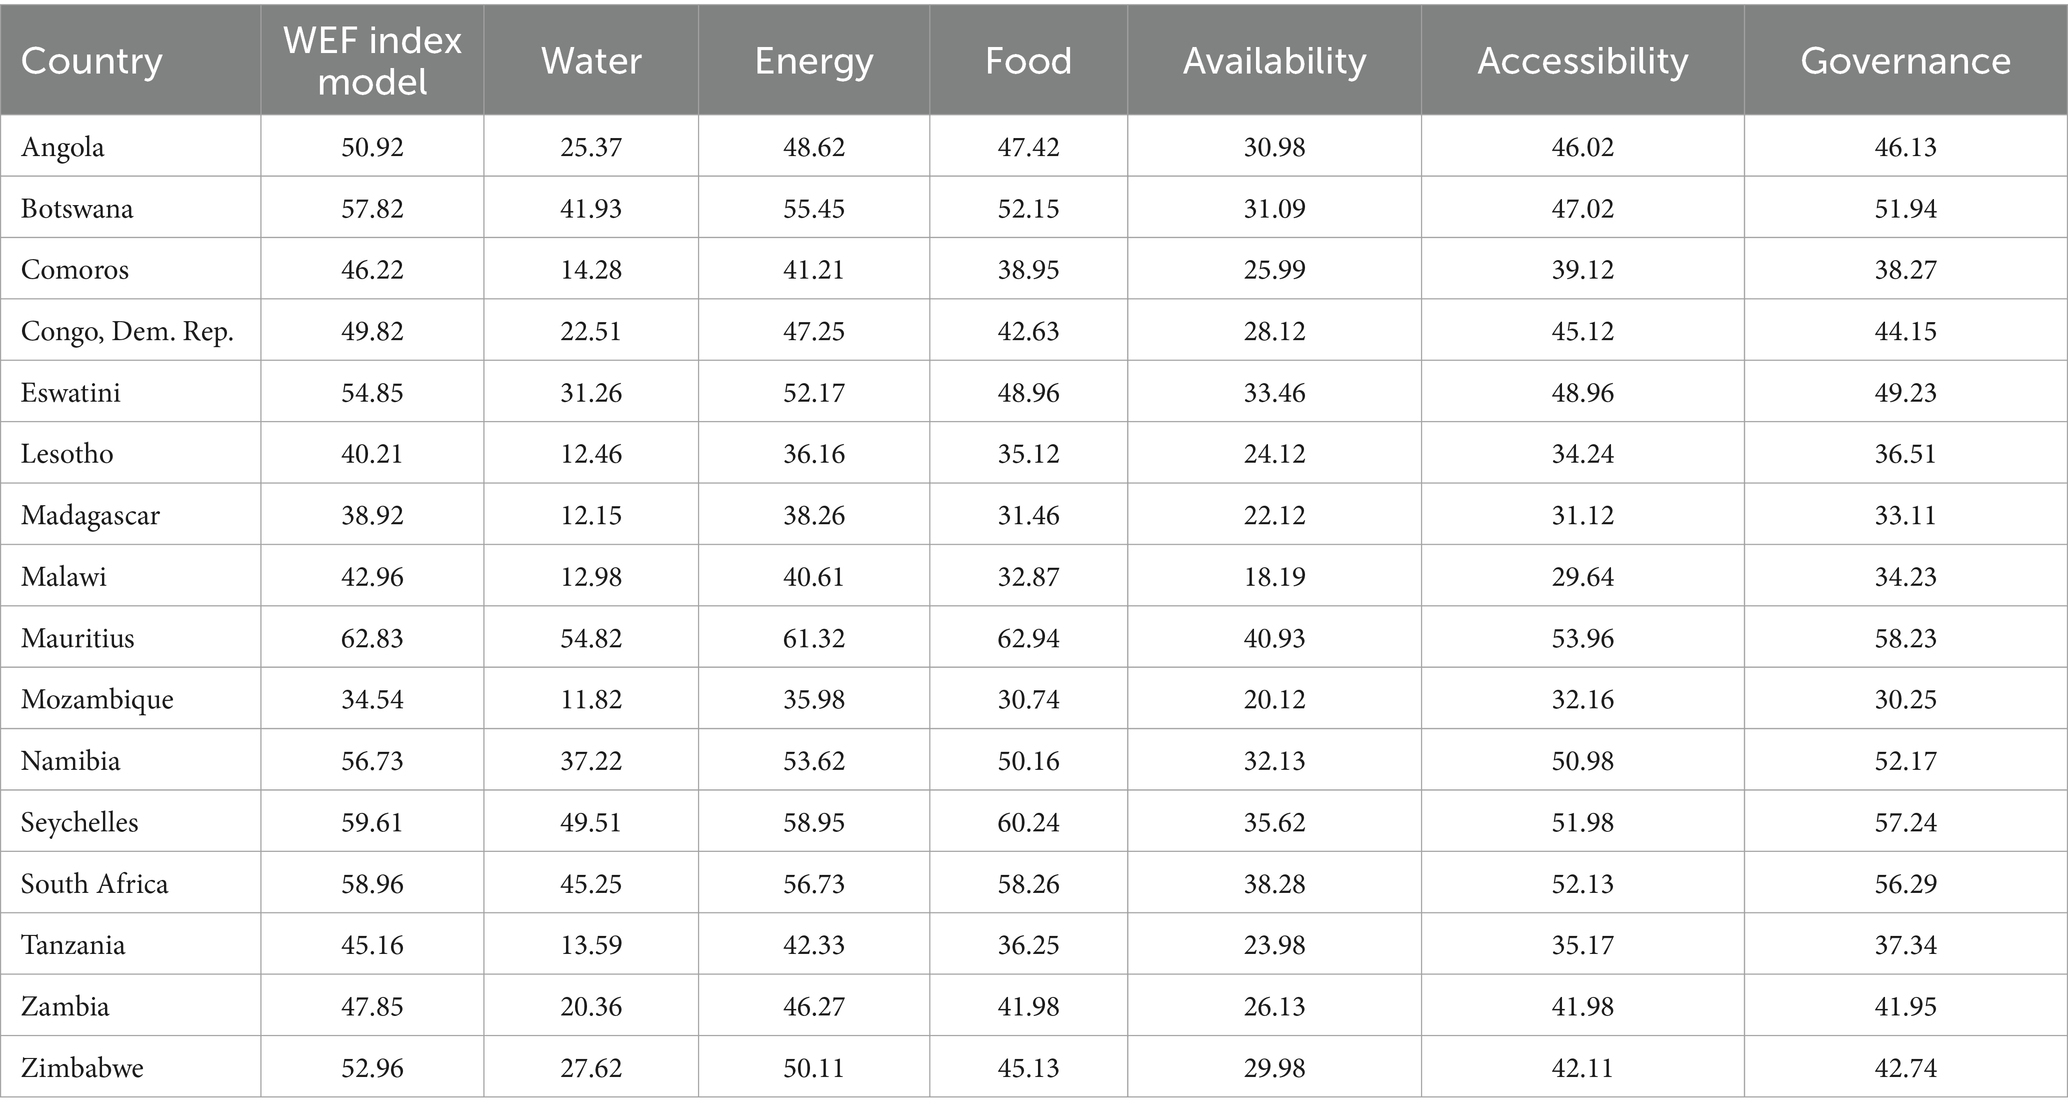
Table 3. WEF nexus subindices values for 16 SADC nations.
Taking another inspection at the management perspective of subindices that include availability, accessibility, and governance, similar results can also be identified. Mauritius (40.93) and South Africa (38.28) are among the highest ranking from the availability aspect. Meanwhile, Mauritius (accessibility: 53.96; governance: 58.23) and Seychelles (accessibility: 51.98; governance: 57.24) are the nations with the best WEF accessibility and governance. Additionally, an apparent positive relationship between governance and accessibility can be identified, and nations with high WEF governance subindex value also tend to have high WEF accessibility subindex value (Figure 7). This finding stresses the importance of a nation’s WEF governance ability to strengthen its accessibility to WEF resources, suggesting that strong synergistic effects also exist at the WEF nexus management level.
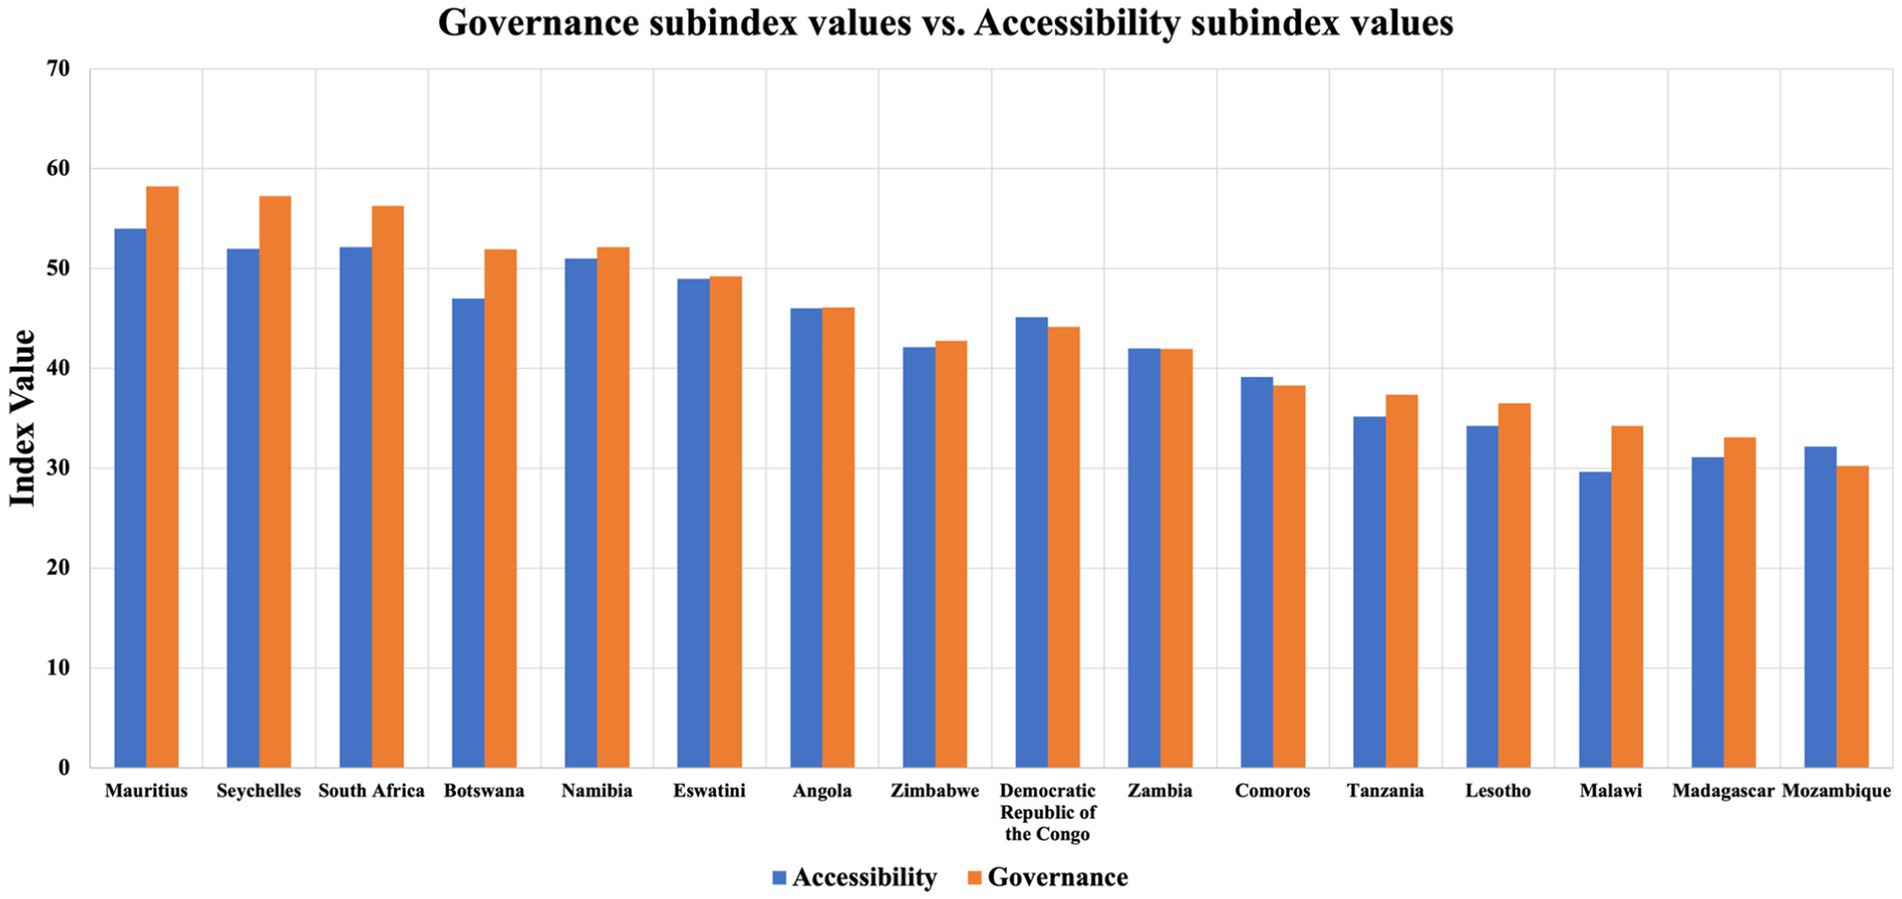
Figure 7. Governance subindex values and accessibility subindex values of 16 SADC nations.
Figure 6 also directly shows that the WEF nexus composite index model expresses different uncertainties to nations with different levels of WEF nexus security. Figures 6A–C shows the WEF resources subindices, in which nations with intermediate WEF nexus status, such as Congo and Angola, are visually opaquer than nations with either better (South Africa) or vulnerable (Madagascar) WEF nexus status. Interestingly, a similar pattern can be recognized in the WEF management subindices, shown in Figures 6D–F: nations with intermediate WEF management ability are more visually opaque than nations with better or vulnerable WEF management status. Specifically, a more detailed relationship is exhibited in Figure 6B, that model output variabilities first decrease with the increasing WEF nexus index rank and then increase again, suggesting that the WEF nexus subindices perform better at identifying intermediate WEF nexus status.
The comprehensive WEF composite index calculated for the SADC nations is shown in Figure 8A.
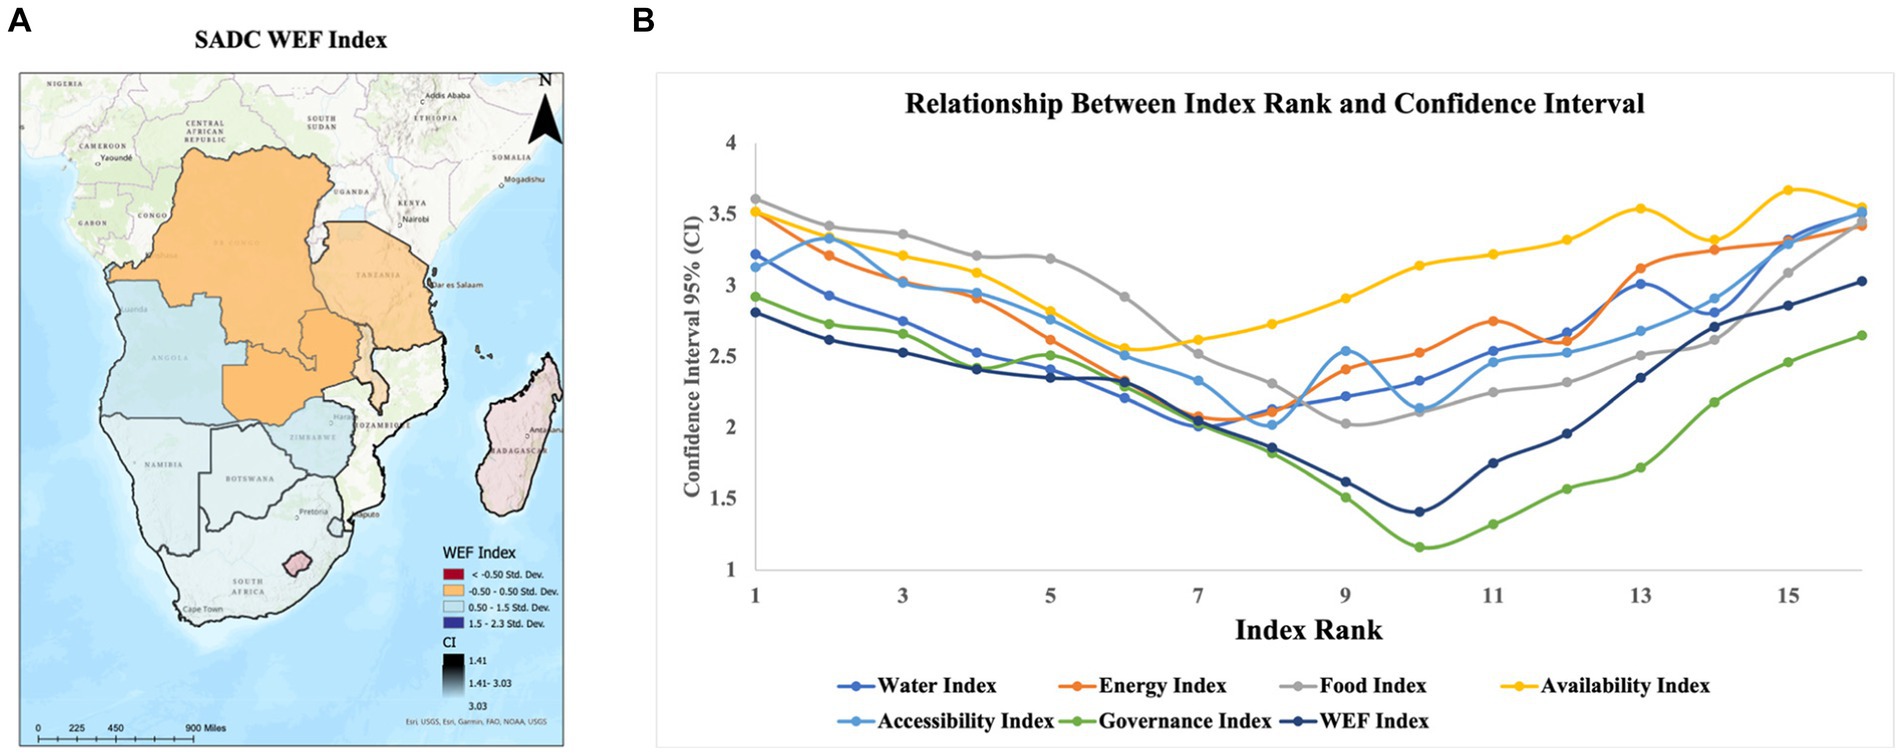
Figure 8. SADC WEF composite index (A) and relationship between WEF subindices rank model and 95% confidence interval (CI) (B).
The uncertainty analysis results are revealed in Figure 8B by showing the confidence interval that is used to quantify the WEF subindices’ uncertainties. Figure 8B exhibits the relationship between the WEF subindices rank model and 95% confidence interval (CI). A total of 7 WEF subindices suggest a similar relationship with their associated confidence interval that the WEF subindices model is more confident in identifying nations with intermediate WEF nexus security rather than nations with delicate or vulnerable WEF nexus security. As shown in Figure 8B, the confidence interval first decreases with the increasing of the WEF subindices’ rank to reach the minimal around the intermediate rank of the WEF subindices and then increases again, suggesting that the WEF nexus indices developed in this study should be better adopted as a tool to filter the regions/nations with intermediate WEF nexus security rather than directly identifying regions/nations with superior or vulnerable WEF nexus security status. After the regions/nations with intermediate WEF nexus security are identified, further investigation can be conducted to better recognize regions/nations with vulnerable WEF nexus security status. This finding also echoes previous composite index model studies in community social vulnerability (Tate, 2013) and social fabric research area (He et al., 2024).
Figure 9 reveals the uncertainty contributions by each WEF composite nexus index construction step. Specifically, the uncertainty contributions are evaluated by the first- and total-order sensitivity indices pair values. Figure 9A displays the first- and total-order sensitivity indices pair for the WEF index model, and Figure 9B displays the sensitivity indices pair for the WEF rank model. Although the sensitivity indices pair differs for the two WEF models, the pattern is similar and can be recognized. From Figure 9, the transformation and weighting schemes were recognized as the two essential construction parameters with high first- and total-order effects of sensitivity indices. This suggests that these parameters significantly influence the uncertainty of the WEF nexus index model. Here, we summarize the two important factors identified in the WEF index construction steps.
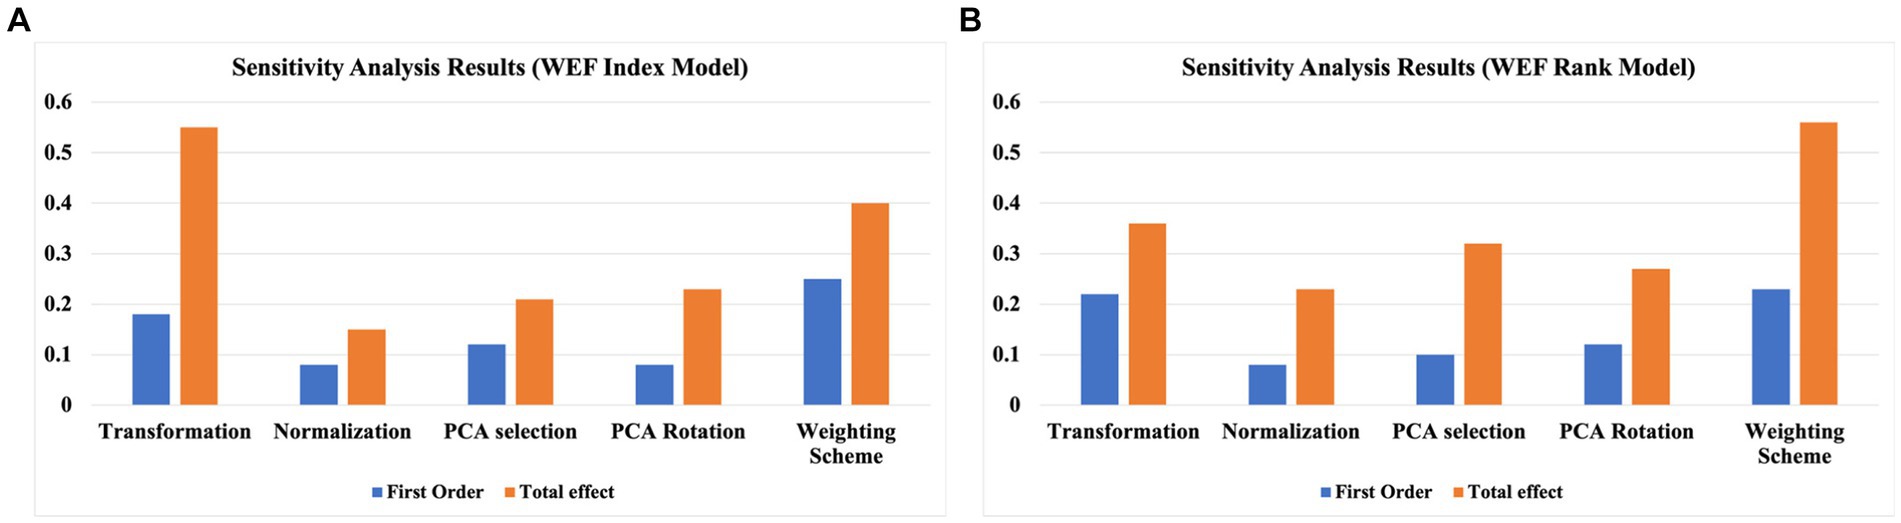
Figure 9. Sensitivity analysis results: (A) WEF index model; (B) WEF rank model.
Weighting Scheme Importance:
The sensitivity analysis results emphasize the critical role of the weighting scheme in determining the uncertainties of the WEF nexus index. It notes that uncertainties related to how the principals are weighted can absorb uncertainties contributed by previous steps and significantly affect the final index value.
Transformation Construction Step:
The transformation step, which is the normalization of variables by a nation’s area, is recognized as a factor affecting the variables inputted to form the final index value. The sensitivity analysis also indicates that transformation alternatives may contribute more uncertainties to heterogeneous areas.
The results found here that the weighting scheme is critical in determining the WEF nexus index’s uncertainties echo the previous finding in the WEF nexus model developed by Simpson et al. (2022). In the baseline version of the WEF composite index model, the WEF nexus index is aggregated by summing selected principals with an equal weighting scheme. Nonetheless, as the final construction step forms the index, uncertainties regarding how to weigh the principals can absorb the uncertainties contributed by the previous construction steps and thus tremendously affect the final index value. This might explain why the weighting scheme contributes significantly to the WEF nexus index’s uncertainties. In terms of the transformation construction step, whether normalizing variables by a nation’s area certainly affects the variables’ values that will be inputted to form the final index value. Figure 9 also exhibits that certain differences exist between first- and total-order sensitivity indices, indicating that there are significant interactions between each construction step and that the WEF nexus index model is highly mathematically non-linear. In conclusion, based on the analysis above, a WEF nexus model with the construction structure and procedure proposed in this study tends to contribute more uncertainties to the model’s final index value by the first and last construction steps, which are transformation and weighting scheme steps, respectively. We believe that understanding the uncertainties associated with each construction step, particularly regarding the weighting scheme and transformative alternatives, is crucial for accurately assessing the WEF nexus index, shedding light on developing the next-generation WEF and its implications for policy and decision-making. For instance, given the significant impact of the weighting scheme on the index’s uncertainties, a more robust and transparent weighting scheme should be developed. This could involve incorporating stakeholder input, expert opinions, or statistical methods to determine the relative importance of different components within each nexus (water, energy, and food). Sensitivity analyses could be conducted to assess the sensitivity of the index to variations in the weighting scheme. Additionally, the next-generation WEF index model should focus on the enhancement of transformation methods. Since the normalization of variables by a nation’s area can affect the final index value, exploring alternative transformation methods that better capture the heterogeneity of areas within nations could be beneficial. This might involve utilizing spatially disaggregated data or developing country-specific normalization techniques to account for variations in geographical characteristics.
5 Implications of WEF index
The implications of the water-energy-food (WEF) index are closely intertwined with climatology, as climatic factors play a fundamental role in shaping the dynamics of water, energy, and food systems (Sarker, 2022). The WEF index provides valuable insights into the interconnectedness of these systems and their vulnerabilities to climate variability and change. Climatology informs our understanding of how changes in temperature, precipitation patterns, and extreme weather events impact water availability, energy production, and agricultural productivity, which are key components of the WEF nexus (Sarker, 2022). By integrating climatological data and modeling approaches, the WEF index helps identify climate-related risks and vulnerabilities within the nexus, guiding the development of policies and strategies to enhance resilience and adaptability. Furthermore, the WEF index underscores the importance of considering climate considerations in decision-making processes related to resource management, highlighting the need for integrated and sustainable approaches that account for the complex interactions between climate and the WEF nexus. In essence, the WEF index serves as a tool to bridge the gap between climatology and resource management, facilitating informed decision-making and promoting resilience in the face of climate change impacts. Thus, developing a resilient and robust WEF nexus index model is critical to enhance environmental protection and fight climate change.
6 Conclusion and future direction
The present study adopts a PCA-based inductive index model structure to develop a spatial water-energy-food (WEF) nexus index that incorporates three dimensions associated with each WEF pillar: availability, accessibility, and governance. The PCA-based model structure enables the incorporation of a more significant number of individual variables and the elimination of those variables’ mutual collinearity. Thus, the creation of a series of subindices, such as the WEF water subindex and WEF energy subindex, is possible. Additionally, an uncertainty and sensitivity analysis was conducted to show that the developed WEF nexus index model can perform better at filtering intermediate WEF nexus status rather than directly identifying better or vulnerable WEF nexus status, and indicator transformation and weighting scheme are the two most critical index construction steps in determining the index model output variability. From the case study results, the conclusion can be reached that based on the WEF index model applications on the 16 SADC countries as a case study, both the WEF resources and management subindices reveal that strong synergy exists in the WEF nexus security system. Specifically, nations with better water security tend to have stronger energy and food security, and nations with better WEF governance capability tend to perform better at building secure WEF accessibility capability. Thus, the synergy effects can be better revealed in a series of WEF subindices based on the WEF nexus composite index model structure developed in this study.
While the present WEF nexus model framework developed in this study is a massive step toward a more comprehensive WEF nexus evaluation tool to help facilitate the WEF security assessment, the magnificent data requirements of the model are preventing its complete scaling in real-world applications. For instance, many governance variables need additional interpretation and interpolation that potentially causes more resources to build the index. Moreover, incorporating governance variables proposed in this study only partially solves the problem regarding the lack of political and social impacts on WEF resources security mentioned in the previous study by Simpson et al. (2022). As some of the governance variables are only indirectly related to political and social impacts, more data must be incorporated to reflect the influences on natural resource availability and management by political and social elements. Nonetheless, the current challenge is data availability since political and social impact variables can be confidential and hard to access in an open data source environment.
The future study aims to make every effort to build a solid and integrated water-energy-food (WEF) index model database that includes every variable needed to form the index. Meanwhile, such a database should include more nations and be updated more frequently so that a broader and more valid application of the WEF nexus model is possible.
Data availability statement
The original contributions presented in the study are included in the article/Supplementary material, further inquiries can be directed to the corresponding author.
Author contributions
BH: Conceptualization, Data curation, Formal analysis, Investigation, Methodology, Software, Visualization, Writing – original draft. HZ: Project administration, Supervision, Validation, Visualization, Writing – review & editing. QG: Project administration, Resources, Supervision, Writing – review & editing.
Funding
The author(s) declare that no financial support was received for the research, authorship, and/or publication of this article.
Conflict of interest
HZ was employed by Hefei University of Technology Design Institute (Group) Co Ltd.
The remaining authors declare that the research was conducted in the absence of any commercial or financial relationships that could be construed as a potential conflict of interest.
Publisher’s note
All claims expressed in this article are solely those of the authors and do not necessarily represent those of their affiliated organizations, or those of the publisher, the editors and the reviewers. Any product that may be evaluated in this article, or claim that may be made by its manufacturer, is not guaranteed or endorsed by the publisher.
Supplementary material
The Supplementary material for this article can be found online at:
https://www.frontiersin.org/articles/10.3389/frwa.2024.1338534/full#supplementary-material
References
Biggs, E. M., Bruce, E., Boruff, B., Duncan, J. M., Horsley, J., Pauli, N., et al. (2015). Sustainable development and the water-energy-food nexus: a perspective on livelihoods. Environ Sci Policy 54, 389–397. doi: 10.1016/j.envsci.2015.08.002
Camp, J., Gilligan, J., and He, B. (2023). The unintended consequences of flood mitigation along inland waterways–a look at resilience and social vulnerabilities through a case study analysis.
Chan, K., Tarantola, S., Saltelli, A., and Sobol, I. M. (2000). “Variance based methods” in Sensitivity Analysis. eds. A. Saltelli, K. Chan, and M. Scott (New York: Wiley), 167–197.
Cutter, S. L., Boruff, B. J., and Shirley, W. L. (2003). Social vulnerability to environmental hazards. Soc. Sci. Q. 84, 242–261. doi: 10.1111/1540-6237.8402002
Ding, K. J., Gunda, T., and Hornberger, G. M. (2019). Prominent influence of socioeconomic and governance factors on the food-energy-water nexus in sub-Saharan Africa. Earth's Future 7, 1071–1087. doi: 10.1029/2019EF001184
He, B. (2023). Efficient computational evaluation tools to accelerate the planning of vulnerability, resilience, and sustainability of the social-environmental Systems in the City of Nashville. Doctoral dissertation, Nashville, TN: Vanderbilt University.
He, B., and Ding, K. J. (2021). Localize the impact of global greenhouse gases emissions under an uncertain future: a case study in Western cape, South Africa. Earth 2, 111–123. doi: 10.3390/earth2010007
He, B., and Ding, K. J. (2023). Global greenhouse gases emissions effect on extreme events under an uncertain future: a case study in Western cape, South Africa. PLoS Clim. 2:e0000107. doi: 10.1371/journal.pclm.0000107
He, B., Gilligan, J. M., and Camp, J. V. (2023a). An index of social fabric for assessing community vulnerability to natural hazards: model development and analysis of uncertainty and sensitivity. Int. J. Disaster Risk Reduction 2023:103913. doi: 10.1016/j.ijdrr.2023.103913
He, B., and Guan, Q. (2021a). A mathematical approach to improving the representation of surface water–groundwater exchange in the hyporheic zone. J. Water Clim. Change 12, 1788–1801. doi: 10.2166/wcc.2020.162
He, B., and Guan, Q. (2021b). A risk and decision analysis framework to evaluate future PM2. 5 risk: a case study in Los Angeles-Long Beach metro area. Int. J. Environ. Res. Public Health 18:4905. doi: 10.3390/ijerph18094905
He, B., and Guan, Q. (2022a). Analysis and prediction of the correlation between environmental ecology and future global climate change. J. HFUT 6, 818–824.
He, B., and Guan, Q. (2022b). The statistical analysis and prediction associated with nuclear meltdown accidents risk evaluation. Int. J. Nuclear Saf. Secur. 1, 104–123. doi: 10.1504/IJNSS.2022.127918
He, B., Zheng, H., and Guan, Q. (2023b). Evaluation of future-integrated urban water management using a risk and decision analysis framework: a case study in Denver–Colorado metro area (DCMA). Water 15:4020. doi: 10.3390/w15224020
He, B., Zheng, H., Tang, K., Xi, P., Li, M., Wei, L., et al. (2024). A comprehensive review of lithium-ion battery (LiB) recycling technologies and industrial market trend insights. Recycling 9:9. doi: 10.3390/recycling9010009
Jansen, M. J. (1999). Analysis of variance designs for model output. Comput. Phys. Commun. 117, 35–43. doi: 10.1016/S0010-4655(98)00154-4
Puy, A., Becker, W., Piano, S. L., and Saltelli, A. (2020). The Battle of Total-order sensitivity estimators. arXiv, p. 1147
Saltelli, A., Annoni, P., Azzini, I., Campolongo, F., Ratto, M., and Tarantola, S. (2010). Variance based sensitivity analysis of model output. Design and estimator for the total sensitivity index. Comput. Phys. Commun. 181, 259–270. doi: 10.1016/j.cpc.2009.09.018
Sarker, S. (2022). Fundamentals of climatology for engineers: lecture note. Eng 3, 573–595. doi: 10.3390/eng3040040
Scott, C. A., Crootof, A., and Kelly-Richards, S. (2016) The urban water-energy nexus: drivers and responses to global change in the ‘urban century environmental resource management and the nexus approach: managing water, soil, and waste in the context of global change. Berlin: Springer, pp. 113–140.
Simpson, G. B., Jewitt, G. P., Becker, W., Badenhorst, J., Masia, S., Neves, A. R., et al. (2022). The water-energy-food nexus index: a tool to support integrated resource planning, management and security. Front. Water 4:825854. doi: 10.3389/frwa.2022.825854
Sobol, I. Y. M. (1967). On the distribution of points in a cube and the approximate evaluation of integrals, Zh. Vychislitel Noi Mat. Mat. Fiz. 7, 784–802.
Tate, E. (2013). Uncertainty analysis for a social vulnerability index. Ann. Assoc. Am. Geogr. 103, 526–543. doi: 10.1080/00045608.2012.700616
United Nations. (2018). About the sustainable development goals–United Nations sustainable development. New York: United Nations.
Wa’el, A. H., Memon, F. A., and Savic, D. A. (2018). A risk-based assessment of the household water-energy-food nexus under the impact of seasonal variability. J. Clean. Prod. 171, 1275–1289. doi: 10.1016/j.jclepro.2017.10.094
Wang, Y., Zhao, Y., Wang, Y., Ma, X., Bo, H., and Luo, J. (2021). Supply-demand risk assessment and multi-scenario simulation of regional water-energy-food nexus: a case study of the Beijing-Tianjin-Hebei region. Resour. Conserv. Recycl. 174:105799. doi: 10.1016/j.resconrec.2021.105799
World Bank. (2021a). GDP (current US$)-SADC. Available at: https://data.worldbank.org/indicator/NY.GDP.MKTP.CD?locations=ZA-BW-LS-NA-SZ-AO-KM-CD-MG-MW-MU-MZ-SC-TZ-ZM-ZW (Accessed Aug 20, 2023).
World Bank. (2021b). Land area (sq. km) - SADC. Available at: https://data.worldbank.org/indicator/AG.LND.TOTL.K2?locations=ZA-BW-LS-NA-SZ-AO-KM-CD-MG-MW-MU-MZ-SC-TZ-ZM-ZW (Accessed Aug 20, 2023).
World Bank. (2021c). Population, total – SADC. Available at: https://data.worldbank.org/indicator/SP.POP.TOTL?locations=ZA-BW-LS-NA-SZ-AO-KM-CD-MG-MW-MU-MZ-SC-TZ-ZM-ZW (Accessed Aug 20, 2023).
World Bank. (2023). World bank open data. Available at: https://data.worldbank.org/indicator/ (Accessed Aug 17, 2023).
Keywords: water-energy-food nexus, governance indices, inductive composite index model, principal component analysis, uncertainty and sensitivity analysis, South Africa development community
Citation: He B, Zheng H and Guan Q (2024) Toward revolutionizing water-energy-food nexus composite index model: from availability, accessibility, and governance. Front. Water. 6:1338534. doi: 10.3389/frwa.2024.1338534
Edited by:
Alison Parker, Cranfield University, United KingdomReviewed by:
Hassan Azarm, Shiraz University, IranShiblu Sarker, St. Johns River Water Management District, United States
Copyright © 2024 He, Zheng and Guan. This is an open-access article distributed under the terms of the Creative Commons Attribution License (CC BY). The use, distribution or reproduction in other forums is permitted, provided the original author(s) and the copyright owner(s) are credited and that the original publication in this journal is cited, in accordance with accepted academic practice. No use, distribution or reproduction is permitted which does not comply with these terms.
*Correspondence: Bowen He, Ym93ZW4uaGVAdmFuZGVyYmlsdC5lZHU=,