 Sara Blanco-Ramírez
 Ilja van Meerveld
 Alejandro Camargo
 Jan Seibert
- 1Department of Geography, University of Zurich, Zürich, Switzerland
- 2Department of History and Social Sciences, Universidad del Norte, Barranquilla, Colombia
- 3Department of Aquatic Sciences and Assessment, Swedish University of Agricultural Sciences, Uppsala, Sweden
Numerous studies have demonstrated that citizen science can provide valuable data on physical, chemical, and biological aspects of water quality. These studies mainly used quantitative methods. Qualitative approaches have been used to describe water quality conditions for much longer, but remain largely overlooked. The color, odor, and presence of aquatic vegetation or garbage influence human perceptions of river water quality, the use of the water, and thus the relation between humans and waterbodies. Yet, few studies have assessed how visual water quality indicators and local knowledge of water quality or sources of pollution can be used in citizen science projects, despite recent studies calling for greater attention to qualitative data sources. Qualitative data can enhance the interpretation of quantitative data and deepen the understanding of human-water relations. This paper evaluates qualitative water quality descriptors collected through the citizen science smartphone app CrowdWater and analyses how citizen scientists perceive and assess water quality in the app. Our analysis not only indicates that some citizen scientists already take quantitative physical–chemical measurements of water quality (even though this is not part of the app) but also that they frequently report their perception of water quality based on visual indicators and local knowledge. Our study makes a methodological contribution to traditional approaches in citizen science and water quality studies, highlighting the need to explore less frequently used methods and data sources and less frequently studied aspects of water quality.
1 Introduction
Water is studied by different disciplines, including the natural and social sciences, using different approaches. Consequently, water has been conceptualized in myriad ways. In hydrology, for instance, water is usually considered a natural entity and studies focus on the spatial and temporal variations of water fluxes and storage. Yet water is also embedded in political and sociocultural processes that vary across space and time (Strang, 2004; Bakker, 2012). Human geography and political ecology, for instance, have called attention to the social and political complexities, as well as the plurality of water (Strang, 2004; Ballestero, 2019; Linton, 2022). Water quality is an aspect where hydrological, economic, and cultural processes intersect (Bakker, 2012; Hrachowitz et al., 2016; Boyer et al., 2019; Camargo and Cortesi, 2019). Water quality issues are often deeply intertwined with issues of environmental justice and inequality (Arce-Nazario, 2018; Acevedo-Guerrero, 2022), the uneven distribution of risk and water infrastructures (Karpouzoglou et al., 2018) and the commodification of water (Rusca et al., 2017).
Defining the quality of a waterbody is a complex task. On the one hand, it involves assessing the physical, chemical, and biological aspects of water quality. On the other hand, what is considered good or bad water quality depends on its use, the way people perceive it, and the political, historical, and social context in which this assessment is produced.
Physical water quality properties include color, turbidity (Julian et al., 2013), the presence of solids, and temperature (Omer, 2019). Chemical water quality refers to the concentrations of dissolved substances, such as nutrients and pollutants, as well as naturally occurring substances or oxygen content. Dissolved substances, in turn, affect the odor and electric conductivity of the water, which are sometimes considered a physical property of the water (Omer, 2019). Biological water quality refers to the presence of aquatic species, algae, or micro-organisms, in particular pathogens in water, or the presence of indicator species for good or poor water quality (Ansari et al., 2017; Omer, 2019). Biological aspects of water quality can also influence other aspects of water quality. For instance, the presence of algae can affect the odor and perceived color of the water, as well as the presence of foam or scum.
Social perceptions and sensory experiences of color, taste, and odor, as well as practices of use and management—which are often gender-based (see Corredor-Rodríguez, 2024)—broaden the spectrum of possibilities to understand water quality. Local knowledge, i.e., the knowledge that is embedded into local everyday life and acquired in a specific place over time (Antweiler, 1998; West and Roncoli, 2007; Naess, 2013), is important to understand human-water relations, and can inform local water management practices (Naess, 2013; Linton and Budds, 2014). Thus, although water quality is understood as an objective quantitative measure (e.g., concentrations of a substance) in disciplines such as hydrology, for social scientists (and citizens), it is as much a sensory experience, and therefore a subjective matter, as it is an ontological reality constituting a “multiplicity of water-related worlds” (Yates et al., 2017).
Water quality monitoring is an important task and goal within the environmental governance agenda (UNEP, 2024), as it is required to make decisions regarding water governance. However, water quality monitoring remains a significant challenge for environmental monitoring agencies, especially in so-called low-middle-income countries, thus exposing additional inequalities. Even in countries with sufficient economic and logistical resources to implement water quality monitoring, challenges remain regarding the spatial and temporal resolution of the monitoring, human and technical resources for monitoring, as well as political and governance frameworks (Behmel et al., 2016; Metcalfe et al., 2022). As a result, there is an overall lack of data for key water quality indicators (such as dissolved oxygen, nitrate concentrations, or pH) globally (Behmel et al., 2016; UNEP, 2024).
To overcome this lack of data, citizen science projects have been established to monitor water quality in lakes (Sefton et al., 1984; Scott and Frost, 2017; Millar et al., 2018), for bathing areas (Mitroi et al., 2020; Menon et al., 2021), and even drinking water (Peckenham and Peckenham, 2014; Brouwer et al., 2018; Ahmed et al., 2020; Tandlich, 2020). More recently, the use of citizen science methods for surface water quality monitoring has been promoted to fulfill the need for data to monitor progress towards the Sustainable Development Goals (Bishop et al., 2020; Quinlivan et al., 2020; Hegarty et al., 2021).
Most of the existing water quality focused citizen science studies use simplified approaches from the physical sciences, such as test strips or low-cost sensors (see Section 2.1) (Njue et al., 2019; Quinlivan et al., 2020; Blanco-Ramírez et al., 2023). However, by following the standard quantitative methods for water quality monitoring, the social, cultural, and political realities of water and rivers (and thus the causes of poor water quality conditions) are simplified or overlooked altogether (Molle et al., 2024). While for many analyses it is important to obtain traditional physical–chemical or biological measurements (e.g., to determine the presence of harmful substances due to pollution by industry, mining, or agriculture), qualitative observations of water quality based on sensory observations or every day experiences may bring valuable (complementary) information and a different (complementary) perspective on water quality. Qualitative data can, for example, deepen the understanding of the causes of poor water quality, and provide information on subjective and sensorial experiences that are key drivers of how people make decisions and relate to water (Strang, 2004; Barnett et al., 2018; Quandt, 2022).
Recent discussions in hydrology have acknowledged that water research and monitoring have social, cultural, and political implications, requiring epistemological and methodological interdisciplinarity (Krueger et al., 2016). Building on these discussions, we analyze the potential of less-explored qualitative water quality data collection in citizen science projects. More specifically, we investigated what water quality indicators citizen scientists are most interested in and what key water quality indicators influence the assessment and perspectives of a river’s water quality. For this, we employed two approaches: surveys and an analysis of the comments in the CrowdWater app,1 a widely used citizen science app for reporting hydrological information. The comments were analyzed through text analyses and cross-checking with existing literature in the fields of environmental governance and human perception. After analysing the data, we draw upon the literature in critical water geographies and political ecology, to reflect on the relevance of qualitative data (e.g., local knowledge) within citizen science studies for water quality monitoring, and as a venue to explore the complexities of water-human relations (Figure 1).
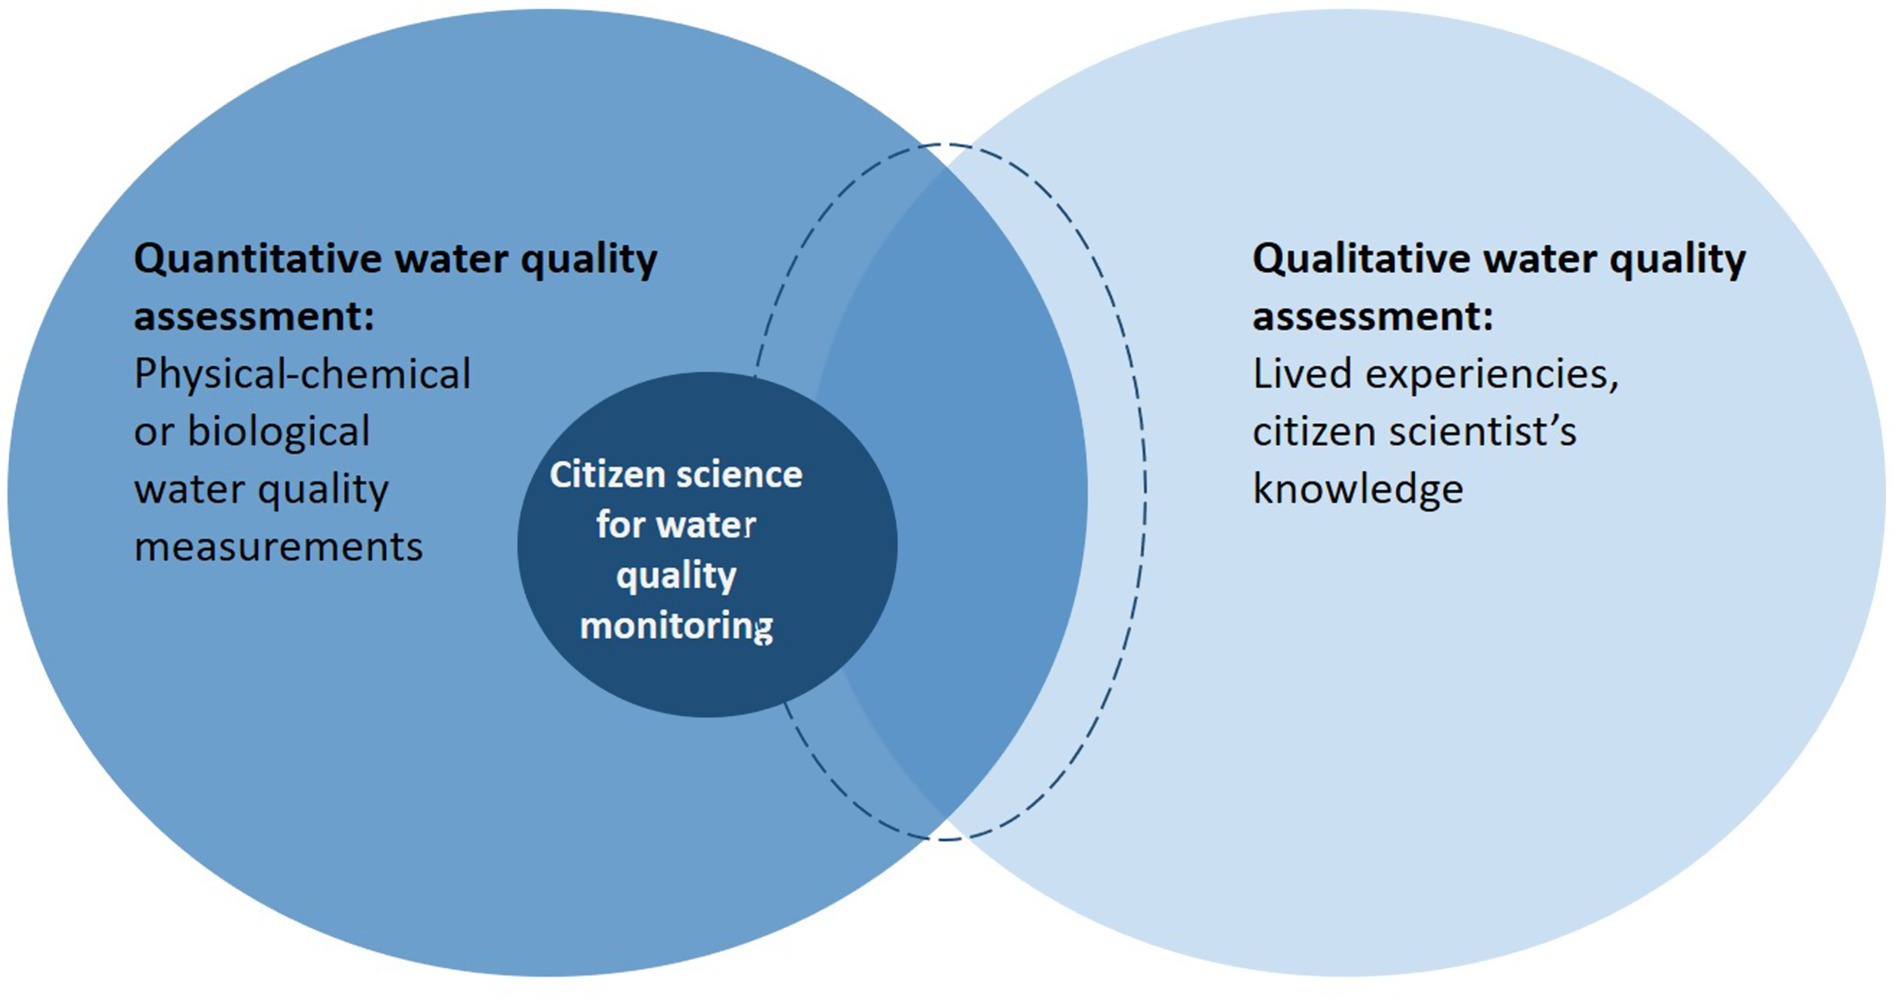
Figure 1. Simplified illustration of quantitative and qualitative approaches for water quality assessment and the role of citizen science. Even though citizen science projects on water quality tend to mainly focus on the physical–chemical-biological water quality characteristics, it has the potential to combine the quantitative and qualitative approaches for water quality assessments. The dashed blue circle in the middle illustrates how citizen science could also enable the collection of quantitative and qualitative water quality data.
1.1 Background information
1.1.1 Citizen science for water quality monitoring
Citizen science is the public participation (by non-professional scientists) in structured efforts to collect and interpret environmental scientific data (Kimura and Kinchy, 2019). There are different projects to monitor hydrological variables, such as streamflow or water levels, using citizen science approaches (e.g., Lowry and Fienen, 2013; Weeser et al., 2018; Davids et al., 2019; Seibert et al., 2019; Etter et al., 2020). However, most citizen science projects in hydrology focus on water quality measurements (Njue et al., 2019). Although different methods have been developed to collect physical, chemical, and biological water quality data (Njue et al., 2019; Quinlivan et al., 2020; Blanco-Ramírez et al., 2023), in practice, most initiatives and approaches reproduce the measurement protocols and methods and understanding of water (i.e., quantification) of traditional disciplines such as hydrology. For example, they monitor nutrient concentrations using sensors or test strips (Quinlivan et al., 2020). In other projects, citizen scientists take water samples that are analyzed later in standard laboratories (e.g., Luchette and Crawford, 2008; Sansom et al., 2016; Jakositz et al., 2020).
Despite the potential of citizen science to broaden the scope of water quality monitoring, the prevalence of quantitative methods (and thus access to equipment or laboratory facilities) limits the role that citizen science could play in decentralizing water monitoring from official monitoring agencies and spreading the data beyond traditional scientific institutions to those who live with and use the monitored waterbodies. Furthermore, using standard (i.e., mainly quantitative) methods for water monitoring results in a limited or simplified understanding of water and its broader context (Gibbs, 2014; Jalbert and Kinchy, 2015; Cohen et al., 2021).
1.1.2 Qualitative water quality indicators
Water quality is not only defined based on physical, chemical or biological measurements, certain indicators, especially sensorial (e.g., water color, odor, or presence of algae and litter), influence the human perception and assessment of water quality as well. Flotemersch and Aho (2020) found in their literature review that color, vegetation, and the presence of floating substances (such as litter, debris or foam) are the main aspects that influence human perception of water quality. Water color, clarity, and odor have also long been recognized as indicators of river health within Indigenous Knowledge and expertise (Nare et al., 2006; Harmsworth et al., 2011; Russell et al., 2020), and have historically determined water use and the aesthetic values of waterscapes (Smith et al., 1995a, 1995b; West et al., 2016; Lee, 2017; Flotemersch and Aho, 2020; Valois et al., 2020). Changes in water color and odor have been used as indicators of mining impacts on water quality and have motivated participatory water monitoring (Himley, 2014).
Optical water quality properties (color and clarity) are influenced by landscape conditions and thus each river has specific spatial and temporally varying optical water quality properties (Julian et al., 2013). Water color mainly depends on the color of dissolved organic matter (and sometimes other solutes), the concentrations of particulate organic matter, suspended sediment, and phytoplankton in the water (Julian et al., 2013; West et al., 2016). Water color is changing for many streams (Gardner et al., 2021; Bruns et al., 2024; Turunen and Aroviita, 2024) and lakes (Cao et al., 2023) worldwide. For example, remote sensing has shown that arctic-boreal lakes are becoming less green (Kuhn and Butman, 2021). The increased load of dissolved organic carbon and iron in Boreal streams leads to the browning of streams, which affects the structure of macroinvertebrate communities and therefore, the ecosystem function of streams (Blanchet et al., 2022; Turunen and Aroviita, 2024). It also increases the costs of drinking water treatment (Kritzberg et al., 2020).
Like water color, water odor is important and might even be one of the most noticeable water quality indicators for humans (West et al., 2016). Water odor can provide information on environmental change or pollution (Okumah et al., 2020). For instance, in the Peruvian Amazon, Indigenous communities have noticed that water odor has changed due to mining activities, the discharge of sewage, and leaching from landfills and other waste (Dupuis, 2022). This perception places water odor within a broader context of extractivism and infrastructural failures.
1.1.3 Monitoring of qualitative water quality indicators
Some sensorial aspects of water quality have been systematically monitored through citizen science. Simple versions of the Secchi disk have, for example, extensively been used for citizen science water quality monitoring for more than 70 years (Lottig et al., 2014). Recent technologies have enabled the development and use of mobile apps for citizen-based water color and algae bloom monitoring (Ceccaroni et al., 2020; Malthus et al., 2020; Mitroi et al., 2020). In China, people have used the Black and Smelly Waters app to report polluted sites by uploading a photo and rating the water color, odor and presence of sewage (Hsu et al., 2020). Zheng et al. (2017) collected qualitative data in China regarding the water’s color, odor, turbidity, and the presence of floating substances through a social media-based app. In South America, the AppEAR app uses photographs and a questionnaire to describe water quality and landscape conditions for rivers in Argentina (Cochero, 2018). The Nuestro Río app was used in Peru for water quality assessment through photos and a questionnaire about people’s emotions regarding river water quality (Rangecroft et al., 2023). Overall, this literature agrees that citizen science approaches for water quality assessments can contribute relevant baseline information to describe environmental changes. However, so far, few studies have analyzed the role of other types of qualitative data (e.g., local knowledge on sources of pollution) or considered the historical or social context in citizen-based water quality observations (Rangecroft et al., 2023).
Other studies have shown that assessments of visual water quality indicators can agree with measurements of physical–chemical parameters. For example, Russell et al. (2020) demonstrated the consistency between the assessment of visual indicators by the Ngukurr community in Australia and results obtained from analyses of pathogens and drinking water safety for billabongs. The visual and qualitative assessments of water color, odor, and sewage presence for water bodies in Guangzhou, China submitted via the Black and Smelly Waters app compared well with measurements of chemical oxygen demand, dissolved oxygen, ammonia, and phosphorus. The waterbodies reported in the app indeed had poorer water quality than sites that were not reported (Hsu et al., 2020). Thus, perceptions of water quality and sensory assessments of water quality appear useful.
1.2 CrowdWater project and app
CrowdWater is a citizen science project based at the University of Zurich in Switzerland, for which a mobile phone app has been developed for hydrological data collection. The CrowdWater project aims to develop and test methods for hydrological measurements that do not require any sensors and can be used in regions where there is currently a lack of data. The app allows anyone to collect data on stream water levels, the state of temporary (i.e., non-perennial) streams, soil moisture, plastic pollution in rivers and on shores, and qualitative water quality characteristics. The app is available in several languages and is used worldwide. As of 17.07.2025, 62,396 observations had been recorded with the CrowdWater app for 10,543 sites. The data were submitted by 3,281 different citizen scientists. Similar, to other citizen science projects, the 10% most active citizen scientists reported 85% of all observations.
Because CrowdWater aims to enable data collection by anyone for any location, it uses visual and qualitative approaches. Users take a photo of the river and add information related to the selected category. For example, the virtual staff gauge category is based on a comparison of the water level to that at a previous time, based on a sticker of a ruler that is added to the photo. For the temporary streams category, the users must select the flow state (e.g., flowing, isolated pools, dry, etc.). Since September 2022, the stream type category has allowed citizens to report a qualitative assessment of water quality based on several indicators (e.g., color, clarity, vegetation, odor) and local knowledge on the causes of pollution. More specifically, the user needs to upload a photo of the stream and answer questions regarding the riverbed material, water color and clarity (visibility of the riverbed), the presence of animals, vegetation, and floating substances, such as litter, algae, or foam. Citizen scientists can also report the odor of the water and any known causes of pollution. There is also an optional text box for comments, where users can provide other information (Figure 2). Once the questions are answered and saved, a “root spot” is created and becomes publicly visible. Other users can then “update” the information in the app by adding information on their perception of the water quality, or the same user can update the information later, e.g., because the color of the water has changed. More specifically, this means that new photos and information are added to the root spot and thus, a visual and systematic record of qualitative water quality information (and corresponding photos) is created (Figure 3).
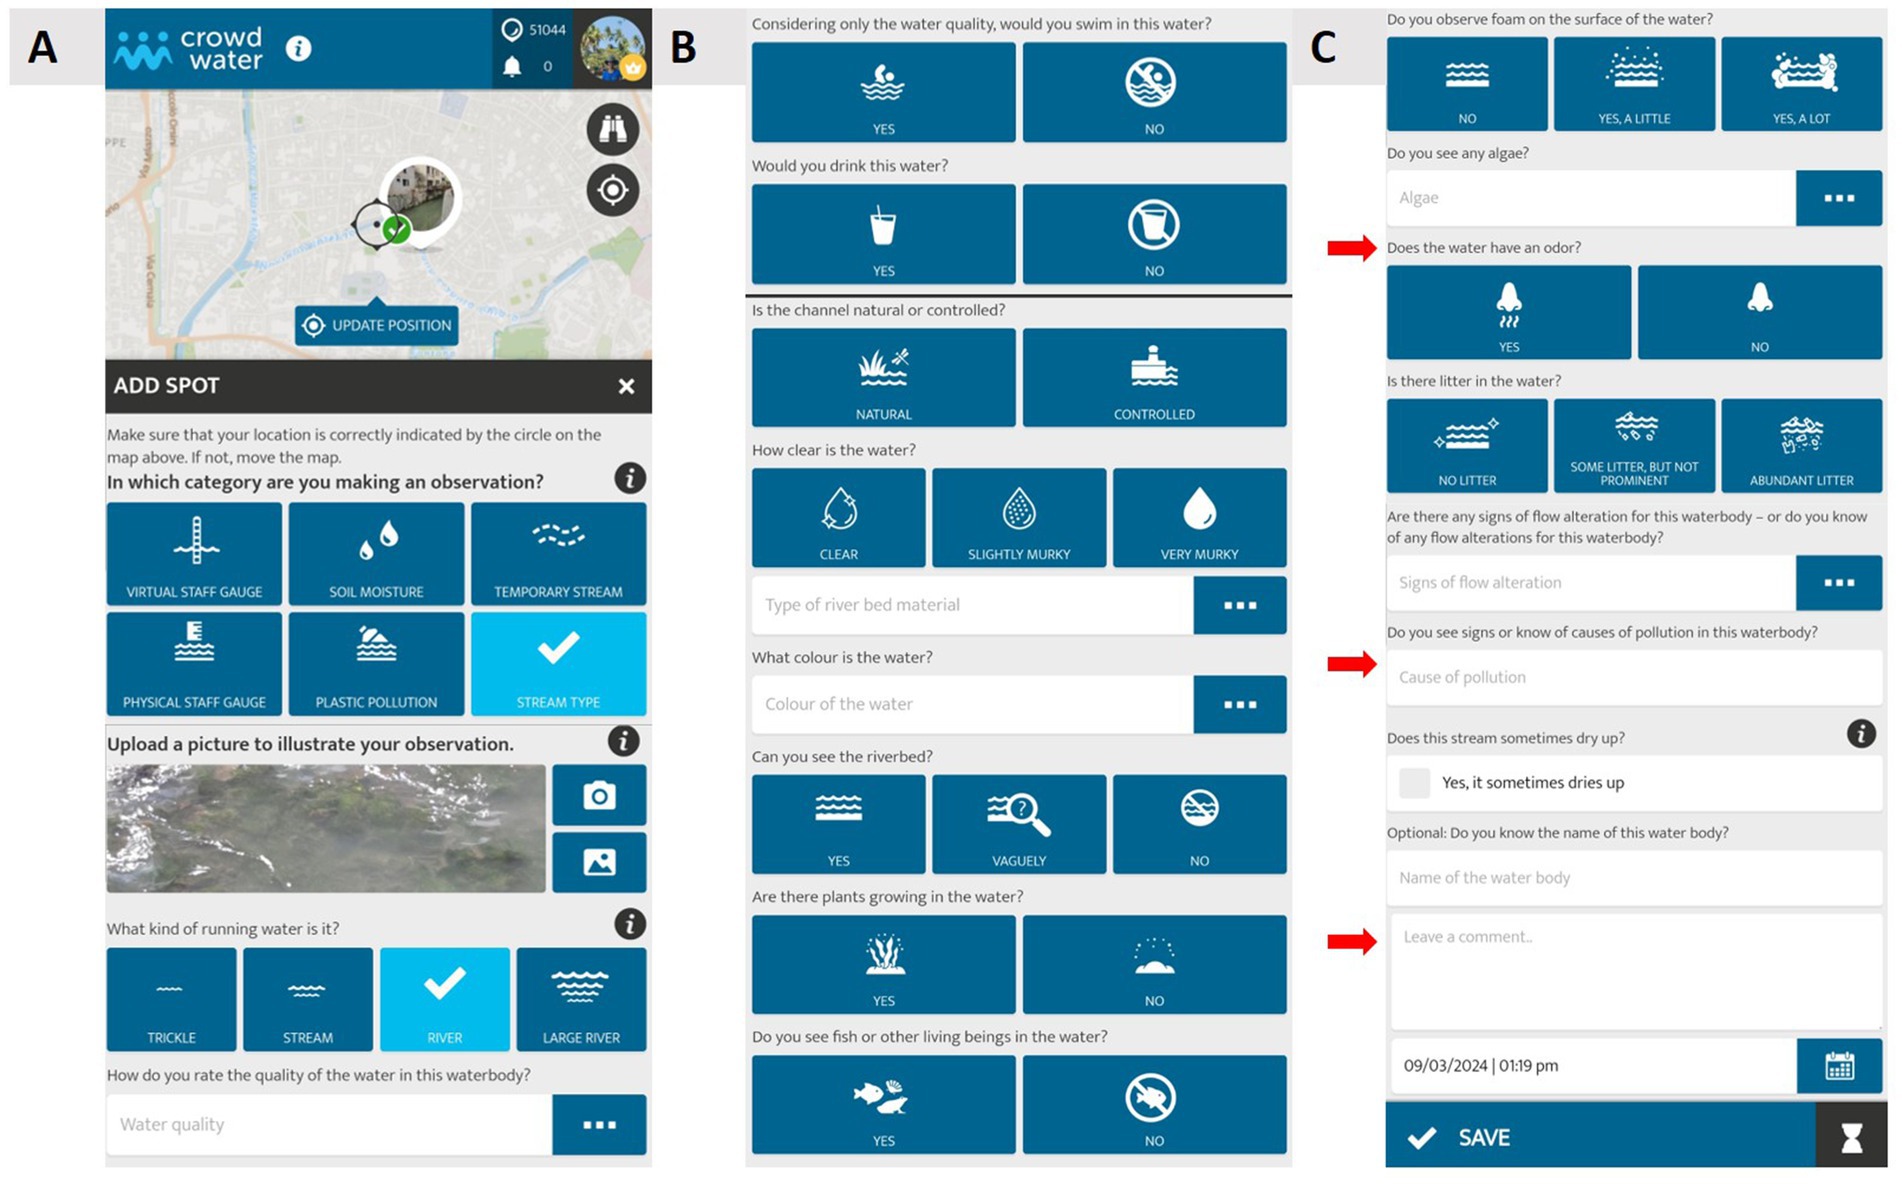
Figure 2. (A,B) Screenshots showing the questions in the stream type category of the CrowdWater app. The red arrows in (C) indicate the questions for which the data were analyzed in this study.
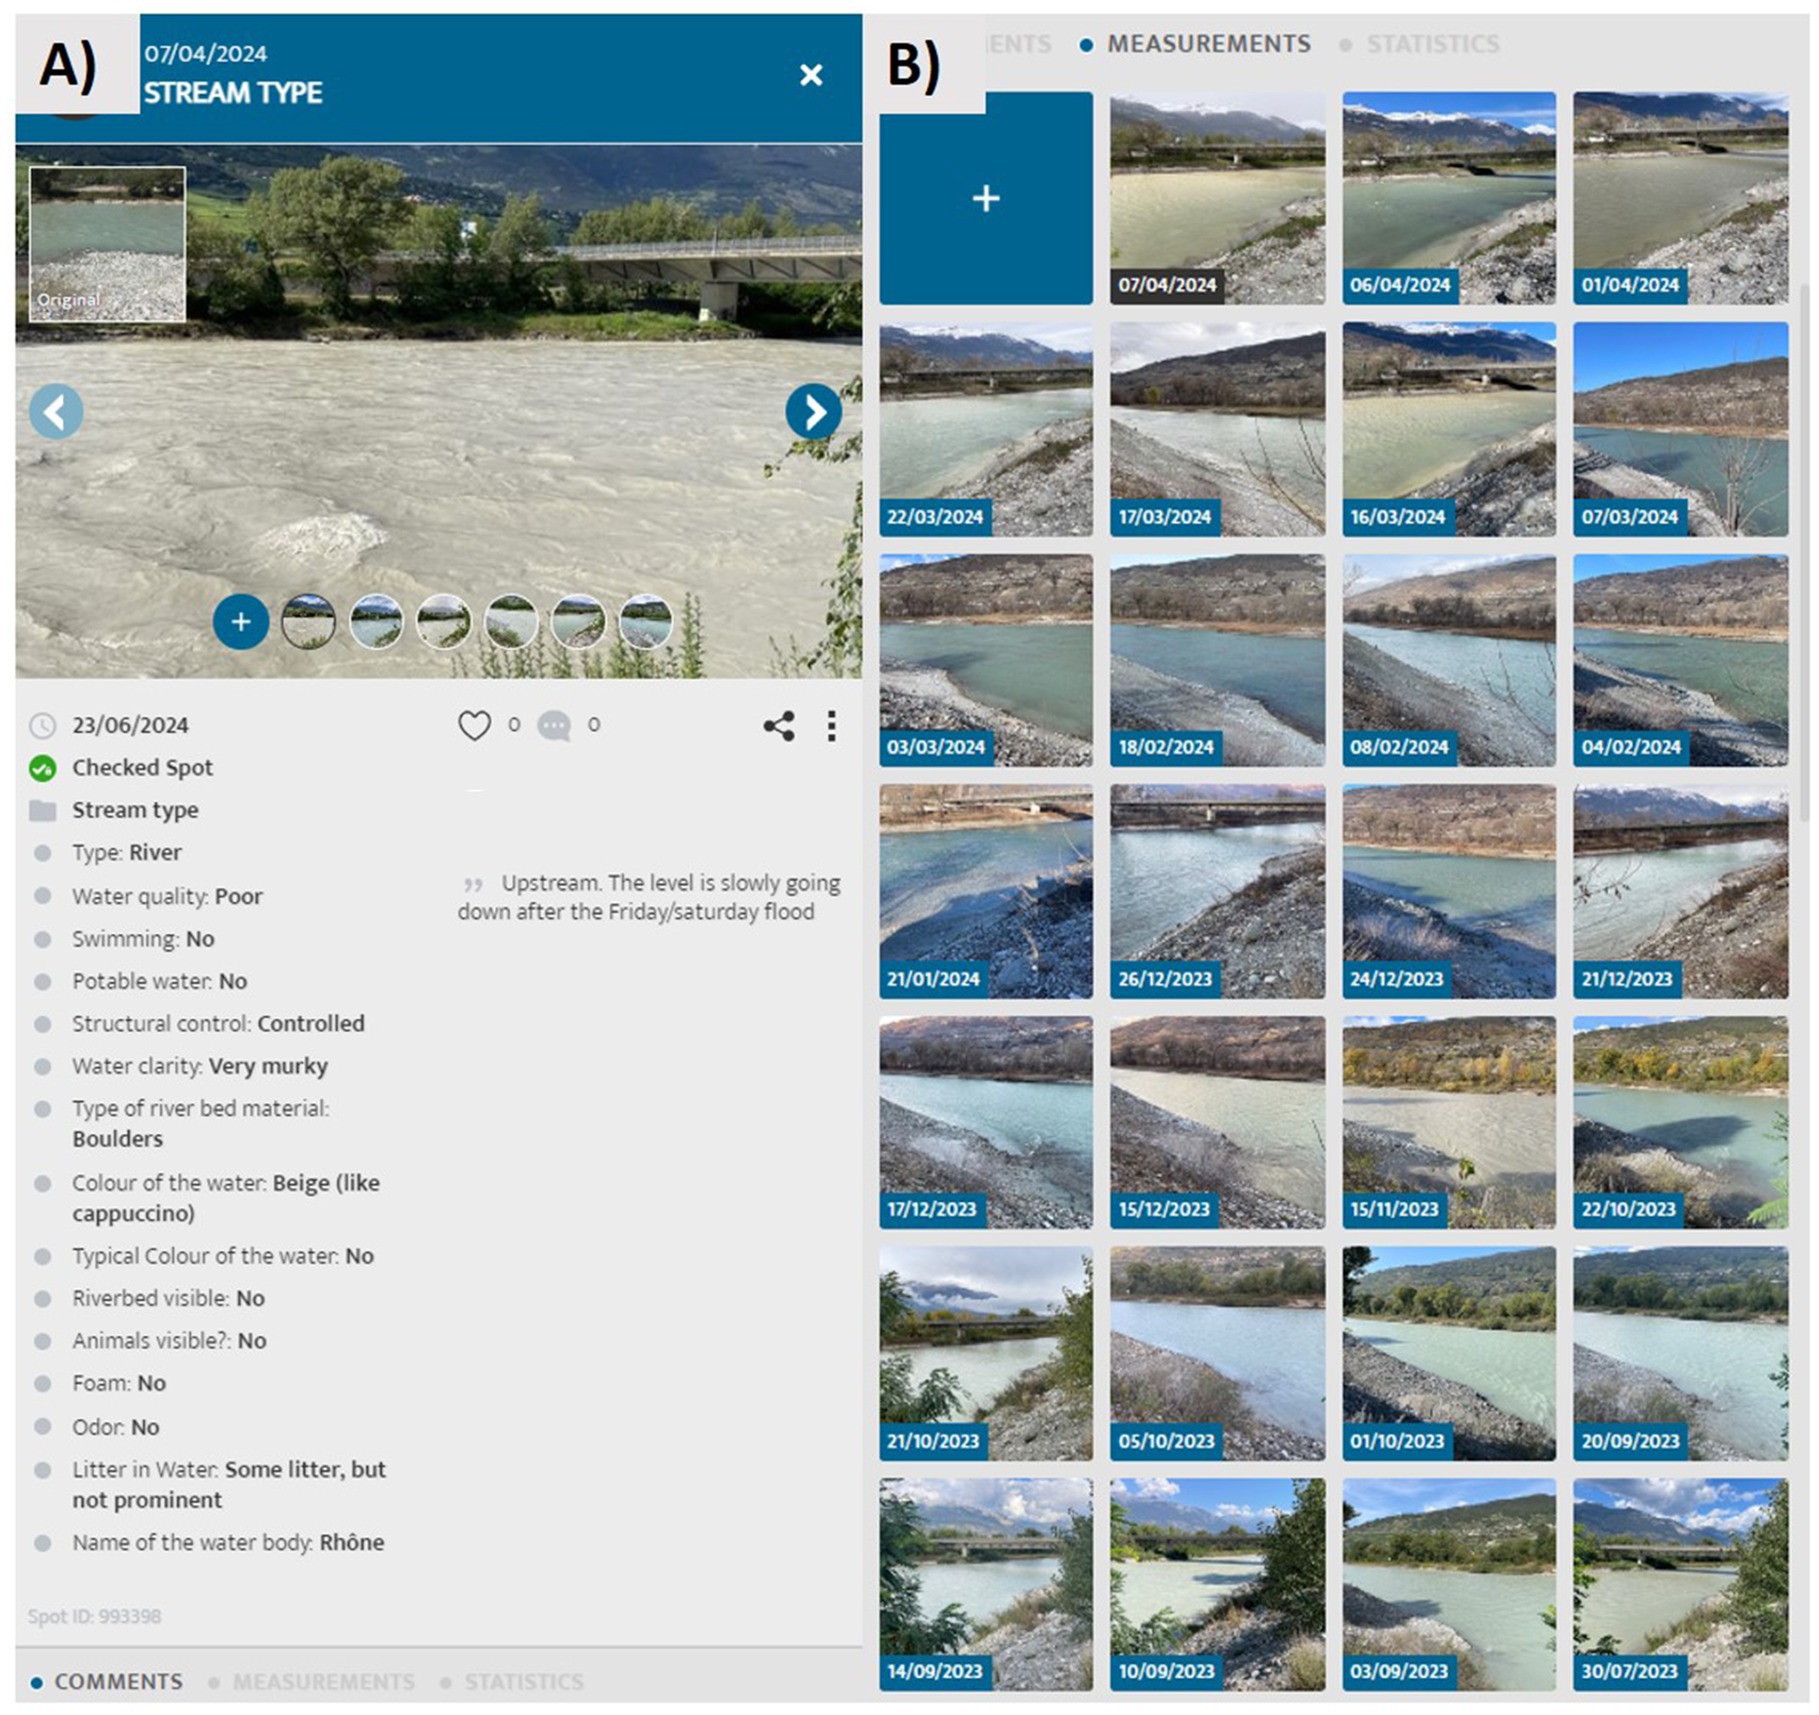
Figure 3. Example of the data collected for the stream type category in the CrowdWater app. (A) Illustrates the information for the spot once it is uploaded in the app (B) the photos of the same spot for which updates were made on different dates (recorded in the lower left corner). Data: 993398.
2 Materials and methods
We used different methods to determine what (qualitative) water quality parameters people are most interested in. We (1) directly asked what parameters people find important, (2) directly asked what changes in water quality they had observed, (3) checked what aspects of water quality citizen scientists wrote about in the comments section of a citizen science app, and (4) checked what causes of pollution they reported in the app. The first two lines of evidence are based on surveys along five rivers. The latter two lines of evidence are based on comments in the CrowdWater app, a global citizen science app that has been available since 2016 (Seibert et al., 2019).
2.1 Surveys along rivers
We conducted a series of surveys to evaluate the relevance of questions related to qualitative water quality indicators and the level of agreement among potential citizen scientists on the answers. The surveys took place along the rivers Shil, Alptal (Switzerland), Rhine [at Basel (Switzerland), Bonn and Cologne (Germany)], Besòs (Spain) and the Chiquimulilla Canal (Guatemala). We started the surveys at the Alptal, Sihl, and Rhine in Basel. To compare the responses with those of people living further downstream, i.e., downstream of more industrial areas, we conducted two more surveys in Bonn and Cologne. The surveys at the Besòs and Chiquimulilla Canal were conducted as part of the outreach activities of the CrowdWater project with local community-based monitoring groups, to include responses for rivers considered more polluted. We selected locations along the river where people were passing by (e.g., footbridges) and followed a convenience sampling method (i.e., we asked each person who passed by and was above 18 years old if they would be willing to participate in the survey). The surveys were conducted by the first author between May 2022 and January 2023 and took about 2 h at each location.
The questionnaire (see Supplementary material 1) consisted of questions about the stream type category in the CrowdWater app (Figure 2, see Section 1.2) to evaluate the range in perceptions of water quality for a particular river (i.e., the one that the participants saw in front of them). Additionally, we included questions about whether the participants had observed any changes in water quality for that river and their opinions on the relevance of different indicators of river water quality. The latter was based on a Likert scale from 1 (not important) to 5 (very important) (see Supplementary material 1). For this paper, we focus on the results of the Likert scale questions on the importance of different water quality indicators and the questions related to the observed changes in water quality.
In total, we obtained 290 surveys for which the majority of questions were answered (i.e., we left a handful of surveys that provided answers to only one or two questions out): Rhine (41% (40 surveys at Basel, Bonn and Cologne each)) Sihl (26%), Besòs (17%), Alptal (8%) and, Chiquimulilla (7%). There was a good gender balance (52% female and 48% male), as well as a reasonably good age balance (25–39 years old: 35%, 40–64 years: 26%, and >65 years: 11%). Most participants held a university or advanced studies degree (55%) and considered themselves residents (57%) of the area where the surveys took place.
2.2 Text analysis: coding qualitative data in the CrowdWater app
We categorized the comments (usually a few words to a sentence) written in the comment fields for the stream type (water quality), virtual staff gauge (water level), and temporary streams (flow state) categories of the CrowdWater app using a qualitative inductive coding approach. We selected all observations uploaded in these three categories between 28.09.2022 (i.e., after the release of the latest version of the stream type category) and 29.02.2024 (when data analysis started). Of the 10,316 observations that were uploaded in the CrowdWater app for the selected period, 2,668 included a comment (26%). Most comments were reported in the temporary streams category (41% of all comments), followed by virtual staff gauge (37%) and the stream type category (22%).
Comments and answers written in German, Indonesian, Italian, Portuguese, Russian, and Spanish were translated into English using DeepL for the coding and analysis (quotations throughout this paper are either the original text in English or the translated text).2 We used the following inductive approach. First, we reviewed the comments in the stream type category and identified repeated themes, such as location, water level, or information related to water quality. We then developed a codebook (Table 1) and used it for the comments for all three categories. Comments in the virtual staff gauge and temporary streams also gave information on streamflow and thus, this theme was added to the codebook. Some comments had multiple themes (e.g., comments regarding the water level and weather conditions or water level and water quality). These comments were categorized into both themes. All water quality comments were coded additionally according to the type of indicator mentioned (e.g., color, odor, physical–chemical parameter).
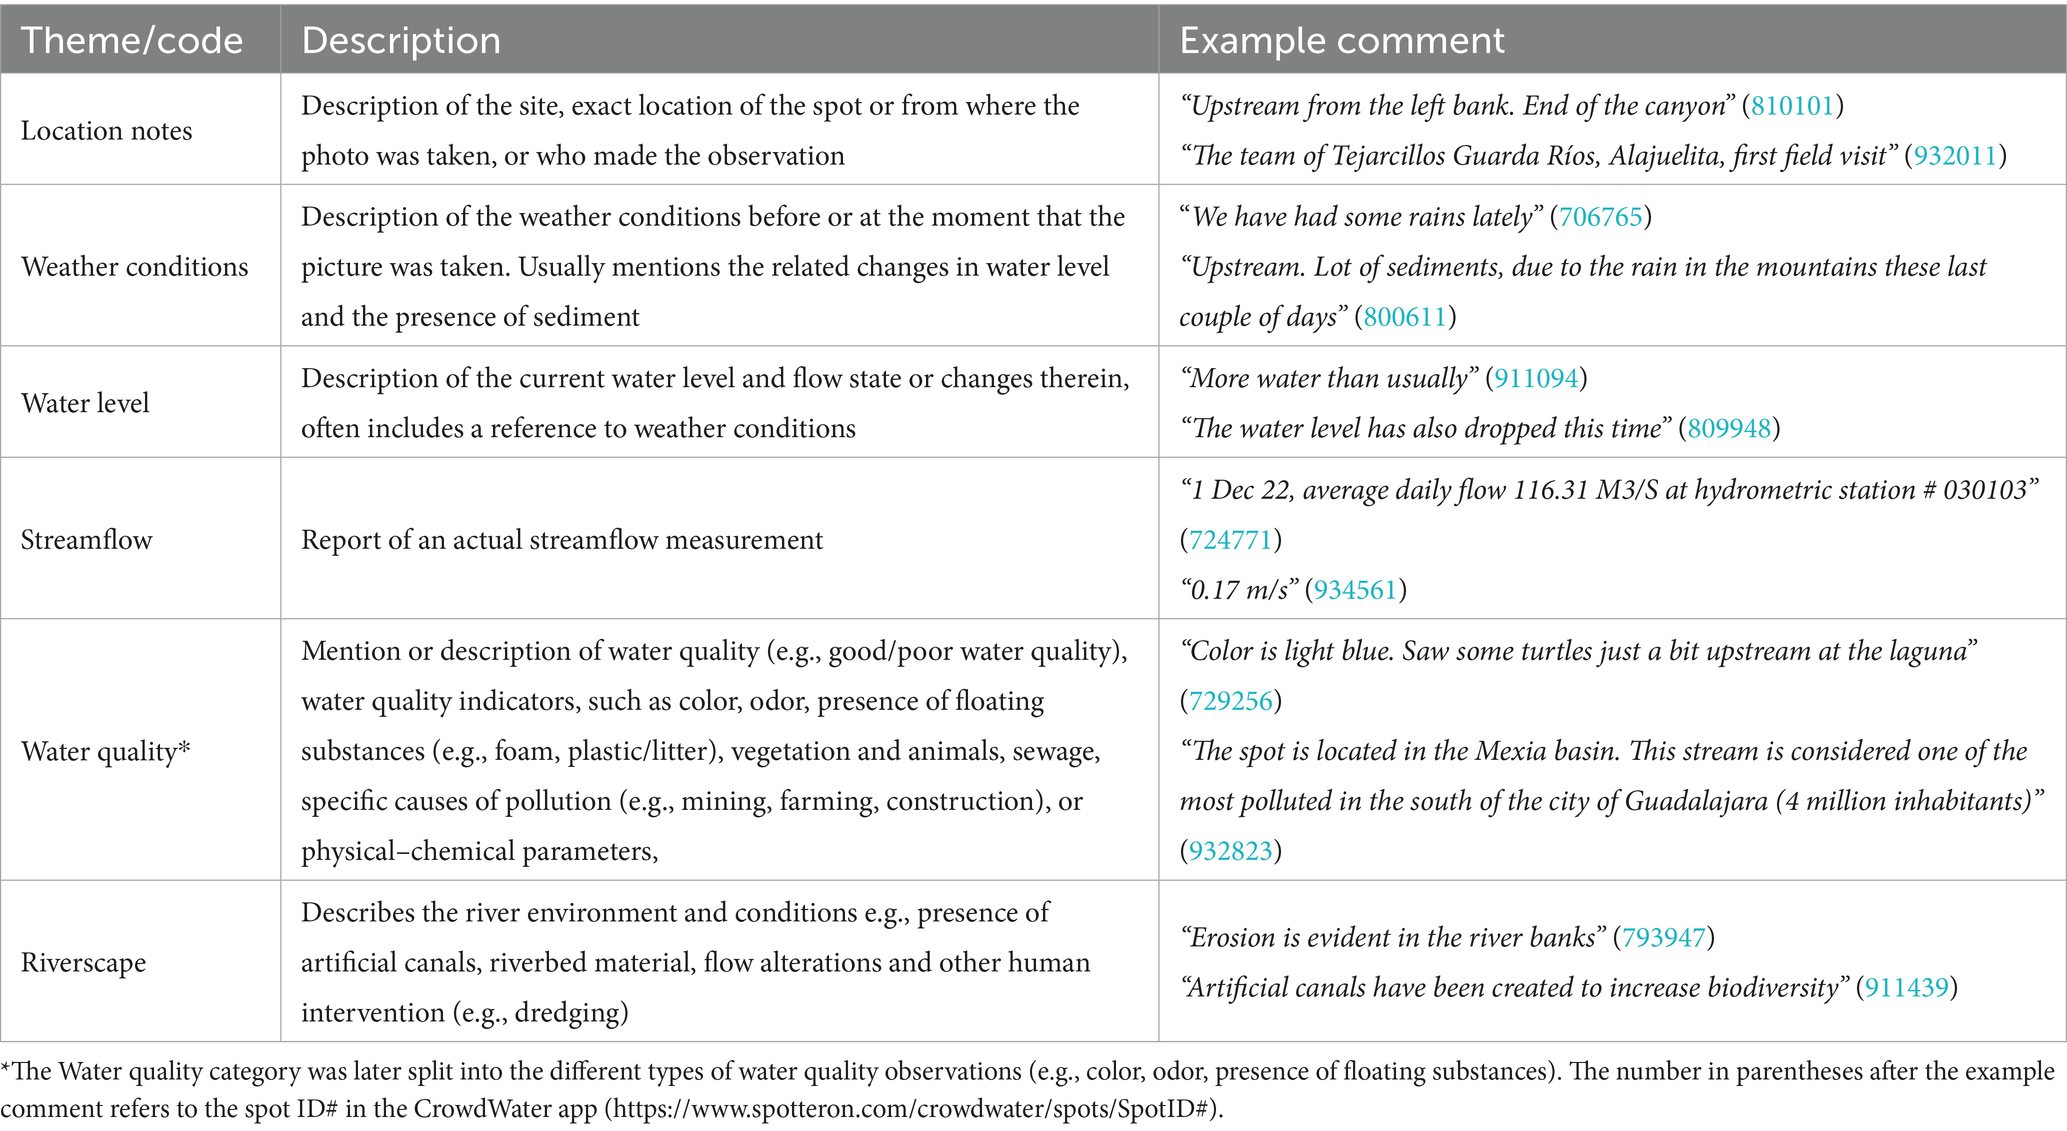
Table 1. Codebook used for the categorization of the comments in the CrowdWater app.
Additionally, we coded the answers (either a word or a sentence) to the question regarding the causes of pollution in the stream type category (see Figure 2C) using the same coding approach. The answers were coded according to the type of pollution mentioned following a codebook developed after reading and interpreting these answers (Table 2).
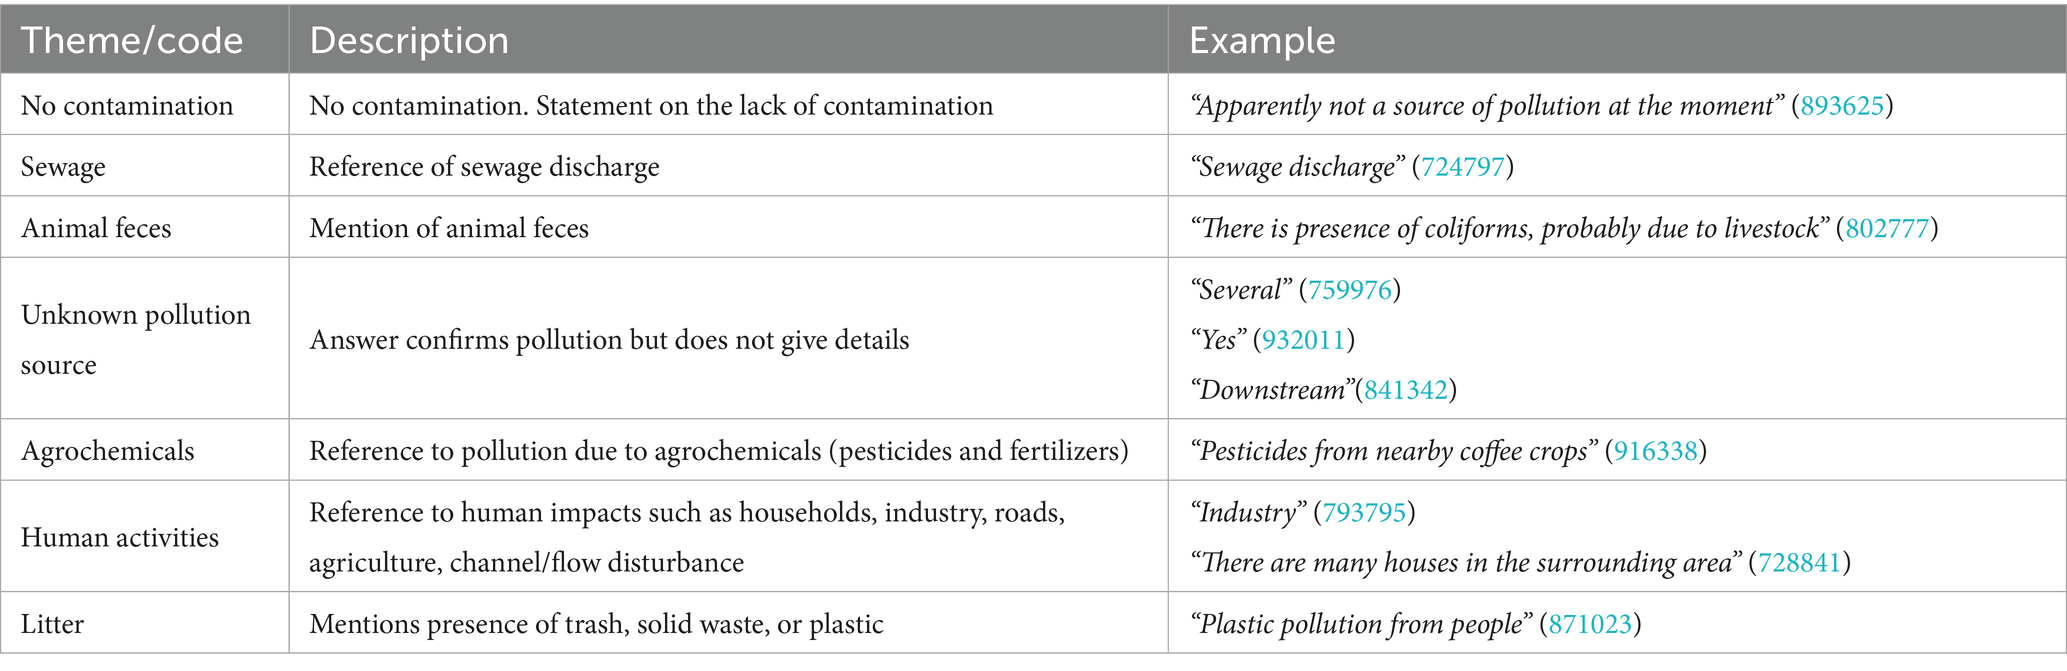
Table 2. Codebook used for the categorization of the causes of pollution reported in the stream type category of the CrowdWater app.
3 Results
3.1 Surveys
3.1.1 Perceived importance of different water quality indicators
The absence of floating substances, such as foam or trash, was considered a very important water quality indicator by most participants (79%) in the surveys, followed by the absence of pathogens (69%) or a specific odor (61%) (Figure 4). Although for most survey sites floating substances were rated most frequently as a very important indicator, participants at the Chiquimulilla Canal (Guatemala) and Alptal (Switzerland) rated the concentrations of nutrients and pathogens, respectively, as a very important indicator. Nearly one in eight participants mentioned another water quality indicator that was important to them in the open-ended question. The presence of aquatic fauna and flora was most frequently mentioned (45% of the answers) in this part.
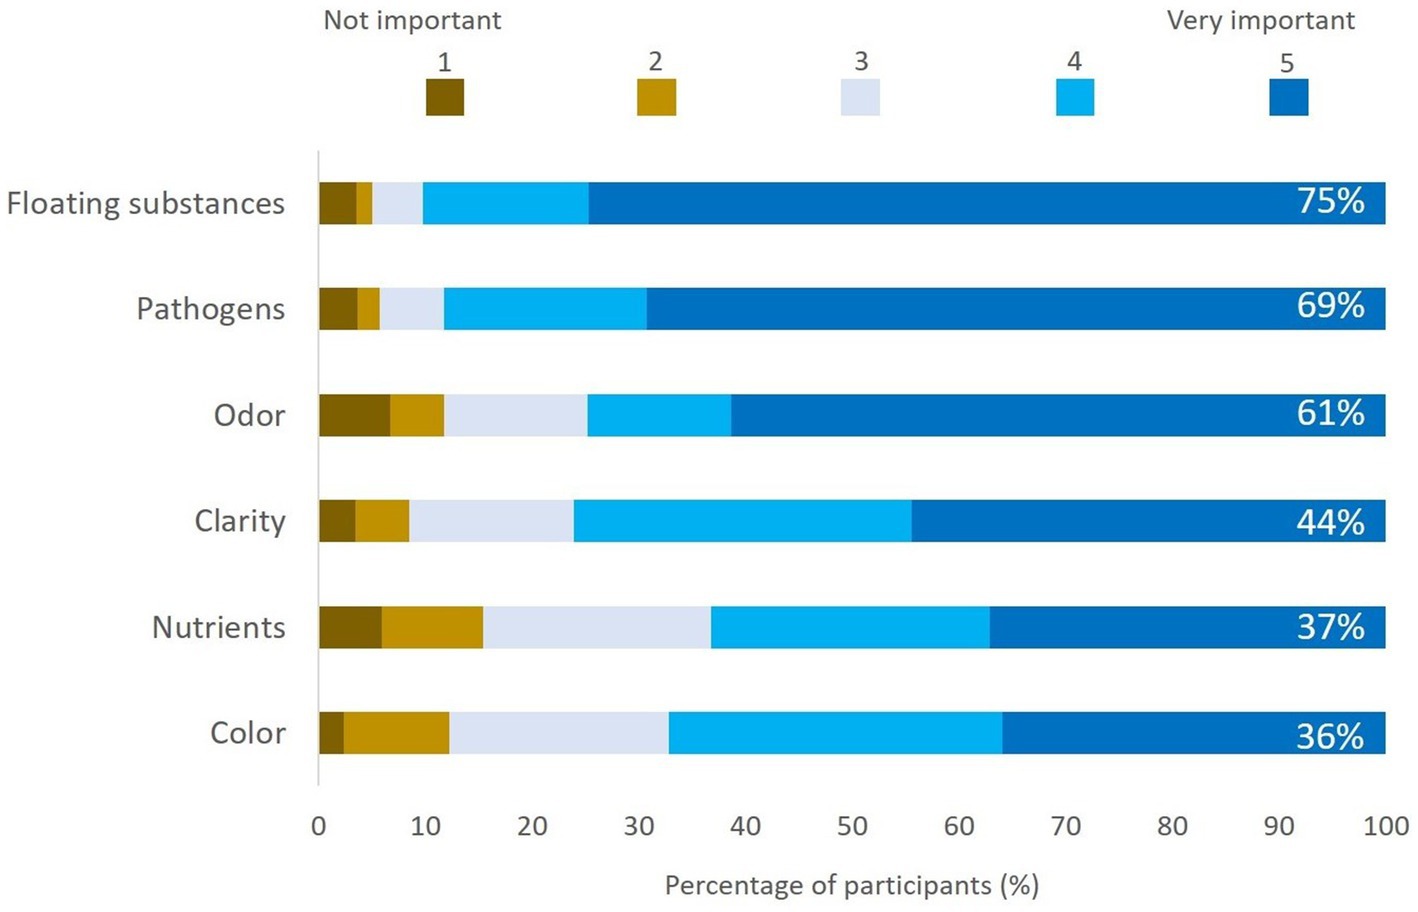
Figure 4. Importance of the different water quality indicators, with the percentage of the respondents who rated a water quality indicator as very important (dark blue bar) written in white font on the right side.
3.1.2 Perceived water quality changes
Whether participants had noticed any changes in water quality in the river depended on the location of the survey. At the Besòs River in Barcelona, participants often mentioned an improvement in water quality (38% of the participants in Barcelona), especially changes in clarity (clearer water: 12%), improvements in the odor of the water (14%), and the presence of more aquatic flora and fauna (8%). Conversations during the survey revealed that people link these changes in water quality to an improvement in wastewater management. In contrast, in Guatemala, some participants (14%) reported an increase in solid waste and bad odor. In Switzerland, few participants noticed any changes but when they did it was mainly related to color (5%) and algae growth (2%). Only 5% of the survey participants along the Rhine had noticed a change in water quality.
3.1.3 Comments in the CrowdWater app
The comments in the CrowdWater app were mainly related to user notes, including clarifications of the location of the site or photo (36%), a description of the water level (28%), weather conditions (3%), or descriptions of riverbanks and surroundings of the waterbody (2%). However, there were also many comments related to water quality indicators and conditions (25%) (Figure 5), particularly physical–chemical parameters (78% of all comments coded as water quality), vegetation (12%), and color (5%) (Figure 6).
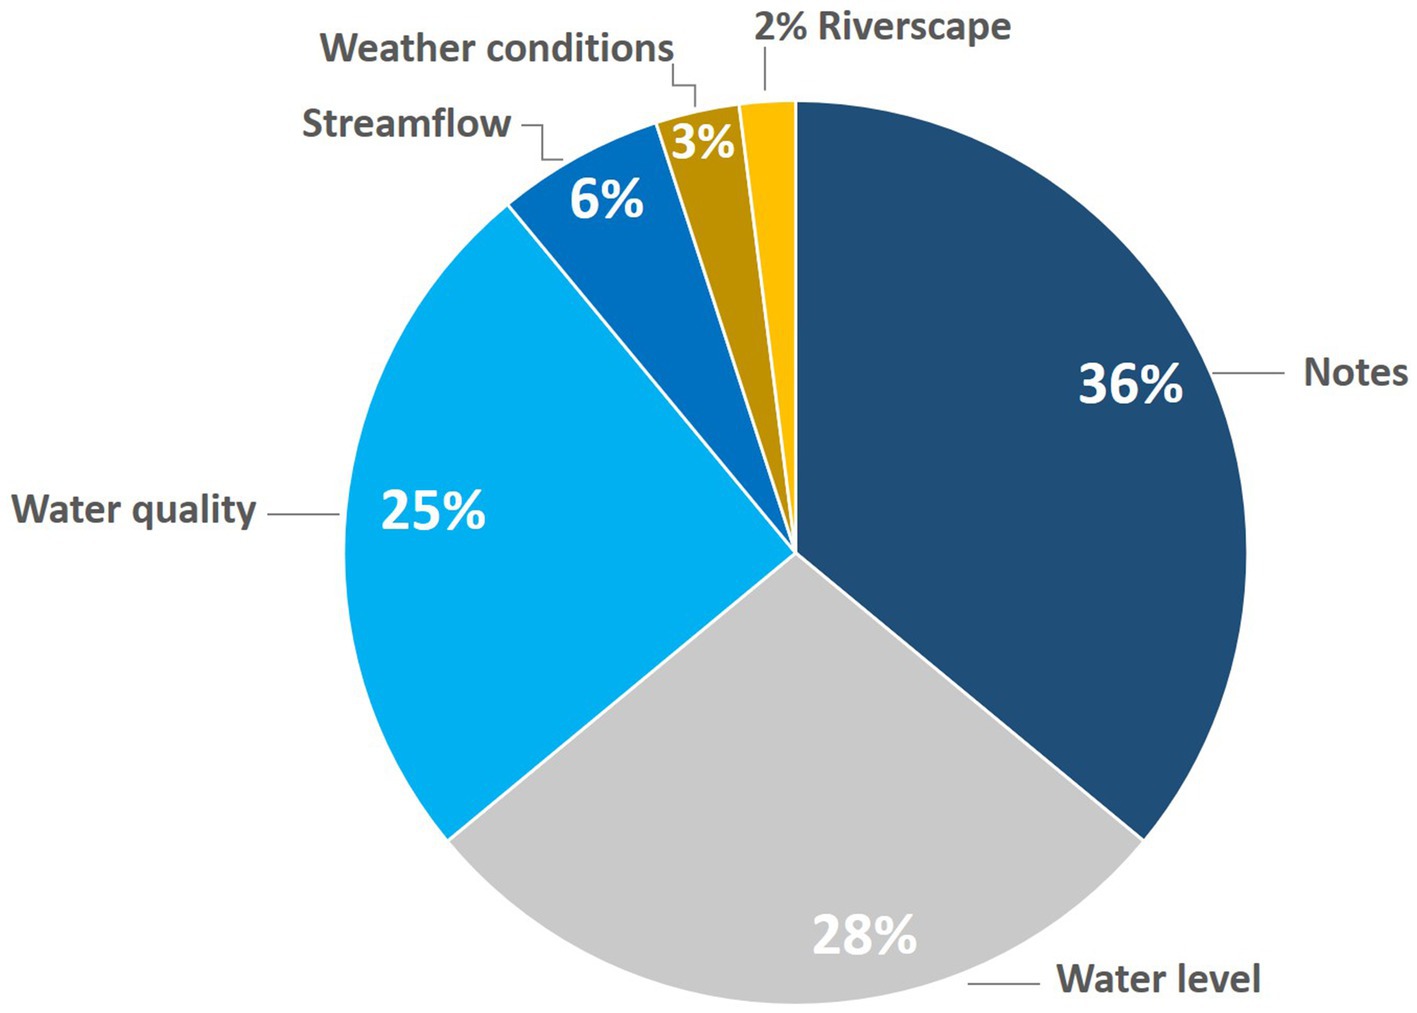
Figure 5. Pie chart of the themes identified in the comments of the stream type, temporary streams, and virtual staff gauge categories in the CrowdWater app for the period 29-09-2022 to 29-02-2024 (N = 2,703).
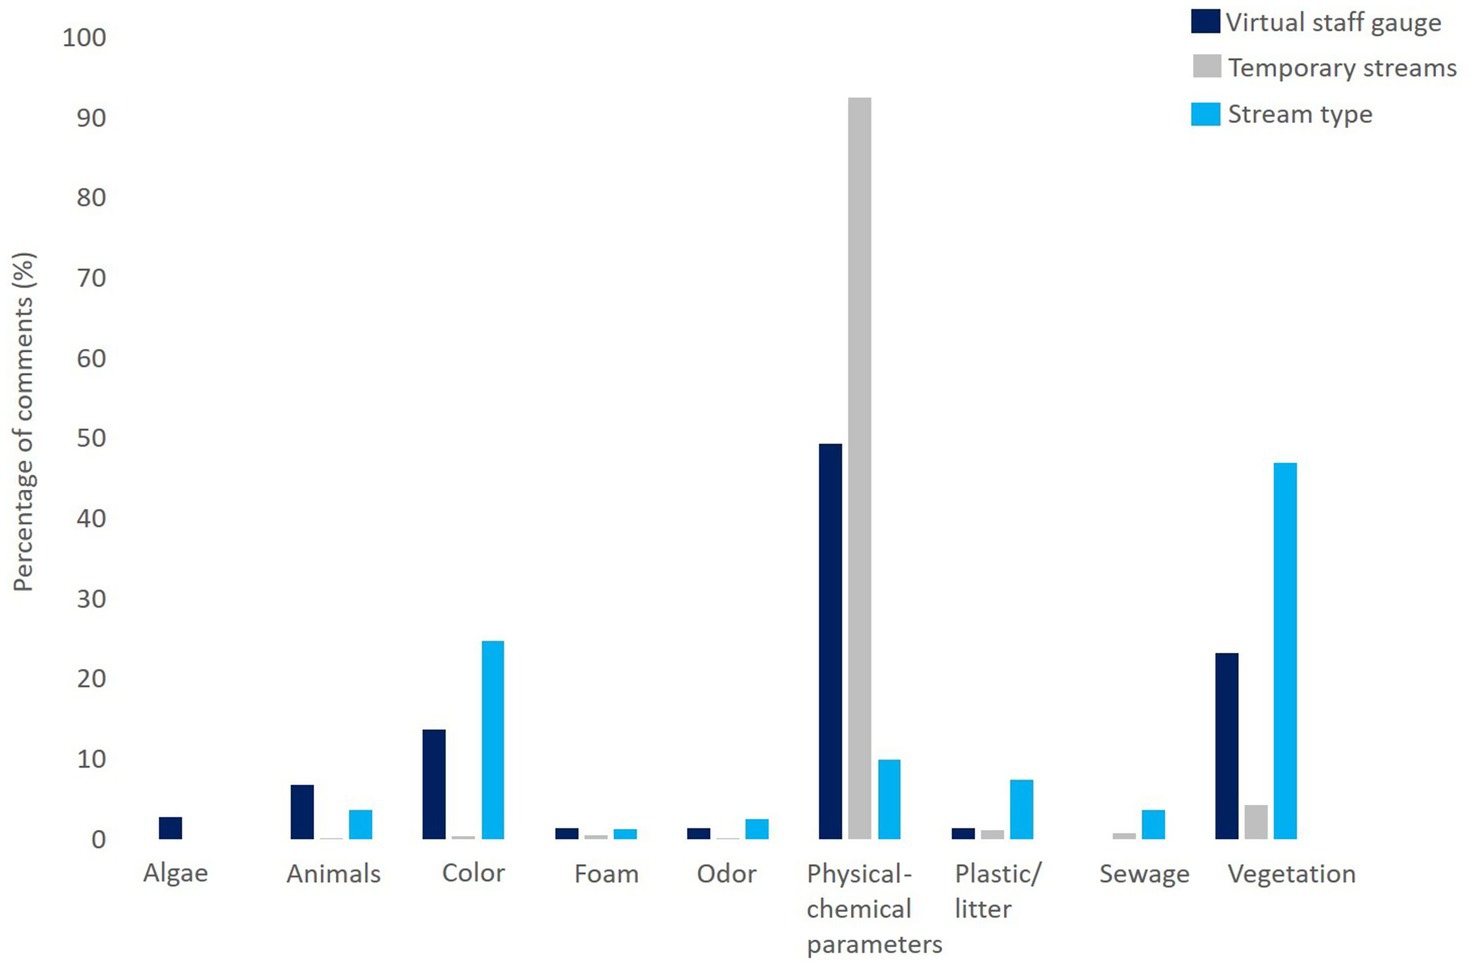
Figure 6. Percentage of comments related to different water quality indicators for the three different categories in the CrowdWater app that were analyzed in this study.
Although the CrowdWater app currently does not have any features to report physical–chemical water quality measurements, users reported measurements that they took with their own devices in the comments section (Figure 6). These were mainly temperature measurements (70% of the comments related to water quality). One user of the temporary streams category made 473 of the 667 (71%) comments related to temperature. There were also reports of measurements for electrical conductivity, pH, turbidity, total dissolved solids, and dissolved oxyen. Some comments were concrete annotations of the measurements, for example:
“Turbidity and Dissolved Solids (TDS) Sample Point 1: 0.8 NTU, Sample Point 2: 16.7 NTU, Sample Point 3: 7 NTU” (834032).
Others also described other water quality aspects:
“You hear a lot of insects, the water is murky, the water is not moving. Temperature 25.9 Oxygen 0.41 pH 6.5 Conductivity 800” (885022).
Vegetation was the second most frequently commented indicator related to water quality (12% of the comments). Users reported the presence of vegetation on the water, such as
“Lots of plants growing in standing water. AVOCA valley stream” (934848).
In other cases, there were detailed descriptions of the vegetation:
“Willow, thickets of tavolga, blackberry, nettle. On the water: martlets, on the opposite shore - cinquefoil, lake reed. Under water - dark green cattail. Projected coverage – 15%” (849376).
People also commented on the color of the water (5% of the comments coded as water quality). Usually the comments were a description of the current color, e.g.,
“Clean and clear water!” (915051)
or spatial variation in color, such as
“Upstream from the bridge. On the left bank we can clearly see the contrast between the color of the Navisence and the Rhône” (856198)
“Lot of sediments due to the rain of these last days. Upstream” (766073).
There were only very few comments regarding the odor of the water (four comments in total). They mainly described an unpleasant odor:
“(…) the odor is stronger, presence of scavenger animals” (794010).
Other water quality-related comments mentioned the presence of plastic pollution, animals, or sewage (Figure 6):
“Intermittent stream mixed with wastewater, plastics and other waste” (932039)
“River with small fish” (883745)
or
“Wastewater flow by odor and appearance” (932818).
Furthermore, there were reports of contamination or pollution or lack thereof, such as
“Extreme contamination” (793944)
“Clean, preserved water. It gets contaminated a few meters downstream” (702021).
3.1.4 Causes of pollution in the stream type category
Of the 1,053 observations in the stream type category during the selected study period, 19% answered the questions regarding causes of pollution (see Figure 2C). Sewage was the most frequently reported cause of pollution (38% of the answers) (Figure 7). These results are consistent with the assessments of the odor (see question, Figure 2C), as sewage was the most frequently chosen odor by the citizen scientists (41% of the observations in the stream type category reported a specific odor).
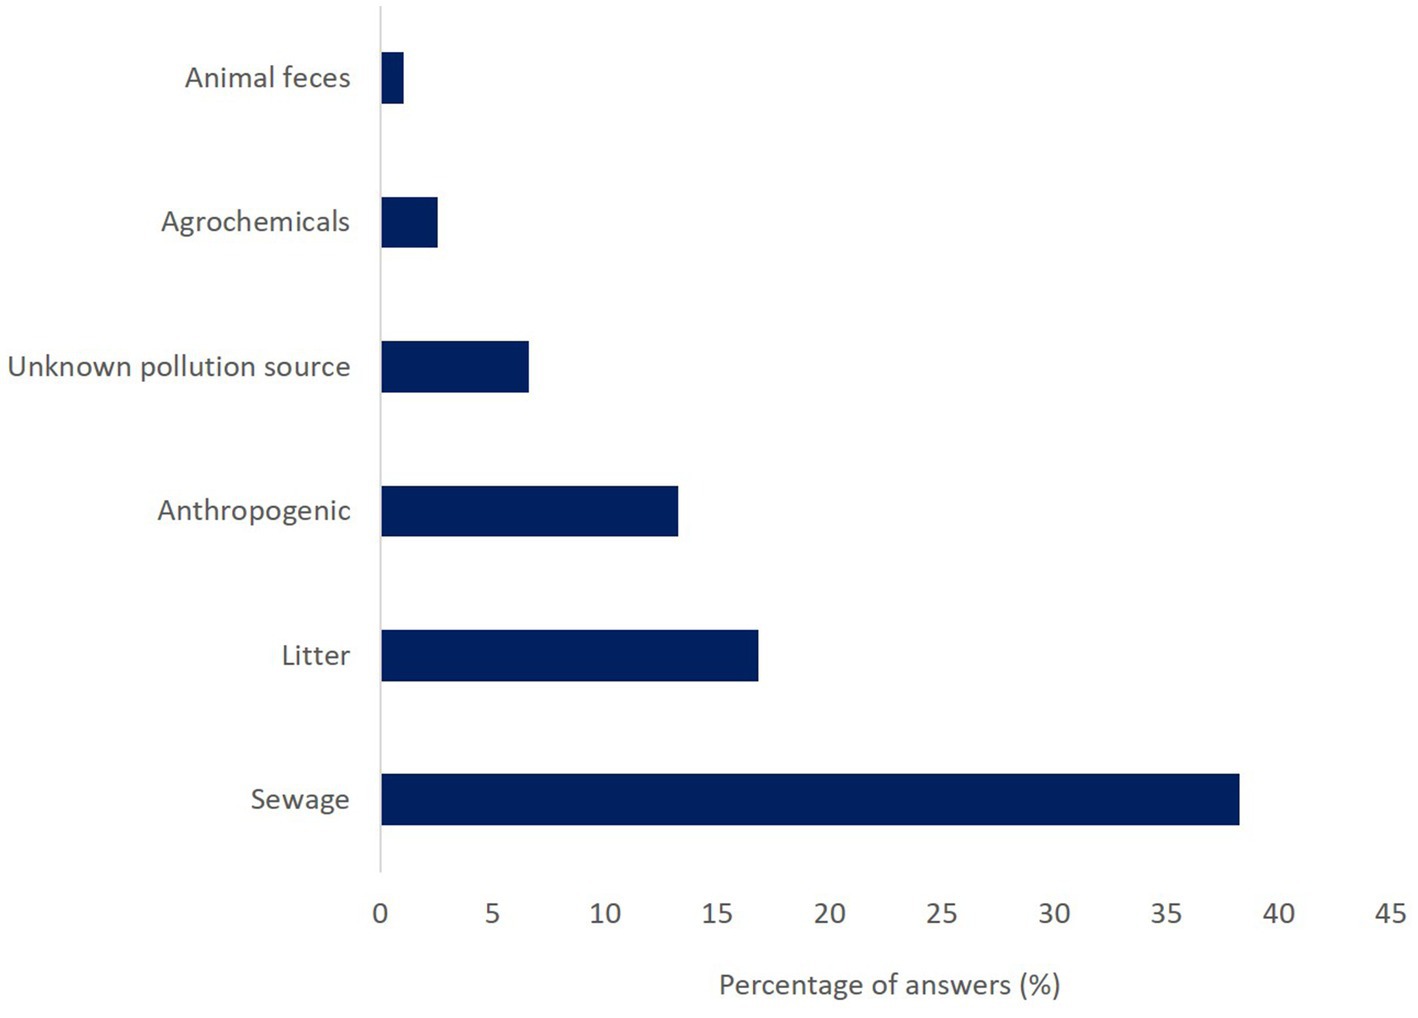
Figure 7. Relative frequency that certain causes of pollution were reported by users of the stream type category (N = 200).
Most of the comments related to the source of pollution consisted of a short description of the pollution source, for example:
“Yes, plastic bottles and cans” (736245)
“Industry 800 meters away” (793934).
However, in the analysis of the comments section, we also found longer explanations such as
“Photo at the headwaters of the Ma Aguilar River, about 50 meters downstream is contaminated with sewage and runoff from the Villa Hermosa community” (702021)
or
“Upstream there is a mine site near the river. In addition, there is livestock activity that disrespects the forest cover, threatening the health of the river and contaminating it with coliforms from the livestock” (802777).
4 Discussion
4.1 What water quality indicators are considered important?
Several studies have demonstrated the role of visual aspects in human perception and assessment of river water quality (Westling et al., 2014; West et al., 2016; Flotemersch and Aho, 2020; Okumah et al., 2020). There is evidence that the appearance of cleanliness of a river is linked to the absence of plastic on riverbanks and the presence of flora and fauna (Westling et al., 2014; West et al., 2016; Okumah et al., 2020). Our results are consistent with these findings. In our surveys, people rated the absence of floating substances (e.g., trash or foam) as a very important indicator of river water quality (Figure 4). In Guatemala, survey participants referred to the increase in plastic pollution as one of the major changes they noticed in the river. Furthermore,the presence of litter in the river and on the shores was the second most frequently reported cause of pollution in the app (Figure 7). Thus, our results support previous studies on the relevance of plastic and litter in the perception of water quality. Plastic pollution is a global issue that impacts land, freshwater, and ocean ecosystems (MacLeod et al., 2021). Citizen science projects have monitored macroplastic pollution in surface water (Tasseron et al., 2020; van Emmerik et al., 2020). By 17.07.2025, there were 2,811 reports of plastic pollution for 2,246 sites in the CrowdWater app, highlighting that people are interested in monitoring macroplastic pollution.
When asked which other water quality indicators were considered important, the presence of vegetation was frequently mentioned as a key factor. Aquatic vegetation is an indicator of stream health (Ansari et al., 2017) and is, therefore, part of formal stream health assessments. The comments in the CrowdWater app highlight people’s interest in the presence of vegetation in the river and surroundings (Figure 6). Previous studies also mentioned that people consider vegetation an important indicator of river water quality (West et al., 2016; Okumah et al., 2020) and cross-cultural research has demonstrated that aquatic vegetation is an important indicator of water quality in Indigenous Knowledge (Harmsworth et al., 2011; Russell et al., 2020, 2021). Westling et al. (2014) found that riparian and aquatic vegetation influenced residents’ perception of river “cleanness” after a river restoration project. Similarly, our surveys in the Besòs River highlighted the role of vegetation in the assessment of water quality or cleanliness. From 1999 to 2011, the restoration of the Besòs River included the enhancement of vegetation (Martín-Vide, 2015). During our surveys, people often referred to the presence of local flora and fauna as evidence that the river is “cleaner” than it was in the past.
Water color can indicate turbidity and trophic status of rivers and lakes (Lai et al., 2024; Turunen and Aroviita, 2024). Domestic and recreational uses, and aesthetic values of waterbodies and waterscapes have historically been related to color and clarity (Smith et al., 1995a, 1995b; West et al., 2016; Lee, 2017; Valois et al., 2020). Based on the surveys and the comments in the app, we can confirm that people consider color an interesting indicator as well. People noticed and reported changes in water color and used this indicator to describe the current water quality conditions. The survey at the Besòs River, also showed that people noticed that the improved sewage treatment system resulted in a change from turbid-black-water to more transparent water. Furthermore, in our analysis of the comments in the CrowdWater app, we found comments with descriptions related to weather conditions, sediment transport and their impacts on color. For example:
“Lot of sediments due to the rain of these last days. Upstream” (766073).
“On the right bank and the water is yellow, the center and left is green. I think the flow on the right bank is what is coming from upstream. The green part is what is coming from the affluents of the left side of the valley” (769348).
Thus, people reported on changes in the water level or the presence of water flow, noticed the differences in water color as well and can relate those changes based on the knowledge that they have of the local environmental conditions.
The odor of water has been identified as an important aspect influencing the human perception and assessment of water quality as well (Flotemersch and Aho, 2020; Okumah et al., 2020). In combination with the visual observations of the presence of sewage (and litter), the odor of the water might be one of the most noticeable indicators of pollution for people (West et al., 2016). The results of our surveys support this as smell was one of the water quality indicators that was considered very important for many people, and the analysis of the comments in the app showed that people sometimes refer to odor when describing a river’s condition:
“It smells very bad. There is black sediment in the water. There is garbage and the odor is worse than in the previous point. … (885025)
“Wastewater flow by odor and appearance” (932818).
These descriptions of odor were often linked to presence of garbage or sewage. Sewage was indeed, the most frequently mentioned cause of pollution and also the odor that citizen scientists reported the most in the stream type category in the CrowdWater app. Other citizen science projects have demonstrated that the perception and description of odor of the water, and particularly unpleasant odors, are often an indicator of environmental change and pollution due to, for instance, households or industry wastewater discharge, as well as other types of pollutants, such as agrochemicals or mining waste (Hsu et al., 2020). Similar to other indicators, odor plays a relevant role in water quality assessment within Indigenous Knowledge as well (Harmsworth et al., 2011; Russell et al., 2020; Dupuis, 2022). Thus, citizen science reports and descriptions of odor in rivers are a valuable qualitative water quality indicator where people can describe the water quality conditions based on the perception of a concrete aspect and the knowledge they have of the river.
In addition to referencing specific water quality indicators, some users combined the assessment of visual indicators (vegetation, plastic pollution, color) with measurements of physical–chemical water quality parameters. For example:
"There is water lily, garbage, the water is murky and stagnant, there is not so much movement. 02= 0.73,0.63 Temperature= 22.2 We took a 0.25 ml sample for coliforms Ph 2.6 Conductivity 400*” (885013).
Thus, despite the absence of a specific place in the app to record physical or chemical water quality measurements, citizen scientists recorded this data (Figure 6). This suggests that it would be helpful for citizen science projects that focus on observations that do not require any instruments (like CrowdWater) to also provide space for the systematic reporting of measurements, particularly those made with devices that are relatively easy to obtain and use (like a thermometer). Measurements of physical and chemical water quality parameters are also used by community-based monitoring groups where data are required for political actions and demands, e.g., related to fracking and mining activities (Jalbert and Kinchy, 2015; Ulloa et al., 2020; Godfrid et al., 2021). Indeed, some of these community-based monitoring groups are motivated by perceived changes in water quality such as color or smell (Himley, 2014; Hsu et al., 2020). Physical–chemical measurements are then started to record their observation to prove or confirm the perceived visual (or sensorial) changes in water quality (Morales-Magaña, 2019; Ulloa et al., 2020).
In summary, our results demonstrate that citizen scientists are interested in reporting and describing water quality through their observations and perception of visual indicators. Above all, the many comments related to water quality in the temporary stream and water level categories, suggest that even when the main focus is on water quantity, some citizen scientists also notice changes in water quality and are interested in reporting these changes. These qualitative observations can provide useful information directly, provide background information to interpret quantitative data (e.g., physical–chemical measurements), or improve the understanding of how water is used and why it is perceived in certain ways (Rangecroft et al., 2023).
4.2 Recording qualitative data and knowledge in hydrological citizen science projects
The vision of “modern water” (i.e., a scientific practice that excludes the social dimensions of water) in citizen science projects has led to the dominance of rather technical and quantitative methods (Rusca and Di Baldassarre, 2019; Linton, 2022; Liao and Schmidt, 2023) and a dominant focus on physical or chemical water quality measurements (Njue et al., 2019; Blanco-Ramírez et al., 2023). Qualitative citizen science water quality data can provide a broader contextual understanding of the conditions and uses of waterbodies (Rangecroft et al., 2023). This study shows that within hydrological citizen science studies, it is possible to collect qualitative information about different water quality aspects and causes of pollution. Previous studies have shown that qualitative observations (based on perceptions or visual indicators) can be highly correlated to quantitative measures of water quality (Steinwender et al., 2008; Hsu et al., 2020). Other studies highlighted the connection between western-scientific water quality indicators and water quality assessments based on Indigenous Knowledge, which is often based on perception and changes in odor and smell (Harmsworth et al., 2011; Russell et al., 2020).
The observed changes in water quality in the Besòs River in Barcelona by the survey participants (based on their memories) and the described links to environmental management practices and policies are an example of how qualitative local knowledge enables one to obtain information on how water quality has changed over time. The comments about water quality and the data from the stream type category of the CrowdWater app, furthermore, demonstrate that some aspects can be quantified or are easy to portray and identify in photos (e.g., color, clarity, presence of foam or plastic pollution). Even more importantly, the comments highlight that people want to share their knowledge or concerns about water quality. This knowledge was often linked to the landscape or weather conditions or human activities. For example:
“The water quality is better than in the dry season because it started raining a week ago. There are signs that the water level has risen more than one meter. Also because of this, the garbage in the riverbed has been washed out and the odor and concentration of wastewater has decreased” (994375).
The proximity of a pollution source is an important aspect that influences the perception of river water quality (Levêque and Burns, 2018; Okumah et al., 2020). In our study, we found that CrowdWater app users identify human activities (e.g., agriculture, mining, industry) as sources of pollution. For example:
“Possibly over-fertilized agricultural plots” (907496).
“Pesticides from nearby coffee crops” (762993).
Local knowledge of anthropogenic impacts influences people’s perception and assessment of river water quality (Flotemersch and Aho, 2020). The literature often acknowledges that local people are more aware of and interested in the conditions of waterbodies than regional agencies or national authorities (Mitroi et al., 2020; Okumah et al., 2020). While physical–chemical measurements provide detailed information about specific parameters at a particular time and location, qualitative data and local knowledge can describe the local situation and provide information on long-term environmental changes (Cohen et al., 2021; Rangecroft et al., 2023). However, perceptions of environmental problems (e.g., water pollution) vary spatially and temporally (Hohenthal et al., 2017; Flotemersch and Aho, 2020), and, consequently, experiences and relationships with water differ throughout time and space (Strang, 2004). Some studies suggested that different social groups make sense of and perceive river water quality differently and described how this shapes environmental management and the assessment or recognition of the effectiveness of river restoration programs (Westling et al., 2014). For example, hydrological and geomorphological studies in the Ain River in France, reported that water quality had decreased over time. The long-term lived experiences and visual aspects (presence of algae or animals) of water quality and odor of the water helped to explain how different social groups perceived these river water quality changes (Boyer et al., 2019). Wargyawati et al. (2024) demonstrated that physical–chemical measurements carried out by the government in Indonesia motivated actions to address domestic waste, even though local environmental movements were more concerned over industrial contamination.
In summary, our results suggest that the qualitative method and observations in the stream type category have the potential to expand data collection in citizen science and further explore water issues in greater depth by sharing perceptions and local knowledge (e.g., Fantini, 2017; Rangecroft et al., 2023; Tubino de Souza et al., 2025). Although comments or notes pose challenges with data systematization, they provide a place to describe local environmental changes, and perceptions, concerns, and social or cultural meanings of rivers and water (Fantini, 2017; Hohenthal et al., 2017; Mitroi et al., 2020; Tubino de Souza, 2024). The qualitative approach used in the CrowdWater app can be explored further and adapted to different contexts to complement other monitoring methods. Thus, even though it is necessary to keep in mind that digital citizen science platforms may not be suitable in contexts with limited access to technology or low literacy (Eyng et al., 2022; Blanco-Ramírez et al., 2023, 2025), following recent debates in hydrology (see Quandt, 2022), we argue that the integration of qualitative observations within traditional (mainly quantitative) hydrological citizen science may open the possibilities for citizen scientists to share their experiences and broader understanding of the drivers of water quality conditions.
4.3 Citizen science for a more integrative, interdisciplinary, and collaborative water quality assessment
As mentioned in the introduction, recent discussions in hydrology have emphasised the need to integrate quantitative and qualitative data, particularly local knowledge, into hydrological research (Rangecroft et al., 2021; Thaler, 2022). These discussions have pointed out that local knowledge and other ways of knowing (such as Indigenous Knowledge) that differ from western-scientific techniques (with its focus on metrics and quantification) have often been “overlooked” or dismissed, and that these approaches should be considered because they can help to address the diversity and complexity of human-water relations (Linton and Budds, 2014; Cohen et al., 2021; Thaler, 2022). Still, integrating quantitative and qualitative data is a methodological challenge for water-related research. The importance of overcoming this divide and acknowledging that it is possible to bring together quantitative and qualitative data can contribute to a better interpretation and understanding of human-water relations than solely focusing on one of them (Rusca and Di Baldassarre, 2019; Thaler, 2022).
Citizen science can help to bridge this divide. When citizen scientists connect specific water quality indicators with the presence of an industry, a mine, or livestock, they are ultimately placing water quality within the economic, political and social world where it is transformed. Furthermore, the frequent association of water pollution with sewage is a way to enquire about the problem of failing infrastructure, environmental governance, and development. In this way, qualitative data gathered with hydrological citizen science apps not only provides additional insights into water quality but also makes multiscalar connections beyond the place of observation evident. We, therefore, argue that qualitative citizen science approaches are not only useful to obtain information on certain aspects of water quality but can also be a useful approach for the social and interdisciplinary sciences (e.g., political ecology) as well and help to understand human-water relations. Indeed, the combination of the spatial distribution of measurements of water’s physical, chemical, and biological properties, in combination with qualitative methods enabled some researchers to account for the social, political, and economic processes that explain inequalities in water quality in urban areas in the Global South (Rusca et al., 2017; Bayona-Valderrama et al., 2021; Acevedo-Guerrero, 2022). The question of the ultimate ends of such scientific endeavor should include the possibility of supporting people’s claims for environmental justice. This requires not only interdisciplinary work but also tools and collaboration with communities and social movements in places where water is a contested element. Citizen science may be one of the tools to support this collaboration.
5 Conclusion
Many citizen science studies focus on water quality by measuring physical, chemical, or biological water quality aspects. There is, so far, limited focus on qualitative methods for the assessment of water quality, even though in the absence of physical measurements people develop their own water quality assessment based on memories, practices, and sensory experiences, and use these assessments for everyday decision-making (e.g., whether the water is clean enough for swimming). Our study based on surveys and an analyses of comments in a citizen science app, addresses this gap and shows that citizen scientists find easily observable water quality indicators, such as color, clarity, odor, and the presence of aquatic vegetation, floating substances (e.g., litter and plastic pollution) important. They reported these parameters in the open comments in a hydrological citizen science app, even when their actual observations were focused on water quantity. The participants of the surveys also reported that they noticed changes in water color, odor, increases in plastic pollution, and algae growth over time.
We show that there is a large potential for citizen science to collect qualitative information on water quality and to report local knowledge (e.g., by providing information in additional comments or notes) to broaden the interpretation of traditional quantitative water quality measurements. While this study contributes to the field of citizen science for water quality monitoring, it also provides insights for the social sciences engaged with water-related topics that are less familiar with citizen sciene based monitoring tools as a way to obtain (local) information on human-water relations.
Data availability statement
The raw data supporting the conclusions of this article will be made available by the authors, without undue reservation.
Author contributions
SB-R: Conceptualization, Data curation, Formal analysis, Investigation, Methodology, Visualization, Writing – original draft, Writing – review & editing. IVM: Conceptualization, Methodology, Supervision, Writing – review & editing. AC: Conceptualization, Writing – review & editing. JS: Conceptualization, Supervision, Writing – review & editing.
Funding
The author(s) declare that financial support was received for the research and/or publication of this article. This study is part of the CrowdWater II project funded by the Swiss National Science Foundation (Project: 192125).
Acknowledgments
We thank all citizen scientists of the CrowdWater project for their time and support and for sharing their knowledge and concerns over water quality conditions in the rivers they monitor. We similarly thank all participants of the surveys for their time, comments, and ideas.
Conflict of interest
The authors declare that the research was conducted in the absence of any commercial or financial relationships that could be construed as a potential conflict of interest.
Generative AI statement
The authors declare that no Gen AI was used in the creation of this manuscript.
Any alternative text (alt text) provided alongside figures in this article has been generated by Frontiers with the support of artificial intelligence and reasonable efforts have been made to ensure accuracy, including review by the authors wherever possible. If you identify any issues, please contact us.
Publisher’s note
All claims expressed in this article are solely those of the authors and do not necessarily represent those of their affiliated organizations, or those of the publisher, the editors and the reviewers. Any product that may be evaluated in this article, or claim that may be made by its manufacturer, is not guaranteed or endorsed by the publisher.
Supplementary material
The Supplementary material for this article can be found online at: https://www.frontiersin.org/articles/10.3389/frwa.2025.1552646/full#supplementary-material
Footnotes
1. ^https://crowdwater.ch/en/data/
2. ^The parentheses after each quote refer to the spot ID# in the CrowdWater app (https://www.spotteron.com/crowdwater/spots/SpotID#) and leads to the original comment.
References
Acevedo-Guerrero, T. (2022). Water with larvae: hydrological fertility, inequality, and mosquito urbanism. Environ. Plan. E Nat. Space 8, 13–30. doi: 10.1177/25148486221099801
Ahmed, A., Mumtaz, R., Anwar, H., Mumtaz, S., and Wamar, A. M. (2020). Spatiotemporal trends of recovery from lead contamination in Flint, MI as revealed by crowdsourced water sampling. Water Res. doi: 10.1016/j.watres.2019.115442
Ansari, A. A., Saggu, S., Al-Ghanim, S. M., Abbas, Z. K., Gill, S. S., Khan, F. A., et al. (2017). “Aquatic plant biodiversity: a biological indicator for the monitoring and assessment of water quality” in Plant biodiversity: Monitoring, assessment and conservation. © CAB International 2017. eds. A. A. Ansari, S. S. Gill, Z. K. Abbas, and M. Naeem, 218–227.
Antweiler, C. (1998). Local knowledge and local knowing: an anthropological analysis of contested “cultural products” in the context of development. Anthropos 93, 469–494.
Arce-Nazario, J. (2018). The science and politics of water quality. R. Lave, C. Biermann, and S. N. Lane The Palgrave handbook of critical physical geography (pp. 465–483). Cham: Springer International Publishing.
Bakker, K. (2012). Water: political, biopolitical, material comment. Soc. Stud. Sci. 42, 616–623. doi: 10.1177/0306312712441396
Ballestero, A. (2019). The anthropology of water. Annu. Rev. Anthropol. 48, 405–421. doi: 10.1146/annurev-anthro-102218
Barnett, M. J., Jackson-Smith, D., and Haeffner, M. (2018). ‘Influence of recreational activity on water quality perceptions and concerns in Utah: A replicated analysis’, Journal of Outdoor Recreation and Tourism, 22. doi: 10.1016/j.jort.2017.12.003
Bayona-Valderrama, A., Acevedo-Guerrero, T., and Artur, C. (2021). Cities with mosquitoes: a political ecology of Aedes aegypti’s habitats. Water Alternat. 14, 186–203.
Behmel, S., Damour, M., Ludwig, R., and Rodriguez, M. J. (2016). Water quality monitoring strategies — a review and future perspectives. Sci. Total Environ. 571, 1312–1329. doi: 10.1016/J.SCITOTENV.2016.06.235
Bishop, I. J., Warner, S., Van Noordwijk, T. C. G. E., Nyoni, F. C., and Loiselle, S. (2020). Citizen science monitoring for sustainable development goal indicator 6.3.2 in England and Zambia. Sustainability 12:271. doi: 10.3390/su122410271
Blanchet, C. C., Arzel, C., Davranche, A., Kahilainen, K. K., Secondi, J., Taipale, S., et al. (2022). Ecology and extent of freshwater browning - what we know and what should be studied next in the context of global change. Sci. Total Environ. 812:152420. doi: 10.1016/j.scitotenv.2021.152420
Blanco-Ramírez, S., BañalesSeguel, C., Guardado-Torrez, C., Seibert, J., and van Meerveld, I.. (2025). Implementation of a Global Citizen Science App in Community-Based Water Monitoring: Lessons Learned from the CrowdWater Experiences in Latin America. Citizen Science: Theory and Practice, 10:1–15. doi: 10.5334/cstp.749
Blanco-Ramírez, S, BañalesSeguel, C, Guardado-Torrez, C, Seibert, J, and van Meerveld, I. (2025). Implementation of a Global Citizen Science App in Community-Based Water Monitoring: Lessons Learned from the CrowdWater Experiences in Latin America. Citizen Science: Theory and Practice, 10:1–15.
Blanco-Ramírez, S., van Meerveld, I., and Seibert, J. (2023). Citizen science approaches for water quality measurements. Sci. Total Environ. 897:165436. doi: 10.1016/j.scitotenv.2023.165436
Boyer, A.-L., Comby, E., Flaminio, S., Le Lay, Y.-F., and Cottet, M. (2019). The social dimensions of a river’s environmental quality assessment. Ambio 48, 409–422. doi: 10.1007/s13280-018-1089-9
Brouwer, S., Van der Wielen, P. W., Schriks, M., Claassen, M., and Frijns, J. (2018). Public participation in science: the future and value of citizen science in the drinking water research. Water 10:284. doi: 10.3390/w10030284
Bruns, N. E., Gardner, J. R., and Doyle, M. (2024). Flow-dependent color patches in a Great Plains river. J. Geophys. Res. Biogeosci. 129, 1–10. doi: 10.1029/2023JG007867
Camargo, A., and Cortesi, L. (2019). Flooding water and society. WIREs Water 6:1374. doi: 10.1002/wat2.1374
Cao, Z., Melack, J. M., Liu, M., Kutser, T., Duan, H., and Ma, R. (2023). Shifts, trends, and drivers of lake color across China since the 1980s. Geophys. Res. Lett. 50, 1–10. doi: 10.1029/2023GL103225
Ceccaroni, L. I., Piera, J., Wernand, M. R., Zielinski, O., Busch, J. A., Jan Van Der Woerd, H., et al. (2020). Citclops: a next-generation sensor system for the monitoring of natural waters and a citizens’ observatory for the assessment of ecosystems’ status. PLoS One 15:e0230084. doi: 10.1371/journal.pone.0230084
Cochero, J. (2018). AppEAR: Una aplicación móvil de ciencia ciudadana para mapear la calidad de los hábitats acuáticos continentales. Ecol. Austral 28, 467–479. doi: 10.25260/ea.18.28.2.0.686
Cohen, A., Matthew, M., Neville, K. J., and Wrightson, K. (2021). Colonialism in community-based monitoring: knowledge systems, finance, and power in Canada. Ann. Am. Assoc. Geogr. 111, 1988–2004. doi: 10.1080/24694452.2021.1874865
Corredor-Rodríguez, S. (2024). “Women's bodily experiences accessing and treating water in the Colombian Caribbean 1” in Routledge handbook of gender and water governance. eds. T. Acevedo-Guerrero, L. Bossenbroek, I. Leonardelli, M. Zwarteveen, and S. Kulkarni. 1st ed (London: Routledge).
Davids, J. C., Rutten, M. M., Pandey, A., and Devkota, N., VanDavid Oyen, W., Prajapati, R., and Van De Giesen, N. (2019). Citizen science flow-an assessment of simple streamflow measurement methods. Hydrol. Earth Syst. Sci., 23, 1045–1065. doi: 10.5194/hess-23-1045-2019
Dupuis, C. (2022). The odor of water: a liquid witness to environmental change in the Amazon. Gastronomica 22, 1–9. doi: 10.1525/gfc.2022.22.4.1
Etter, S., Strobl, B., Seibert, J., and van Meerveld, H. J. I. (2020). Value of crowd-based water level class observations for hydrological model calibration. Water Resour. Res. 56, 1–17. doi: 10.1029/2019WR026108
Eyng, V., Gomes, M., Câmpera, L., and Hercos, A. (2022). Engagement in a citizen science project in the Amazon basin. Citizen Sci. Theory Pract. 7, 1–14. doi: 10.5334/cstp.453
Fantini, E. (2017). Picturing waters: a review of photovoice and similar participatory visual research on water governance. WIREs Water 4:1226. doi: 10.1002/WAT2.1226
Flotemersch, J., and Aho, K. (2020). Factors influencing perceptions of aquatic ecosystems. Ambio 50, 425–435. doi: 10.1007/s13280-020-01358-0
Gardner, J. R., Yang, X., Topp, S. N., Ross, M. R. V., Altenau, E. H., and Pavelsky, T. M. (2021). The color of rivers. Geophys. Res. Lett. 48, 1–12. doi: 10.1029/2020GL088946
Gibbs, L. (2014). Freshwater geographies? Place, matter, practice, hope. N. Z. Geogr. 70, 56–60. doi: 10.1111/nzg.12040
Godfrid, J., Damonte, G., and Minchán, A. P. L. (2021). Institutional innovations in mining contexts: the experience of community water monitoring in Argentina and Peru. Rev. Cienc. Polit. 41, 539–562. doi: 10.4067/S0718-090X2021005000121
Harmsworth, G., Young, R., Walker, D., Clapcott, J., and James, T. (2011). Linkages between cultural and scientific indicators of river and stream health. N. Z. J. Mar. Freshw. Res. 45, 423–436. doi: 10.1080/00288330.2011.570767
Hegarty, S., Hayes, A., Regan, F., Bishop, I., and Clinton, R. (2021). Using citizen science to understand river water quality while filling data gaps to meet United Nations sustainable development goal 6 objectives. Sci. Total Environ. 783:146953. doi: 10.1016/j.scitotenv.2021.146953
Himley, M. (2014). Monitoring the impacts of extraction: science and participation in the governance of mining in Peru. Environ. Plan. A 46, 1069–1087. doi: 10.1068/a45631
Hohenthal, J., Minoia, P., and Pellikka, P. (2017). Mapping meaning: critical cartographies for participatory water management in Taita Hills, Kenya. Prof. Geogr. 69, 383–395. doi: 10.1080/00330124.2016.1237294
Hrachowitz, M., Benettin, P., van Breukelen, B. M., Fovet, O., Howden, N. J. K., Ruiz, L., et al. (2016). Transit times—the link between hydrology and water quality at the catchment scale. Wiley Interdiscip. Rev. Water 3, 629–657. doi: 10.1002/wat2.1155
Hsu, A., Yeo, Y., Weinfurter, A., and Yeo, Z. Y. (2020). Emerging digital environmental governance in China: the case of black and smelly waters in China. J. Environ. Plan. Manag. 63, 14–31. doi: 10.1080/09640568.2019.1661228
Jakositz, S., Pillsbury, L., Greenwood, S., Fahnestock, M., McGreavy, B., Bryce, J., et al. (2020). Protection through participation: crowdsourced tap water quality monitoring for enhanced public health. Water Res. 169:115209. doi: 10.1016/j.watres.2019.115209
Jalbert, K., and Kinchy, A. J. (2015). Sense and influence: environmental monitoring tools and the power of citizen science. J. Environ. Policy Plan. 18, 379–397. doi: 10.1080/1523908X.2015.1100985
Julian, J. P., Davies-Colley, R. J., Gallegos, C. L., and Tran, T. V. (2013). Optical water quality of inland waters: a landscape perspective. Ann. Assoc. Am. Geogr. 103, 309–318. doi: 10.1080/00045608.2013.754658
Karpouzoglou, T., Marshall, F., and Mehta, L. (2018). Towards a peri-urban political ecology of water quality decline. Land Use Policy 70, 485–493. doi: 10.1016/j.landusepol.2017.11.004
Kimura, A. H., and Kinchy, A. (2019). Science by the people: Participation, power, and the politics of environmental : Rutgers University Press.
Kritzberg, E. S., Hasselquist, E. M., Kerlep, M. S., Löfgren, S., Olsson, O., Stadmark, J., et al. (2020). Browning of freshwaters: consequences to ecosystem services, underlying drivers, and potential mitigation measures. Ambio. doi: 10.1007/s13280-019-01227-5
Krueger, T., Maynard, C., Carr, G., Bruns, A., Mueller, E. N., and Lane, S. (2016). A transdisciplinary account of water research. WIREs Water 3, 369–389. doi: 10.1002/wat2.1132
Kuhn, C., and Butman, D. (2021). Declining greenness in Arctic-boreal lakes. Proc. Natl. Acad. Sci. USA 118, 1–8. doi: 10.1073/pnas.2021219118
Lai, Y., Zhang, J., Li, W., and Song, Y. (2024). Water quality monitoring of large reservoirs in China based on water color change from 1999 to 2021. J. Hydrol. 633:130988. doi: 10.1016/j.jhydrol.2024.130988
Lee, L.-H. (2017). Appearance’s aesthetic appreciation to inform water quality management of waterscapes. J. Water Resour. Prot. 9, 1645–1659. doi: 10.4236/jwarp.2017.913103
Levêque, J. G., and Burns, R. C. (2018). Water quality perceptions and natural resources extraction: a matter of geography? J. Environ. Manag. 234, 379–386. doi: 10.1016/j.jenvman.2018.11.126
Liao, Y.-K., and Schmidt, J. J. (2023). Hydrosocial geographies: cycles, spaces and spheres of concern. Progress Environ. Geogr. 2, 240–265. doi: 10.1177/27539687231201667
Linton, J. (2022). Waters in the plural: approaches and opportunities for more grounded research and management. Géocarrefour 96, 01–16. doi: 10.4000/geocarrefour.19295
Linton, J., and Budds, J. (2014). The hydrosocial cycle: defining and mobilizing a relational-dialectical approach to water. Geoforum 57, 170–180. doi: 10.1016/j.geoforum.2013.10.008
Lottig, N. R., Wagner, T., Henry, N. N., Cheruvelil, S. S., and Webster, K. E. (2014). Long-term citizen-collected data reveal geographical patterns and temporal trends in lake water clarity. PLoS One 9:95769. doi: 10.1371/journal.pone.0095769
Lowry, C. S., and Fienen, M. N. (2013). CrowdHydrology: crowdsourcing hydrologic data and engaging citizen scientists. Groundwater 51, 151–156. doi: 10.1111/j.1745-6584.2012.00956.x
Luchette, C. J. A., and Crawford, T. (2008). A public participation GIS application for citizen-based watershed monitoring in the Pamlico-Tar River basin, North Carolina. Southeast. Geogr. 48, 184–200. doi: 10.1353/sgo.0.0022
MacLeod, M., Peter, H., Arp, H., Tekman, M. B., and Jahnke, A. (2021). ‘The global threat from plastic pollution’, Science, 373. doi: 10.1126/science.abg5433
Malthus, T. J., Ohmsen, R., and van der Woerd, H. J. (2020). An evaluation of citizen science smartphone apps for inland water quality assessment. Remote Sens 12:578. doi: 10.3390/rs12101578
Martín-Vide, J. P. (2015). Restauración del río Besòs en Barcelona. Historia y lecciones. Ribagua 2, 51–60. doi: 10.1016/j.riba.2015.07.001
Menon, N., George, G., Ranith, R., Sajin, V., Murali, S., Abdulaziz, A., et al. (2021). Citizen science tools reveal changes in estuarine water quality following demolition of buildings. Remote Sens 13:1683. doi: 10.3390/rs13091683
Metcalfe, A. N., Kennedy, T. A., Mendez, G. A., and Muehlbauer, J. D. (2022). Applied citizen science in freshwater research. Wiley Interdiscip. Rev. Water 9, 1–11. doi: 10.1002/wat2.1578
Millar, E. E., Hazell, E. C., and Melles, S. J. (2018). The “cottage effect” in citizen science? Spatial bias in aquatic monitoring programs. Int. J. Geogr. Inf. Sci. 33, 1612–1632. doi: 10.1080/13658816.2018.1423686
Mitroi, V., Chrislain Ahi, K., Bulot, P.-Y., Tra, F., Deroubaix, J. F., and Ahoutou, M. K. (2020). Can participatory approaches strengthen the monitoring of cyanobacterial blooms in developing countries? Results from a pilot study conducted in the lagoon Aghien (Ivory Coast). PLoS One 15:e0238832. doi: 10.1371/journal.pone.0238832
Molle, F., Lankford, B., and Lave, R. (2024). Water and the politics of quantification: a programmatic review. Water Altern. 17, 325–347.
Morales-Magaña, M. (2019). “Más allá de la calidad. Hacia un monitoreo integral comunitario de agua” in Experiencias comunitarias en la gestión del agua: aportes desde la innovación social, la ciencia participativa y el diálogo de saberes. eds. J. Paneque-Galvez and M. Morales-Magaña (Newcastle upon Tyne, UK: Waterlat-Gobacit Network Working Papers).
Naess, L. O. (2013). The role of local knowledge in adaptation to climate change. Wiley Interdiscip. Rev. Clim. Chang. 4, 99–106. doi: 10.1002/WCC.204
Nare, L., Love, D., and Hoko, Z. (2006). Involvement of stakeholders in the water quality monitoring and surveillance system: the case of Mzingwane catchment, Zimbabwe. Phys. Chem. Earth 31, 707–712. doi: 10.1016/j.pce.2006.08.037
Njue, N., Stenfert Kroese, J., Gräf, J., Jacobs, S. R., Weeser, B., Breuer, L., et al. (2019). Citizen science in hydrological monitoring and ecosystem services management: state of the art and future prospects. Sci. Total Environ. 693:133531. doi: 10.1016/j.scitotenv.2019.07.337
Okumah, M., Yeboah, A. S., and Bonyah, S. K. (2020). What matters most? Stakeholders’ perceptions of river water quality. Land Use Policy 99:104824. doi: 10.1016/j.landusepol.2020.104824
Omer, N. H. (2019). “Water quality parameters” in Water quality - science, assessments and policy (London, UK: IntechOpen).
Peckenham, J. M., and Peckenham, S. K. (2014). Assessment of quality for middle level and high school student-generated water quality data. J. Am. Water Resour. Assoc. 50, 1477–1487. doi: 10.1111/JAWR.12213
Quandt, A. (2022). The role of qualitative social science. Discussion of “guiding principles for hydrologists conducting interdisciplinary research and fieldwork with participants.”. Hydrol. Sci. J. 67, 1141–1144. doi: 10.1080/02626667.2022.2060107
Quinlivan, L., Chapman, D. V., and Sullivan, T. (2020). Applying citizen science to monitor for the sustainable development goal indicator 6.3.2: a review. Environ. Monit. Assess. 192:218. doi: 10.1007/s10661-020-8193-6
Rangecroft, S., Dextre, R. M., Richter, I., Grados Bueno, C. V., Kelly, C., Turin, C., et al. (2023). Unravelling and understanding local perceptions of water quality in the Santa basin, Peru. J. Hydrol. 625:129949. doi: 10.1016/j.jhydrol.2023.129949
Rangecroft, S., Rohse, M., Banks, E. W., Day, R., Di Baldassarre, G., Frommen, T., et al. (2021). Guiding principles for hydrologists conducting interdisciplinary research and fieldwork with participants. Hydrol. Sci. J. 66, 214–225. doi: 10.1080/02626667.2020.1852241
Rusca, M., Boakye-Ansah, A. S., Loftus, A., Ferrero, G., and van der Zaag, P. (2017). An interdisciplinary political ecology of drinking water quality. Exploring socio-ecological inequalities in Lilongwe’s water supply network. Geoforum 84, 138–146. doi: 10.1016/j.geoforum.2017.06.013
Rusca, M., and Di Baldassarre, G. (2019). Interdisciplinary critical geographies of water: capturing the mutual shaping of society and hydrological flows. Water 11:973. doi: 10.3390/w11101973
Russell, S., Ens, E., and Rangers, N. Y. (2020). “We don’t want to drink that water”: cross-cultural indicators of billabong water quality in remote indigenous Australia. Mar. Freshw. Res. 71, 1221–1233. doi: 10.1071/MF19305
Russell, S., Ens, E., and Rangers, N. Y. (2021). “Now it’s not a billabong” eco-cultural assessment of billabong condition in remote northern Australia. Mar. Freshw. Res. 72, 925–941. doi: 10.1071/MF20080
Sansom, G., Berke, P., Mcdonald, T., Shipp, E., Horney, J., Blake, D., et al. (2016). Confirming the environmental concerns of community members utilizing participatory-based research in the Houston neighborhood of Manchester. Int. J. Environ. Res. Public Health. doi: 10.3390/ijerph13090839
Scott, A. B., and Frost, P. C. (2017). Monitoring water quality in Toronto’s urban stormwater ponds: assessing participation rates and data quality of water sampling by citizen scientists in the FreshWater watch. Sci. Total Environ. 592, 738–744. doi: 10.1016/j.scitotenv.2017.01.201
Sefton, D. F., Little, J. R., Hardin, J. A., and Hammel, J. W. W. (1984). Volunteer lake monitoring: citizen action to improve lakes. Lake Reserv. Manage. 1, 473–477. doi: 10.1080/07438148409354559
Seibert, J., Strobl, B., Etter, S., Hummer, P., and van Meerveld, H. J. (2019). Virtual staff gauges for crowd-based stream level observations. Front. Earth Sci. 7:70. doi: 10.3389/feart.2019.00070
Smith, D. G., Croker, G. F., and McFarlane, K. (1995a). Human perception of water appearance: 1. Clarity and colour for bathing and aesthetics. N. Z. J. Mar. Freshw. Res. 29, 29–43. doi: 10.1080/00288330.1995.9516637
Smith, D. G., Croker, G. F., and McFarlane, K. (1995b). Human perception of water appearance: 2. Colour judgment, and the influence of perceptual set on perceived water suitability for use. N. Z. J. Mar. Freshw. Res. 29, 45–50. doi: 10.1080/00288330.1995.9516638
Steinwender, A., Gundacker, C., and Wittmann, K. J. (2008). Objective versus subjective assessments of environmental quality of standing and running waters in a large city. Landsc. Urban Plann. 84, 116–126. doi: 10.1016/j.landurbplan.2007.07.001
Tandlich, R. (2020). Citizen science based monitoring of microbial water quality at a single household in a south African local municipality during the COVID19 lockdown. Nova Biotechnol. Chim. 19, 116–123. doi: 10.36547/nbc.v19i1.586
Tasseron, P., Zinsmeister, H., Rambonnet, L., Hiemstra, A. F., and Siepman, D., and Emmerik, T. van. (2020). Plastic hotspot mapping in urban water systems. Geosciences, 10, 1–11. doi: 10.3390/geosciences10090342
Thaler, T. (2022). Human–water research: discussion of “guiding principles for hydrologists conducting interdisciplinary research and fieldwork with participants.”. Hydrol. Sci. J. 67, 2205–2210. doi: 10.1080/02626667.2022.2128803
Tubino de Souza, D. (2024). Unveiling pathways to enhance social learning processes in water struggles. Water 16:629. doi: 10.3390/w16050629
Tubino de Souza, D., Hommes, L., Wals, A., Hoogesteger, J., Boelens, R., Duarte-Abadía, B., et al. (2025). ‘River co-learning arenas: principles and practices for transdisciplinary knowledge co-creation and multi-scalar (inter)action’, Local Environment, 30. doi: 10.1080/13549839.2024.2428215
Turunen, J., and Aroviita, J. (2024). Influence of water color and catchment lake cover on stream macroinvertebrate communities: ecological insights into browning effects. Water Res. 250:121048. doi: 10.1016/j.watres.2023.121048
Ulloa, A., Godfrid, J., Damonte, G., Quiroga, C., and López, A. P. (2020). Monitoreos hídricos comunitarios: conocimientos locales como defensa territorial y ambiental en Argentina, Perú y Colombia. Íconos Rev. Ciencias Soc. XXV, 77–97. doi: 10.17141/iconos.69.2021.4489
UNEP (2024) Progress on Ambient Water Quality. Mid-term status of SDG Indicator 6.3.2 and acceleration needs, with a special focus on Health.
Valois, A. E., Milne, J. R., Heath, M. W., Davies-Colley, R. J., Martin, E., and Stott, R. (2020). Community volunteer assessment of recreational water quality in the Hutt River, Wellington. N. Z. J. Mar. Freshw. Res. 54, 200–217. doi: 10.1080/00288330.2019.1700136
van Emmerik, T., Seibert, J., Strobl, B., Etter, S., den Oudendammer, T., Rutten, M., et al. (2020). Crowd-based observations of riverine macroplastic pollution. Front. Earth Sci. 8, 1–12. doi: 10.3389/feart.2020.00298
Wargyawati, N. M. G., Barba Lata, I., and Buizer, M. (2024). Which knowledge counts? Contested meanings of water quality, responsibility and involvement in river restoration discourse in Indonesia. J. Environ. Plan. Manag. 67, 2303–2326. doi: 10.1080/09640568.2023.2185508
Weeser, B., Stenfert Kroese, J., Jacobs, S. R., Njue, N., Kemboi, Z., Ran, A., et al. (2018). Citizen science pioneers in Kenya – a crowdsourced approach for hydrological monitoring. Sci. Total Environ. 632, 1590–1599. doi: 10.1016/j.scitotenv.2018.03.130
West, C. T., and Roncoli, O. F. (2007). Local perceptions and regional climate trends on the Central Plateau of Burkina Faso. Land Degradation & Development, 607. doi: 10.1002/ldr
West, A. O., Nolan, J. M., and Scott, J. T. (2016). Optical water quality and human perceptions: a synthesis. WIREs Water 3, 167–180. doi: 10.1002/wat2.1127
Westling, E. L., Surridge, B. W. J., Sharp, L., and Lerner, D. N. (2014). Making sense of landscape change: long-term perceptions among local residents following river restoration. J. Hydrol. 519, 2613–2623. doi: 10.1016/j.jhydrol.2014.09.029
Yates, J. S., Harris, L. M., and Wilson, N. J. (2017). Multiple ontologies of water: politics, conflict and implications for governance. Environ. Plan. D Soc. Space 35, 797–815. doi: 10.1177/0263775817700395
Keywords: water quality, citizen science, qualitative assessments, local knowledge, perceptions
Citation: Blanco-Ramírez S, van Meerveld I, Camargo A and Seibert J (2025) “The water is murky, the water is not moving”: qualitative water quality assessment by citizen scientists. Front. Water. 7:1552646. doi: 10.3389/frwa.2025.1552646
Edited by:
Jenia Mukherjee, Indian Institute of Technology Kharagpur, IndiaReviewed by:
Mehebub Sahana, The University of Manchester, United KingdomAmrita Sen, Indian Institute of Technology Kharagpur, India
Copyright © 2025 Blanco-Ramírez, van Meerveld, Camargo and Seibert. This is an open-access article distributed under the terms of the Creative Commons Attribution License (CC BY). The use, distribution or reproduction in other forums is permitted, provided the original author(s) and the copyright owner(s) are credited and that the original publication in this journal is cited, in accordance with accepted academic practice. No use, distribution or reproduction is permitted which does not comply with these terms.
*Correspondence: Sara Blanco-Ramírez, c2FyYS5ibGFuY29AZ2VvLnV6aC5jaA==