 Gefen Ronen Eliraz
 Ariel Aviram
 Opher Mendelsohn
 Dror Avisar
- Department of Geophysics and Earth Sciences, The Water Research Center, Faculty of Exact Sciences, Tel Aviv University, Tel Aviv, Israel
Integrated knowledge of the interlinkage between water access and food security is essential for informing future intervention strategies. This study evaluates the role of physical water infrastructure in providing safe drinking water, and its impact on the dietary diversity within rural communities in the Dodoma region of Tanzania. By comparing households in communities with and without water-intervention projects, finding demonstrates that proximity to water sources significantly enhances dietary outcomes. The level of nutrition for the communities with and without water-intervention projects were evaluated by food consumption score (FCS) and dietary diversity score (DDS). A decreasing trend of FCS and DDS with an increase in the time needed to fetch water indicated a significant negative correlation (Spearman's correlation analyzing all participants = −0.178, p < 0.001 and −0.221, p < 0.001, respectively). Households near water resources had higher FCS and DDS than those farther away, suggesting that water supply infrastructure projects enhance both sustainable water and nutrition goals.
1 Introduction
Challenges posed by the global water crisis include a growing number of people facing issues related to water availability, accessibility, and quality, which directly impact human health and nutrition (Young et al., 2019), especially in developing countries (UNESCO World Water Assessment Programme, 2019). Safe drinking water has been recognized as a fundamental human right, and international effort has been invested in achieving “universal and equitable access to safe and affordable drinking water for all” (UN General Assembly, 2015; UNESCO World Water Assessment Programme, 2019). One action taken to achieve this by 2030 has been the adoption of sustainable development goals (SDGs) by the UN (UN General Assembly, 2015).
The 6th SDG—Clean water and sanitation—incorporates a substantially broader spectrum of water-related targets and is interlinked to different goals and targets (Song and Jang, 2023). Water is a vital nutrient source and a driver for improved food security (Jéquier and Constant, 2009), as it plays a central role in agriculture and food production (FAO, 2017; FAO et al., 2020). Synergies and the importance of water availability for food and nutrition security have been demonstrated (Bandari et al., 2022; Nounkeu et al., 2019; Young, 2021; Young et al., 2023). Many studies analyzing the causes and consequences of malnutrition have examined the effects of demographic and socioeconomic parameters (Mabhaudhi et al., 2016; Ringler et al., 2018). The impact of factors such as gender and marital status of the household head, father's and mother's/caregiver's level of literacy, occupation, or education, and the number of people living in each household were evaluated (Mabhaudhi et al., 2016). However, in many studies evaluating malnutrition it has become apparent that food and water insecurities are intertwined (Mabhaudhi et al., 2016; Ringler et al., 2018; UN, 2017). The opportunity to grow kitchen gardens as a food source when water is available was demonstrated (Mabhaudhi et al., 2016), and its contribution to food diversity in child populations was ascertained (Brewis et al., 2020; Schuster et al., 2020). Results indicated a higher probability of malnutrition or future food insecurity in children aged 6–23 months who grow up in households with suboptimal water access: the likelihood of achieving a minimum dietary diversity score (DDS) in these children was two percentage points lower (Choudhary et al., 2020).
Previous attitudes efforts to address food and nutrition security primarily relied on direct interventions aimed at reducing hunger, or on water-supply initiatives that were narrowly focused on ensuring the provision of higher-quality drinking water. Over time, these approaches have been evolved into a broader conceptualization of integrated interventions (Ringler and Paulo, 2020; Thacker et al., 2019; UN, 2017; Young et al., 2023). While the foundational role of water availability is a driver of household food security has gained recognition and been explored in recent studies (Brewis et al., 2020; Miller et al., 2021; Young, 2021; Young et al., 2023, 2021), significant knowledge gaps remain. The existing literature has established a conceptual link between water and food insecurity, offering a theoretical framework to explore their interplay. However, empirical evidence on how water-supply interventions, beyond merely providing safe drinking water, contribute to improving household dietary diversity is still sparse. Furthermore, the direct mechanisms connecting enhanced water availability to improved food production and consumption patterns remain underexplored and insufficiently clarified with a moderate amount of evidence addressing the direct links (Choudhary et al., 2020; Miller et al., 2021).
This study examines the critical relationship between water accessibility, the implementation of water-intervention projects involving physical water supply infrastructure, and their subsequent impact on household dietary diversity in rural communities of the Dodoma region, Tanzania. The rationale for this research lies in addressing existing gaps in understanding how improved water availability influences dietary outcomes, contributing to the broader discourse on the water-food nexus. The study employs a comparative survey approach, analyzing data from communities with and without water-intervention projects that involving physical water supply infrastructure. Water accessibility is assessed alongside food security indicators such as food consumption and dietary diversity scores to determine the role of enhanced water availability on food security. This research's key questions deal with: (1) How does the presence of physical water supply infrastructure affect water accessibility at the household level? (2) To what extent does improve water accessibility contribute to higher food consumption and dietary diversity scores?
2 Materials and methods
To evaluate the direct and indirect impacts of water-intervention projects featuring physical water supply infrastructure in the rural region of Dodoma, Tanzania, a retrospective comparison was conducted. This analysis utilized data collected through household surveys and key informant interviews (detailed in Section 2.2.2 & Supplementary Data 1, Supplementary Figure 1). The comparative approach aimed to assess whether the establishment of water supply infrastructure leads to improvements in water-related parameters (detailed in Section 2.2.3) and food score indicators (detailed in Section 2.2.4). The methodological approach and integration of data and information schematically summarize in Figure 1.
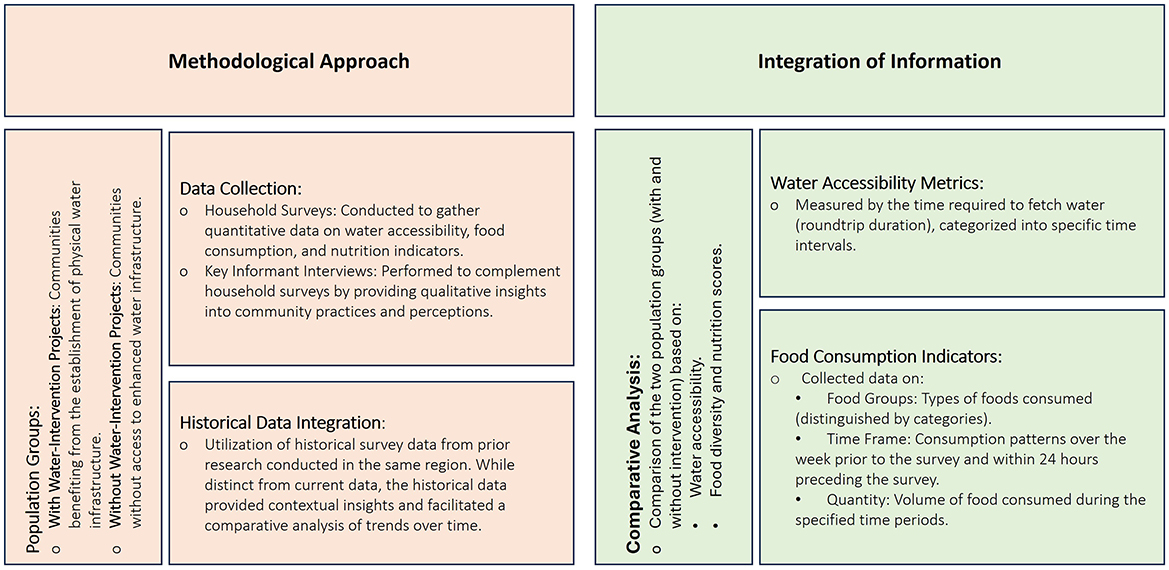
Figure 1. Summarizing scheme of the methodological approach and the integration of data and information.
2.1 Materials
Primary data for this research was gathered through household surveys and key informant interviews. Additionally, data collected in the Dodoma region in 2015 (Mbwana et al., 2016) was used as secondary data source for comparison in this study. It is important to emphasize that there is no direct association between the data collected by Mbwana et al. (2016), and the data from this research other than the fact that the same parameters and area were examined. While only general statistics and information were accessible from this latter data source, it enabled an additional analytical perspective regarding the impact of time by comparison to the current data collected.
2.2 Methods
2.2.1 Study area and population comparison
The rural region of Dodoma is situated in the central part of Tanzania (Supplementary Figure 1), where there is a high level of water and nutrition insecurity (WFP, 2009; FAO, 2019).
The natural water resources available to the rural communities in the area are local shallow wells, streams, and swamps. Most of them are not protected and contain low-quality water. These sources often dry up during the dry season, so the residents must travel long distances to fetch their water. The residents' dietary intake is primarily based on cereals, with bulrush and millet as the staple grains, some groundnuts, and edible wild products, especially vegetables and fruit (Mbwana et al., 2016; WFP, 2009).
Our study focused on the influence of water-project interventions involving physical water supply infrastructure carried out by innovation Africa (iA) in the 2 years prior to this study. The pool for the research population consisted of a non-random list of 95 villages within a radius of 85 km around Dodoma City. The list included two types of villages. One type consisted of 54 post-intervention villages, up to 2 years after the intervention project had been completed, to be the pool for the treatment group. The second type consisted of 41 villages with limited access to clean water—the pool for the control group. A cluster sampling method was used to select four villages in which water supply infrastructure had been established: Mbalawala, Ndebwe, Huzi, and Ilewelo (treatment group), and four villages with no water supply infrastructure: Mnala, Chinoje, Kazaroho, and Ganikwa (control group). To optimize scattering of the interviews, each village was divided into four “hamlets” (north, south, east, and west), and similar numbers of households, at least 100 m apart, were randomly selected in each hamlet. A total of 229 and 201 households were selected for interviews in the treatment and control groups, respectively.
2.2.2 Household survey
Quantitative household surveys were performed by local graduate students from the University of Dodoma who are familiar with the culture and language. The English version of the questionnaire was based on past questionnaires that had been culturally adapted to the Dodoma region (Mbwana et al., 2016) and was translated into the local language by the enumerator's team. Considering that a detailed list of households wasn't available, the following method was used to select the villages. Each village divides into “Hamlets” (sectors). An equal number of households were randomly selected in each hamlet, with a minimum distance of 100 meters between them. At least 50 households were selected in each village, summing up to a sample size of 436 quantitative questionaries in total. In addition, 34 in-depth interviews were conducted with village leaders and key players to analyze general implications. The interviewer arrived at each household and administered a wide-scope questionnaire about demographics, drinking-water accessibility, and food diversity consumption. The interviews were recorded. Forms were filled out manually and later uploaded to the central database on the cloud. The interview framework and survey questionaries are available upon request.
The survey information was explained to the household heads and spouses, and they all had to sign a consent form to participate in the study. Approval for the research was given retrospectively by the Ethics Committee of Tel Aviv University (reference no. 0005689-1).
2.2.3 Water accessibility and availability
The metric for water insecurity was distance to a water source, based on the benchmark defined by the service ladder in SDG 6 to assess water availability and accessibility (WHO and UNICEF, 2018). In this study, water insecurity refers to the time for a household resident to reach the water resource, which is one aspect of water insecurity. Clean-water availability and accessibility are leveled by roundtrip time to the water resource and back. The analysis refers to the collection of water during the dry season. Six categories of distance to water were defined in the questionnaire as follows: in-house; less than 10 min; 10–30 min; 31–60 min; 61–120 min; more than 120 minutes and refer to the distance to drinking-water sources.
2.2.4 Food security indexes: food consumption score (FCS) and DDS
Food security is achieved when a household has access to enough varied of food that support a quality, balanced nutrients diet. For the household dietary diversity parameters, a questionnaire developed by the Food and Agriculture Organization (FAO) was used (FAO, 2010), with the adjustment suggested by Mbwana et al. (2016). Dietary intake was scored using two acknowledged international indicators for the assessment of nutrition security. The markers refer to the number of food groups consumed in a defined time frame, as discussed elsewhere (Bandyopadhyay et al., 2021; FAO, 2010; Kennedy et al., 2010; Swindale and Bilinsky, 2006). Briefly, FCS calculates the overall nutritional value of a household during the 7 days prior to the survey, looking at nine food groups and ranging from 7 to 112. DDS calculates food intake in the last 24 h, looking at 12 food groups, and ranging from 1 to 12. More details are presented in Supplementary Table 1. Two consumption-level thresholds divided the FCS into three nutrition levels: the “poor” level at FCS ≤ 21, the “borderline” level where 21 < FCS ≤ 35, and the “acceptable” level at FCS > 35 (WFP, 2009). DDS index also ranked three consumption levels by two threshold values. The low level (LDD) consisted of DDS ≤ 3, the medium level (MDD) is 3 < DDS ≤ 5, and the high level (HDD) when 5 < DDS (WFP, 2009).
2.2.5 Data analysis and statistics
Data entry and analysis were conducted with Excel 365 and SPSS version 28. A significance level of 5% (p-value < 0.05) was considered significant for all analyses. Demographic and socioeconomic parameters were compared between treatment and control groups. Answers to the quantitative questionnaire were gathered on Excel sheets to create the main database. Time categories presented in the interviews defining the distance to water resources were coded as: in-house = 1; less than 10 min = 2; 10–30 min = 3; 31–60 min = 4; 61–120 min = 5; more than 120 min = 6. A quantitative expression for the categories according to the median time duration in each category was given at a later advanced stage. Time categories were quantified to examine the proportional impact of each distance category. Population percentage was calculated for each distance-from-water-resource category while examining the whole population first and then comparing the population percentages of the treatment and control groups in each distance category. Two different aspects of dietary intake score were examined. The first looked at how the population is distributed across the three levels of dietary diversity, and the second calculated the average scores for each level of dietary diversity. These aspects were first examined in the total research population, and then the average scores of the treatment group were compared to the respective scores calculated for the control group.
After analyzing the characteristics of water accessibility and dietary diversity of the population in the region, the impact of the water supply infrastructure was evaluated. Kruskal–Wallis test and Bonferroni post-hoc analysis were conducted using SPSS to determine whether the FCS differed for different distance-from-water-resource categories. Spearman correlation between distance to water and food diversity indexes in each group separately and both groups together was calculated to analyze the role of distance to water on FCS.
3 Results
This study was conducted between August 2020 and July 2022; the questionnaires were administered from August 2021 to November 2021. We first associated the socioeconomic conditions of the treatment and control groups, and then compared water accessibility and food diversity scores, and analyzed the impact of water accessibility on those scores.
3.1 Retrospective comparison
Impact estimation of the water projects was based on a matching approach and selection of comparison villages. Prior to the water-intervention projects, all households in that area collected their water from similar natural and polluted sources.
3.2 Sociodemographic characteristics of the participants
A total of 436 households consented to participate in the study. The survey respondents were the person in each family responsible for food preparation and serving, water collection, and childcare, which was the mother/woman in 98% of the cases. Overall, six respondents did not respond to the question regarding distance to water resources and were therefore excluded from the study analyses. Pre-existing data from a previous study (Mbwana et al., 2016) were used for the time-perspective analysis (Table 1). Demographic comparison between the groups, indicating similarity in relation to gender of household head, marital status and ages. Small gaps expressed in categories of occupation and education, showing lower percentage of farmers and higher percentage of entrepreneurs in the treatment vs. control group, and lower percentage of literate in the treatment group. Compared to the population in rural Dodoma in 2015 (Mbwana et al., 2016) results indicated that the sociodemographic characteristics were similar to those in the current study (Table 1-last two columns).
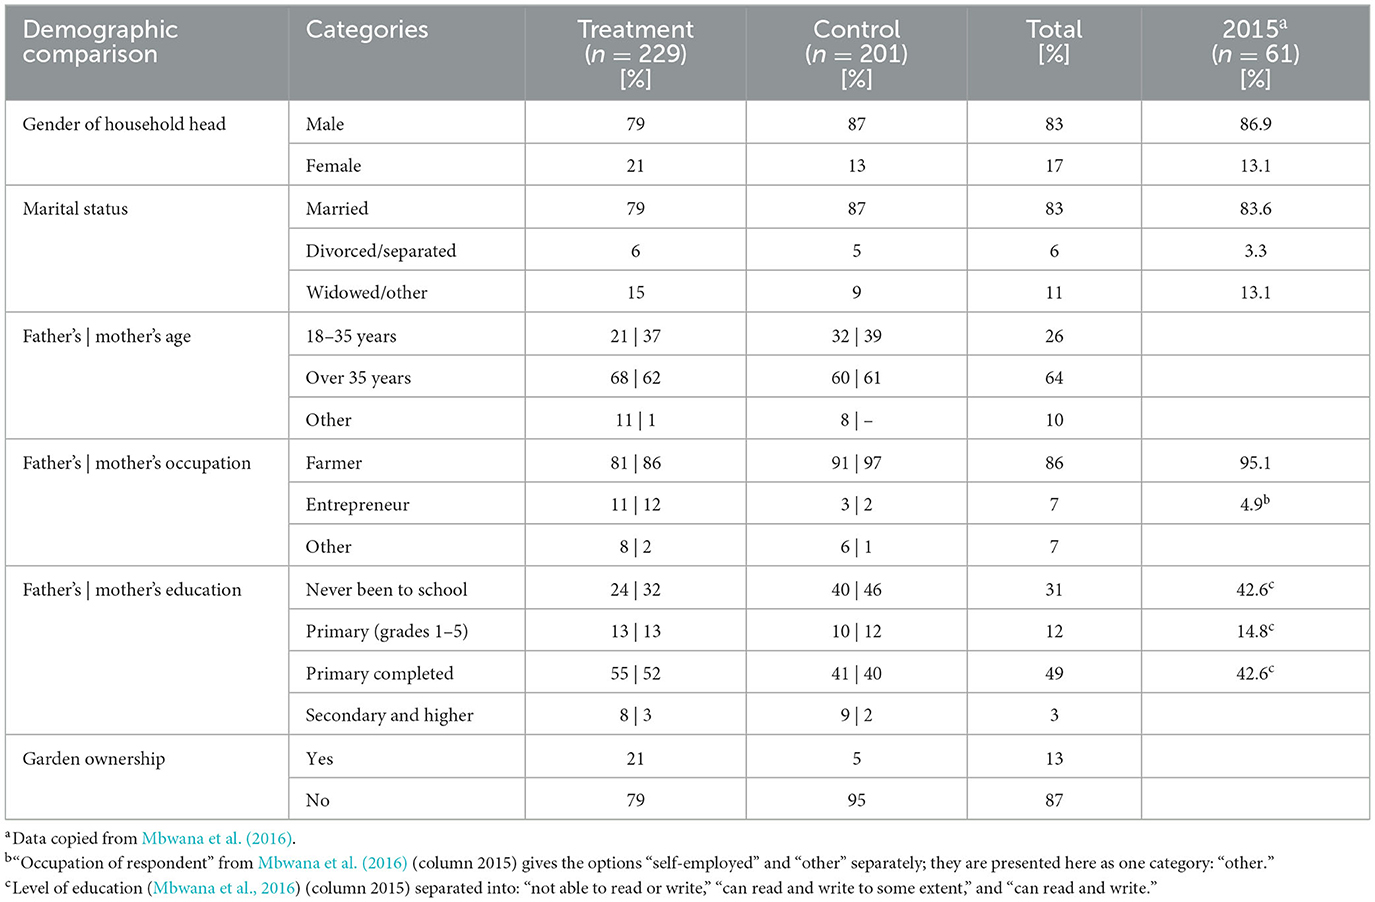
Table 1. Demographic characteristics of households (n = 430).
3.3 Water accessibility
To understand the contribution of water interventions to water accessibility, water access-related measurements were defined. The analysis included all surveyed households, both groups treatment and control (Figure 2A), indicated a substantial decrease in the total number of households as the distance to water increased. There, the total number of households decreased from 144 to 38 households (−23%) as the distance to water increased from “in house” (i.e., 0 min) and “1–10 min” to “over 120 min” (Figure 2A). A comparison of the treatment group to the control group (Figure 2B) highlighted three key findings. (1) Only 7% of the population had access to “in-house” water supply infrastructure, all of whom were in communities with from the treatment group; (2) 19% of the population needed to travel more than 2 h to fetch water, and all of these were in communities from the control group; (3) Proximity to water was unevenly distributed across the two groups. As the distance to water resources increased, the proportion of the population from the treatment group decreased, indicating that most households in the treatment group were located closer to water resources, while the majority of the control group fell into higher distance categories. The results revealed that the treatment group was concentrated in the closest distance categories, with 86% of households spending less than 30 min and 98% located within 60 min of water resources. In contrast, the control group was spread across higher distance categories, with only 45% located within the first three distance categories (0–60 min to water resources), whereas the other 55% needed to travel 61 to over 120 min to reach a water resource (Figure 2B).
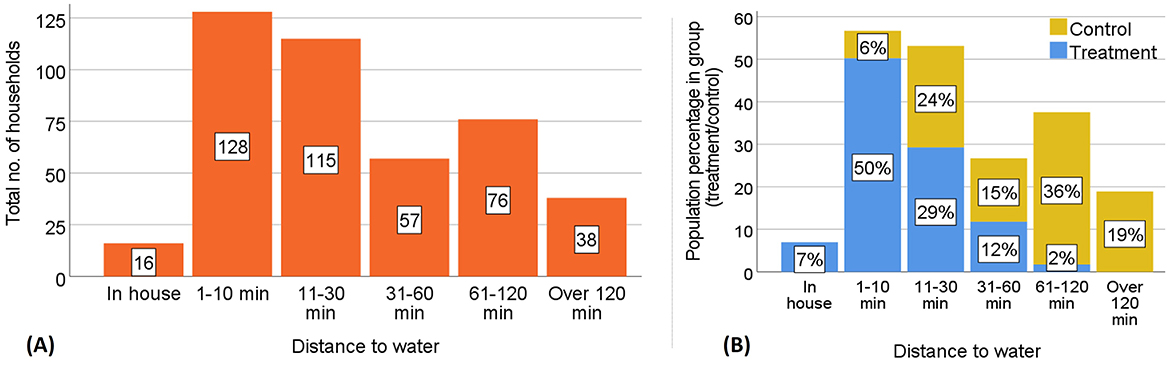
Figure 2. Population distribution according to distance to a water resource. (A) Total number of households in each distance category. (B) Population percentage of treatment and control group in each distance category. Blue bars, treatment group; yellow bars, control group.
3.4 Dietary food diversity indexes
DDS and FCS were calculated for each household, category, and group included in the research (Table 2). Spearman's correlation between FCS and DDS was 0.49 (p < 0.01).
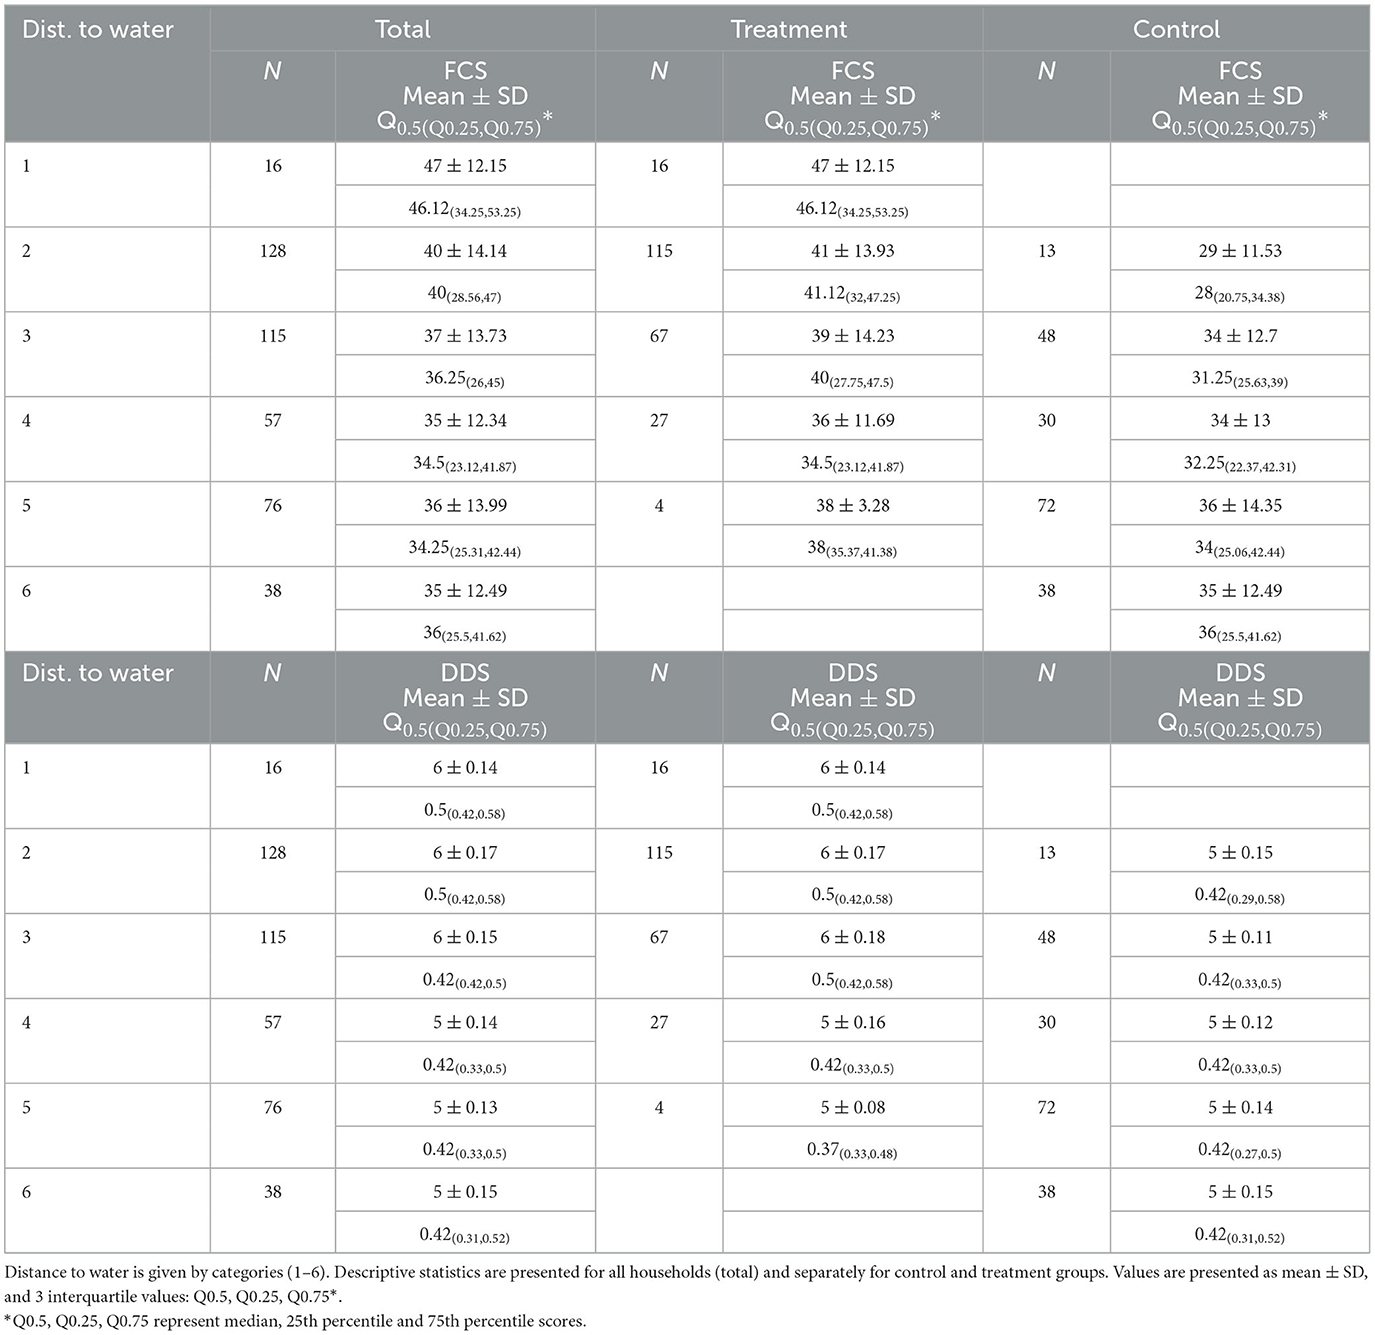
Table 2. Descriptive statistics of food consumption score (FCS) and dietary diversity score (DDS) vs. distance from water resource.
A comparison of the median scores revealed that the treatment group outperforms the control group in both FCS (40 vs. 33) and DDS (6 vs. 5), as shown in Figures 3A, B, respectively. A better situation for the treatment group related to the control group also emerged when distributing the population into three levels of food diversity consumption according to the FCS and DDS (Figures 3C, D). A stratification of the population percentage into three levels of FCS and DDS, respectively. More than 50% of the population in the treatment group was in the high nutritional diversity category, under both DDS and FCS stratification, showing 52% of the treatment group in relation to the DDS, and 62% of the population in FCS. In contrast, around 60% of the population in the control group was in the combined medium and low nutritional diversity categories, showing 65% of the control group in relation to the DDS and 57% of the control group in relation to the DDS. Although the two index scores are not equal, a similar classification was obtained, therefore only the FCS indicator was used for further analyses.
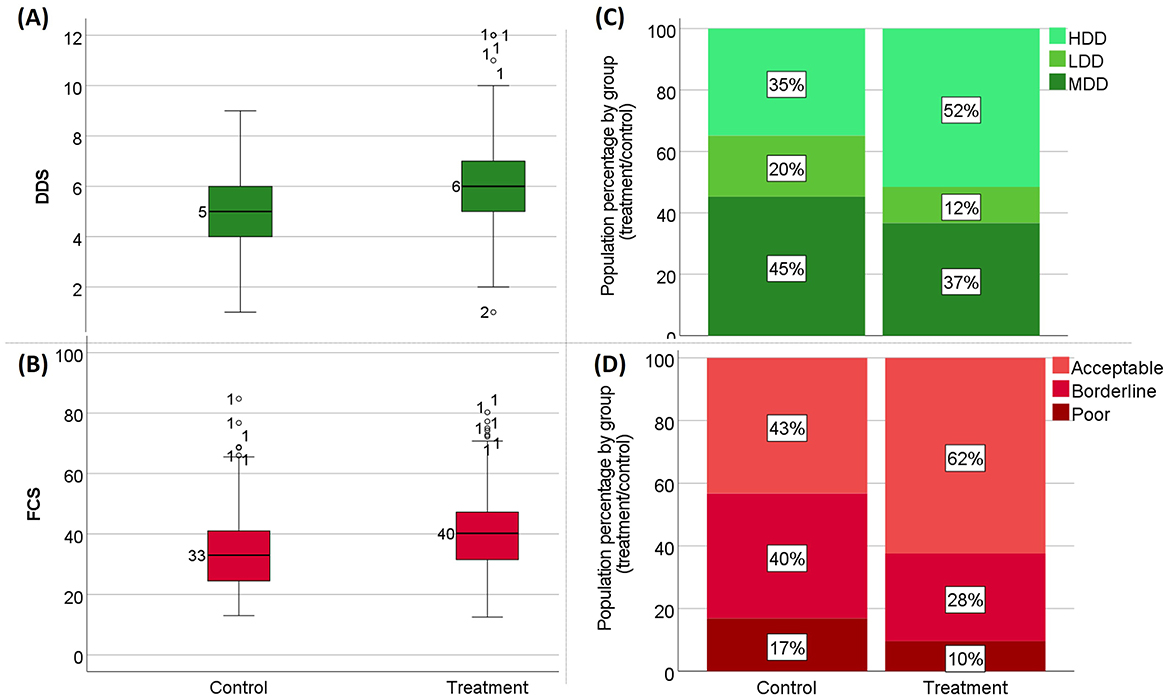
Figure 3. Comparison of dietary diversity score (DDS) and food consumption score (FCS) between treatment and control groups. (A) Median DDS comparing control and treatment group (left and right, respectively). (B) Median FCS comparing control and treatment groups (left and right, respectively). (C) Distribution of the population percentage into low (LDD), medium (MDD), and high (HDD) (green, dark green, and light green, respectively) DDS, comparing control (n = 201) and treatment (n = 229) groups. (D) Distribution of the population percentage into poor, borderline, and acceptable (dark red, red, and light red, respectively) FCS, comparing control (n = 201) and treatment (n = 229) groups.
3.5 The relationship between household distance to water and FCS
The impact of water intervention projects, which included the establishment of physical water supply infrastructure was evaluated by examining the relationship between distance to water resources on food security and nutrition outcomes. Communities with water intervention projects demonstrated closer proximity to water sources, reflecting an improved water accessibility situation. This enhanced accessibility was further analyzed in relation to its influence on food and nutrition outcomes, emphasizing the connection between water intervention projects and dietary improvements. A decrease in the score medians and ranges was seen when the analysis included all participants or the treatment group only (Figures 4A, C). However, when the analysis included only the control group (Figure 4B), no clear trend was observed. Some of the FCS values were extreme and outside the statistical quartile ranges calculated for the distance-from-water groups of households. Nevertheless, Kruskal–Wallis test was conducted to determine whether the FCS is substantially different for groups at different distances from the main water resources. The differences between the rank totals of “in house” (302.91), “1–10 min” (238.37), “11–30 min” (210.09), “31–60 min” (191.78), “61–120 min” (194.86), and “over 120 min” (194.89) groups were significant: H(5, n = 430) = 17.69, p = 0.003.
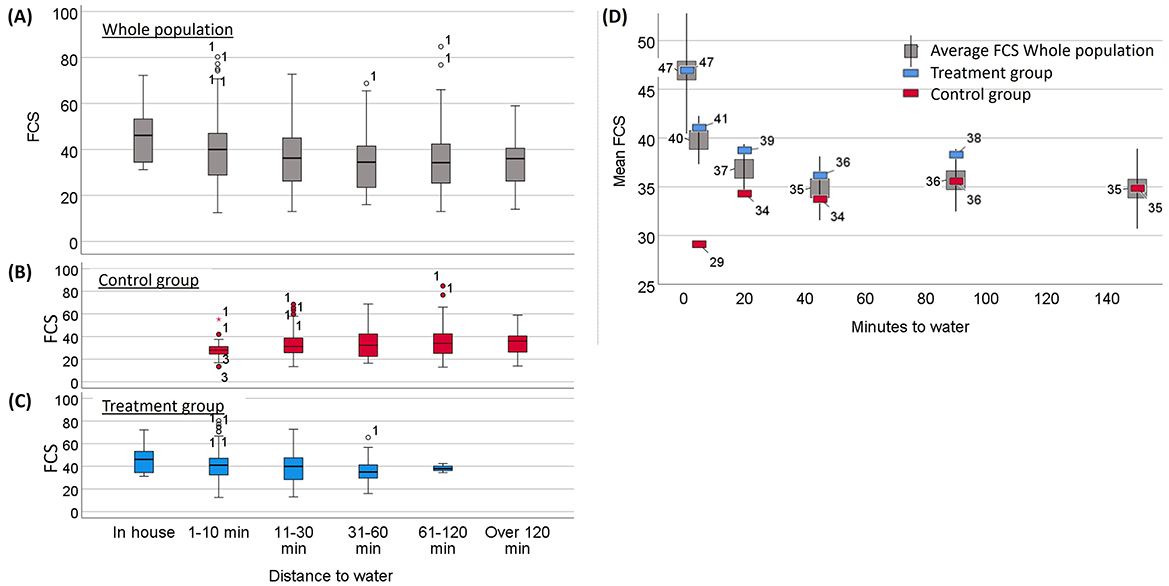
Figure 4. Impact of water resource accessibility on food consumption score (FCS). (A) Trend of FCS dispersion measures for all participants. (B) Trend of FCS dispersion measures for control group only. (C) Trend of FCS dispersion measures for treatment group only. (D) Trend of average FCS by time to water resource. Points represent the average scores; error bars depict the 95% confidence intervals. Spearman's correlation between average FCS and time to water resources calculated for all participants was r(430) = −0.178, p < 0.001.
To examine the nature of the relationship between distance to water and the food diversity index, time-distance categories were converted to a time scale. Central time points in each distance category were selected as representative values for the time scale. The correlation between average FCS and travel time to water resources is shown in Figure 4D. A decreasing trend of FCS with an increase in time to water resources indicated a significant negative correlation (Spearman's correlation analyzing all participants = −0.178 and p < 0.01). Bonferroni post-hoc analysis revealed statistically significant differences (p = 0.024) for “in house” pairwise “31–60 min” and “in house” pairwise “61–120 min.”
4 Discussion
Increasing demand for water and food resources, combined with concerns over environmental and climate change, present exacerbating challenges worldwide (Mbwana et al., 2016; Ringler and Paulo, 2020). The agenda to tackle these challenges is reflected in the increasing importance of pursuing the UN's SDGs and meeting both water security and food and nutrition goals. This highlights the need to better understand the multiple ways in which water and nutrition are linked (Ringler et al., 2018). The nexus of access to water and food production is crucial for achieving sustainable development. Water is not only essential for drinking but also for agricultural activities that produce food. Efficient water management practices can enhance crop yields, improve food quality, and ensure food security. Conversely, inadequate access to clean water can lead to poor agricultural productivity, affecting food availability and nutrition. Understanding this nexus helps in developing integrated policies that address both water and food security, ensuring that interventions in one area positively impact the other.
Thacker et al. (2019) stated that infrastructure projects directly or indirectly influence the attainment of SDGs. The case study presented in this article demonstrates both the direct and indirect influence of a water-infrastructure project. Results underline the two consecutive phases of the impact, i.e., that of infrastructure on water accessibility, and that of water accessibility on dietary diversity. Results for the direct impact of the intervention on water accessibility were as expected. The water-intervention projects establish groundwater wells and distribute infrastructure throughout the villages, making water available and accessible in the villages of the treatment group. The comparisons between population percentages of the treatment and control groups in relation to distance to water resources stood out for their significant differences. It is assumed that the temporal distance to the main water source for the control group reflects the distance to water in the rural Dodoma region before the water-intervention projects. Evaluating the situation of water accessibility in the treatment and control groups and considering the SDG criteria for “basic” and “safely managed” levels of drinking-water accessibility (defined as < 30 min), the improvement in water accessibility post water-intervention projects is significant. But even more than improving accessibility to water, the intervention improved water quality. In-depth interviews with key individuals revealed that following the intervention, residents no longer consume rainwater from polluted ground, swamps and open sources. High salinity shallow wells in Ndebwe and llewello villages, changed to high quality deep well post intervention. Qualitative analysis of some of the natural open water sources, that used to be the primary water resources for the control group and some of the old water resources for the treatment group, was performed. These open water sources are used for drinking water, as well as by cattle and wild animals. Therefore, they are considered contaminated resources. In terms of SDG 6.1, pertaining to drinking water accessibility, water intervention promotes 86% of the population in post-intervention villages to the “safely managed” level of water services, in contrast to only 30% of the population in the control group.
The second consecutive phase—the impact of the water intervention on food security—was measured by two indexes of food security and diversity (FCS and DDS). The results from the current study show the differences in households' access to food and its dietary diversity indicators, comparing villages where water is available to those where water is not available. A higher percentage of households in villages where water is available were rated in the highest food diversity category. Similar to previous studies that predicted the probability of malnutrition in children aged 6–23 months in households with suboptimal water access (Boateng et al., 2022; Choudhary et al., 2020), we show the phenomenon at the household level. While the distribution of the control group's population across three categories of nutritional diversity (low, medium, and high) was such that most of the population has a medium level of nutritional diversity in their diets (45%), most of the population in the treatment group fell in the high nutritional diversity category (52%). This trend toward improved nutritional diversity is even more pronounced when data collected in 2015 in the same region by (Mbwana et al. 2016) were added for comparison (Figure 5). Looking at the percentage of the population in the high dietary diversity category in groups “2015” (Mbwana et al., 2016), “control” and “treatment” (this study), an increase was seen −8%, 35%, and 52%, respectively—while the population percentage in the medium dietary diversity category decreased: 69%, 45%, and 37%, respectively. These trends suggest that the comparison of the three groups (2015, control, and treatment) represents changes that have occurred with time (2015 compared to 2021) and the additional relative implications of water-accessibility projects (control compared to treatment group). The ability of households to obtain sufficient food amount and diversity to meet their dietary needs is affected by proximity to water in various ways. This includes the possibility of growing a larger amount of diverse food in the home garden. It allows the possibility of cooking types of food that require the use of water. The accessibility to good water nearby saves time, allowing women to invest more in cooking and preparing a variety of food, as well as financial savings resulting from the access to water in the local project, thus investing the money in purchasing large and varied amounts of food from external sources.
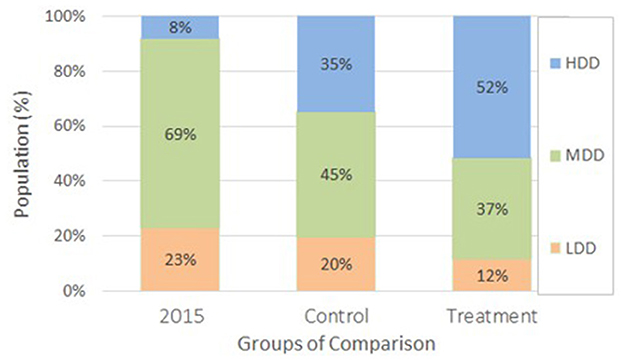
Figure 5. Comparison of food diversity levels (low, medium, and high DDS—LDD, MDD, and HDD, respectively) between treatment and control groups from this study and data collected in 2015 by Mbwana et al. (2016).
The decrease in the average dietary diversity index FCS with increasing distance to water reflects the role of water accessibility in food security. As can be seen in Figure 4, the longer the distance from the drinking water source, the lower the calculated FCS. The effect was significant when analyzing the treatment group (Figure 4C), but not significant when analyzing the control group (Figure 4B). Results align with previous studies showing how time spent on water-collection activities significantly affects the extent of food insecurity, with greater food security associated with shorter times (Brewis et al., 2020; Nounkeu et al., 2022). However, the effect of water accessibility on FCS was much stronger at shorter distances than at longer ones, giving a non-linear relationship. This weakening of the influence of water accessibility on FCS is reasonable. In contrast to the aforementioned research that measured the specific time spent collecting water, the survey used in the current study looked at the distance from water resources within ordinal categories (1–6) representing increasing periods of time [1, 10, 20, 30, 60, and over 60 min, correlated to (in house, < 10 min, 10–30 min, 31–60 min, 61–120 min, and >120 min) respectively]. Therefore, large differences in FCS between households are expected within the highest-distance-category groups. Interestingly, the results indicated that the largest food diversity index differences occurred within the second time category of 1–10 min, with the standard deviation of the FCS in the treatment group being larger than in the control group. This might be due to the strong effect of the water project on the treatment group, where households that are close to the distribution points substantially improve their dietary diversity. In contrast, in the control group, since no intervention is involved, the food diversity scores differ due to other determinants additional to water accessibility (Mbwana et al., 2016).
In-depth interviews with key individuals from the village's community elucidated and emphasized more implications post water intervention projects. Availability and more diversity of vegetables and fruits were reported in Mbalawala, Huzi and Llewello. In addition, positive migration of new residents to the villages, and increasing of pupils' attendance at school bringing 10 liters of water from home each day were recorded (Mbalawala, Huzi). Even lowering sickness levels caused by waterborne diseases comparing pre- and post-intervention situation were reported in Mbalwala. Though, the accessibility to safer (higher quality) water which resulted with less diarrhoeal diseases has resulted in better nutrient uptake and therefore nutritional improvement. Another implication of the water intervention project was the use of the free time gained by women, which was linked to mothers' occupations. It was found that there were more entrepreneurial women in the post-intervention project villages. However, these implications were beyond the scope of this article.
Although all eight villages in this study had similar demographic backgrounds and equal economic status, it is important to emphasize that the villages in the treatment group were selected from a larger group, which was found to fit a list of criteria according to which there is a good potential for the success of a water project. Besides project feasibility and potential productivity, which might be similar between most of the population in the research, parameters indicating on the community integration attitude for water project implementation, might be a bias that was introduced at that pre-research stage. Nevertheless, villages that underwent the intervention won twice. The water-intervention project improved accessibility to water resources and resulted in better food diversity scores. It is reasonable to assume that the higher food diversity occurred because of the improvements in water accessibility. These results, therefore, support Thacker et al. (2019) conclusion that infrastructure projects have a multidisciplinary, direct, and indirect impact following global actions to enhance the progress of SDGs toward 2030 by promoting linked interventions. Accordingly, the outcomes of the implementation processes are fundamental for sustainability. Future research could delve deeper into understanding the underlying mechanisms that drive the relationship between water accessibility and improved food diversity. Additionally, longitudinal studies that monitor the long-term effects of water supply infrastructure across diverse community settings would help identify factors that enhance or hinder their sustainability.
5 Conclusions
The direct and indirect influences of water intervention were presented. Water-infrastructure projects, implemented for disadvantaged communities, had a direct influence on improving water accessibility. Consequently, nutritional security improved. The dual beneficial sustainability of a diverse diet through a water-intervention project may contribute to understanding the food–water nexus. We emphasize, however, that water insecurity should be considered when developing food and nutrition policies and interventions. It is likely that the implementation process, which integrated the target communities from the first stage of locating a suitable village, through routine operations, and until the project's official termination, has vast importance for the project's sustainability.
Data availability statement
The raw data supporting the conclusions of this article will be made available by the authors, without undue reservation.
Ethics statement
Written informed consent was obtained from the individual(s) for the publication of any potentially identifiable images or data included in this article.
Author contributions
GR: Conceptualization, Formal analysis, Investigation, Methodology, Writing – original draft. AA: Conceptualization, Data curation, Formal analysis, Investigation, Methodology, Writing – review & editing. OM: Conceptualization, Data curation, Methodology, Writing – review & editing. DA: Conceptualization, Data curation, Formal analysis, Funding acquisition, Investigation, Methodology, Project administration, Supervision, Validation, Writing – review & editing.
Funding
The author(s) declare that financial support was received for the research and/or publication of this article. Funding for this research was provided by the non-profit organization innovation-Africa (iA).
Acknowledgments
This research was carried out in collaboration with Dr. Ceven Shemasanga, Department of Geology, University of Dodoma, Tanzania, and Dr. Julius Edward Ntwenya, Department of Public Health, School of Nursing and Public Health, University of Dodoma, Dodoma, Tanzania. We appreciate the contributions of Julieth Joseph, Nyamizi Kilago, Daniel Palingo, and Baraka Budogo, who conducted the surveys in the villages. We gratefully acknowledge the assistance provided by the non-profit organization innovation-Africa (iA). In memory of Yiftah Yavetz (2000–2023).
Conflict of interest
The authors declare that the research was conducted in the absence of any commercial or financial relationships that could be construed as a potential conflict of interest.
Generative AI statement
The author(s) declare that no Gen AI was used in the creation of this manuscript.
Any alternative text (alt text) provided alongside figures in this article has been generated by Frontiers with the support of artificial intelligence and reasonable efforts have been made to ensure accuracy, including review by the authors wherever possible. If you identify any issues, please contact us.
Publisher's note
All claims expressed in this article are solely those of the authors and do not necessarily represent those of their affiliated organizations, or those of the publisher, the editors and the reviewers. Any product that may be evaluated in this article, or claim that may be made by its manufacturer, is not guaranteed or endorsed by the publisher.
Supplementary material
The Supplementary Material for this article can be found online at: https://www.frontiersin.org/articles/10.3389/frwa.2025.1564313/full#supplementary-material
References
Bandari, R., Moallemi, E. A., Lester, R. E., Downie, D., and Bryan, B. A. (2022). Prioritising Sustainable Development Goals, characterising interactions, and identifying solutions for local sustainability. Environ. Sci. Policy 127, 325–336. doi: 10.1016/j.envsci.2021.09.016
Bandyopadhyay, A., Haile, B., Azzarri, C., and Somé, J. (2021). Analyzing the drivers of household dietary diversity: evidence from Burkina Faso. Food Nutr. Bull. 42, 1–21. doi: 10.1177/03795721211029092
Boateng, G. O., Workman, C. L., Miller, J. D., Onono, M., Neilands, T. B., Young, S. L., et al. (2022). The syndemic effects of food insecurity, water insecurity, and HIV on depressive symptomatology among Kenyan women. Soc. Sci. Med. 295:113043. doi: 10.1016/j.socscimed.2020.113043
Brewis, A., Workman, C., Wutich, A., Jepson, W. E., Young, S. L., Boateng, G. O., et al. (2020). Household water insecurity is strongly associated with food insecurity: evidence from 27 sites in low- and middle-income countries. Am. J. Hum. Biol. 32:e23309. doi: 10.1002/ajhb.23309
Choudhary, N., Schuster, R., Brewis, A., and Wutich, A. (2020). Water insecurity potentially undermines dietary diversity of children aged 6–23 months: evidence from India. Matern. Child Nutr. 161:e12929. doi: 10.1111/mcn.12929
FAO IFAD, UNICEF, WFP, and WHO. (2020). The State of Food Security and Nutrition in the World 2020, The State of Food Security and Nutrition in the World 2020. Rome: FAO, IFAD, UNICEF, WFP and WHO.
Jéquier, E., and Constant, F. (2009). Water as an essential nutrient: the physiological basis of hydration. Euro. J. Clin. Nutr. 64, 115–123. doi: 10.1038/ejcn.2009.111
Kennedy, G., Berardo, A., Papavero, C., Horjus, P., Ballard, T., Dop, M., et al. (2010). Proxy measures of household food consumption for food security assessment and surveillance: comparison of the household dietary diversity and food consumption scores. Public Health Nutr. 13, 2010–2018. doi: 10.1017/S136898001000145X
Mabhaudhi, T., Chibarabada, T., and Modi, A. (2016). Water-food-nutrition-health nexus: linking water to improving food, nutrition and health in sub-Saharan Africa. Int. J. Environ. Res. Public Health 13:107. doi: 10.3390/ijerph13010107
Mbwana, H. A., Kinabo, J., Lambert, C., and Biesalski, H. K. (2016). Determinants of household dietary practices in rural Tanzania: implications for nutrition interventions. Cogent. Food Agric. 2:1224046. doi: 10.1080/23311932.2016.1224046
Miller, J. D., Workman, C. L., Panchang, S. V., Sneegas, G., Adams, E. A., Young, S. L., et al. (2021). Water security and nutrition: current knowledge and research opportunities. Adv. Nutr. 12, 2525–2539. doi: 10.1093/advances/nmab075
Nounkeu, C. D., Kamgno, J., and Dharod, J. (2019). Assessment of the relationship between water insecurity, hygiene practices, and incidence of diarrhea among children from rural households of the Menoua Division, West Cameroon. J. Public Health Afr. 10:951. doi: 10.4081/jphia.2019.951
Nounkeu, C. D., Teta, I., Dharod, J. M., Foudjo, B. U. S., Ntentie, F. R., Boris, A. K., et al. (2022). Limited water access is associated with food insecurity and diarrheal episodes among children suffering from moderate acute malnutrition in Far-North Cameroon. J. Water Sanit. Hygiene Dev. 12, 68–79. doi: 10.2166/washdev.2021.171
Ringler, C., Choufani, J., Chase, C., McCartney, M., Mateo-Sagasta, J., Mekonnen, D., et al. (2018). Meeting the Nutrition and Water Targets of the Sustainable Development Goals: Achieving Progress through Linked Interventions. Colombo; Washington, DC: International Water Management Institute (IWMI); The World Bank. doi: 10.5337/2018.221
Ringler, C., and Paulo, D. (2020). Water and Nutrition: Harmonizing Actions for the United Nations Decade of Action on Nutrition and the United Nations Water Action Decade. UNSCN Discussion Paper. Rome: United Nations System Standing Committee on Nutrition (UNSCN), 32. Available online at: https://www.unnutrition.org/sites/default/files/2024-02/Water-Paper-EN-WEB.pdf
Schuster, R. C., Butler, M. S., Wutich, A., Miller, J. D., and Young, S. L. (2020). “If there is no water, we cannot feed our children”: the far-reaching consequences of water insecurity on infant feeding practices and infant health across 16 low- and middle-income countries. Am. J. Hum. Biol. 32:e23357. doi: 10.1002/ajhb.23357
Song, J., and Jang, C. H. (2023). Unpacking the sustainable development goals (SDGs) interlinkages: a semantic network analysis of the SDGs targets. Sustain. Dev. 31, 2784–2796. doi: 10.1002/sd.2547
Swindale, A., and Bilinsky, P. (2006). Household Dietary Diversity Score (HDDS) for Measurement of Household Food Access: Indicator Guide (Version 2).
Thacker, S., Adshead, D., Fay, M., Hallegatte, S., Harvey, M., Meller, H., et al. (2019). Infrastructure for sustainable development. Nat. Sustain. 2, 324–331. doi: 10.1038/s41893-019-0256-8
UN (2017). Integrated Approaches for Sustainable Development Goals Planning. Bangkok: United Nations.
UN General Assembly (2015). Transforming Our World: The 2030 Agenda for Sustainable Development - A/RES/70/1. New-York, NY.
UNESCO World Water Assessment Programme (2019). The UN World Water Development Report 2019: Leaving No One Behind. Paris.
Young, S. L. (2021). Viewpoint: the measurement of water access and use is key for more effective food and nutrition policy. Food Policy 104:102138. doi: 10.1016/j.foodpol.2021.102138
Young, S. L., Bethancourt, J. H., Frongillo, A. E., Viviani, S., and Cafiero, C. (2023). Concurrence of water and food insecurities, 25 low- and middle-income countries. Bull. World Health Organ. 101, 90–101. doi: 10.2471/BLT.22.288771
Young, S. L., Boateng, G. O., Jamaluddine, Z., Miller, J. D., Frongillo, E. A., Neilands, T. B., et al. (2019). The Household Water InSecurity Experiences (HWISE) Scale: development and validation of a household water insecurity measure for low-income and middle-income countries. BMJ Glob. Health 4:e001750. doi: 10.1136/bmjgh-2019-001750
Keywords: drinking water, food diversity, water accessibility, water infrastructure, water-intervention project
Citation: Ronen Eliraz G, Aviram A, Mendelsohn O and Avisar D (2025) Water accessibility as a catalyst for food diversity: a case study. Front. Water 7:1564313. doi: 10.3389/frwa.2025.1564313
Received: 21 January 2025; Accepted: 17 September 2025;
Published: 14 October 2025.
Edited by:
Andreas Panagopoulos, Institute of Soil and Water Resources (ISWR), GreeceReviewed by:
Alessandro Pagano, Istituto di Ricerca Sulle Acque IRSA-CNR, ItalyZübeyde Albayram Doğan, International Agricultural Research and Training Center (UTAEM), Türkiye
Copyright © 2025 Ronen Eliraz, Aviram, Mendelsohn and Avisar. This is an open-access article distributed under the terms of the Creative Commons Attribution License (CC BY). The use, distribution or reproduction in other forums is permitted, provided the original author(s) and the copyright owner(s) are credited and that the original publication in this journal is cited, in accordance with accepted academic practice. No use, distribution or reproduction is permitted which does not comply with these terms.
*Correspondence: Dror Avisar, ZHJvcmF2aUB0YXVleC50YXUuYWMuaWw=