 Wei Qi
 Ruiting Huang
 Yanpeng Cai
 Qian Tan
- Guangdong Basic Research Center of Excellence for Ecological Security and Green Development, Institute of Environmental and Ecological Engineering, Guangdong University of Technology, Guangzhou, China
The Pearl River Basin (PRB) is a vital economic hub in China, and sustains agriculture, industry, and regional water security for over 80 million people. While prior research has focused narrowly on flood frequency, flood impacts, or localized risk reduction, comprehensive assessments of extreme floods under critical global warming thresholds (1.5° C, 2.0° C and beyond) remain unexplored in PRB. Employing the WEB-DHM-SG model driven by ISIMIP3b bias-adjusted climate projections, this study analyzed extreme flood changes throughout the Pearl River Basin under incremental global warming levels from 1.5° C to 4.5° C (0.5° C intervals) for SSP126, SSP370, and SSP585 scenarios. Results show that, relative to the historical baseline (1985–2014), extreme floods across the PRB increase by 44–50% during the near future (2036–2065) and 57–68% in the far future (2071–2100), with the most pronounced escalations under higher emissions (SSP585). Sub-basin analyses reveal spatial heterogeneity in the timing and degree of increase. For example, at Boluo Station (Dongjiang sub-basin), extreme floods exhibit a biphasic response, declining initially then rising sharply by the far future. At Gaoyao Station (Xijiang sub-basin), extreme floods show a near-monotonic increase, with a slight reduction under SSP585. In contrast, at Shijiao Station (Beijiang sub-basin), extreme floods display a consistent upward trend across all scenarios. Furthermore, each 0.5° C increment of global warming significantly amplifies discharge, especially at Xijiang (largest absolute increase) and Dongjiang (highest relative increase, 7% per 0.5° C). These differential responses highlight the critical need for tailored adaptation measures, particularly infrastructure enhancements in the more sensitive Xijiang and Dongjiang sub-basins.
1 Introduction
The Pearl River Basin constitutes one of China's most critical hydrological systems, underpinning regional water resource management and socioeconomic development (Qiu et al., 2022; Wu et al., 2024). Although extreme flood events were historically rare in the basin, the region has recently experienced severe events, including the May 2022 floods—the most severe since 1924—and the severe April 2024 floods. The increasing frequency and intensity of such disasters, driven by climate change, necessitate an urgent comprehensive assessment of extreme floods, particularly under key projected warming thresholds (1.5° C, 2.0° C, and higher global warming levels).
Climate change has emerged as a pivotal driver of hydrological regime shifts in the Pearl River Basin. Previous studies have investigated discharge changes in the basin, identifying significant variations across historical periods (Zhang et al., 2018a, 2015, 2009). Further research has explored the impacts of climate change scenarios on hydrological processes and flood frequency, demonstrating pronounced shifts in precipitation patterns and associated flood events (Tang et al., 2016; Yan et al., 2015; Yuan et al., 2015; Zhu et al., 2021). Additional studies project future flood risks under evolving climatic conditions, highlighting the basin's increasing vulnerability to climate-driven hydrological extremes (Duan et al., 2021; Liu et al., 2018, 2020; Wang et al., 2018; Zhao et al., 2014).
Existing research on hydrological variations under climate change in the Pearl River Basin can be categorized into two distinct groups. The first group includes long-term analyses that extensively examine water-related extremes or streamflow dynamics but lack explicit integration of Shared Socioeconomic Pathways (SSPs) (Green et al., 2025; Qiu et al., 2022; Wu et al., 2024; Zhang et al., 2018b). In contrast, the second group incorporates SSP frameworks, leveraging state-of-the-art Coupled Model Inter comparison Project Phase 6 (CMIP6) projections to assess climate change impacts. However, these SSP-driven studies often focus on recent or narrowly defined timeframes, consequently restricting their contextualization (Chen et al., 2021; Zuo et al., 2023). As a result, comprehensive assessments of extreme floods under specific climate change thresholds—such as 1.5° C, 2.0° C, and higher global warming levels—remain unexplored in the Pearl River Basin.
This study investigates extreme flood changes in the Pearl River under projected global warming thresholds, specifically 1.5° C, 2.0° C, 2.5° C, 3.0° C, 3.5° C, 4.0° C, and 4.5° C. We employ the Water and Energy Budget-based Distributed Biosphere Hydrological Model with improved Snow physics for Global simulation (WEB-DHM-SG) (Qi et al., 2022b), calibrated specifically for the Pearl River Basin. Future hydrological projections are based on climate models in the Inter-Sectoral Impact Model Inter comparison Project Phase 3b (ISIMIP3b), incorporating multiple SSPs (SSP126, SSP370, and SSP585). To our knowledge, this is the first study to systematically assess extreme flood changes in the Pearl River under defined global warming thresholds. Such analyses are critical for designing robust flood mitigation strategies to safeguard the basin's socioeconomic development in the context of escalating climate challenges. This work establishes a foundation for future research on flood risk mitigation in the Pearl River Basin under evolving climatic conditions.
2 Materials and methods
2.1 Study region
The Pearl River Basin (Figure 1), situated in southern China, comprises three principal tributaries: the Dongjiang, Xijiang, and Beijiang Rivers, which serve as primary freshwater sources for the densely populated Guangdong Province and adjacent areas, sustaining a population exceeding 80 million. Characterized by a subtropical monsoon climate, the Pearl River Basin exhibits distinct seasonality with substantial hydrological variability. Annual precipitation ranges from 1,200 to 2,200 mm, with approximately 80% occurring during the April–September wet season. Conversely, the October–March dry season contributes only ~24% of the basin-wide annual runoff. In 2023, peak instantaneous discharges at key hydrological control stations reached 22,600 m3/s at Gaoyao (lower Xijiang), 11,300 m3/s at Shijiao (lower Beijiang), and 5,150 m3/s at Boluo (lower Dongjiang), with corresponding maximum monthly mean discharges of 7,570 m3/s, 2,500 m3/s, and 1,330 m3/s, respectively. These extremes underscore the region's acute flood variations.

Figure 1. Location of the Pearl River Basin within South China, along with the locations of stream gauging stations used in the present analysis.
2.2 Datasets
The ISIMIP3b Global Climate Model (GCM) dataset (0.5 degree and daily scale) was employed to evaluate flood responses in the Pearl River Basin under diverse climate scenarios. This dataset offers bias-adjusted climate projections from multiple GCMs (Lange and Büchner, 2021). ISIMIP data have been commonly utilized in various studies for extreme flood changes and climate change impacts (Rivera et al., 2024; Schaffhauser et al., 2023; Werning et al., 2024; Zhao et al., 2025).
The ISIMIP3b GCM data include projections for key variables—temperature, precipitation, wind speed, air pressure, humidity, and radiation—spanning SSP126 (low emissions gas emissions), SSP370 (intermediate greenhouse gas emissions), and SSP585 (high greenhouse gas emissions) scenarios. Projections cover the period 2015–2100. Additionally, ISIMIP3b provides pre-industrial baseline (1850–1900) temperature data. Global warming levels (1.5° C, 2.0° C) were defined by comparing 30-years running averages of temperature to the pre-industrial baseline. For the historical period (1985–2014), precipitation and temperature data were sourced from the Asian Precipitation – Highly-Resolved Observational Data Integration Toward Evaluation (APHRODITE) dataset (0.25° spatial, daily temporal resolution) (Yatagai et al., 2012). Other meteorological variables (wind speed, radiation, etc.) were obtained from the China Meteorological Forcing Dataset (CMFD) (0.1° spatial, daily temporal resolution) (He et al., 2020). These datasets were re-gridded into 0.1° grids to keep consistent in spatial resolutions.
2.3 Methodology
This study utilizes the WEB-DHM-SG to simulate discharge across the Pearl River Basin under varying climate scenarios. The spatially distributed, physically based model simulates key components of the hydrological processes, including evapotranspiration, runoff generation, and soil moisture dynamics. Its strength lies in capturing complex hydrological interactions across large basins with heterogeneous topography and land use, making it particularly suited for the Pearl River Basin's diverse landscape. The model was calibrated for the Pearl River Basin (Qi et al., 2022a), achieving strong performance in discharge simulations at a daily scale: Gaoyao (1983–2010; Nash-Sutcliffe Efficiency (NSE) = 0.85), Makou (1994–2014; NSE = 0.77), Shijiao (1983–2010; NSE = 0.77), and Boluo (1954–1959; NSE = 0.76). Detailed calibration procedures and model configurations are described in (Qi et al. 2022a).
Throughout this study, extreme floods specifically denote annual maximum discharge. Consequently, references to flood variations or intensification exclusively describe changes in annual maximum discharge.
Each sub-basin (the Dongjiang, Xijiang, and Beijiang Rivers) was independently analyzed to characterize distinct hydrological trends and quantify spatial variability in extreme floods. Future hydrological projections were generated by forcing the model with bias-corrected climate data from ISIMIP3b under SSP126, SSP370, and SSP585 scenarios. The climate data were re-gridded into 0.1-degree cells to match the spatial resolution of WEB-DHM-SG. Model outputs were subsequently used to evaluate the influence of specific global warming levels (e.g. 1.5° C, 2.0° C) on extreme floods.
Statistical trends were assessed using the non-parametric Mann-Kendall (MK) test, with trend magnitudes quantified via Sen's slope estimator. The MK approach detects monotonic trends in hydro meteorological time series without distributional assumptions. Sen's method provides robust magnitude estimates resilient to outliers. A 95% confidence level (p < 0.05) defined statistical significance.
3 Results
3.1 Temporal changes at key monitoring stations
Extreme floods exhibit divergent trends under varying climate scenarios and across monitoring stations (Figure 2). Extreme floods in Boluo Station, trend magnitudes declined from SSP126 to SSP370 before sharply increasing under SSP585, with all scenarios showing statistically significant trends. In contrast, extreme floods in Gaoyao Station displayed rising trends from SSP126 to SSP370, followed by a marginal decrease under SSP585, though all trends remained statistically significant. Extreme floods in Shijiao Station demonstrated a consistent escalation across all SSP scenarios (SSP126 to SSP585), with statistically significant trends throughout.
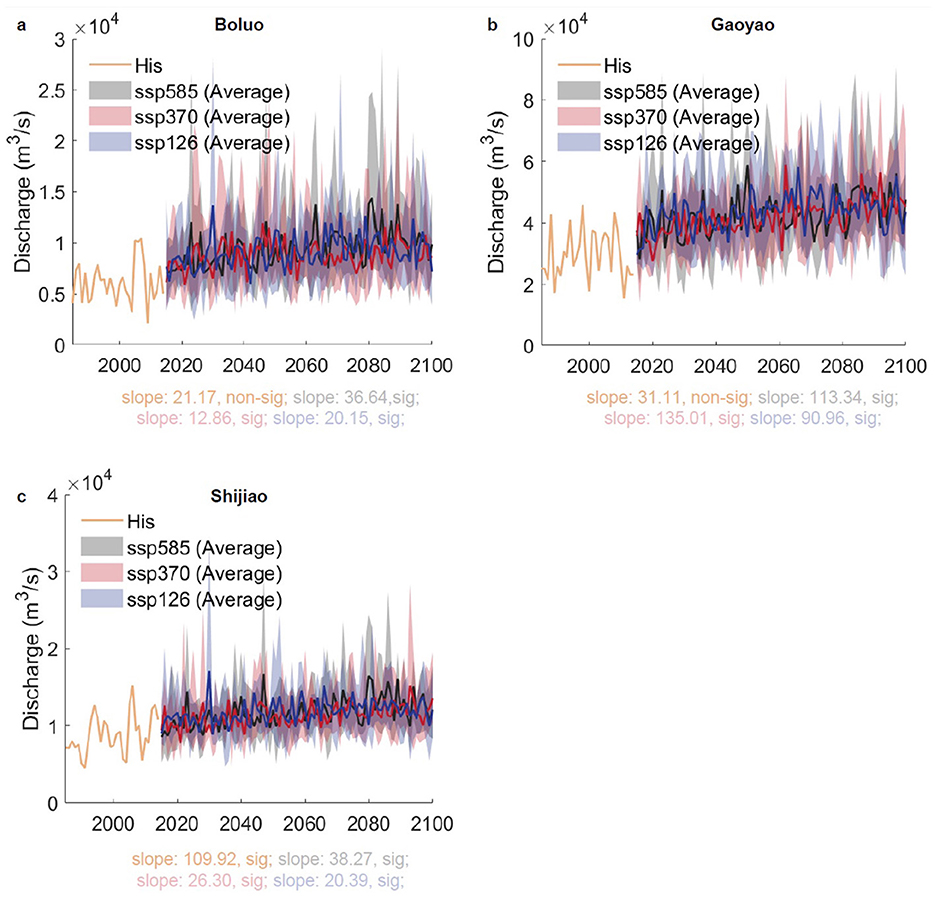
Figure 2. Temporal changes of extreme floods in (a) Boluo, (b) Gaoyao, and (c) Shijiao gauges. His, Historical period. The shaded area represents the upper and lower bounds.
Extreme floods in Boluo Station, the historical period displayed a trend slope of 21 m3/s/year, though not statistically significant (p > 0.05). Under future scenarios, slopes increased to 20 m3/s/year (SSP126), decreased to 13 m3/s/year (SSP370), and surged to 37 m3/s/year (SSP585), all statistically significant (p < 0.05). Relative to SSP126, SSP370′s slope represented 64% of the SSP126 magnitude, while SSP585′s slope was 1.7 × higher. Extreme floods in Gaoyao Station, the historical slope (31 m3/s/year) was nonsignificant (p > 0.05), whereas future scenarios showed marked increases: 91 m3/s/year (SSP126), 135 m3/s/year (SSP370), and 133 m3/s/year (SSP585), all significant (p < 0.05). Compared to SSP126, SSP370 and SSP585 slopes were 1.48 × and 1.47 × higher, respectively. Extreme floods in Shijiao Station, future slopes rose progressively: 20 m3/s/year (SSP126), 26 m3/s/year (SSP370), and 38 m3/s/year (SSP585). SSP370 and SSP585 slopes exceeded SSP126 by 1.3 × and 1.9 × , respectively, with all trends statistically significant (p < 0.05).
3.2 Near- and far-future extreme flood trends
Across the Pearl River Basin, extreme floods intensify temporally, with projected increases of 44–50% in the near future (2036–2065) and 57–68% in the far future (2071–2100) (Figures 3a–c). Under SSP126, the mean extreme flood rises from 610 m3/s historically (1985–2014) to 920 m3/s (near future) and 970 m3/s (far future). For SSP370, mean extreme flood increases to 890 m3/s (near future) and 990 m3/s (far future), reflecting a slower near-term rise compared to SSP126 but exceeding it in the long term. Comparatively, SSP585 exhibits the most pronounced escalation, reaching 920 m3/s (near future) and 1,000 m3/s (far future). Scenario comparisons reveal contrasting trajectories: In the near future, discharge declines from 920 m3/s (SSP126) to 890 m3/s (SSP370), then rebounds to 920 m3/s (SSP585). In the far future, mean extreme flood ascends progressively from 970 m3/s (SSP126) to 990 m3/s (SSP370) and 1,000 m3/s (SSP585), underscoring a persistent intensification trend under higher emissions.
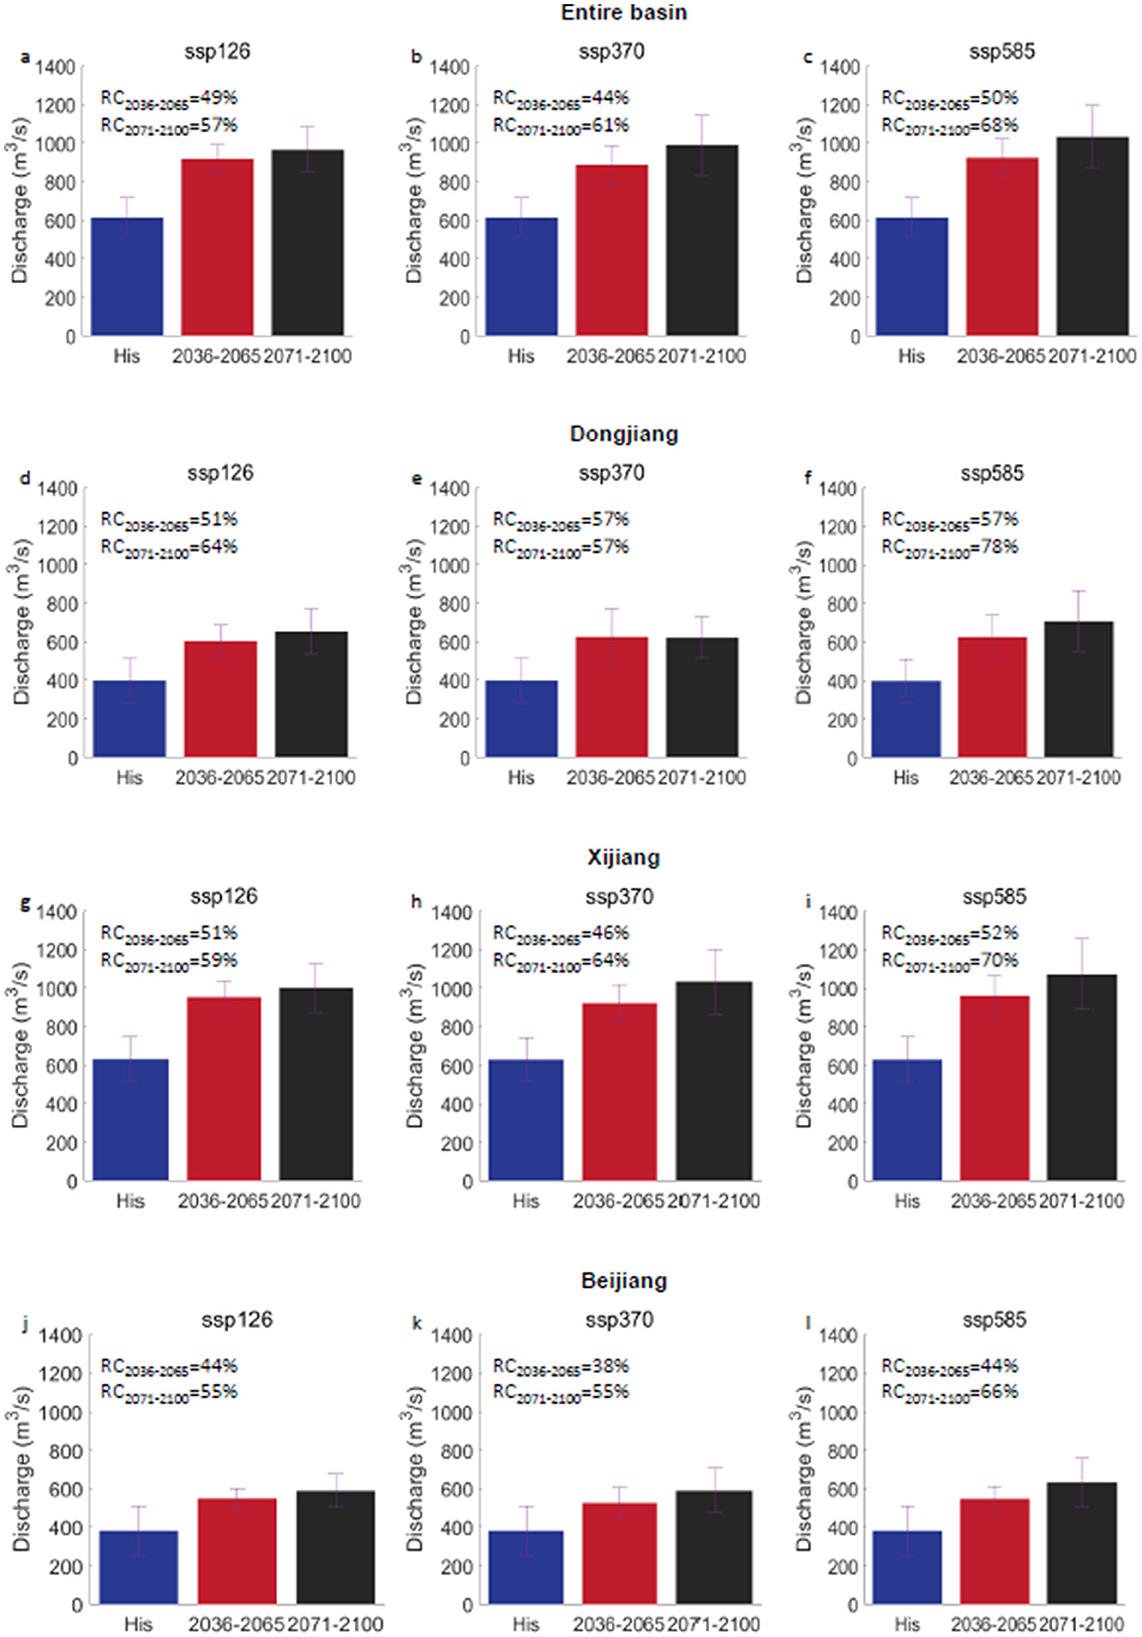
Figure 3. Comparison of mean extreme floods among historical, near future (2036–2065), and far future (2071–2100). (a–c) For the entire basin under ssp126, ssp370 and ssp585. (d–f) For the Dongjiang. (g–i) For the Xijiang. (j–l) For the Beijiang.
For the Dongjiang Basin, extreme flood intensification surpasses the basin-wide average, with projected increases of 51–57% in the near future and 64–78% in the far future (Figures 3d–f). Under SSP126, mean extreme flood rises from 400 m3/s (historical baseline) to 600 m3/s (near future) and 650 m3/s (far future). SSP370 exhibits an increase to 630 m3/s (near future), followed by a marginal decrease to 620 m3/s (far future). SSP585 shows the steepest rise, reaching 620 m3/s (near future) and 710 m3/s (far future). Near-future extreme flood shifts from 600 m3/s (SSP126) to 630 m3/s (SSP370) and 620 m3/s (SSP585), indicating limited variability. In the far future, extreme flood declines from 650 m3/s (SSP126) to 620 m3/s (SSP370), then surges to 710 m3/s (SSP585), highlighting a rebound under high-emission scenarios.
In the Xijiang Basin, extreme flood amplification exceeds the basin-wide average but remains less pronounced than in the Dongjiang Basin, with projected increases of 46–52% in the near future and 59–70% in the far future (Figures 3g–i). Under SSP126, mean extreme flood increases from 630 m3/s (historical baseline) to 950 m3/s (near future) and 1,000 m3/s (far future). SSP370 shows a near-future rise to 920 m3/s, followed by a far-future increase to 1,040 m3/s, yielding a slower near-term escalation than SSP126 but surpassing it long-term. SSP585 exhibits the most substantial growth, reaching 960 m3/s (near future) and 1,070 m3/s (far future). In the near future, mean extreme flood declines from 950 m3/s (SSP126) to 920 m3/s (SSP370), then rebounds to 960 m3/s (SSP585). Far-future extreme flood ascends progressively from 1,000 m3/s (SSP126) to 1,040 m3/s (SSP370) and 1,070 m3/s (SSP585), highlighting a sustained intensification trend under higher emissions.
For the Beijiang Basin, extreme flood intensification is less pronounced than the basin-wide average, with projected increases of 38–44% in the near future and 55–66 % in the far future (Figures 3j–l). Under SSP126, mean extreme flood rises from 380 m3/s (historical baseline) to 550 m3/s (near future) and 590 m3/s (far future). SSP370 shows a near-future increase to 530 m3/s, followed by a far-future rise to 590 m3/s, reflecting a slower near-term escalation compared to SSP126 but converging to similar levels long-term. SSP585 exhibits a more marked rise, reaching 550 m3/s (near future) and 630 m3/s (far future). In the near future, mean extreme flood declines from 550 m3/s (SSP126) to 530 m3/s (SSP370), then rebounds modestly to 547.19 m3/s (SSP585). In the far future, mean extreme flood ascends from 590.34 m3/s (SSP126) to 590.59 m3/s (SSP370) and 632.40 m3/s (SSP585), underscoring a persistent upward trajectory under high-emission scenarios.
Across the three principal hydrological stations—Boluo, Gaoyao, and Shijiao—extreme floods exhibit consistent upward trends from historical to future periods, though Shijiao displays more moderate changes compared to Boluo and Gaoyao (Figure 4). In the near future, relative increases range from 45–50% (Boluo) and 38–47% (Gaoyao), compared to 27–31% at Shijiao. By the far future, these escalations intensify to 49–71% (Boluo) and 53–55% (Gaoyao), while Shijiao's increases remain comparatively lower (36–46%). This spatial variability underscores attenuated sensitivity in Shijiao to climate-driven flood amplification relative to extreme floods in Boluo and Gaoyao, highlighting its reduced vulnerability within the basin's heterogeneous hydrological landscape.
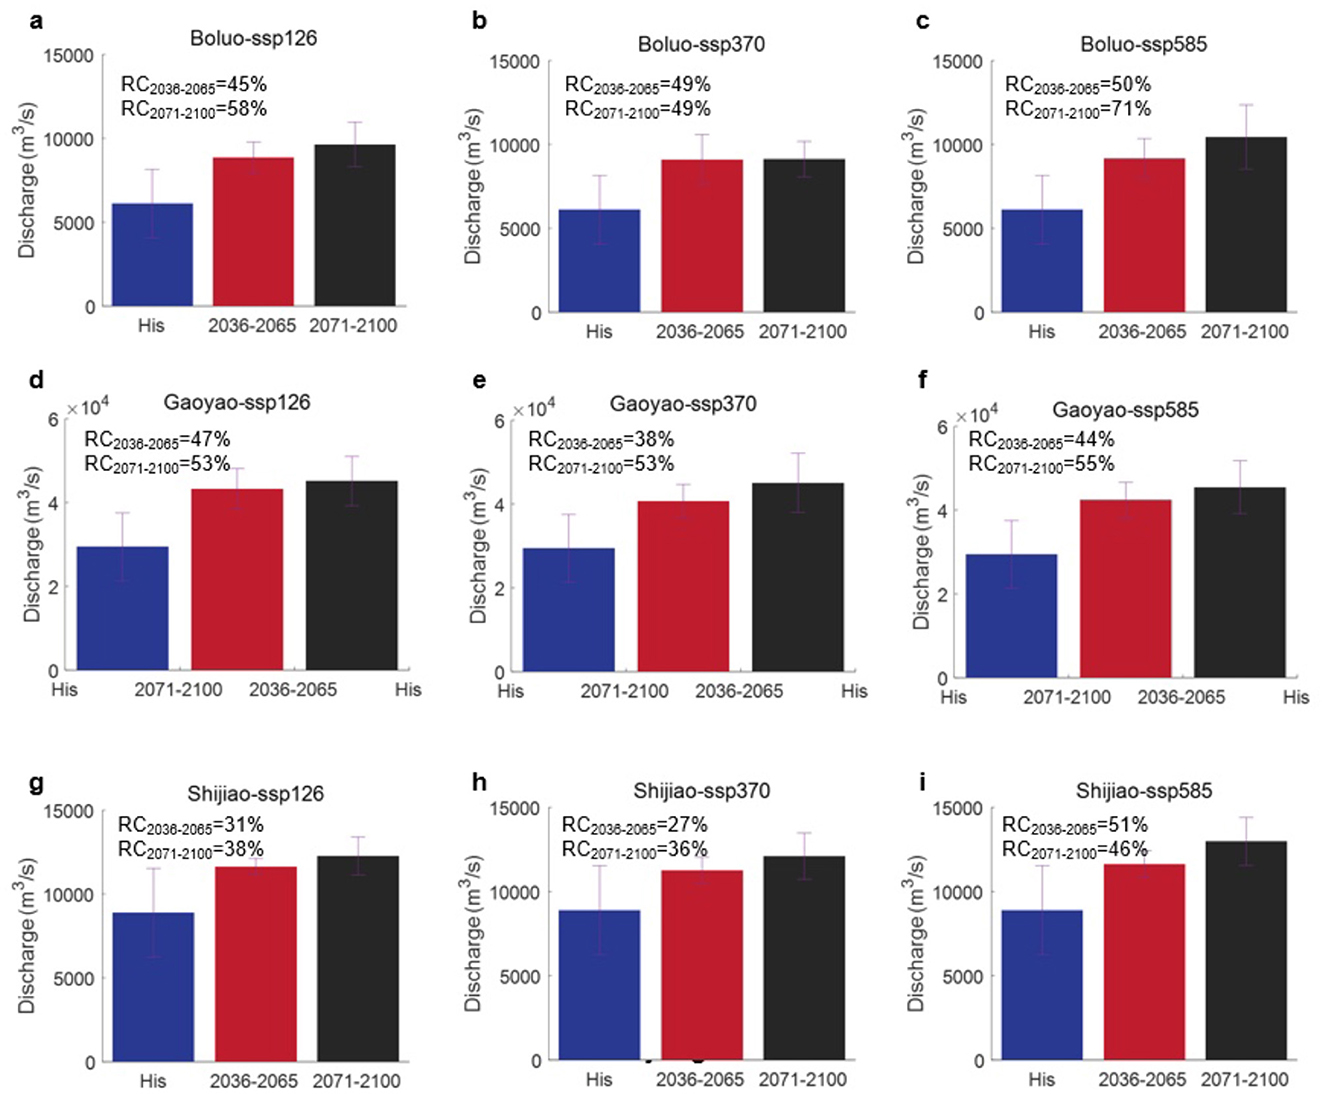
Figure 4. Changes in extreme floods at three hydrological stations (Boluo, Gaoyao, and Shijiao) under different emission scenarios (SSP126, SSP370, and SSP585) for various time periods (historical period, 2036-2065, and 2071-2100). (a–c) For the Boluo. (d–f) For the Gaoyao. (g–i) For the Shijiao.
At Boluo Station (Figures 4a–c), extreme flood discharge escalates from 6,100 m3/s (historical baseline) to 8,900 m3/s (near future) under SSP126, with a subsequent rise to 9,600 m3/s (far future), demonstrating a persistent upward trajectory. Under SSP370, extreme flood increases to 9,100 m3/s (near future) and 9,100 m3/s (far future), reflecting a diminished growth rate compared to SSP126. Conversely, SSP585 drives discharge to 9,200 m3/s (near future), followed by a sharp surge to 10,000 m3/s (far future), highlighting pronounced intensification of extreme floods under high-emission scenarios.
At Gaoyao Station (Figures 4d–f), extreme flood increases substantially, rising from 29,000 m3/s (historical baseline) to 43,000 m3/s (near future) under SSP126, with a further rise to 45,000 m3/s (far future). Under SSP370, extreme flood grows to 41,000 m3/s (near future) and 45,000 m3/s (far future). For SSP585, extreme flood escalates to 42,000 m3/s (near future) and 45,000 m3/s (far future), demonstrating steady escalation across both periods.
At the Shijiao Station (Figures 4g–i), extreme flood discharge exhibits a moderate increase, rising from 8,900 m3/s (historical baseline) to 11,600 m3/s (near future) under SSP126, with a further rise to 12,000 m3/s (far future). Under SSP370, discharge grows to 11,300 m3/s (near future) and 12,100 m3/s (far future), reflecting a sustained yet gradual escalation. SSP585 drives a more pronounced increase, surging to 11,600 m3/s (near future) before sharply accelerating to 13,000 m3/s (far future).
Elevated emissions scenarios and extended time horizons drive progressively larger and spatially widespread increases in extreme floods (Figure 5). Under SSP126, near-future projections primarily exhibit moderate increases (yellow to light orange), with minimal areas of decline (purple). Far-future projections show expanded orange-red zones, though changes remain less severe than under higher-emission scenarios. SSP370 amplifies near-future increases (orange-red), interspersed with localized reductions (purple), while far-future outcomes reveal dominant red coverage, leaving minimal areas of stability or decline. SSP585 accelerates near-future intensification (widespread orange-red), culminating in near-total red dominance in the far future. Across scenarios, changes escalate temporally, emphasizing the compounding impacts of prolonged emissions. Despite localized exceptions, spatial patterns underscore a direct emissions-to-severity relationship: SSP126′s restrained shifts highlight lower-emission mitigation potential, whereas SSP585 exemplifies the destabilizing consequences of unabated emissions.
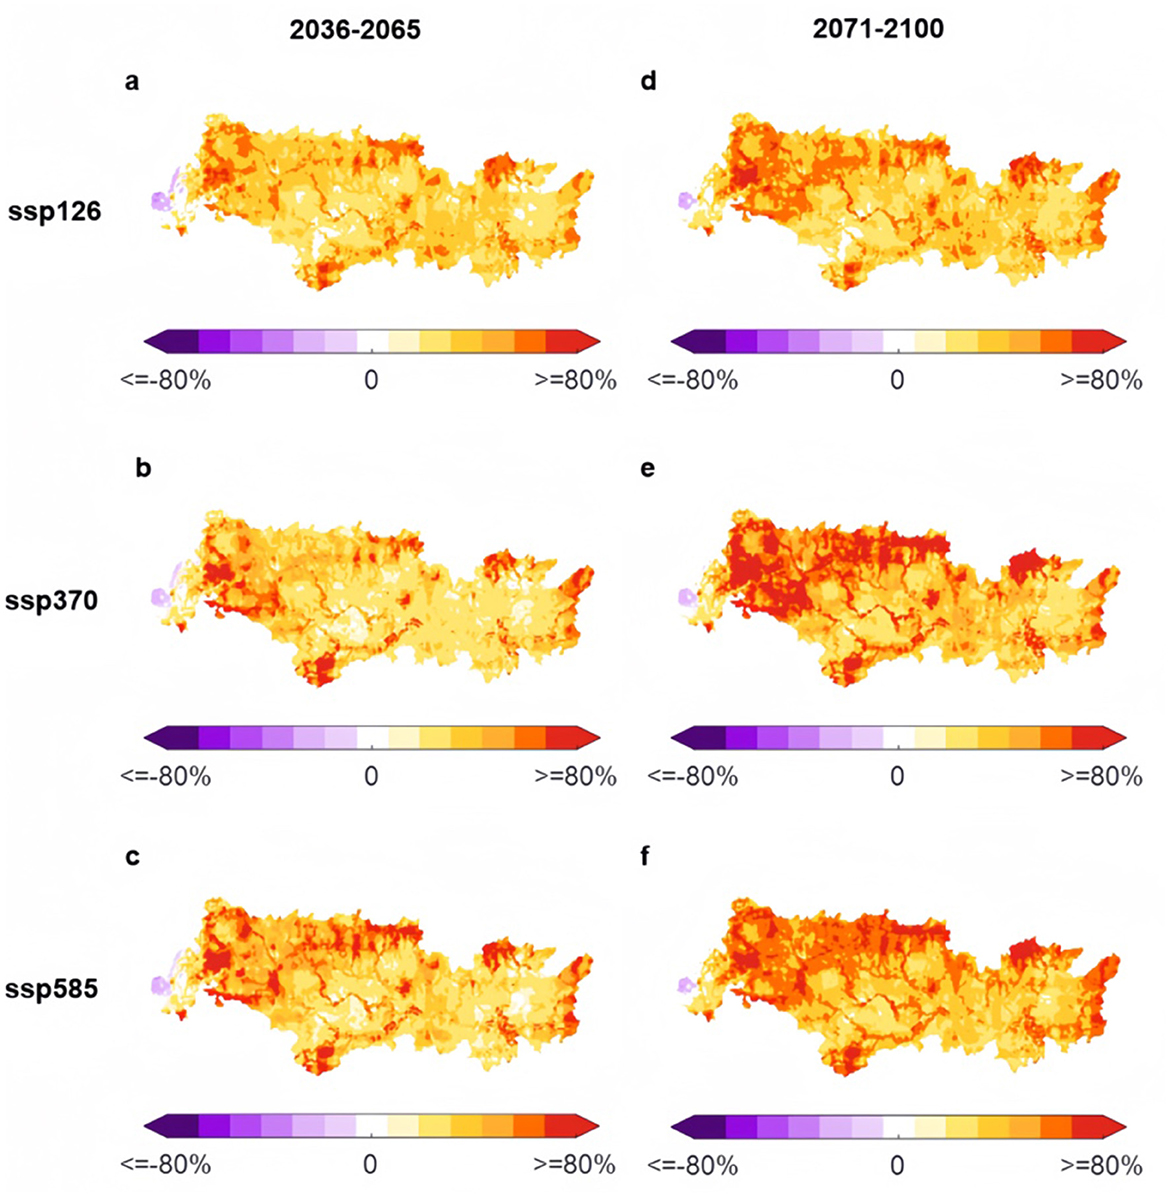
Figure 5. Relative changes of mean extreme floods during near future (2036–2065) and far future (2071–2100) periods under three emission scenarios (SSP126, SSP370, and SSP585). (a–c) For the near future results. (d–f) For the far future results.
Supplementary Figure 1 demonstrates that extreme floods in Xijiang maintain the highest absolute discharge values across all scenarios, surpassing extreme floods in Dongjiang and Beijiang by substantial margins. While extreme floods in Dongjiang and Beijiang exhibit marked increases in discharge over time, their absolute flows remain consistently lower than those of Xijiang. Under higher-emissions scenarios, all three sub-basins show amplified extreme flood trends, with extreme floods in Xijiang displaying the most pronounced growth and retaining its dominance in absolute magnitude.
3.3 Changes under global warming levels
Extreme floods across the four basins—entire Pearl River Basin, Dongjiang, Xijiang, and Beijiang—is projected to increase robustly under global warming levels from 1.5° C to 4.5° C (in 0.5° C increments) (Figure 6). Absolute extreme flood escalates by 27–36 m3/s per 0.5° C rise, highlighting a consistent upward trajectory, while relative increases range from 4% to 7% per 0.5° C. Despite inter-basin variability, all trends are statistically significant (p < 0.05), indicating that global warming will drive substantial, basin-wide flood intensification. Among the basins, Beijiang exhibits the lowest slope, signifying reduced sensitivity to warming compared to Dongjiang and Xijiang. At the three principal hydrological stations—Boluo, Gaoyao, and Shijiao—extreme flood rises significantly with temperature (Figure 7). Extreme floods in Gaoyao Station demonstrate the steepest absolute slope, whereas extreme floods in Boluo show the largest relative increase, emphasizing spatially divergent responses to warming within the basin.
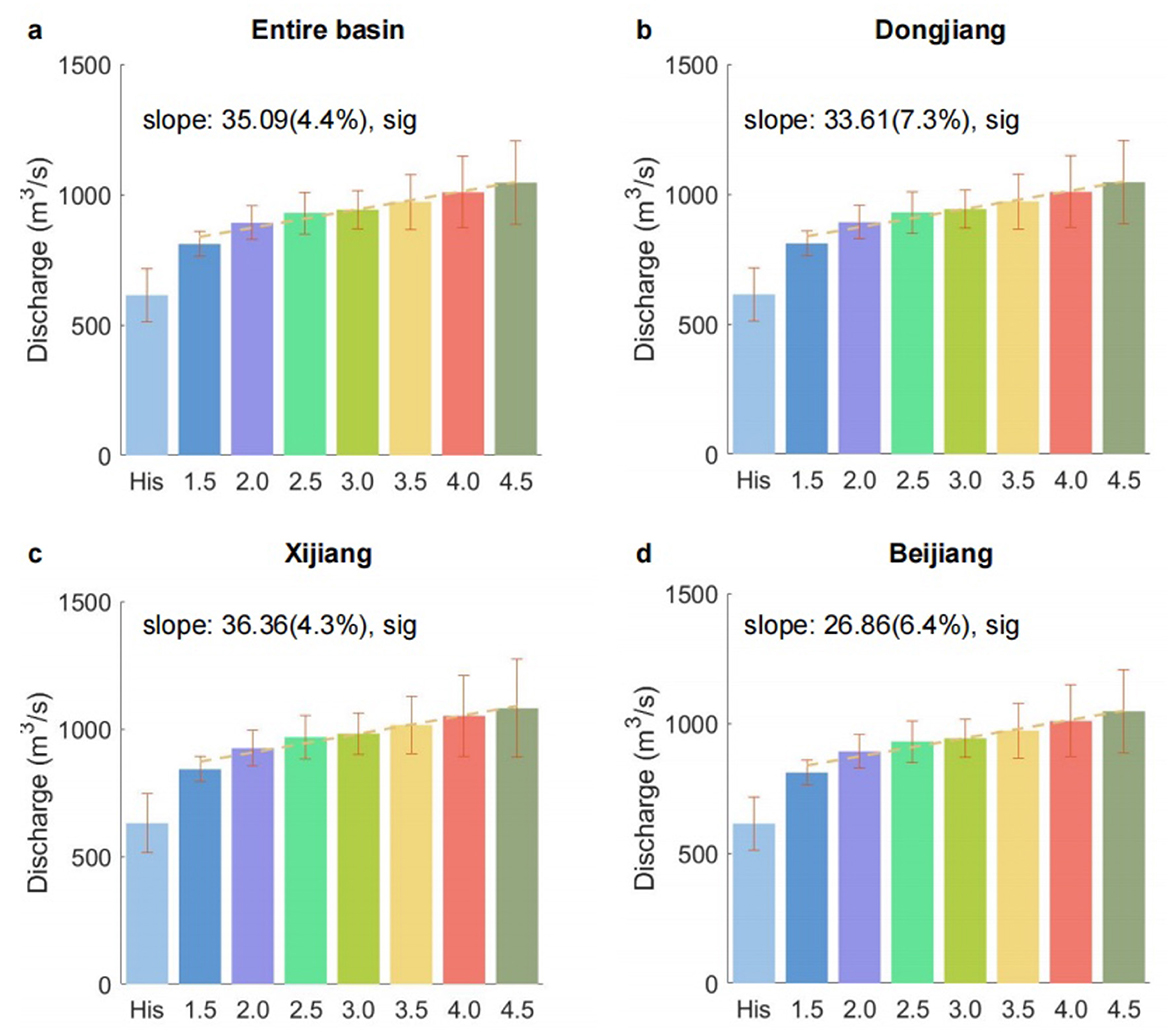
Figure 6. Mean extreme floods in (a) entire basin, (b) Dongjiang, (c) Xijiang, and (d) Beijiang in historical (His) period and different warming levels from 1.5° C to 4.5° C with a 0.5° C steps. The dashed lines represent the trends, and the error bars represent the standard deviations.
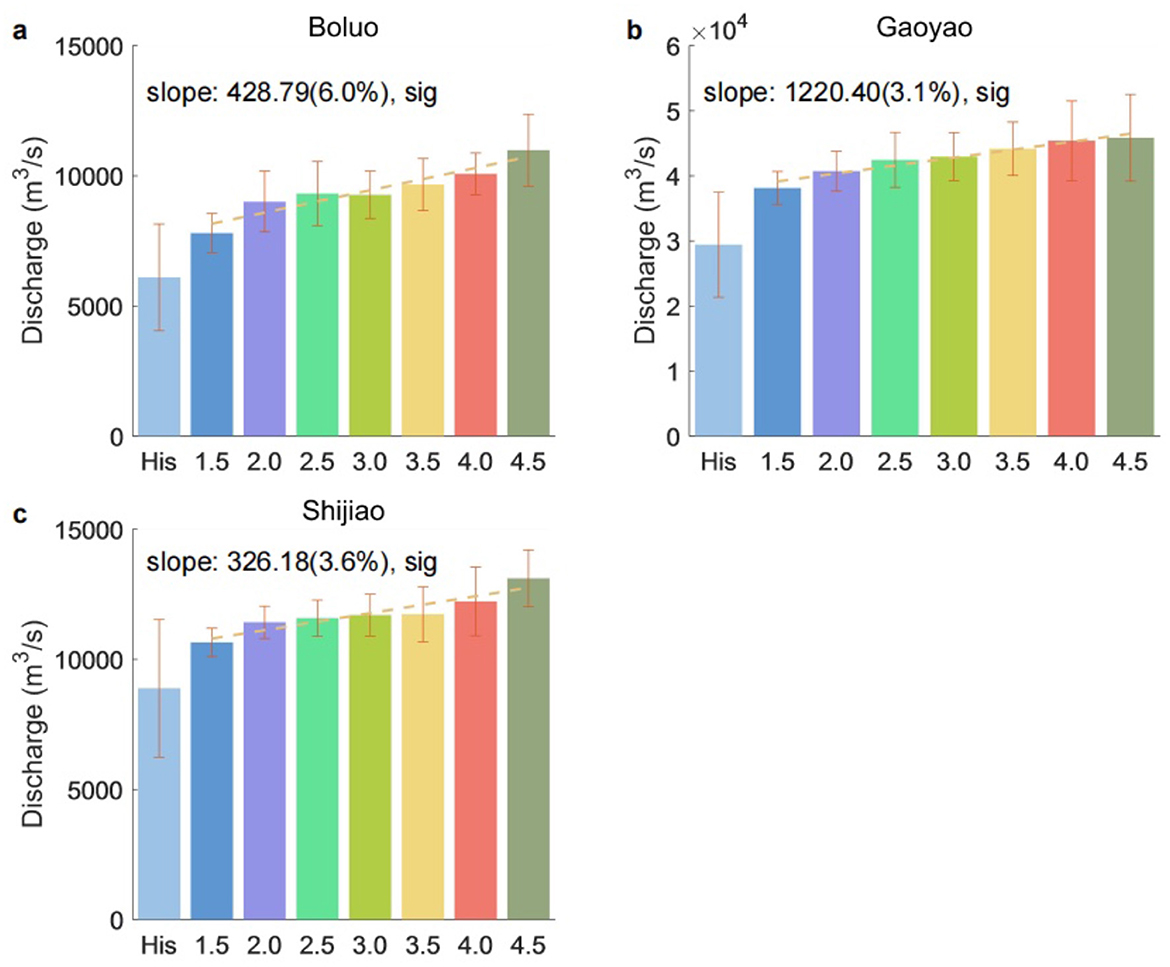
Figure 7. Mean extreme floods at three hydrological stations (Boluo, Gaoyao, and Shijiao) under different global warming scenarios. The extreme floods are shown for historical conditions (His) and temperature increases of 1.5° C, 2.0° C, 2.5° C, 3.0° C, 3.5° C, 4.0° C, and 4.5° C. (a–c) represent Boluo, Gaoyao, and Shijiao stations, respectively.
Figures 8a–g illustrates spatial patterns of relative extreme flood changes (%) across progressive global warming thresholds (1.5° C to 4.5° C in 0.5° C increments), using a color gradient from deep purple (≥ 80% decrease) to white (neutral/no change) to deep red (≥ 80% increase). Results reveal a clear amplification of positive changes with rising temperatures. At 1.5° C, moderate increases (light orange-yellow) dominate, with localized red zones (stronger increases) and sparse purple areas (declines). By 2.0° C, orange-red expansions in northern and central regions reflect broader intensification, while neutral/purple zones diminish. At 2.5° C, red tones intensify further, with minimal residual declines. Under 3.0° C−3.5° C, moderate-to-high increases (orange-red) pervade most of the basin, leaving only isolated purple remnants. At 4.0° C, extensive dark red zones dominate, signaling severe intensification. By 4.5° C, near-total red coverage emerges, with negligible purple/white areas confined to highly localized regions. These patterns underscore escalating extreme floods under higher warming, with spatially pervasive impacts overwhelming residual declines.
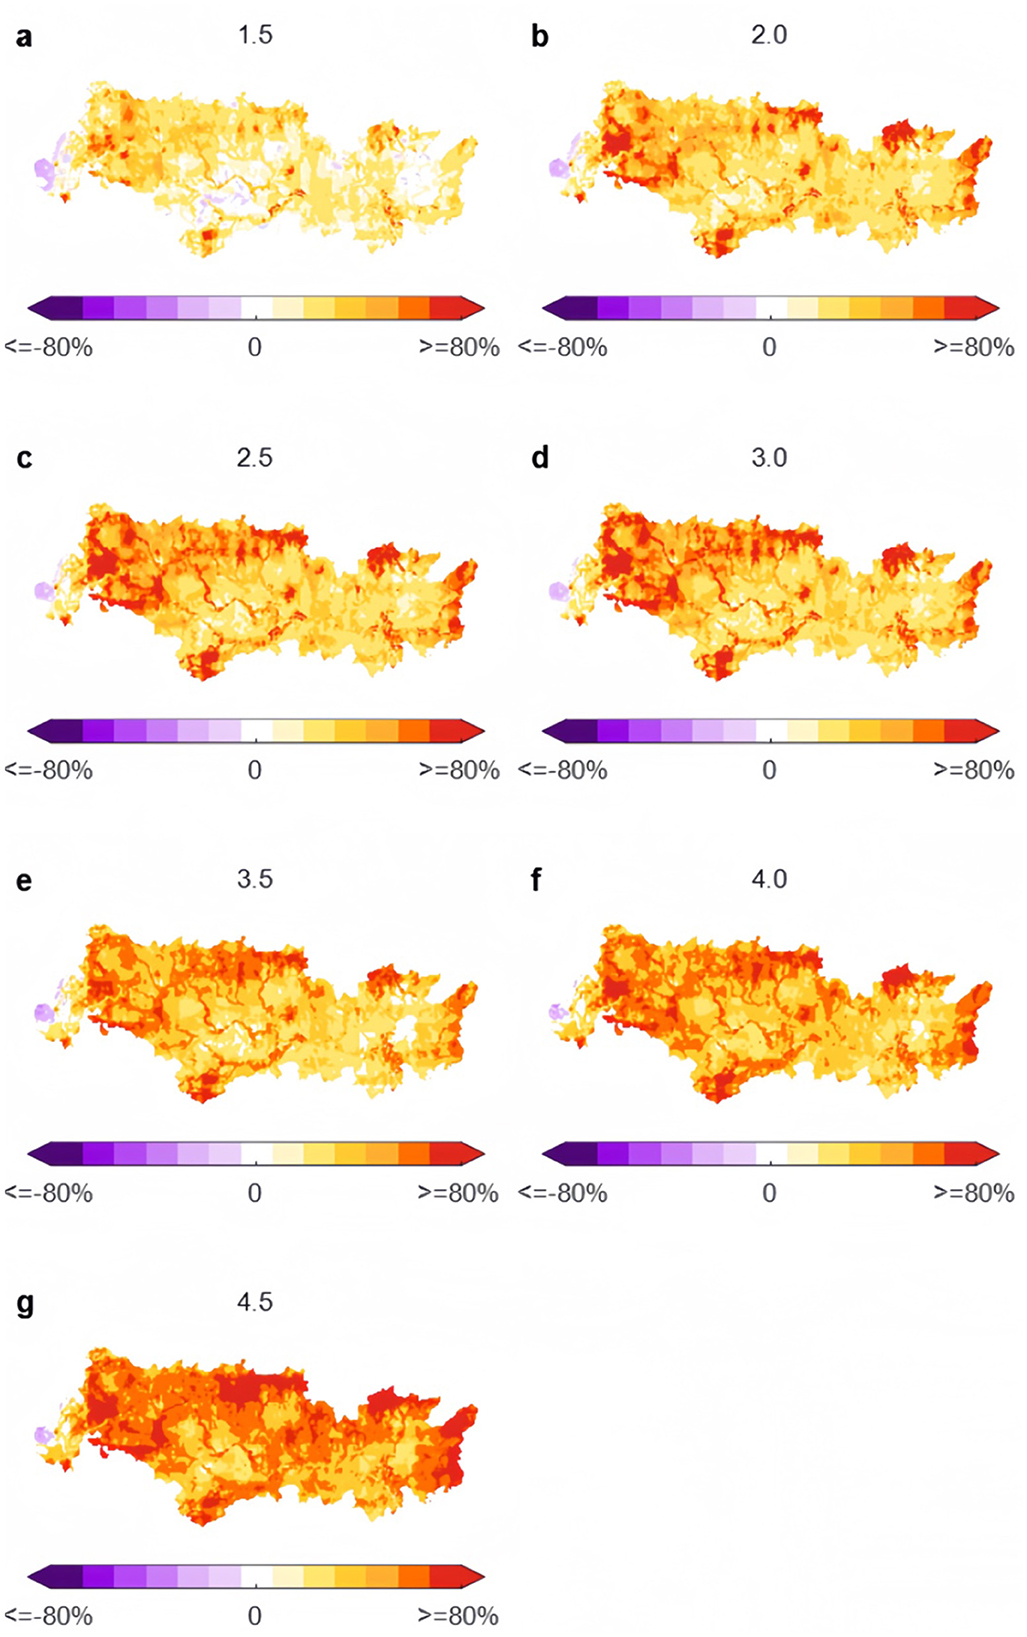
Figure 8. Comparisons of mean extreme flood changes under seven discrete warming levels (1.5° C, 2.0° C, 2.5° C, 3.0° C, 3.5° C, 4.0° C, and 4.5° C) relative to the historical baseline. (a–g) correspond to these warming thresholds, respectively.
All three basins exhibit upward trends in extreme floods per 0.5° C warming increment (Supplementary Figure 2). Among them, extreme floods in Xijiang shows the largest absolute rise, partly due to its already high flood flow. Extreme floods in Dongjiang also experiences a steady increase but remains at levels somewhat lower than those of Xijiang. Extreme floods in Beijiang displays the smallest discharge overall, although it still follows a clear positive trend under higher temperatures.
4 Discussion
A strong positive correlation between rising temperatures and extreme flood magnitude is evident across all stations, highlighting the intensification of extreme floods under unabated warming and the escalating risks. These findings underscore the urgent need for proactive, adaptive flood management strategies to counteract projected risks. While prior studies have documented rising trends, this study advances the field by quantifying the magnitude and spatial extent of flood increases across discrete global warming thresholds (1.5° C−4.5° C) which is critical for operational climate adaptation planning but previously underexplored. Prior studies have indeed identified rising trends in discharge and increasing flood risks within the Pearl River Basin, linking these to changing precipitation patterns and increased climate variability (Liu J. Y. et al., 2017; Wu et al., 2024; Zhang et al., 2010; Zhou et al., 2018). For example, (Zhang et al. 2010) highlighted shifts in atmospheric moisture contributing to altered discharge patterns, while Liu J. Y. et al. (2017) emphasized the increased vulnerability of the basin's hydrological regimes under climate stress. These findings align with our observations of intensifying extreme flood discharge under elevated warming levels. Our study further expands on these results by systematically quantifying changes in extreme floods across precise global warming thresholds (1.5° C−4.5° C).
This study makes key advances in extreme flood research for the Pearl River Basin. By integrating global warming thresholds with hydrological projections, we provide unprecedented granularity in quantifying future flood changes compared to previous studies (Liu L. L. et al., 2017; Wang et al., 2017; Zhao et al., 2020). Critically, our results indicate that the Beijiang sub-basin exhibits relative resilience in extreme flood response, manifesting smaller extreme flood increases than observed in the Xijiang and Dongjiang sub-basins. Possible reasons for Beijiang's relative resilience include its geographic characteristics, lower rates of precipitation change, comparatively milder topography, and potential buffering capacities from land-use patterns (higher forest coverage or reservoir regulation). These basin-specific attributes likely moderate flood responses to climate change, thereby explaining Beijiang's reduced sensitivity.
The projected spatial variability underscores the need for sub-basin-specific management plans (Wang et al., 2022), where integrated approaches tailored to each sub-basin's unique climatic and hydrological characteristics can enhance resilience against floods. The heightened sensitivity of extreme floods to global warming thresholds emphasizes the dual importance of climate mitigation to limit warming and adaptation to manage the resulting hydrological changes, advocating for policies that simultaneously address emissions reductions and enhance flood management infrastructure (Gu et al., 2017; Lin et al., 2020; Yang et al., 2018).
5 Conclusions
This study advances extreme flood change understanding in the Pearl River Basin, identifying sub-basin-specific responses and sensitivities to global warming thresholds. Our study fills research gaps, supporting future resilience strategies. The following conclusions are drawn based on this study.
First, extreme floods exhibit spatial heterogeneity at Boluo, Gaoyao, and Shijiao under various scenarios. From SSP126 to SSP585, future scenarios reveal significant but distinct patterns. At Boluo station, extreme flood initially decreases slightly under SSP126 and SSP370 scenarios, but then sharply increases under SSP58. At Gaoyao station, extreme flood exhibits a steady upward trend across SSP126 and SSP370, with a minor decline observed under SSP585. At Shijiao station, extreme flood consistently increases across all emission scenarios (SSP126, SSP370, and SSP585). These contrasting extreme flood responses highlight the necessity of implementing targeted, location-specific flood risk management strategies.
Second, during the near-future period (2036–2065), extreme floods across the Pearl River Basin are projected to increase by about 44–50%, while far-future projections (2071–2100) show more pronounced rises of 57–68%. Gaoyao exhibits the most pronounced absolute increases, whereas Boluo and Shijiao show comparatively moderate rises. All SSP scenarios project escalating flood magnitudes, especially under SSP585 in the far-future period, driving the most extreme intensification.
Third, basin-specific sensitivities to warming reveal striking contrasts. Floods in Xijiang exhibit the steepest absolute trend, whereas floods in Dongjiang show the highest relative amplification (7% per 0.5° C rise), signaling acute vulnerability to incremental warming. Floods in Beijiang, while less sensitive, maintains a persistent positive trend.
Data availability statement
The original contributions presented in the study are included in the article/Supplementary material, further inquiries can be directed to the corresponding author/s.
Author contributions
WQ: Formal analysis, Visualization, Data curation, Writing – review & editing, Project administration, Methodology, Validation, Writing – original draft, Investigation, Funding acquisition, Conceptualization, Software, Resources, Supervision. RH: Writing – review & editing, Writing – original draft, Conceptualization. YC: Funding acquisition, Project administration, Writing – review & editing. QT: Funding acquisition, Project administration, Writing – review & editing.
Funding
The author(s) declare that financial support was received for the research and/or publication of this article. This study was supported by the Basic Science Center Project of the Natural Science Foundation of China (52388101), and National Key Research and Development Program of China (2024YFF0808803).
Conflict of interest
The authors declare that the research was conducted in the absence of any commercial or financial relationships that could be construed as a potential conflict of interest.
Generative AI statement
The author(s) declare that no Gen AI was used in the creation of this manuscript.
Any alternative text (alt text) provided alongside figures in this article has been generated by Frontiers with the support of artificial intelligence and reasonable efforts have been made to ensure accuracy, including review by the authors wherever possible. If you identify any issues, please contact us.
Publisher's note
All claims expressed in this article are solely those of the authors and do not necessarily represent those of their affiliated organizations, or those of the publisher, the editors and the reviewers. Any product that may be evaluated in this article, or claim that may be made by its manufacturer, is not guaranteed or endorsed by the publisher.
Supplementary material
The Supplementary Material for this article can be found online at: https://www.frontiersin.org/articles/10.3389/frwa.2025.1624694/full#supplementary-material
References
Chen, X., Zhang, H., Chen, W., and Huang, G. (2021). Urbanization and climate change impacts on future flood risk in the Pearl River delta under shared socioeconomic pathways. Sci. Total Environ. 762:143144. doi: 10.1016/j.scitotenv.2020.143144
Duan, R., Huang, G., Zhou, X., Li, Y., and Tian, C. (2021). Ensemble drought exposure projection for multifactorial interactive effects of climate change and population dynamics: application to the Pearl River basin. Earth's Future 9:e2021EF002215. doi: 10.1029/2021EF002215
Green, J., Quinn, I., Haigh, D. I., and Neal, J. (2025). Review article: a comprehensive review of compound flooding literature with a focus on coastal and estuarine regions. Nat. Hazards Earth Syst. Sci. 25, 747–816. doi: 10.5194/nhess-25-747-2025
Gu, X. H., Zhang, Q., Singh, V. P., Xiao, M. Z., and Cheng, J. Q. (2017). Nonstationarity-based evaluation of flood risk in the Pearl River basin: changing patterns, causes and implications. Hydrol. Sci. J. 62, 246–258. doi: 10.1080/02626667.2016.1183774
He, J., Yang, K., Tang, W., Lu, H., Qin, J., Li, X., and Chen, Y. (2020). The first high-resolution meteorological forcing dataset for land process studies over China. Sci. Data 7:25. doi: 10.1038/s41597-020-0369-y
Lange, S., and Büchner, M. (2021). “ISIMIP3b bias-adjusted atmospheric climate input data,” in ISIMIP Repository (Potsdam). doi: 10.48364/ISIMIP.842396.1
Lin, W. B., Sun, Y. M., Nijhuis, S., and Wang, Z. L. (2020). Scenario-based flood risk assessment for urbanizing deltas using future land-use simulation (FLUS): guangzhou metropolitan area as a case study. Sci. Total Environ. 739:139899 doi: 10.1016/j.scitotenv.2020.139899
Liu, J. Y., Zang, Q., Zhang, Y., et al. (2017). Deducing climatic elasticity to assess projected climate change impacts on streamflow change across China. J. Geophys. Res. Atmos. 122, 10197–10214. doi: 10.1002/2017JD026701
Liu, L., Jiang, T., Xu, H., and Wang, Y. (2018). Potential threats from variations of hydrological parameters to the Yellow River and Pearl River basins in China over the Next 30 years. Water 10:883. doi: 10.3390/w10070883
Liu, L. L., Xu, H. M., Wang, Y., and Jiang, T. (2017). Impacts of 1.5 and 2.0 °C global warming on water availability and extreme hydrological events in Yiluo and Beijiang River catchments in China. Clim. Change 145, 145–158. doi: 10.1007/s10584-017-2072-3
Liu, S., Shi, H., Niu, J., Chen, J., and Kuang, X. (2020). Assessing future socioeconomic drought events under a changing climate over the Pearl River basin in South China. J. Hydrol. Reg. Stud. 30:100700. doi: 10.1016/j.ejrh.2020.100700
Qi, W., Feng, L., Liu, J., and Yang, H. (2022a). Growing hydropower potential in China under 1.5 °C and 2.0 °C global warming and beyond. Environ. Res. Lett. 17:114049. doi: 10.1088/1748-9326/ac9c72
Qi, W., Feng, L., and Yang, H. (2022b). Economic growth dominates rising potential flood risk in the Yangtze River and benefits of raising dikes from 1991 to 2015. Environ Res Lett. 17:034046. doi: 10.1088/1748-9326/ac5561
Qiu, J., Liu, B., Yang, F., Wang, X., and He, X. (2022). Quantitative stress test of compound coastal-fluvial floods in China's Pearl River delta. Earth's Future 10:e2021EF002638. doi: 10.1029/2021EF002638
Rivera, J., Robo, M., Bianchi, E., and Mulleady, C. (2024). Impact of climate change on the streamflow in northern Patagonia. J. Water Clim. Change 15, 2074–2091. doi: 10.2166/wcc.2024.492
Schaffhauser, T., Lange, S., Tuo, Y., and Disse, M. (2023). Shifted discharge and drier soils: hydrological projections for a Central Asian catchment. J. Hydrol. Reg. Stud. 46:101338. doi: 10.1016/j.ejrh.2023.101338
Tang, Y. H., Xi, S. F., Chen, X. H., and Lian, Y. Q. (2016). Quantification of multiple climate change and human activity impact factors on flood regimes in the Pearl River Delta of China. Adv. Meteorol. 11:3928920. doi: 10.1155/2016/3928920
Wang, X., Yang, T., Li, X., Shi, P., and Zhou, X. (2017). Spatio-temporal changes of precipitation and temperature over the Pearl River basin based on CMIP5 multi-model ensemble. Stoch. Environ. Res. Risk Assess. 31, 1077–1089. doi: 10.1007/s00477-016-1286-7
Wang, X. Y., Zhang, Z., Liu, F., and Chen, S. (2022). Study on supply-demand balance analysis and service flow of water resources in Dongjiang River basin. Water 14:2060. doi: 10.3390/w14132060
Wang, Z., Zhong, R., Lai, C., Zeng, Z., Lian, Y., and Bai, X. (2018). Climate change enhances the severity and variability of drought in the Pearl River Basin in South China in the 21st century. Agric. Forest Meteorol. 249, 149–162. doi: 10.1016/j.agrformet.2017.12.077
Werning, M., Hooke, D., Krey, V., Riahi, K., Ruijven, V. B., and Byers, A. E. (2024). Global warming level indicators of climate change and hotspots of exposure. Environ. Res. Climate 3:045015. doi: 10.1088/2752-5295/ad8300
Wu, Y., Yin, Z., Zhou, G., Dai, A., Wang, F., Gentine, P., Zhang, G., Song, Y., and Zhou, D. (2024). Rising rainfall intensity induces spatially divergent hydrological changes within a large river basin. Nature Communications 15:823. doi: 10.1038/s41467-023-44562-8
Yan, D., Werners, S. E., Ludwig, F., and Huang, H. Q. (2015). Hydrological response to climate change: the Pearl River, China under different RCP scenarios. J. Hydrol. Reg. Stud. 4, 228–245. doi: 10.1016/j.ejrh.2015.06.006
Yang, L. E., Chan, F. K. S., and Scheffran, J. (2018). Climate change, water management and stakeholder analysis in the Dongjiang River basin in South China. Int. J. Water Resour. Dev. 34, 166–191. doi: 10.1080/07900627.2016.1264294
Yatagai, A., Kamiguchi, K., Arakawa, O., Hamada, A., Yasutomi, N., and Kitoh, A. (2012). APHRODITE: constructing a long-term daily gridded precipitation dataset for Asia based on a dense network of rain gauges. Bull. Am. Meteorol. Soc. 93, 1401–1415. doi: 10.1175/BAMS-D-11-00122.1
Yuan, F., Tung, Y.-K., and Ren, L. (2015). Projection of future streamflow changes of the Pearl River basin in China using two delta-change methods. Hydrol. Res. 47, 217–238. doi: 10.2166/nh.2015.159
Zhang, Q., Gu, X., Singh, V. P., Shi, P., and Sun, P. (2018a). More frequent flooding? Changes in flood frequency in the Pearl River basin, China, since 1951 and over the past 1,000 years. Hydrol. Earth Syst. Sci. 22, 2637–2653. doi: 10.5194/hess-22-2637-2018
Zhang, Q., Gu, X., Singh, V. P., Xiao, M., and Xu, C.-Y. (2015). Flood frequency under the influence of trends in the Pearl River basin, China: changing patterns, causes and implications. Hydrol. Proc. 29, 1406–1417. doi: 10.1002/hyp.10278
Zhang, Q., Li, J., Xihui, G., and Shi, P. (2018b). Is the Pearl River basin, China, drying or wetting? Seasonal variations, causes and implications. Glob. Planet. Change 166:48–61. doi: 10.1016/j.gloplacha.2018.04.005
Zhang, Q., Xu, C.-Y., Chen, Y. D., and Jiang, J. (2009). Abrupt behaviors of the streamflow of the Pearl River basin and implications for hydrological alterations across the Pearl River Delta, China. J. Hydrol. 377, 274–283. doi: 10.1016/j.jhydrol.2009.08.026
Zhang, Q. A., Xu, C. Y., Zhang, Z. X., and Chen, Y. D. (2010). Changes of atmospheric water vapor budget in the Pearl River basin and possible implications for hydrological cycle. Theor. Appl. Climatol. 102, 185–195. doi: 10.1007/s00704-010-0257-z
Zhao, F., Nie, N., Liu, Y., Yi, C., Wada, Y., Burek, P., et al. (2025). Benefits of calibrating a global hydrological model for regional analyses of flood and drought projections: a case study of the Yangtze River basin. Water Resour. Res. 61:e2024WR037153. doi: 10.1029/2024WR037153
Zhao, Y., Zou, X., Cao, L., and Xu, X. (2014). Changes in precipitation extremes over the Pearl River Basin, southern China, during 1960–2012. Q. Int. 333, 26–39. doi: 10.1016/j.quaint.2014.03.060
Zhao, Y. M., Li, Z. S., Cai, S. Y., and Wang, H. (2020). Characteristics of extreme precipitation and runoff in the Xijiang River basin at global warming of 1.5 °C and 2 °C. Nat. Hazards 101, 669–688. doi: 10.1007/s11069-020-03889-x
Zhou, Y. L., Lai, C., Wang, Z., Chen, X., Zeng, Z., Chen, J., and Bai, X. (2018). Quantitative evaluation of the impact of climate change and human activity on runoff change in the Dongjiang River Basin, China. Water 10:571. doi: 10.3390/w10050571
Zhu, X., Lee, S., Wen, X., Ji, X., Lin, L., Wei, Z., Zheng, Z., Xu, D., and Dong, W. (2021). Extreme climate changes over three major river basins in China as seen in CMIP5 and CMIP6. Clim Dyn 57, 1187–1205. doi: 10.1007/s00382-021-05767-z
Keywords: Pearl River Basin, WEB-DHM-SG, climate change, floods, global warming levels
Citation: Qi W, Huang R, Cai Y and Tan Q (2025) Extreme flood intensification in the Pearl River Basin in the future under 1.5° C, 2.0° C, and higher global warming levels. Front. Water 7:1624694. doi: 10.3389/frwa.2025.1624694
Received: 07 May 2025; Accepted: 11 August 2025;
Published: 15 September 2025.
Edited by:
Suparana Katyaini, Council on Energy, Environment and Water (CEEW), IndiaReviewed by:
Yuliang Zhou, Hefei University of Technology, ChinaBhaskar Sinha, Indian Institute of Forest Management, India
Lina Wang, South China Normal University, China
Copyright © 2025 Qi, Huang, Cai and Tan. This is an open-access article distributed under the terms of the Creative Commons Attribution License (CC BY). The use, distribution or reproduction in other forums is permitted, provided the original author(s) and the copyright owner(s) are credited and that the original publication in this journal is cited, in accordance with accepted academic practice. No use, distribution or reproduction is permitted which does not comply with these terms.
*Correspondence: Wei Qi, cWl3ZWlfd2F0ZXJyZXNvdXJjZXNAaG90bWFpbC5jb20=; Ruiting Huang, aHJhbmV0eUAxNjMuY29t