Abstract
Groundwater resources are the primary source of different uses in the Sultanpur district of Uttar Pradesh. Hence, the present study aimed to assess the concentration of major and trace elements in the groundwater of the Sultanpur district to identify the major controlling factors of the chemical composition of groundwater and assess the quality of groundwater for drinking, domestic and irrigation uses. To achieve these goals, 58 groundwater samples were collected from the district, and the chemistry of the groundwater was analysed. The results show that the district’s groundwater was slightly alkaline in nature, with maximum EC and TDS values recorded as 1,373 μS/cm and 859 mg/L, respectively. The anionic chemistry of groundwater was dominated by bicarbonate and sulphate, while sodium and calcium dominated the cationic chemistry. The hydrogeochemical approaches and multivariate statistical analysis suggest that the rock weathering and ion-exchange processes, with limited contributions from anthropogenic activities, controlled the chemical composition of the groundwater. The concentration of TDS, total hardness (TH), fluoride, manganese, and iron exceeded the recommended drinking water acceptable limit of the Bureau of Indian Standards (BIS 2012) at several locations. The water quality index (WQI) shows that the groundwater samples were suitable for drinking purposes, except at a few sampling locations. The hazard index (HI) shows that 15 groundwater sampling locations were potentially risky to children, and seven locations have a potential risk to adults in the study area. Magnesium hazard (MH) is the most concerning parameter for irrigation usage.
1 Introduction
Groundwater is a vital natural resource in India for domestic, agricultural and industrial purposes (Machender et al., 2014). Rapid population growth and intensified development activities have drastically increased water demand in arid and semi-arid areas, especially in developing countries (Ali et al., 2022). Groundwater quality depends on several local and regional factors, such as geology, lithology, degree of weathering and dissolution of rocks, and recharge water quality (Domenico, 1972; Hem, 1985). Also, groundwater quality of any area depends on anthropogenic activities, such as over-extraction, agricultural practices, and domestic and industrial sewage disposal (Matiatos, 2016; Gao et al., 2021; Kaushal et al., 2011). Generally, agricultural activities influence the chemistry of groundwater where there are no major industrial setups (Andrade and Stigter, 2011; Dhakate and VV S, 2015; Kaur et al., 2019; Tiwari et al., 2021; Gautam et al., 2022). Intake of contaminated drinking water threatens human health and hinders social prosperity and economic development (Singh et al., 2013a). Moreover, excessive concentration of dissolved major or trace elements in drinking water may lead to several severe physiological complications in humans. For example, high concentrations of fluoride and nitrate in groundwater can cause fluorosis and blue-baby syndrome. Elements like Arsenic (As), Chromium (Cr), Cadmium (Cd), Lead (Pb), and Nickel (Ni) are highly toxic to human health (Kumar et al., 2021). Therefore, the hydrogeochemical study of groundwater resources is essential to assess the concentration level of dissolved elements, identify the contaminants and their sources and water suitability for several purposes. Numerous studies have been carried out to study the hydrogeochemical characteristics of groundwater in different parts of the world (Tarawneh et al., 2019; Ren et al., 2021; Laghrib et al., 2024; Rubio-Arellano et al., 2024; Salh et al., 2025). In the Indian scenario, several researchers have shown interest in assessing groundwater’s hydrogeochemical characteristics and suitability for domestic and irrigation uses (Gautam et al., 2015; Selvakumar et al., 2017; Madhav et al., 2018; Chidambaram et al., 2018; Singh et al., 2018; Alam et al., 2020; Singh et al., 2020; Karmakar et al., 2023). In particular, several comprehensive studies have been carried out in other districts around the Sultanpur district of Uttar Pradesh to understand the hydrogeochemical characteristics and groundwater quality (Maurya et al., 2025; Kumari et al., 2024; Shukla and Saxena, 2020; Tiwari and Singh, 2014; Yadav et al., 2024). However, such information is lacking in the Sultanpur district of Uttar Pradesh. Hence, the objectives of the present study are: (i) to assess the concentration of major and trace elements in the groundwater of the Sultanpur district, (ii) to identify the major controlling factors of the chemical composition of groundwater, (iii) to assess the suitability of groundwater for different uses in the study area.
2 Study area
Sultanpur is a district of Uttar Pradesh with a total area of around 2,672.89 Km2. The district lies between 25°58′N and 26°40′N latitude and 81°33′E and 82°40′E longitude (Figure 1). The district has a total population of around 2,431,491 with a population density of 910 persons/km2 (Government of India, 2011). The district has a semi-arid climate, with very cold winters with average temperatures of around 3–4°C in December and January and extremely hot summers in May and June, around 44°C. The annual normal rainfall is 887.55 mm. Out of the total, the average monsoon rainfall (which occurs in June, July, August, and September) is 795. 84 mm and the rest (91.75 mm) is non-monsoon rainfall (CGWB, 2023). The CGWB (2023) report suggests that agricultural land dominates in the district, followed by urban settlements and households, vegetation and forest cover, fallow land, and barren land. Groundwater and canals play a major role in irrigation in the study area. About 86% of the total agricultural area uses groundwater for irrigation. The remaining 14% use canals to fulfil the irrigation demand (CGWB, 2023). The main crops of the districts are Rabi and Kharif, with limited Zaid and Sugarcane.
Figure 1
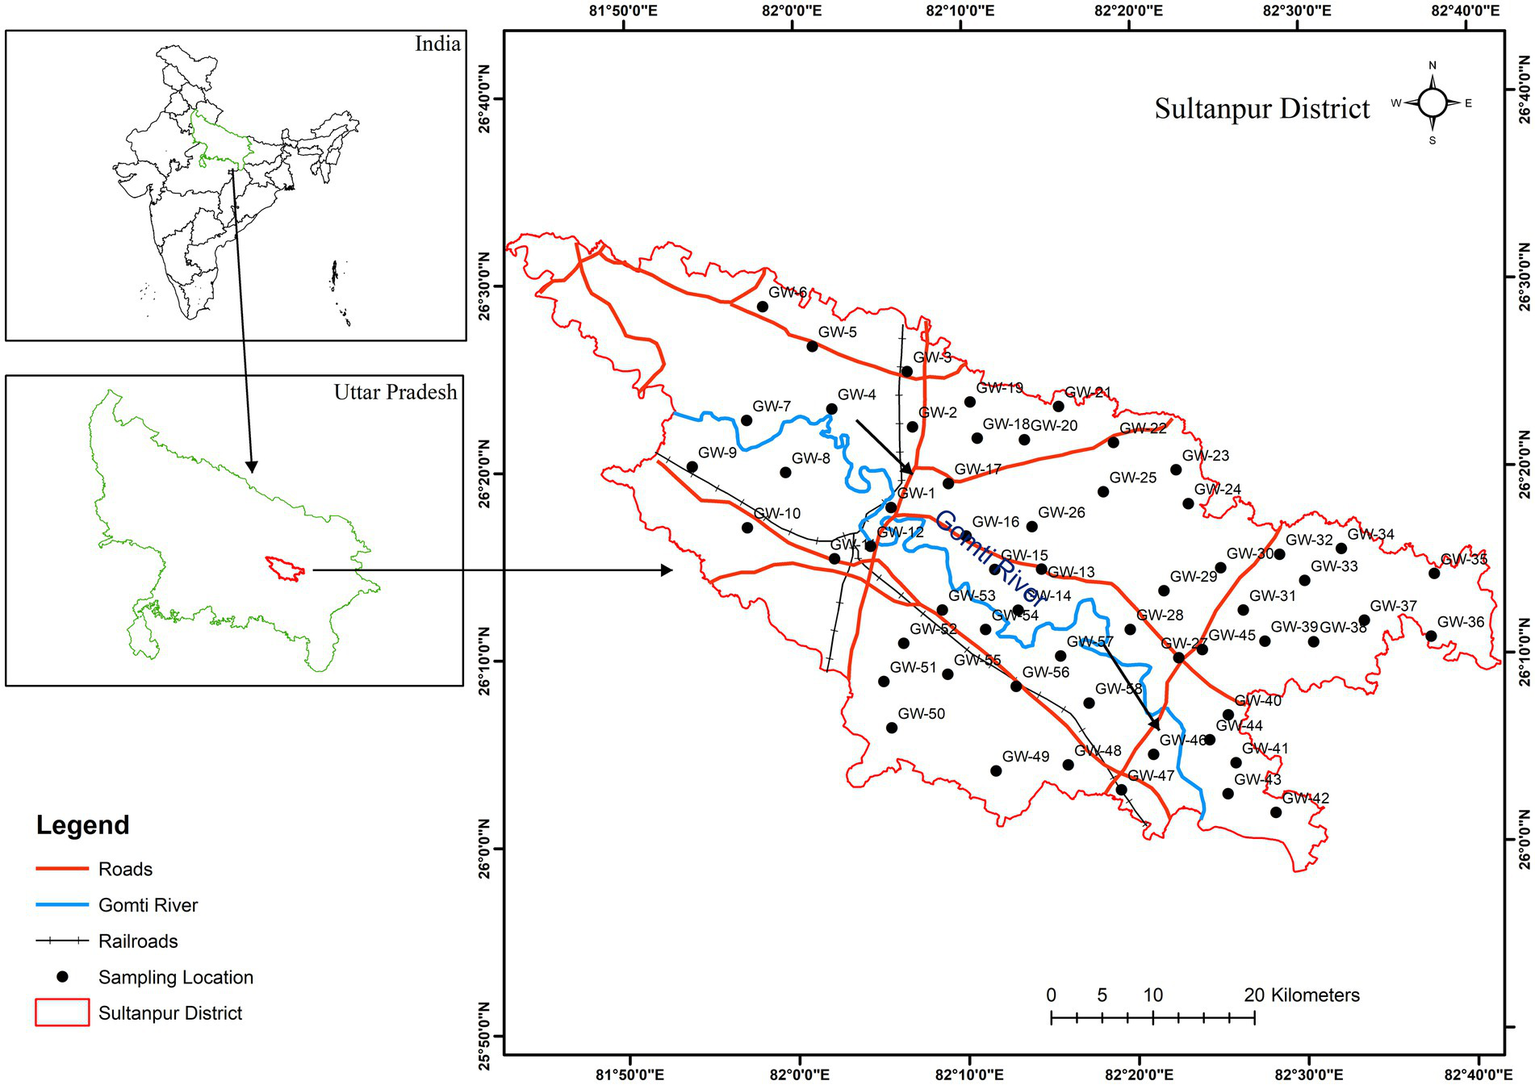
Study area and groundwater sampling location map of the Sultanpur district, Uttar Pradesh.
From a hydrogeological perspective, the district is situated in the Ganga Plain, a central part of the Indo-Gangetic Plains. This plain is divided into three distinct physiographic regions based on climate variability and regional geography: the Upper Ganga Plain, the Middle Ganga Plain, and the Ganga–Brahmaputra Delta, also known as the Lower Ganga Plain (Sinha et al., 2005). The study area falls within the Middle Ganga Plain. The Ganga Alluvial Plain is traditionally classified into two main morpho-stratigraphic units: the Older Alluvium and Younger Alluvium (Valdiya, 2015). The sand fraction of the Ganga Plain sediments mainly comprises quartz, muscovite, biotite, plagioclase, and orthoclase. The muddy sediments of the Ganga Plain also show the presence of clay minerals such as illite, chlorite, vermiculite and kaolinite along with minerals found in the sand fraction (Tripathi et al., 2006; Yadav et al., 2024; Srivastava et al., 2025). The district’s aquifers have been categorised into a three-tier aquifer system based on hydrogeological information (CGWB, 2023). The first-tier aquifer system varied from 25 to 130 m below ground level (m bgl) and was primarily used to meet water demand (CGWB, 2023; Gautum, 2004).
3 Methodology
A groundwater sampling was conducted in December 2023 (winter month) in the Sultanpur district, Uttar Pradesh, India (Figure 1). Fifty-eight (58) groundwater samples were collected from handpumps in pre-washed narrow-mouth polyethylene bottles (500 mL and 120 mL) after pumping the handpumps for around 3–4 min from different locations of the district. The groundwater samples were collected randomly after preparing 7.5 × 7.5 grids from densely populated villages in a geographic information system (GIS) environment. Coordinates were recorded for each groundwater sampling location using mobile Google Maps in the field. The pH and EC were measured in the field using a handy multi-parameter probe (Hanna pH meter HI98130). The handy multi-parameter probe was calibrated before collecting samples using pH buffer of 4.01, 7.0 and 10.01 for pH, and 1,413 μS/cm for EC. The turbidity of the samples was measured using a turbidity meter (Thermo Orion AQ3010). After turbidity estimation, groundwater samples were filtered through a 0.22 μm membrane filter paper for dissolved major ions analysis. The bicarbonate (HCO3−) in the groundwater samples was analysed using the acid titration method (APHA, 1998). The major cations (Na+, Ca2+, Mg2+, and K+) and major ions (Cl−, SO42−, NO3−, and F−) in the groundwater samples were determined using an ion chromatograph (Metrohm Eco IC) at the School of Environmental Sciences, JNU, New Delhi. In case of metal analysis, filtered (with 0.22 μm) groundwater samples were acidified with HNO3 and stored at 4°C for trace elements analysis. Trace elements (i.e., Al, Cr, Mn, Fe, Ni, Cu, Zn, As, Se, Sr, Cd, and Pb) concentration in the groundwater samples were analysed using Q-ICPMS (Thermo Scientific) at the National Geochronology Facility at Inter-University Accelerator Centre (IUAC), New Delhi. Furthermore, a GIS software was used to prepare spatial distribution maps using the inverse distance weighted (IDW) method.
3.1 Quality control
During sampling and analysis of Sultanpur groundwater, the quality control measures were exercised to avoid impurity and guarantee reliability. Standards used for analysis were prepared by using analytical-grade reagents in Milli-Q water. pH and EC were again measured in the laboratory using an electrochemistry meter (Thermo Scientific Orion Versastar Pro). The analysis of the samples was also repeated using different methods, such as Na+ and K+, which were also determined using a flame photometer (Labtronics); the argentometric titration method was used for Cl− determination. The results were compared, and a deviation within 5% was found. A charge balance error (CBE) was also calculated for all major ions and was found to be <10%. For trace element analysis with Q-ICPMS, commercial multi-element standard solution and Hg single element reference standard (procured from Inorganic Ventures) were used as calibrating standards. For measurement and data quality assessment, a multi-element standard solution was measured at intervals of every 20 samples as an unknown, and the precision of all these measurements was found to be better than 5% relative standard deviation (RSD) for all elements. The elemental concentration for each unknown sample was derived from the average of three replicate analyses per measurement.
3.2 Multi-statistical analysis
The Pearson correlation coefficient is a statistical technique commonly used to show the dependency of one variable on the others. It measures the strength of the linear relationship between two variables (Berman, 2016). Depending on their magnitude, correlations are classified as very strong (>0.80), strong (0.60–0.79), moderate (0.40–0.59), weak (0.20–0.39), and very weak (<0.20) (Wuensch and Evans, 1996; Papageorgiou, 2022). Apart from the correlation coefficient technique, principal component analysis (PCA) is among the most used multivariate statistical tools and is broadly used to gain helpful information on water quality data (Benkov et al., 2023; Franco et al., 2021; Ibrahim et al., 2023). Large data sets are transformed into small components (principal components, PCs), which are obtained from linear combinations of the original variables in such a way that the first PC tries to denote most of the variation in the original variable (Jollife and Cadima, 2016; Wold et al., 1987). These new sets of variables are also known as principal components (PCs), which are weighted linear combinations of the original variables. Eigenvalues help to discern the significance of the component. The components with eigenvalues ≥1.0 are considered significant in the studies (Kim et al., 2005). The methodology is valid when the Kaiser-Meyer-Olkin (KMO) coefficient value is greater than 0.5 (Liu et al., 2003; Sajil Kumar et al., 2014). Factor loading is classified into three classes: strong (>0.75), moderate (0.75–0.50) and weak (0.50–0.30) (Liu et al., 2003). The correlation analysis and PCA were used to identify the relations among the dissolved elements in the groundwater and their possible sources in the area.
3.3 Hydrogeochemical approaches
Hydrogeochemical approaches (i.e., Piper diagram, Gibbs diagram, molar ratios, scatter plots) were used to understand the hydrogeochemical facies and mechanisms controlling groundwater chemistry of the study area. Furthermore, chloro-alkaline indices were used to understand the processes of ion exchange and reverse ion exchange between groundwater and its surroundings (host-rock) (Schoeller, 1977). The chloro-alkaline indices are expressed as:
All values are expressed in meq/L.
3.4 Water quality indices
Different water quality indices are used to assess the overall quality of water for several usages, including drinking and irrigation. The water quality index (WQI) provides information about water quality in a single value. It may be defined as a reflection of the cumulative influence of all analysed water parameters on the overall quality of water (Horton, 1965). WQI of the analysed groundwater samples was calculated using 13 analysed parameters (pH, TDS, Turbidity, TH, Na+, K+, Ca2+, Mg2+, F−, Cl−, HCO3−, NO3−, and SO42−). These parameters have been assigned a certain weight from 2 to 5 based on their importance in water quality assessment (Vasanthavigar et al., 2010; Tiwari et al., 2017; Bharat and Singh, 2024). WQI is calculated by using the expressions in the following steps;
Step 1:
Assign a weight to each water hydrochemical parameter (i.e., 5 is given to TDS, F− and NO3−; 4 is given to pH, SO42− and Cl−; 3 is given to TH and Na+; and 2 is given to Ca2+, Mg2+ K+ and turbidity).
Step 2: where,
= relative weight, = weightage of each parameter, and n = number of parameters.
Step 3: where,
is the quality rating, see (Vasanthavigar et al., 2010; Tiwari et al., 2017) for more detail, and = concentration of each chemical parameter in each water sample. Si is the BIS (2012) and the WHO (1997), for sodium and potassium, standards of each parameters.
Step 4: where, SI is the sub-index of each parameter.
Step 5:
Where, is the sub-index of the ith parameter.
Based on the calculated WQI values, water is classified into five classes, i.e., (a) Excellent (<50), (b) Good (50–100), (c) Poor (100–200), (d) Very poor (200–300), and (e) Unfit (>300) (Neogi et al., 2023; Tiwari et al., 2017; Vasanthavigar et al., 2010).
Apart from assessing water quality for drinking purposes, several water quality indices are utilised to estimate the suitability for irrigation purposes, such as Sodium Adsorption Ratio (SAR), Residual Sodium Carbonate (RSC), Percent Sodium (%Na), Magnesium Hazard (MH), Kelley Index (KI) (Richards, 1954; Shainberg and Oster, 1979; Todd and Mays, 2004; Wilcox, 1955).
These indices were estimated by using the following equations:
All parameter concentrations are in meq/L.
3.5 Risk assessment on human health
Carcinogenic materials (such as trace elements) can enter the human body through three main pathways: direct ingestion, dermal absorption through the skin, and inhalation through the nose and mouth. However, among the above-discussed pathways, the ingestion pathway is crucial for drinking groundwater from exposure to trace elements (
Giri and Singh, 2015;
O'Rourke et al., 1999;
USEPA, 2004). The dose received by ingestion for the present study was calculated by the following equation:
where,
ADD is an abbreviation for average daily dose (μg/kg/day),
Cw is the concentration of trace elements in groundwater,
IR is the ingestion/intake rate of drinking water (4 L/day for adults and 2 L/day for children) (Chowdhury et al., 2001; Chowdhury et al., 2016),
EF is the exposure factor (350 days/year) (USEPA, 2011),
ED is the exposure duration (30 years for adults and 6 years for children) (USEPA, 2011),
BW is the body weight (52 kg for adults and 16.3 kg for children) (Jain et al., 1995), and
AT is the average time, calculated by multiplying ED by 365 days (i.e., 10,950 days for adults and 2,190 days for children) (USEPA, 2011).
Risk characterisation (for non-cancer health risk) is reflected by the hazard quotient (HQ). HQ was calculated by using the following equation:where,
RfD is the reference dose as per the USEPA risk-based concentration table (USEPA, 2011).
For risk assessment of multiple trace elements, the HQs of all the trace metals are summed up, which gives a hazard index (HI).
Drinking water with HI > 1 shows a potential for an adverse impact on human health, requiring further study (USEPA, 2004).
4 Results and discussion
4.1 Water quality parameters
The pH of the analysed groundwater samples of the study area varied from 7.53 to 8.22, with an average value of 7.83, inferring a slightly alkaline nature (Table 1). The lowest and highest pH were observed at GW-2 (7.53) and GW-51 (8.22), respectively. Electrical conductivity (EC) is an essential parameter for assessing the quality of water for drinking and irrigation utilisations and is influenced by the concentrations of dissolved ions (Tutmez et al., 2006). EC varied from 306 μS/cm (GW-17) to 1,373 μS/cm (GW-2), with an average value of 691 μS/cm (Table 1). The total dissolved solids (TDS) of the groundwater samples varied from 235 mg/L (GW-17) to 859 mg/L (GW-2), with an average value of 496 mg/L (Table 1). Figure 2 shows that all analysed of the groundwater samples belongs to fresh water categories (Freeze and Cherry, 1979). The turbidity of the groundwater samples varied from 0.01 NTU to 69.2 NTU (highest at GW-25) with an average value of 9.0 NTU. The high turbidity values in the groundwater samples may result from several factors: surface recharge, dissolution and/or weathering processes, and the corroded nature of iron pipes of hand pumps (Thakur et al., 2024; Ullah et al., 2023; Prasad et al., 2014).
Table 1
| Water quality parameters | BIS 2012 (IS: 10500) | Groundwater (n = 58) | The number of samples exceeded acceptable limits (BIS, 2012) | ||||
|---|---|---|---|---|---|---|---|
| Maximum permissible limits | Maximum acceptable limits | Minimum | Maximum | Mean | Standard error | ||
| Major ions | |||||||
| pH | – | 6.5–8.5 | 7.53 | 8.22 | 7.83 | 0.01 | 0 |
| EC | – | – | 306 | 1,373 | 691 | 21.1 | _ |
| Turbidity | 5.0 | 1.0 | 0.01 | 69.2 | 9.0 | 2.2 | 28 |
| HCO3− | – | – | 154 | 482 | 340 | 8.3 | – |
| F− | 1.5 | 1.0 | 0.26 | 1.71 | 0.62 | 0.03 | 3 |
| Cl− | 1,000 | 250 | 1.2 | 92.1 | 12.1 | 2.1 | 0 |
| NO3− | – | 45 | BDL | 38.0 | 5.7 | 1.0 | 0 |
| SO42− | 400 | 200 | BDL | 133 | 15.6 | 2.9 | 0 |
| Na+ | – | – | 7.6 | 140 | 41.1 | 3.6 | – |
| Ca2+ | 200 | 75 | 15.1 | 60.6 | 38.3 | 1.3 | 0 |
| Mg2+ | 100 | 30 | 8.6 | 87.3 | 34.3 | 1.5 | 40 |
| K+ | – | – | 3.1 | 20.0 | 5.5 | 0.3 | – |
| TDS | 2,000 | 500 | 235 | 859 | 496 | 8.3 | 31 |
| TH | 600 | 200 | 100 | 464 | 237 | 6.9 | 47 |
| Trace elements (μg/L) | |||||||
| Al | 200 | 30 | BDL | 85.7 | 5.6 | 1.6 | 2 |
| As | 50 | 10 | 0.1 | 4.4 | 0.5 | 0.07 | 0 |
| Sr | – | – | 88 | 962 | 426 | 22.6 | – |
| Cd | No relaxation | 3.0 | 0.01 | 0.31 | 0.06 | 0.01 | 0 |
| Cr | No relaxation | 50 | 0.7 | 6.4 | 2.1 | 0.16 | 0 |
| Cu | 1,500 | 50 | 0.1 | 5.6 | 1.0 | 0.2 | 0 |
| Fe | No relaxation | 300 | 10.2 | 5,674 | 422 | 128 | 16 |
| Mn | 300 | 100 | 2.0 | 486 | 62.7 | 10.2 | 10 |
| Ni | No relaxation | 20 | 0.6 | 4.7 | 1.4 | 0.1 | 0 |
| Pb | No relaxation | 10 | BDL | 11.1 | 0.7 | 0.2 | 1 |
| Se | No relaxation | 10 | BDL | 6.6 | 1.2 | 0.2 | 0 |
| Zn | 15,000 | 5,000 | 8.7 | 1,449 | 188 | 34.8 | 0 |
Hydrochemical analysis of groundwater samples of the Sultanpur district, Uttar Pradesh.
BDL, Below Detection Limit; TH, Total Hardness, major ion in mg/L, except pH (unitless), EC (μS/cm) and turbidity (NTU).
Figure 2
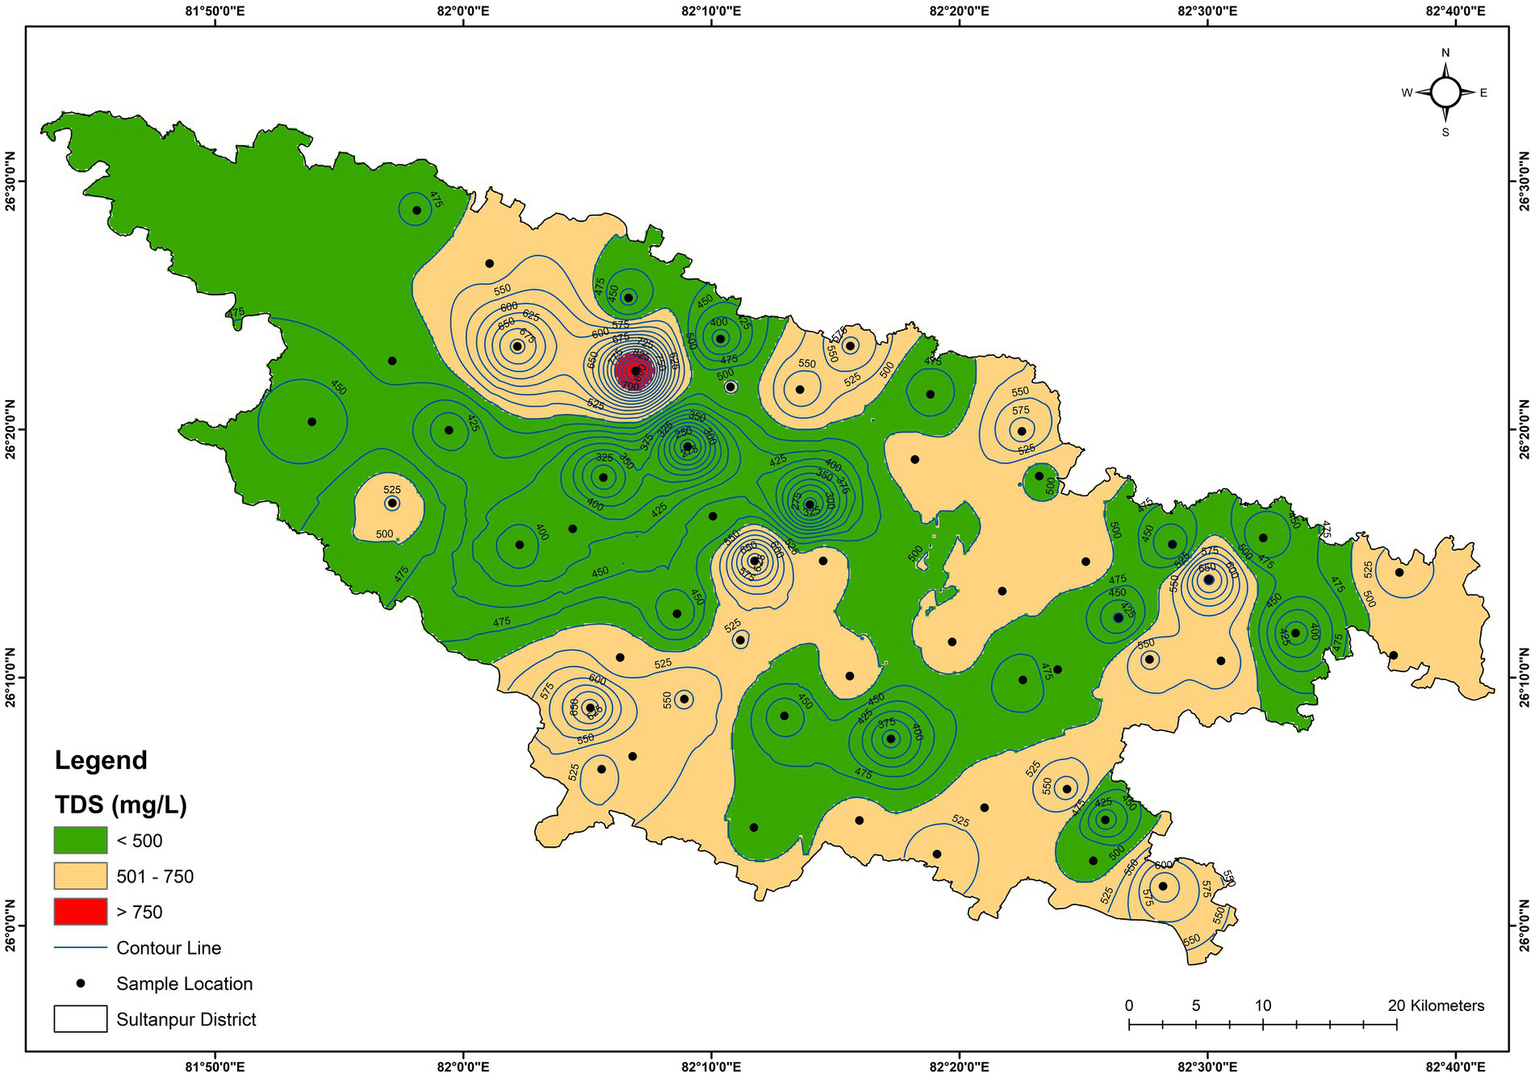
Spatial distribution map of TDS (mg/L) in the groundwater.
4.2 Major anions
The anion chemistry of the groundwater samples showed that HCO3− was the dominant anion, followed by SO42−, Cl−, NO3−, and F−. The concentration of HCO3− varied from 154 mg/L (GW-17) to 482 mg/L (GW-15), with an average value of 340 mg/L (Table 1). HCO3− accounted for 91.4% of total anions (TZ−) in the groundwater. HCO3− in groundwater is due to the dissolution of carbonate, weathering of alumino-silicate minerals, oxidation of organic matter, and respiration by roots in the unsaturated zone (Macpherson, 2009; Njitchoua and Ngounou, 1997). Higher concentrations of HCO3−, compared to other anions, indicated primary weathering of silicate minerals dominated by alkaline earth elements (Rose, 2002). SO42− was the second dominant anion after HCO3− and varied from BDL (detection limit, 0.01 mg/L) to 133 mg/L with an average value of 15.6 mg/L. The average contribution of SO42− in the groundwater was 3.9% of the total anions (TZ−). Sulphate concentration in groundwater may be primarily due to the dissolution of sulphate and sulphide minerals and anthropogenic sources (Torres-Martínez et al., 2020). F−, Cl−, and NO3− anions are generally used as tracers for water resource contamination (Loizidou and Kapetanios, 1993; Su et al., 2021; Abascal et al., 2022). Both geogenic and anthropogenic sources contribute to Cl− in groundwater. Geogenic sources include the weathering of evaporite and halite minerals, the dissolution of salt deposits and atmospheric precipitation. Anthropogenic sources may include domestic and municipal discharge, farm and fertiliser discharge, industrial effluents, and leachates from landfills (Venkatesan and Swaminathan, 2009). Cl− concentration ranged from 1.2 mg/L to 92.1 mg/L, with an average of 12.1 mg/L (Table 1). The maximum NO3− value was recorded as 38.0 mg/L, with an average of 5.7 mg/L (Table 1). A multitude of sources can contribute NO3− to groundwater. It includes nitrogenous fertilisers, organic manures, industrial effluents, animal and human wastes and biochemical activities (Suthar et al., 2009; Kumar et al., 2019). Sultanpur district is situated in the fertile Ganga Plain, and intensive agricultural activities are practised in about 68% of the total geographical area (CGWB, 2023). Farmers of the district generally used chemical fertilisers to increase crop productivity. The elevated NO3− level in the groundwater samples may be due to agricultural fertiliser or the leaching of human and animal wastes. The contamination of F− in groundwater is generally due to both natural and anthropogenic activities (Li et al., 2019). The common natural source is soluble fluoride-bearing minerals (Li et al., 2018). Meanwhile, anthropogenic sources are industrial and agricultural activities (Kumar et al., 2018; Kalpana et al., 2019). The concentration of F− varied from 0.26 mg/L to 1.71 mg/L, with an average value of 0.62 mg/L (Table 1). The spatial distribution map for F− shows that the majority of the groundwater from the district has a concentration less than 1, except at locations GW-12 and GW-20 (Figure 3). Excess of HCO3− ions in the groundwater at higher pH could release F− ions into groundwater by the dissolution of fluorite (CaF2) minerals (Dey et al., 2012; Guo et al., 2007), as shown in equations 15, 16:
Figure 3
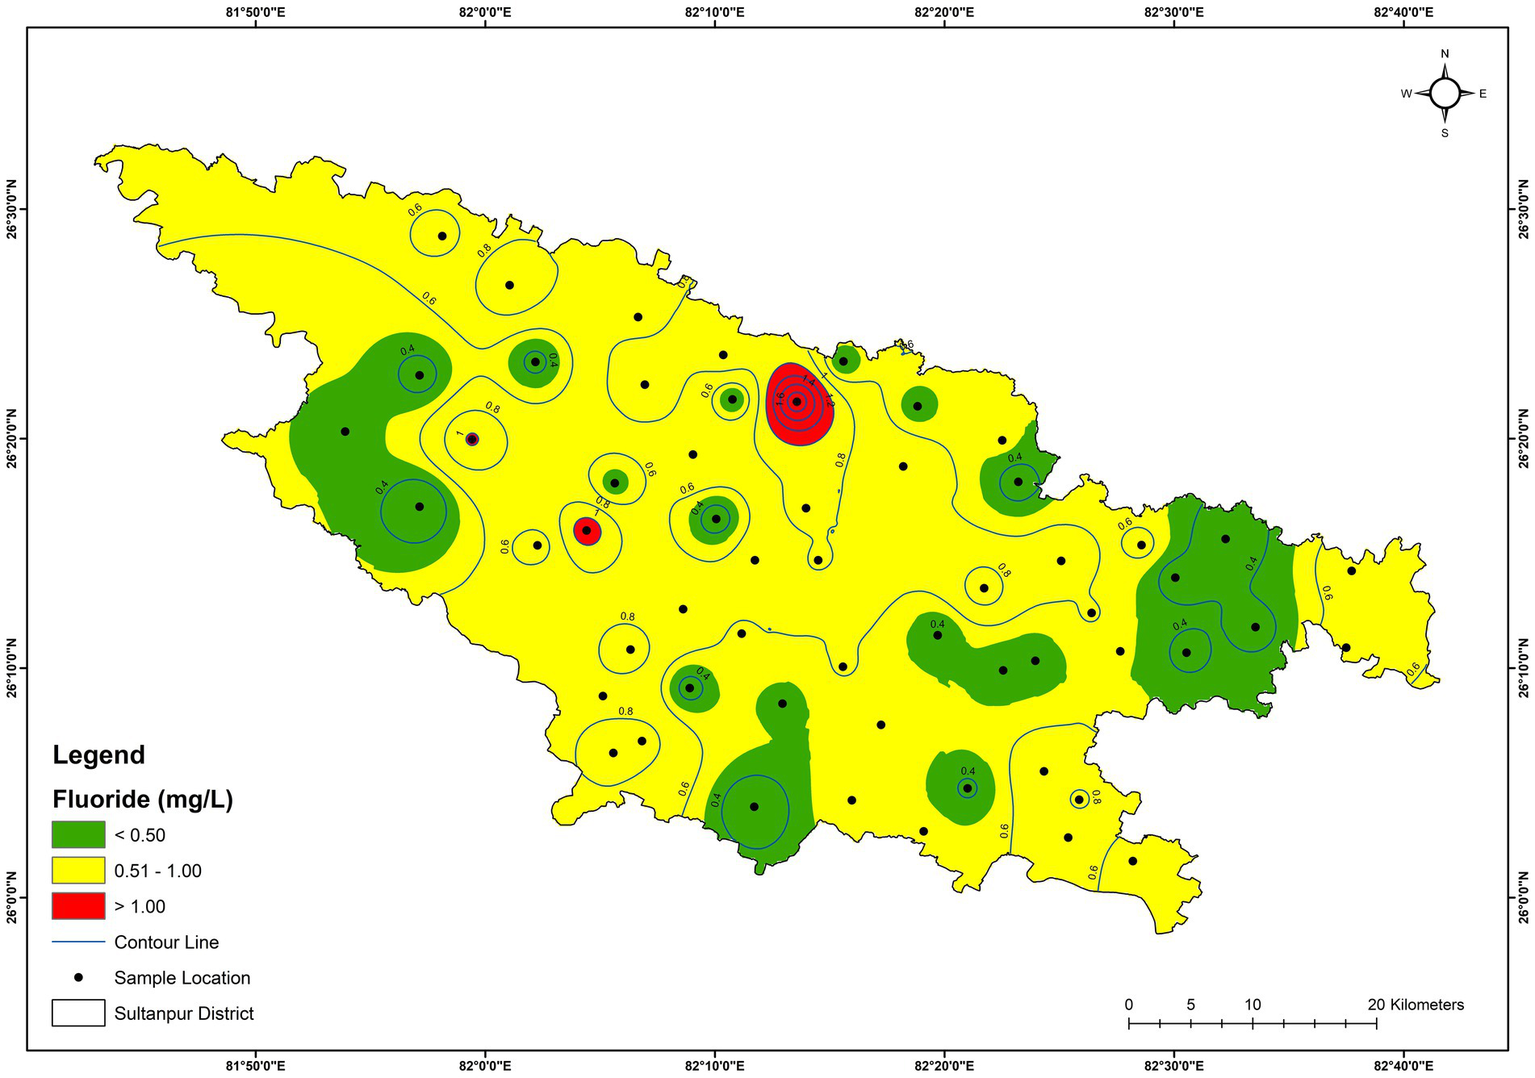
Spatial distribution of fluoride (mg/L) in the groundwater.
Fluoride is also dissolved in groundwater by the displacement of F− with OH− from minerals such as muscovite, biotite and amphibole in alkaline conditions (Guo et al., 2007; Mukherjee and Singh, 2018), as shown in equation 17.
Thus, a higher pH value (alkaline nature) produces favourable conditions for mobilising groundwater fluoride. Additionally, the percolation of phosphatic fertilisers from agricultural runoff may contribute to fluoride in nearby water resources (Prabhu et al., 2023; Hossein et al., 2024).
4.3 Major cations
The mean abundance of major cations in the groundwater of the study area was Na+ > Ca2+ > Mg2+ > K+, respectively. The concentration of Na+ varied from 7.6 mg/L to 140 mg/L, with an average value of 41.1 mg/L (Table 1), contributing 34% of the total cationic mass balance (TZ+). In general, the possible sources of Na+ in groundwater can be dissolution of salt deposits, weathering of silicate, halite and evaporite, sewage and industrial effluents (Priyadarshi, 2004). Ca2+ concentration varied from 15.1 mg/L to 60.6 mg/L, with an average value of 38.3 mg/L (Table 1), contributing 32.2% of the total cationic charge balance (TZ+). The concentration of Mg2+ varied from 8.6 mg/L to 87.3 mg/L, with a mean value of 34.3 mg/L (Table 1) and contributing 29% of the total cation charge balance (TZ+). The possible sources of Ca2+ and Mg2+ are the weathering of calcite, dolomite and silicate minerals. At some locations, the concentration of Mg2+ exceeds Ca2+, possibly due to the weathering of silicate minerals and the precipitation of Ca2+ ions (Mayo and Loucks, 1995; Brindha et al., 2017; Nasher and Ahmed, 2021). The concentration of K+ varied from 3.1 mg/L to 20.0 mg/L, with a mean value of 5.5 mg/L (Table 1), contributing 4.8% of TZ+. The possible sources of K+ are potassium-rich fertilisers, potassium-bearing rocks, leachates from landfill sites and industrial discharges (Handa, 1975; Sayyed and Arjun, 2011; Banerjee and Prasad, 2020).
4.4 Hydrochemical facies and water type
The Piper trilinear diagram (Piper, 1944) is extensively used to determine the chemical character of water by showing the similarities and dissimilarities of dominant anions and cations. It is also used to identify hydrochemical facies and ionic types of water (Tarawneh et al., 2019). Water samples of the study area were plotted in the Piper diagram (Figure 4). The triangular cationic diagram reveals that the majority of samples (74%) were plotted in the no-dominant zone. However, the triangular anionic diagram reveals that all the samples were plotted in the HCO3− dominant zone, which indicates the dominance of weak acids over strong acids (Figure 4). The triangular cationic diagram field revealed that about 93% of groundwater samples fall in subdivision 1, suggesting the dominance of alkaline earths (Ca2+ + Mg2+) exceeds alkalies (Na+ + K+). Also, 93% of groundwater samples fall in sub-division 5, indicating the carbonate hardness (secondary alkalinity exceeded 50%). About 5% of the samples fell in subdivision 8, signifying primary alkalinity and carbonate alkali water. Based on the dominance of different ions in the groundwater, the hydrochemical facies of the Sultanpur district were primarily Ca–Mg–HCO3 with a few Na–K–HCO3–Cl water types. The dominance of Ca–Mg–HCO3 geochemical facies suggests that rock weathering primarily controls the area’s groundwater chemistry.
Figure 4
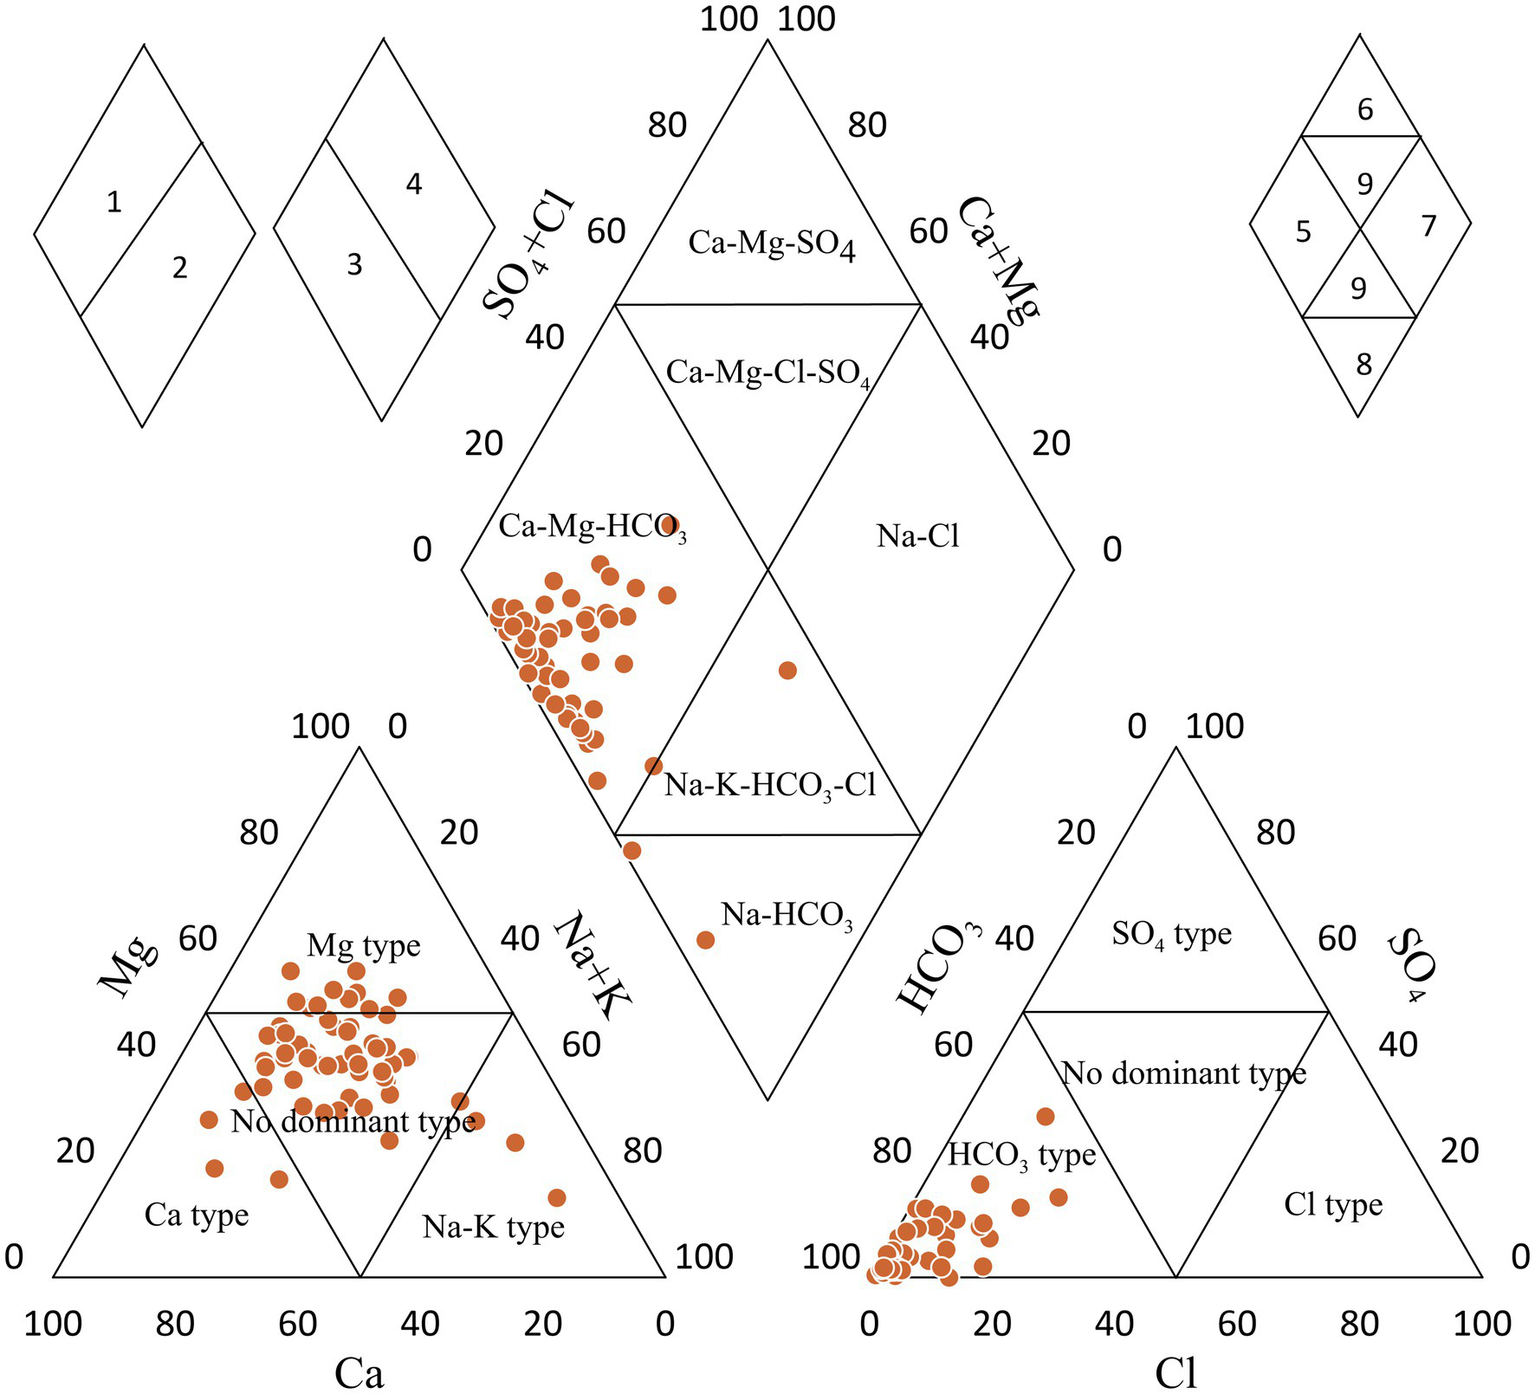
Piper diagram of hydrochemical parameters in the groundwater.
4.5 Correlation analysis of major ions
Table 2 presents the calculated correlation coefficients among 13 water quality parameters. TDS was very strongly associated with HCO3− (0.81), strongly associated with Na+ (0.70) and Mg2+ (0.66), and moderately correlated with Cl− (0.57), and SO42− (0.47). TH was very strongly associated with Mg2+ (0.89) and moderately associated with Ca2+ (0.45) and Cl− (0.46), suggesting that the dominating factor for TH is Mg2+ ions, with contributions from Ca2+ ions and Cl− ions. The moderate correlation with Na+ and HCO3− (0.45) indicates their contribution from the same process, possibly due to silicate weathering (Rogers, 1989). The strong correlation with Cl− and SO42− (0.66) indicates that Cl− and SO42− ions were partially or entirely derived from anthropogenic sources (Bakshe et al., 2024).
Table 2
| pH | EC | TDS | F− | Cl− | HCO3− | SO42− | NO3− | TH | Ca2+ | Mg2+ | Na+ | K+ | |
|---|---|---|---|---|---|---|---|---|---|---|---|---|---|
| pH | 1 | ||||||||||||
| EC | −0.05 | 1 | |||||||||||
| TDS | −0.33 | 0.89 | 1 | ||||||||||
| F− | 0.18 | −0.09 | 0.03 | 1 | |||||||||
| Cl− | −0.39 | 0.75 | 0.57 | −0.13 | 1 | ||||||||
| HCO3− | −0.22 | 0.59 | 0.81 | 0.02 | 0.08 | 1 | |||||||
| SO42− | −0.12 | 0.56 | 0.47 | −0.01 | 0.66 | −0.06 | 1 | ||||||
| NO3− | −0.33 | 0.42 | 0.31 | 0.24 | 0.42 | 0.05 | 0.25 | 1 | |||||
| TH | −0.57 | 0.56 | 0.53 | 0.06 | 0.46 | 0.40 | 0.21 | 0.53 | 1 | ||||
| Ca2+ | −0.16 | −0.16 | −0.13 | −0.03 | −0.02 | −0.14 | −0.08 | 0.29 | 0.45 | 1 | |||
| Mg2+ | −0.56 | 0.71 | 0.66 | 0.08 | 0.53 | 0.52 | 0.28 | 0.45 | 0.89 | 0.00 | 1 | ||
| Na+ | 0.01 | 0.62 | 0.70 | 0.04 | 0.44 | 0.45 | 0.49 | −0.01 | −0.15 | −0.50 | 0.09 | 1 | |
| K+ | −0.04 | 0.26 | 0.26 | 0.04 | 0.29 | 0.15 | 0.20 | 0.12 | 0.25 | −0.02 | 0.29 | 0.04 | 1 |
Pearson correlation coefficient of analysed physico-chemical parameters in the groundwater samples (n = 58).
All units are in mg/L, except pH (unitless), EC (μS/cm) and Turbidity (NTU). Correlation is significant at the p = 0.05 level (2-tailed).
4.6 Principal component analysis (PCA) of major ions
The principal component loadings and the percent of variance explained by each component are shown in Table 3. PC I has a strong loading of HCO3− (0.93), Mg2+ (0.77), TDS (0.83) and EC (0.72), which suggests that HCO3− and Mg2+ have a similar source/process (Vesković et al., 2024). PC II has a strong positive loading of SO42− (0.89) and Cl− (0.88) with weak loading of NO3− (0.47), indicating the infiltration of irrigation return flow and wastewater discharge (Elumalai et al., 2020; Nethononda et al., 2019). PC II also suggests a long evaporation history (Qu et al., 2024). SO42− and Cl− also signified the presence of anthropogenic sources (agricultural and domestic) for groundwater contamination (Cao et al., 2022). PCIII has a loading of Ca2+ (0.77) and TH (0.67), indicate that Ca2+ contribution to TH. PC III also suggest that the possible calcium-sodium ion exchange process in the study area. PC IV had a strong loading on F− (0.92), indicating that the dissolution of fluoride-rich minerals (which escalated in alkaline conditions) and the use of phosphatic fertilisers can be potential factors for F− in the groundwater (Kom et al., 2023; Shaji et al., 2024).
Table 3
| Parameters | Component | |||
|---|---|---|---|---|
| PC I | PC II | PC III | PC IV | |
| pH | −0.49 | −0.24 | −0.45 | 0.38 |
| EC | 0.72 | 0.64 | −0.08 | −0.10 |
| TDS | 0.83 | 0.45 | −0.21 | 0.07 |
| F− | 0.01 | −0.03 | 0.00 | 0.92 |
| Cl− | 0.26 | 0.88 | 0.08 | −0.14 |
| HCO3− | 0.93 | −0.14 | −0.23 | 0.06 |
| SO42− | 0.01 | 0.89 | −0.14 | 0.01 |
| NO3− | 0.21 | 0.47 | 0.51 | 0.35 |
| TH | 0.64 | 0.27 | 0.67 | 0.07 |
| Ca2+ | −0.09 | −0.05 | 0.77 | −0.01 |
| Mg2+ | 0.77 | 0.33 | 0.35 | 0.08 |
| Na+ | 0.36 | 0.47 | −0.73 | 0.03 |
| K+ | 0.18 | 0.31 | 0.07 | 0.22 |
| Eigenvalues | 3.60 | 2.99 | 2.29 | 1.22 |
| Total Variance (%) | 27.72 | 22.96 | 17.67 | 9.39 |
| Cumulative Variance (%) | 27.72 | 50.68 | 68.35 | 77.74 |
Principal component analysis of analysed physico-chemical parameters in the groundwater samples (n = 58).
Rotation method: varimax with Kaiser normalisation. All units are in mg/L, except pH (unitless), and EC (μS/cm).
4.7 Mechanisms controlling groundwater chemistry
The chemical composition and solute acquisition processes of groundwater are controlled by inputs from weathering, ion exchange, meteoric inputs, adsorption/desorption, and anthropogenic sources (Xiao et al., 2012; Tiwari and Singh, 2014). The relationship between the dissolved ions can reveal the origin of solutes and the processes that yield the observed composition of water (Kumar et al., 2008). For example, the relationship between Na+ and Cl− helps to reveal the mechanism for procuring water salinity in dry regions and quantifying the atmospheric influence (Sarin et al., 1989). Theoretically, the molar Na+/ Cl− ratio dissolution of halite is equal to one, and if the ratio is greater than 1, it usually indicates silicate weathering (Meybeck, 1987). About 56 groundwater samples have a Na+/Cl− ratio greater than 1, indicating the weathering of silicate minerals and anthropogenic sources (Meybeck, 1987; Tiwari and Singh, 2014). Only two groundwater samples had a Na+/Cl− ratio of less than 1, possibly due to the exchange of Na+ for Ca2+ and Mg2+ from clay (Meybeck, 1987; Tiwari and Singh, 2014). Sodium is the most dominant cation, and bicarbonate is the most dominant anion in the groundwater samples of the study area, indicating that silicate weathering is the possible source of sodium (Rogers, 1989). It is probably due to the reaction of feldspar minerals with carbonic acid (H2CO3) in the presence of water, which releases the bicarbonate (Rajmohan and Elango, 2004).
Gibbs diagram is widely used to identify influencing factors of dissolved chemical constituents such as rock-weathering, evaporation or precipitation (Gibbs, 1970). It uses the ratio of Na+/(Na+ + Ca2+) and Cl−/(Cl− + HCO3−) as a function of TDS. The Gibbs diagram indicates the dominance of rock weathering with a minute influence from evaporation (Figure 5). Hence, water-rock interactions were the predominant natural process in determining groundwater hydrogeochemistry.
Figure 5
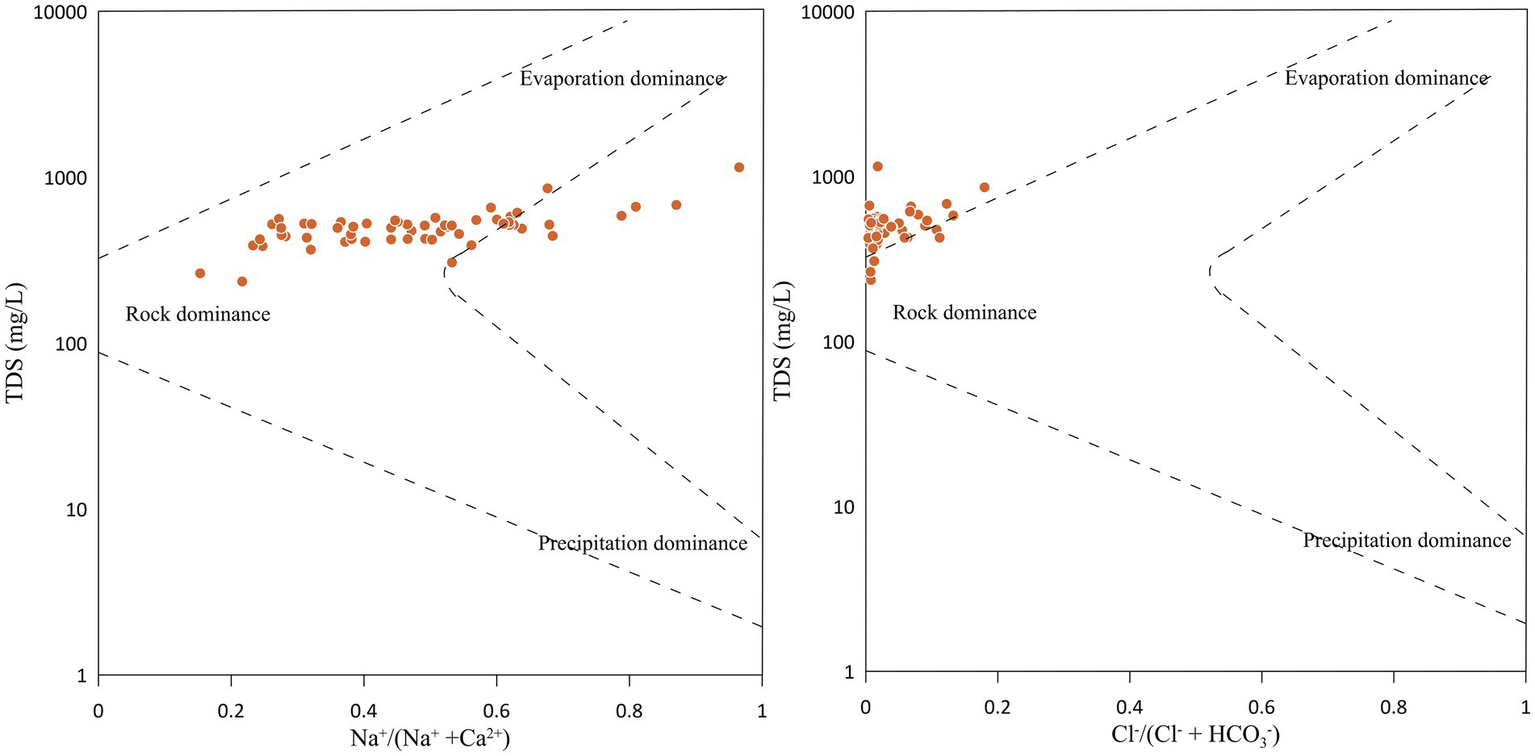
Gibbs diagram of hydrochemical parameters in the groundwater.
The 1:1 scatter plot between different ions is an important tool for identifying the sources of groundwater chemistry. The scatter plot also determines the ion-exchange/reverse ion-exchange process (Fisher and Mullican, 1997). Generally, the weathering of silicate, carbonate and sulphide minerals and the dissolution of evaporites are the primary lithogenic sources of dissolved ions in groundwater (Singh et al., 2013b). The scatter plot between Ca2+ + Mg2+ versus HCO3− + SO42− suggests the dissolution of calcite, dolomite and gypsum when the samples fall close to 1:1 equiline (Cerling et al., 1989; Paul et al., 2019). Figure 6a shows that the majority of plotted points fell below the theoretical 1:1 equiline, showing the dominance of HCO3− + SO42− over the Ca2+ + Mg2+. It also indicates the contribution by non-carbonate sources and demands that the excess anions (HCO3− + SO42−) be balanced by Na+ + K+. Only two of the groundwater samples fell above the theoretical 1:1 equiline, indicating some extra sources of Ca2+ + Mg2+ cations. These extra Ca2+ + Mg2+ cations should be balanced by extra anions (Cl− and NO3−). The 1:1 scatter plot between Ca2+ + Mg2+ and HCO3− may be crucial for identifying carbonate minerals dissolution if the plotted points are close to the theoretical 1:1 equiline (Figure 6b). The plot showed that 85% of the groundwater samples fell below the equiline, indicating that the excess of HCO3− should be balanced by Na+ + K+. The balancing Na+ + K+ is provided by the weathering of Na–K silicate minerals. In 15% of samples, excess Ca2+ + Mg2+ should be balanced by SO42− + Cl−. Figure 6c is plotted between Na+ + K+ and TZ+ and shows that groundwater samples fell below the equiline, indicating that cations are contributed in a higher ratio via silicate weathering (Stallard and Edmond, 1983). Also, Na+ and K+ showed a better correlation with TZ+, suggesting that calcite and gypsum were not major contributors due to the dominance of silicate weathering in aquifer media (Nasher and Ahmed, 2021). The 1:1 scatter plot between HCO3− and SO42− + Cl− shows that HCO3− dominated the anion chemistry (Figure 6d). The abundance of HCO3− in the groundwater explains the silicate weathering in the area (Rogers, 1989). When feldspar minerals react with carbonic acid in the water, they release bicarbonate ions (Lakshmanan et al., 2003) as shown in equation 18 below.
Figure 6
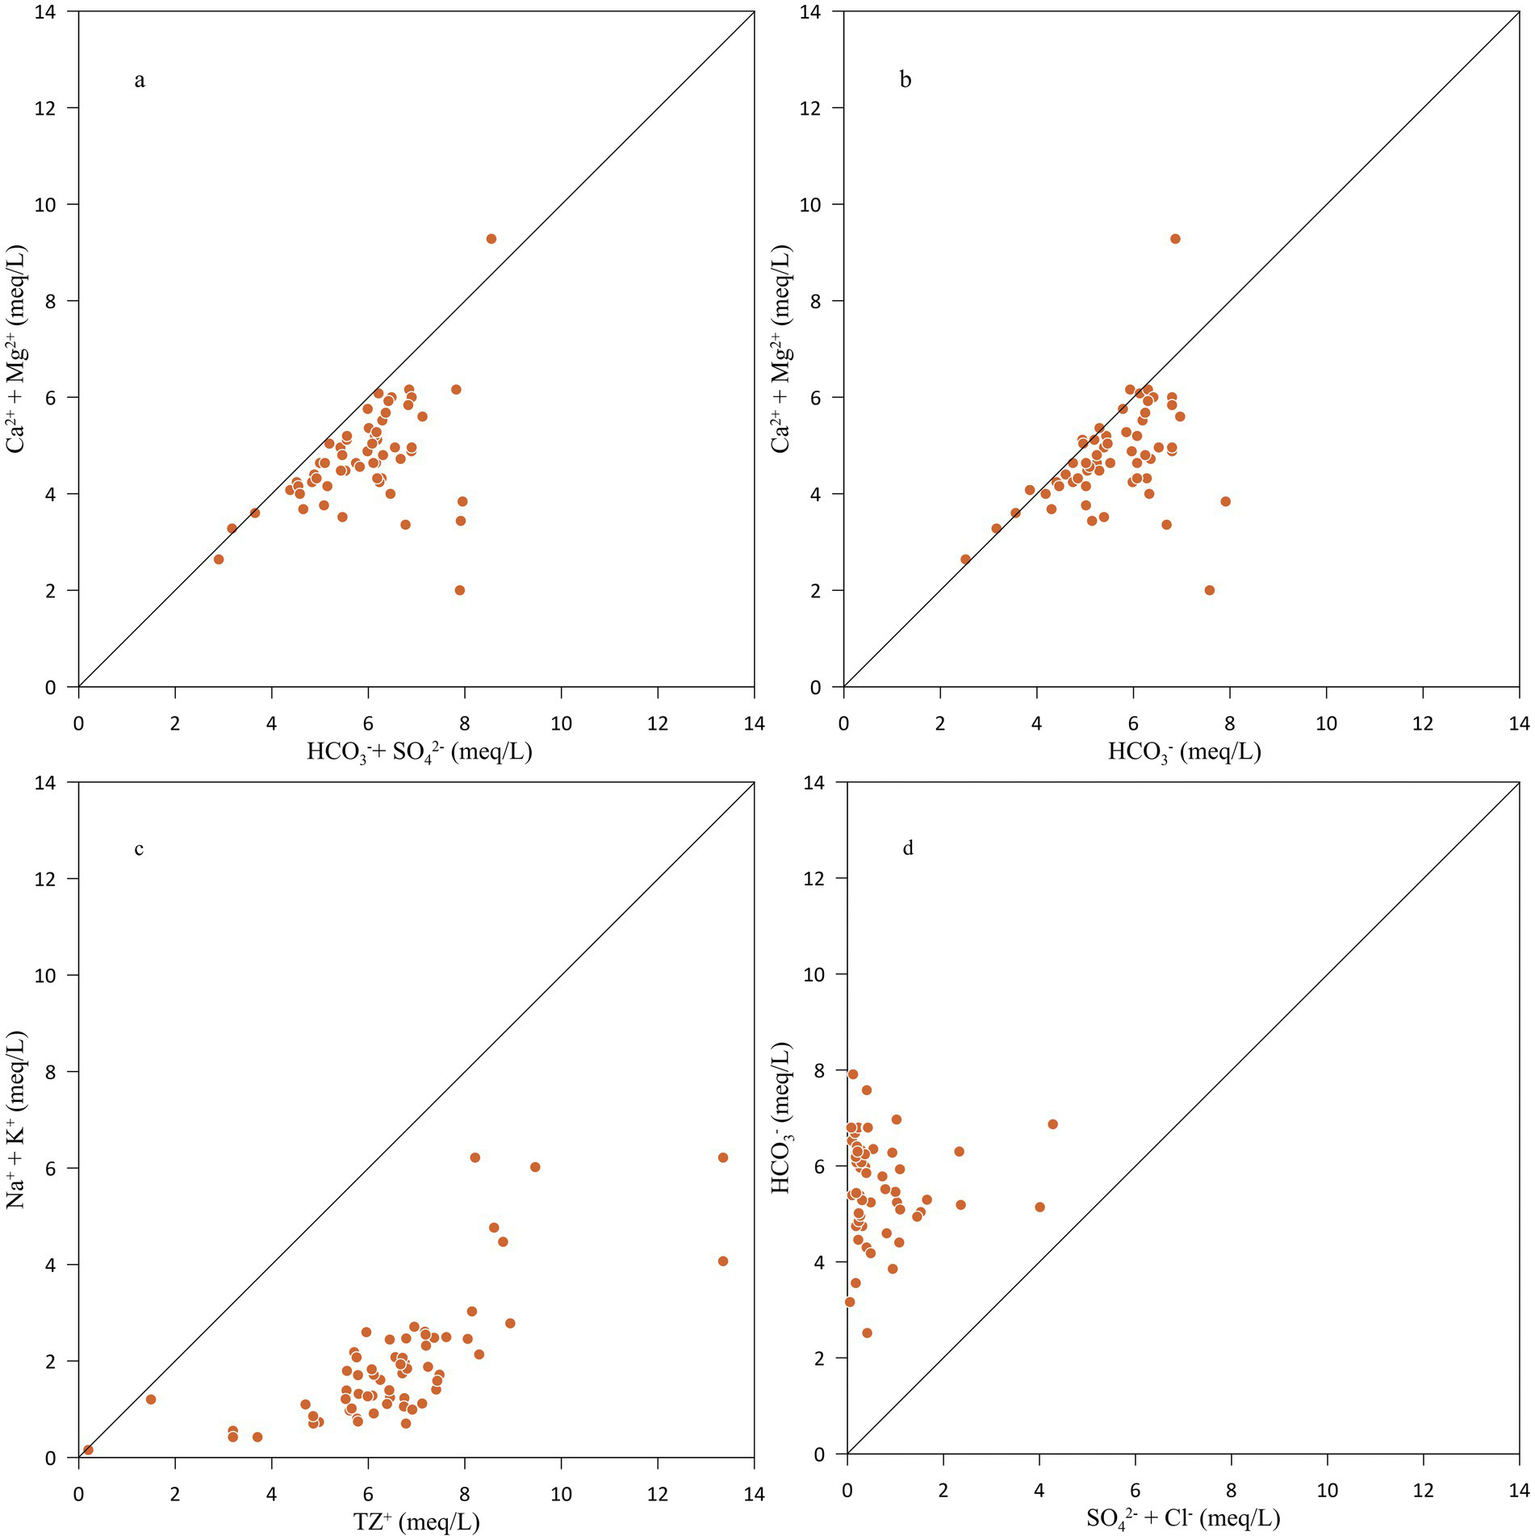
Scatter plots between (a) Ca2+ + Mg2+ vs. HCO3− + SO42−, (b) Ca2+ + Mg2+ vs. HCO3−, (c) Na+ + K+ vs. TZ+, and (d) HCO3− vs. Cl− + SO42−.
Furthermore, a molar ratio (Na+ + K+)/TZ+ is 0.28, and the (Ca2+ + Mg2+)/(Na+ + K+) ratio is 3.31, indicating that groundwater chemistry was largely controlled by silicate weathering, followed by the contribution from carbonate mineral dissolution. The bivariate plot of Mg2+/Na+ versus Ca2+/Na+ and HCO3−/Na+ versus Ca2+/Na+. Figure 7 suggests that the chemical composition of groundwater is primarily controlled by the weathering and dissolution of silicate and carbonate minerals (Gaillardet et al., 1999). The sand fraction of the Ganga Plain sediments mainly comprises quartz, muscovite, biotite, plagioclase, and orthoclase (Tripathi et al., 2006; Yadav et al., 2024; Srivastava et al., 2025). Examples of the reaction of silicate weathering are:
Figure 7
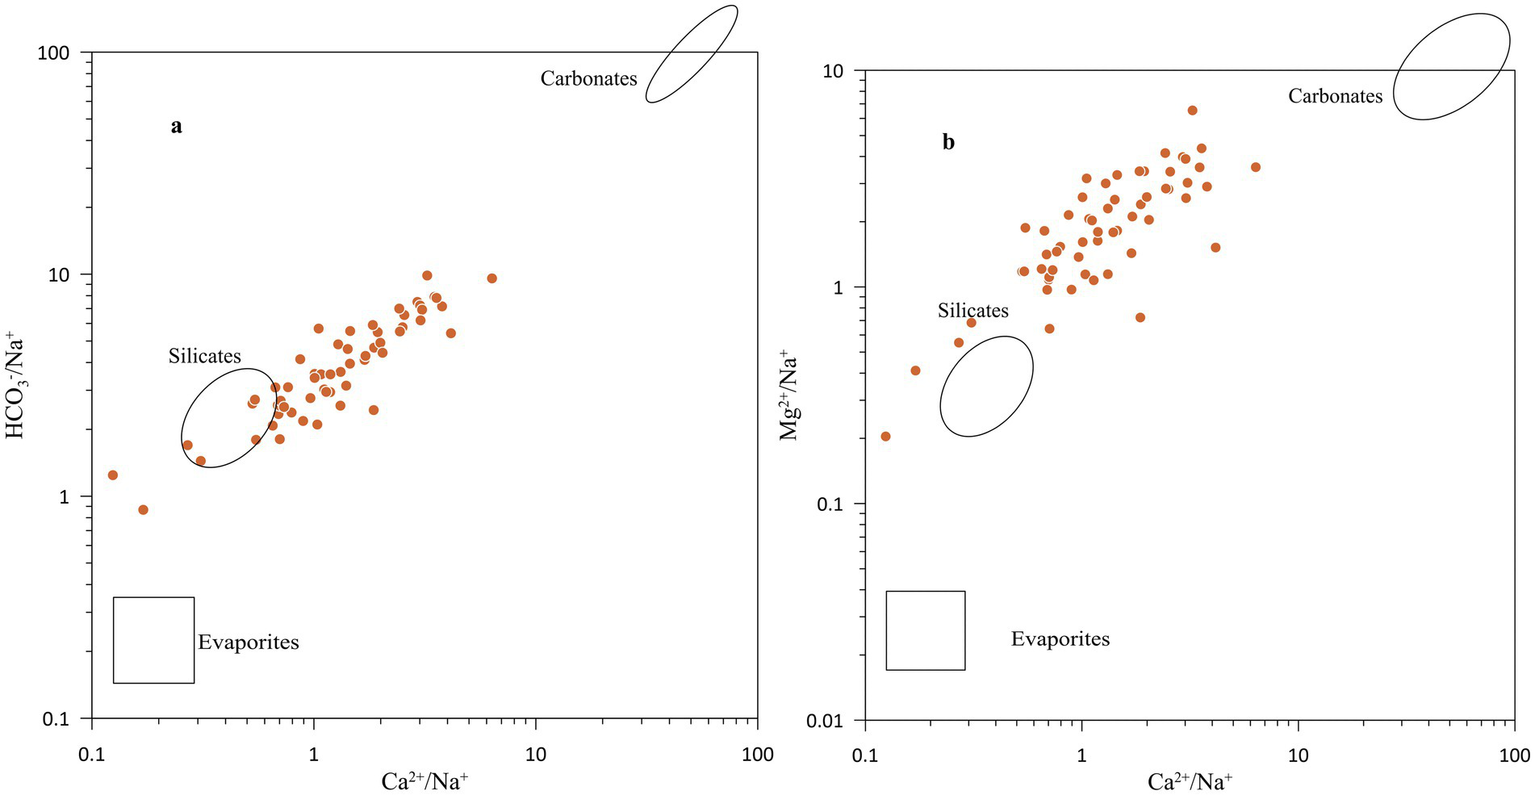
Bivariate plot of HCO3−/Na+ versus Ca2+/Na+, and Mg2+/Na+ versus Ca2+/Na+.
4.8 Chloro-alkaline indices (CAI)
The values of CAI-1 and CAI-2 are either negative or positive, depending on whether Na+ and K+ are exchanged/reverse-exchanged for Ca2+ and Mg2+ from the host environment (Singh et al., 2018). The value will be positive if Na+ and K+ in water replace Ca2+ and Mg2+ of the aquifer material, indicating reverse ion exchange (Rao et al., 2012; Srinivasamoorthy et al., 2013). The value will be negative, indicating chloroalkaline disequilibrium and the reaction as a cation-anion exchange reaction. The negative value also suggests that host rocks are groundwater’s primary source of dissolved ions (Srinivasamoorthy et al., 2013; Mohamed et al., 2022). The Schoeller indices of the samples were calculated, and it was found that CAI-1 and CAI-2 varied from −68.8 to −0.27 with an average value of −12.09 and −0.78 to −0.05 with an average value of −0.26, respectively (Supplementary Table S1). The negative values CAI-1 and CAI-2 signify the chloro-alkaline disequilibrium or cation-anion exchange reaction in the study area.
The evidence for cation exchange can be verified by plotting the geochemical data on a bivariate plot between Ca2+ + Mg2+ − HCO3− − SO42− (meq/L) and Na+ + K+ − Cl− (meq/L). The axis Ca2+ + Mg2+ − HCO3− − SO42− represents the amount of Ca2+ + Mg2+ gained or lost relative to that provided by minerals such as calcite, dolomite and gypsum. The axis Na+ + K+ − Cl− represents the amount of Na+ and K+ gained or lost relative to that provided by Cl− salts. The relationship between Ca2+ + Mg2+ − HCO3− − SO42− (meq/L) and Na+ + K+ − Cl− (meq/L) should be linear with a slope of ‘−1’ when the geochemical process of groundwater is dominated by cation exchange (Fisher and Mullican, 1997; McLean et al., 2000). Figure 8 shows that the Sultanpur district groundwater plotted points are close to a straight line (with R2 = 0.78) with a slope of −0.93, suggesting the ion exchange reactions (García et al., 2001).
Figure 8
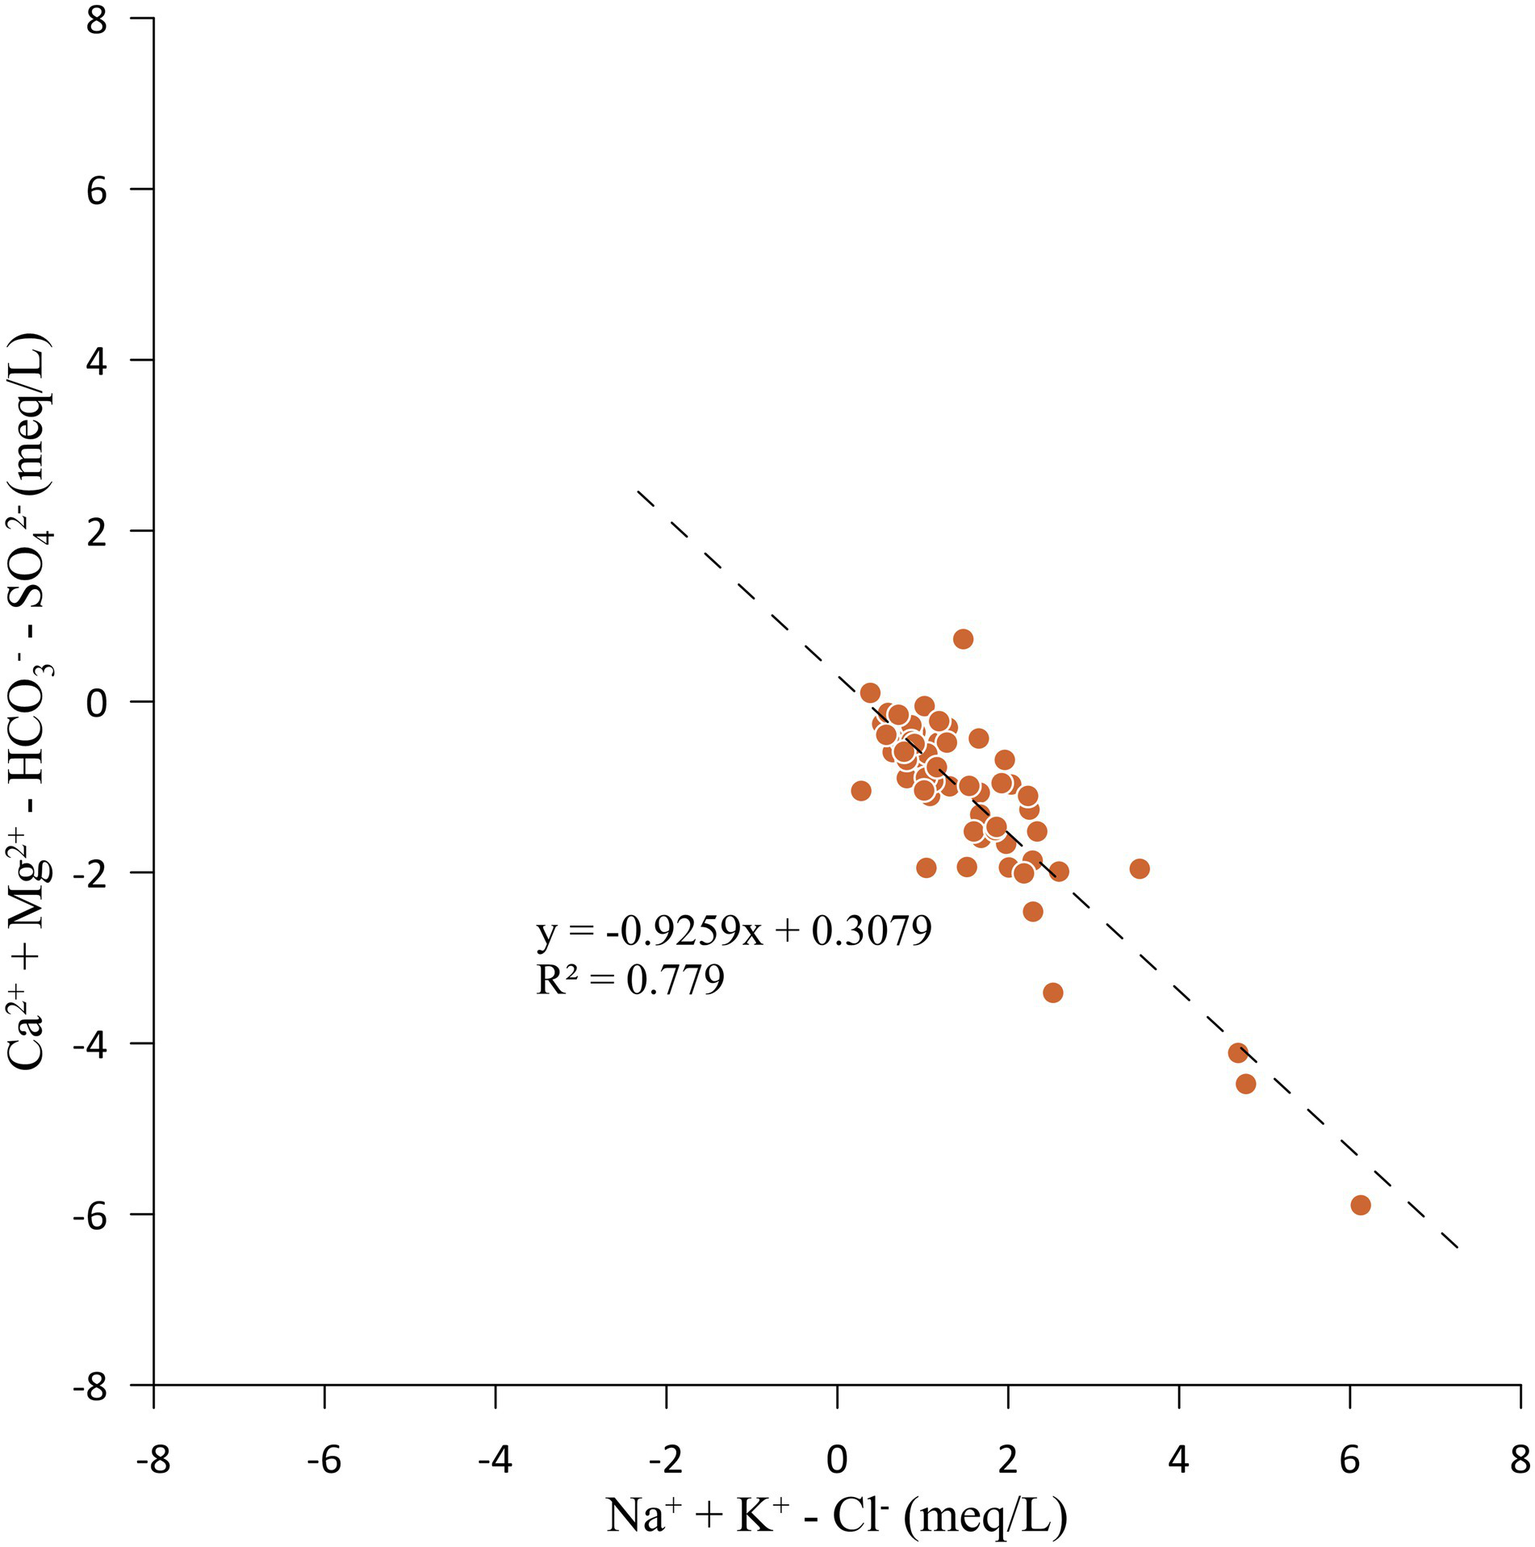
Bivariate plot between Ca2+ + Mg2+ − HCO3− − SO42− (meq/L) and Na+ + K+ − Cl− (meq/L).
4.9 Distribution of metals
The result of the trace elements (Al, Cr, Mn, Fe, Ni, Cu, Zn, As, Se, Sr, Cd, and Pb) analysis in the groundwater samples of the Sultanpur district is provided in Table 1. The Ni, Cr, Cu, Zn, As, Se, Cd, and Sr concentrations did not exceed the acceptable limits of the BIS (2012) (for Sr, USEPA drinking water regulation was used). In contrast, Al, Mn, Fe, and Pb concentrations were higher in some samples and exceeded BIS’s acceptable drinking water limit (BIS, 2012) (Table 1). Al concentration varied from BDL (detection limit, 0.001 μg/L) to 85.7 μg/L, exceeding the acceptable limit (30 μg/L) at two sites (GW-14, GW-39). Fe concentration varied from 10.2 μg/L to 5674 μg/L (Figure 9). The spatial variation map also shows that 4 locations (GW-5, GW-16, GW-27, and GW-37) in the district have very high Fe contamination (Figure 9). About 28% of the samples exceeded the acceptable iron limit (300 μg/L). Mn concentrations varied from 2.0 μg/L to 486 μg/L, and exceeded the acceptable limit (100 μg/L) in 17% of the samples (Figure 10). The principal component loading of trace elements is shown in Table 4. The table shows that PC I have a strong loading to Cd (0.85), Pb (0.82), and Cu (0.75), and a moderate loading to Al (0.68) and Cr (0.67), explaining about 26.5 percent of the variance. The source of these elements may be geogenic. PC II has strong loading to Fe (0.90) and Mn (0.86) with moderate loading to Cr (0.54), indicating the local host rock may be responsible for Fe and Mn in groundwater samples (Table 4). Geogenic processes that often contribute Fe and Mn in groundwater in the alluvial plains involve the weathering of iron and manganese-bearing rocks and minerals (Arshad and Umar, 2023). Organic matter-rich alluvial soil promotes microbial activities and thus creates reducing conditions that favour Fe and Mn dissolution in groundwater (Weng et al., 2007). Furthermore, the formation of ferromanganese nodules is an important soil-forming process in the Ganga alluvium (Srivastava et al., 2025). Prolonged dry spells and monsoonal wet seasons contribute to the weathering and redistribution of elements. Upper horizons typically lack mottling and gleying, indicating limited waterlogging, while lower horizons show such features, suggesting waterlogging that aids the mobilisation and precipitation of Fe and Mn. The alluvial sediments demonstrate moderate chemical weathering, breaking down aluminosilicate minerals to release essential elements for the nodule formation (Kumar et al., 2024). Additionally, chromium and other elements were also mobilised and concentrated in these nodules. PC III has a moderate loading to Zn (0.72) and Ni (0.53), indicating possible anthropogenic sources for both trace elements (Table 4). Ni in the groundwater could be due to vehicular emissions, landfill pollution and waste discharge. Agricultural activities could be a major source of Zn in the groundwater. PC IV has a strong loading to As (0.76) (Table 4), indicating the geogenic processes may be a possible source of it.
Figure 9
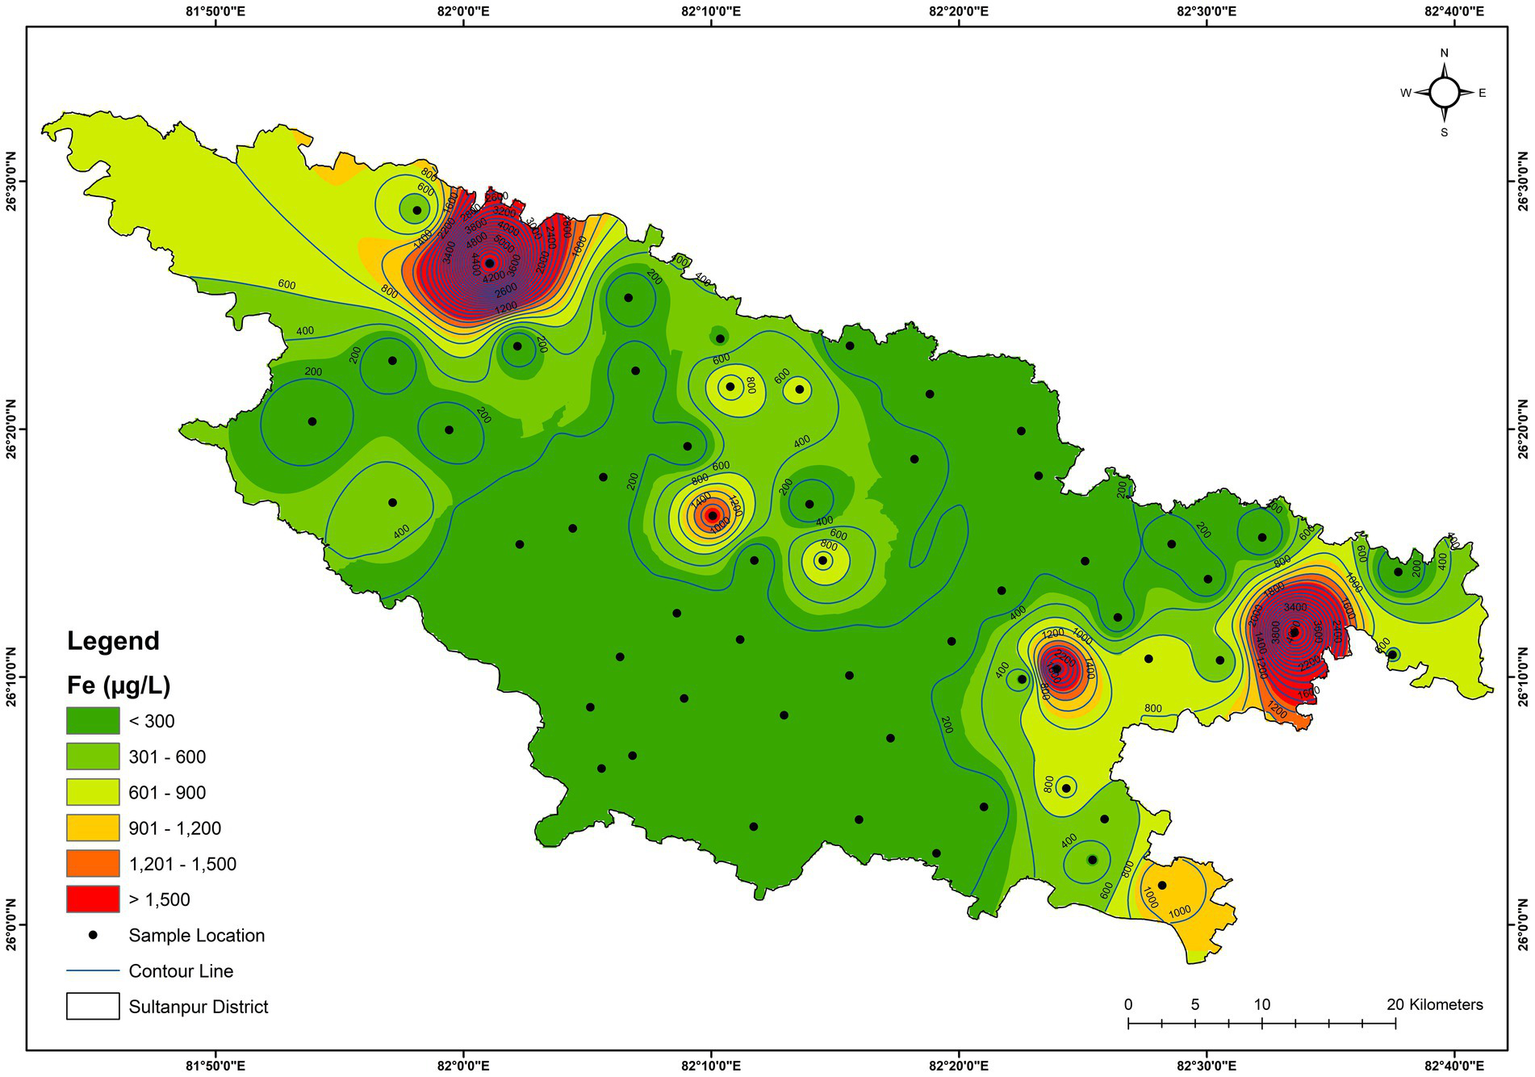
Spatial distribution of iron in the groundwater.
Figure 10
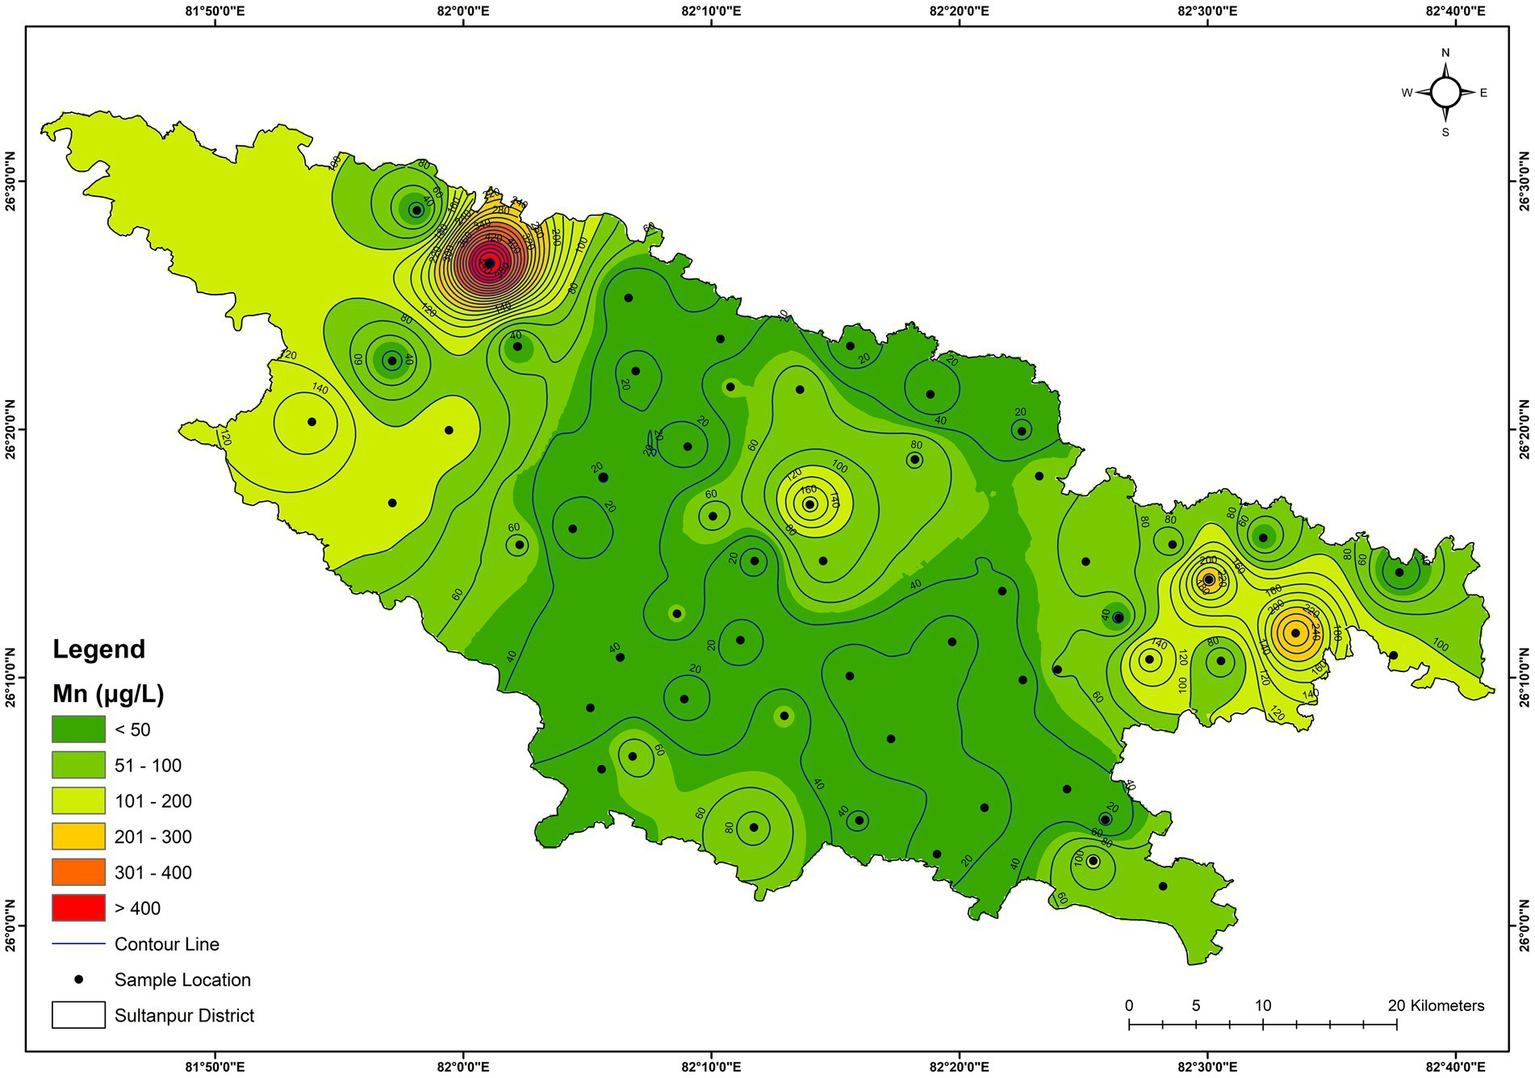
Spatial distribution of manganese in the groundwater.
Table 4
| Trace element (μg/L) | Principal component | |||
|---|---|---|---|---|
| PC I | PC II | PC III | PC IV | |
| Al | 0.68 | 0.16 | −0.01 | −0.09 |
| Cr | 0.67 | 0.54 | 0.02 | −0.01 |
| Mn | 0.06 | 0.86 | 0.17 | 0.05 |
| Fe | 0.29 | 0.90 | 0.11 | 0.01 |
| Ni | 0.03 | 0.23 | 0.53 | −0.01 |
| Cu | 0.75 | 0.34 | −0.08 | 0.33 |
| Zn | 0.41 | −0.22 | 0.72 | −0.14 |
| As | 0.17 | −0.01 | −0.04 | 0.76 |
| Se | 0.09 | −0.14 | −0.67 | −0.27 |
| Sr | 0.06 | −0.04 | −0.14 | −0.71 |
| Cd | 0.85 | 0.06 | 0.14 | 0.01 |
| Pb | 0.82 | −0.03 | 0.12 | 0.10 |
| Eigen Value | 3.17 | 2.11 | 1.35 | 1.30 |
| % of Variance | 26.45 | 11.54 | 11.26 | 10.84 |
| Cumulative % | 26.45 | 43.99 | 55.25 | 66.10 |
Principal component analysis of dissolved metals in the groundwater samples (n = 58).
Rotation Method: Varimax with Kaiser Normalisation.
4.10 Water quality assessment
The analysed data is compared with the BIS (2012) drinking water recommendations to determine their suitability for drinking purposes (Table 1). The data is also compared with several ratios/indices to check their suitability for irrigation purposes.
The pH of the Sultanpur district groundwater samples (7.53–8.22) was well within the safe limit (6.5–8.5) prescribed for drinking purposes. Turbidity is a crucial physical water parameter that depends on the presence of suspended solids in water. Drinking turbid water (exceeding acceptable limits) can cause diseases associated with gastrointestinal illness (Mann et al., 2007). Turbidity of the groundwater was found between 0.01 NTU and 69.2 NTU. Around 50% of the water samples exceeded the acceptable limit (1 NTU) as prescribed by BIS (2012). TDS in the district varied from 235 mg/L to 859 mg/L, and 53% of the samples exceeded the acceptable limit (500 mg/L) (Table 1). Based on total hardness (TH) values, water is classified as soft (0–75 mg/L as CaCO3), moderately hard (75–150 mg/L as CaCO3), hard (150–300 mg/L as CaCO3) and very hard (>300 mg/L as CaCO3) (Sawyer and McCarty, 1967). The TH of the groundwater of the study area varied from 100 mg/L to 464 mg/L, and 81% of samples exceeded the BIS acceptable limit of 200 mg/L. Fluoride prevents tooth decay and strengthens tooth enamel when taken at the prescribed level. According to the WHO, the minimum requirement of F− in water is 0.5 mg/L. However, excess fluoride can cause serious health issues, including dental fluorosis, skeletal fluorosis, osteoporosis, arthritis, and bone damage (Solanki et al., 2022). F− concentration varied from 0.26 mg/L to 1.71 mg/L. In about 5% of the groundwater samples, F− concentration exceeded the BIS acceptable limit of 1.0 mg/L (Table 1). Nitrate, chloride and sulphate concentrations were within the acceptable limit of 45 mg/L, 250 mg/L, and 200 mg/L, respectively, in all the groundwater samples (Table 1).
Excess sodium consumption can raise blood pressure issues (Scheelbeek et al., 2016). The concentration of Na+ varied from 7.6 mg/L to 140 mg/L (Table 1). Ca2+ and Mg2+ are essential ions for bone health, cell development, muscle function and heart regulation (Baker and Worthley, 2002; Fouhy et al., 2023). However, excess intake of calcium and magnesium may cause nausea, kidney stones, risk of heart disease, low blood pressure, and difficulty in breathing (Anderson and Klemmer, 2013; Fouhy et al., 2023). The concentration of Ca2+ was well within the BIS acceptable limit of 75 mg/L. However, the concentration of Mg2+ exceeded the BIS acceptable limit of 30 mg/L in 69% of the groundwater samples of the study area (Table 1).
Fe is essential in various metabolic processes, including immune response, oxygen transport and energy production (McDowell et al., 2024). However, excess intake may cause liver cancer, hemochromatosis, diabetes, heart disease, organ damage, joint pain, hemosiderosis and infertility (Rahman et al., 2024; Chaturvedi et al., 2014). About 28% of samples exceeded the drinking water limit prescribed by the BIS (2012) (Table 1). Mn is another trace element that exceeded the prescribed BIS (2012) limit in about 17% of samples in the district. Excess intake of Mn can cause serious health risks, including neurotoxicity (conditions like manganism, a disease similar to Parkinson’s disease) and anaemia (Baj et al., 2023; Shaffer et al., 2023). Lead is a poisonous element that affects almost every part of the human body, especially the renal, reproductive, and nervous systems (Wani et al., 2015). Pb may also affect children’s brain and intellectual development (Mani et al., 2019). The lead concentration exceeded the drinking water limit at one location (GW-46) (Table 1).
WQI was calculated from the analysed parameters and varied from 35.9 to 106.5, with a mean value of 58.1 (Supplementary Table S1). Based on the WQI categorisation, groundwater is considered as ‘excellent’ (0–50), ‘good’ (50–100) and ‘poor’ (>100) (Vasanthavigar et al., 2010). As per this categorisation, 65% of samples belonged to ‘good’, 28% to ‘excellent’ and 7% to ‘poor’ category. The spatial distribution of WQI of the Sultanpur district is shown in Figure 11. Based on the spatial distribution of WQI, Mirdaspur, Jajjour, Bhatpura, and Shivgarh villages have poor water quality.
Figure 11
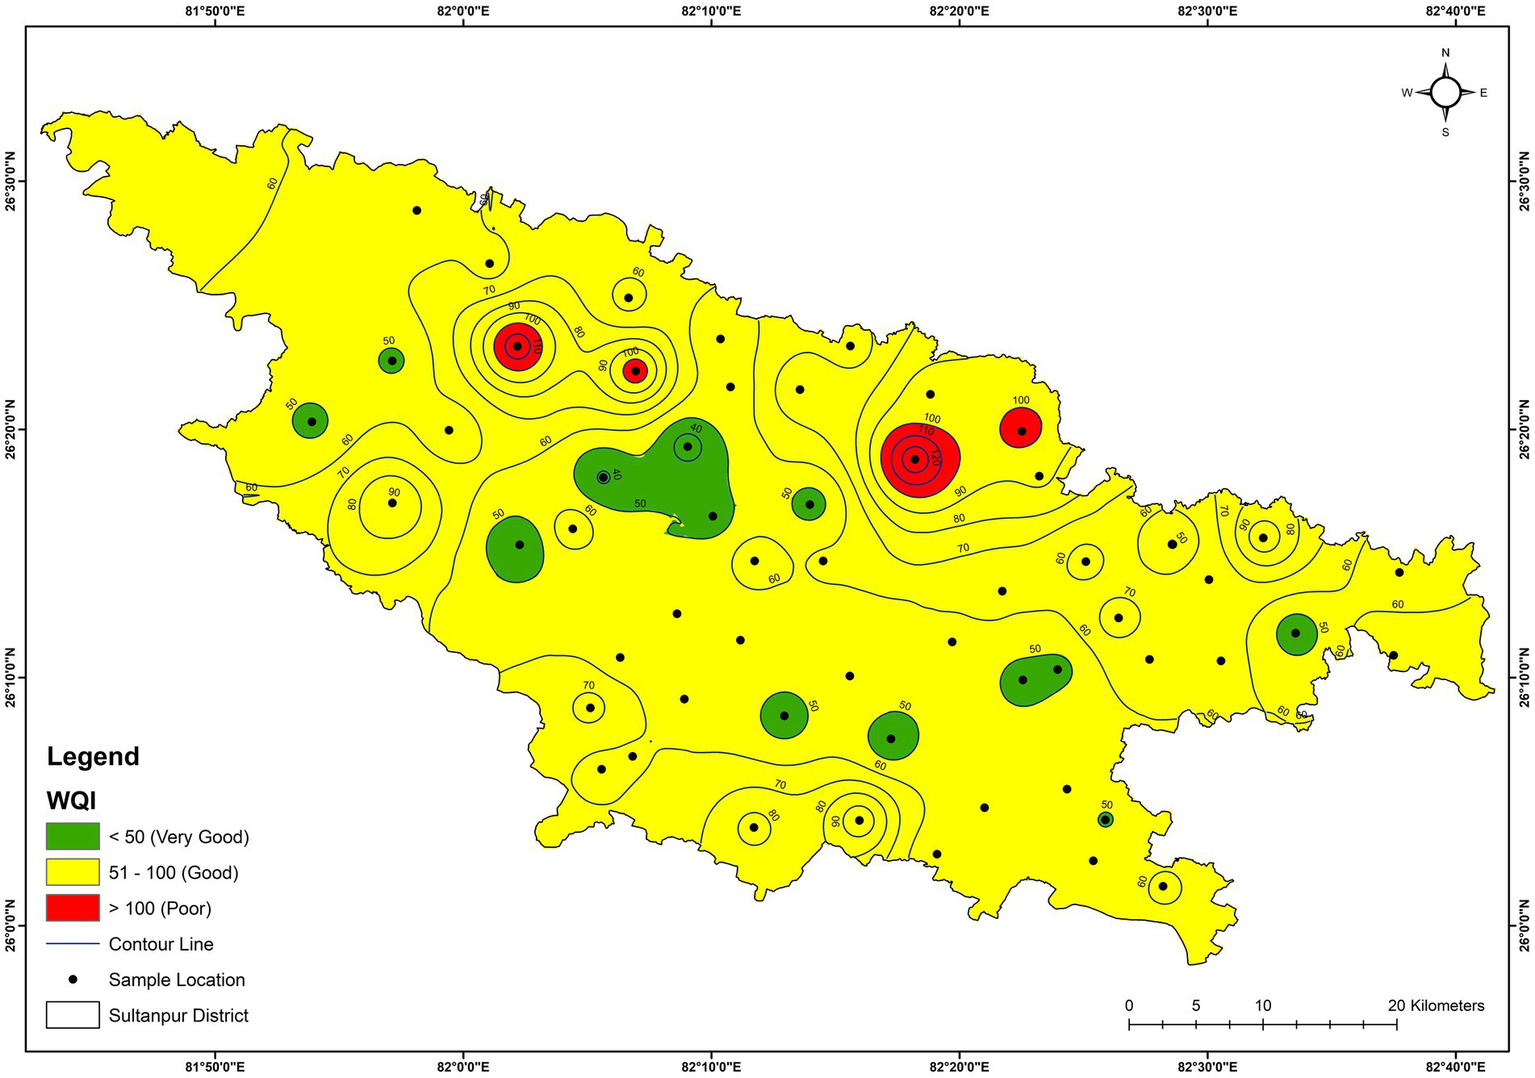
Spatial distribution of water quality index (WQI) of the groundwater.
4.11 Non-carcinogenic health risk assessment for adults and children
Health risk assessment for adults and children was also estimated due to the intake of trace elements via drinking water. Table 5 and Supplementary Table S1 present the calculated Hazard Quotient (HQ) and Hazard Index (HI) for adults and children of all the groundwater samples, respectively. Calculated HQ values varied from 0 to 2.38 with an average value of 0.075, and 0–1.49 with an average value of 0.049 for children and adults, respectively. The result shows that manganese and arsenic have the highest HQs, advocating that these two trace elements can be high-potential health risk pollutants. The calculated HI values ranged from 0.33 to 3.28 with an average value of 0.89, and 0.2–2.58 with an average value of 0.58 for children and adults, respectively (Supplementary Table S1). The calculated HIs for children have values exceeding 1 at 15 locations (around 26%) (GW-3, GW-4, GW-5, GW-6, GW-9, GW-17, GW-18, GW-25, GW-31, GW-35, GW-36, GW-38, GW-39, GW-44, and GW-45), suggesting a potential health risk to the children due to consuming drinking water at these locations (Supplementary Table S1 and Figure 12). However, for adults, the HIs value is greater than 1 at seven locations (around 12%) (GW-3, GW-4, GW-6, GW-17, GW-31, GW-39, and GW-45) (Supplementary Table S1 and Figure 13). Moreover, 3 samples (GW-1, GW-12, and GW-41) have HIs for children close to 1, and 3 samples (GW-9, GW-25, and GW-35) have HIs for adults close to 1, advocating that such samples were not suitable for direct consumption for children and adults, respectively. Hence, the calculated HI values for children and adults suggest that the groundwater needs appropriate treatment and management to protect human health at several locations in the study area.
Table 5
| Trace elements (μg/L) | RfD (μg/kg/day) | ADD | HQ | ||||||||||
|---|---|---|---|---|---|---|---|---|---|---|---|---|---|
| Children | Adults | Children | Adults | ||||||||||
| Min | Max | Mean | Min | Max | Mean | Min | Max | Mean | Min | Max | Mean | ||
| Al | 30 | 0.00 | 10.8 | 0.69 | 0.00 | 6.32 | 0.43 | 0.00 | 0.33 | 0.02 | 0.00 | 0.21 | 0.01 |
| Cr | 3.0 | 0.07 | 0.75 | 0.26 | 0.44 | 0.47 | 0.16 | 0.02 | 0.25 | 0.09 | 0.01 | 0.15 | 0.05 |
| Mn | 24 | 0.24 | 57.24 | 7.19 | 0.15 | 35.88 | 4.51 | 0.01 | 2.38 | 0.30 | 0.01 | 1.49 | 0.19 |
| Fe | 700 | 0.09 | 49.24 | 3.84 | 0.75 | 418.58 | 32.71 | 0.00 | 0.07 | 0.005 | 0.00 | 0.59 | 0.05 |
| Ni | 20 | 0.08 | 0.67 | 0.19 | 0.04 | 0.34 | 0.10 | 0.00 | 0.04 | 0.01 | 0.00 | 0.02 | 0.005 |
| Cu | 40 | 0.02 | 0.65 | 0.12 | 0.01 | 0.41 | 0.08 | 0.00 | 0.02 | 0.003 | 0.00 | 0.01 | 0.002 |
| Zn | 300 | 1.02 | 170.45 | 22.69 | 0.64 | 106.86 | 14.23 | 0.00 | 0.56 | 0.07 | 0.00 | 0.35 | 0.001 |
| As | 0.3 | 0.01 | 0.62 | 0.07 | 0.00 | 0.32 | 0.003 | 0.04 | 2.07 | 0.22 | 0.02 | 1.08 | 0.11 |
| Cd | 0.5 | 0.00 | 0.04 | 0.01 | 0.00 | 0.02 | 0.004 | 0.00 | 0.04 | 0.01 | 0.00 | 0.04 | 0.01 |
| Pb | 1.4 | 0.00 | 1.30 | 0.08 | 0.00 | 0.82 | 0.05 | 0.00 | 0.93 | 0.06 | 0.00 | 0.58 | 0.04 |
| Se | 5.0 | 0.00 | 0.77 | 0.13 | 0.00 | 0.48 | 0.08 | 0.00 | 0.51 | 0.03 | 0.00 | 0.10 | 0.02 |
| Sr | 600 | 10.41 | 113.22 | 50.15 | 6.52 | 70.98 | 31.44 | 0.01 | 0.18 | 0.08 | 0.01 | 0.12 | 0.05 |
Reference dose, average daily dose and hazard quotient of each trace element in the groundwater.
Figure 12
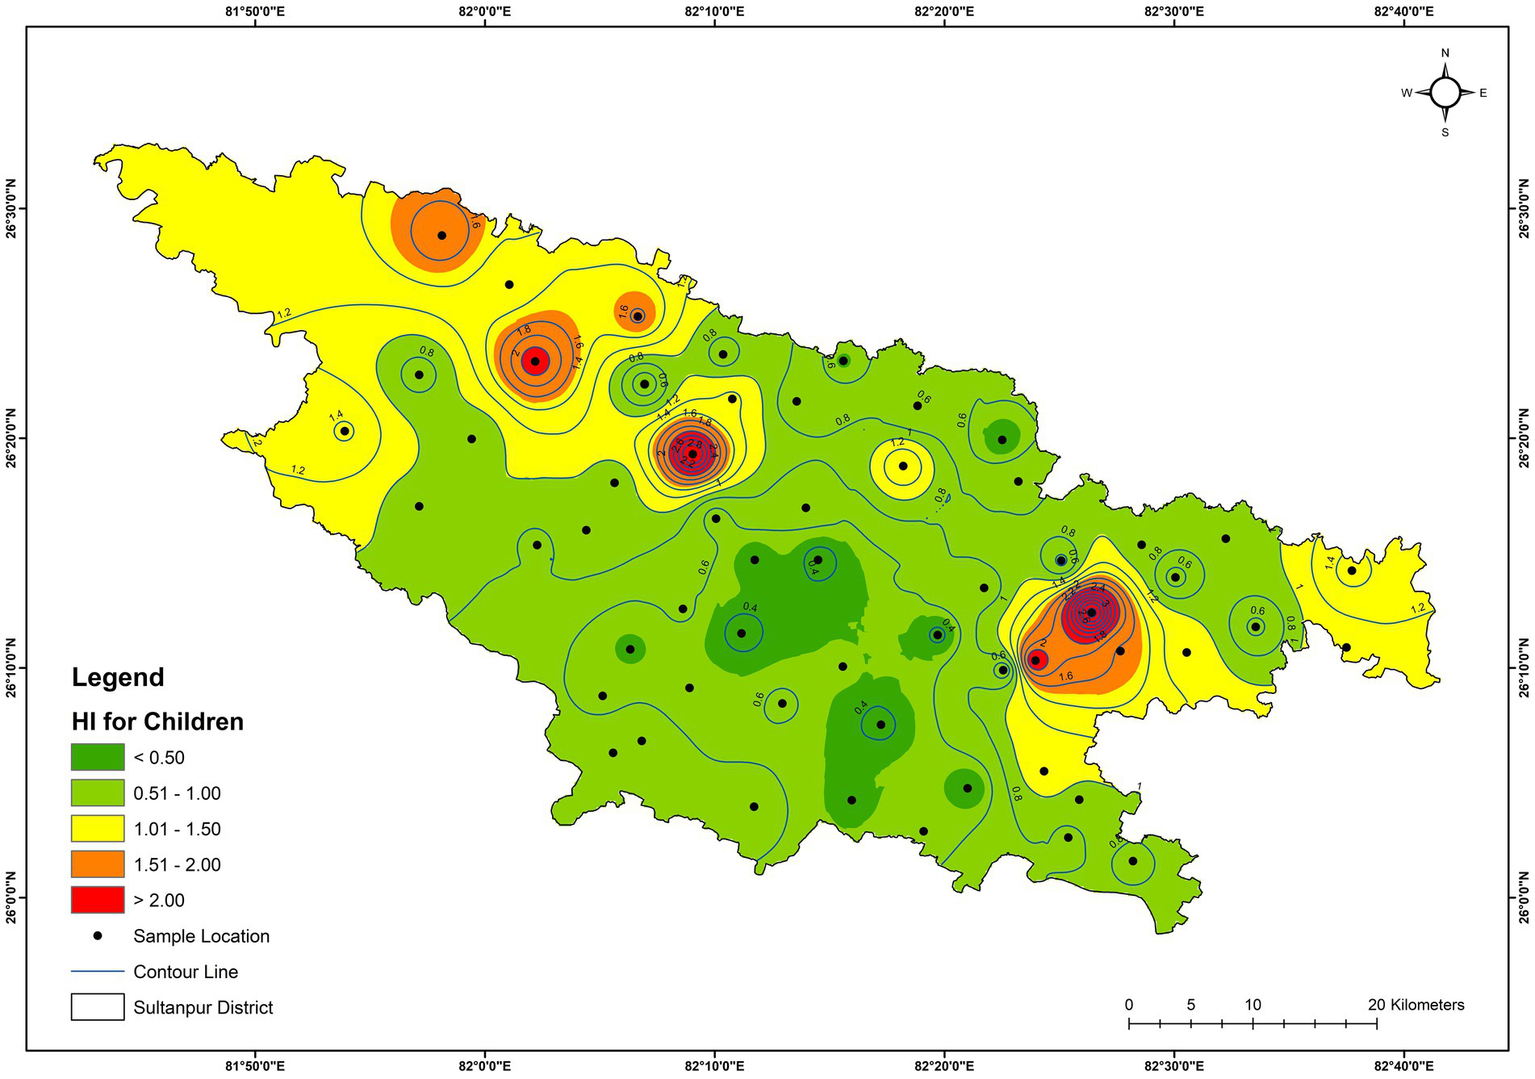
Spatial distribution of HI for children of the groundwater.
Figure 13
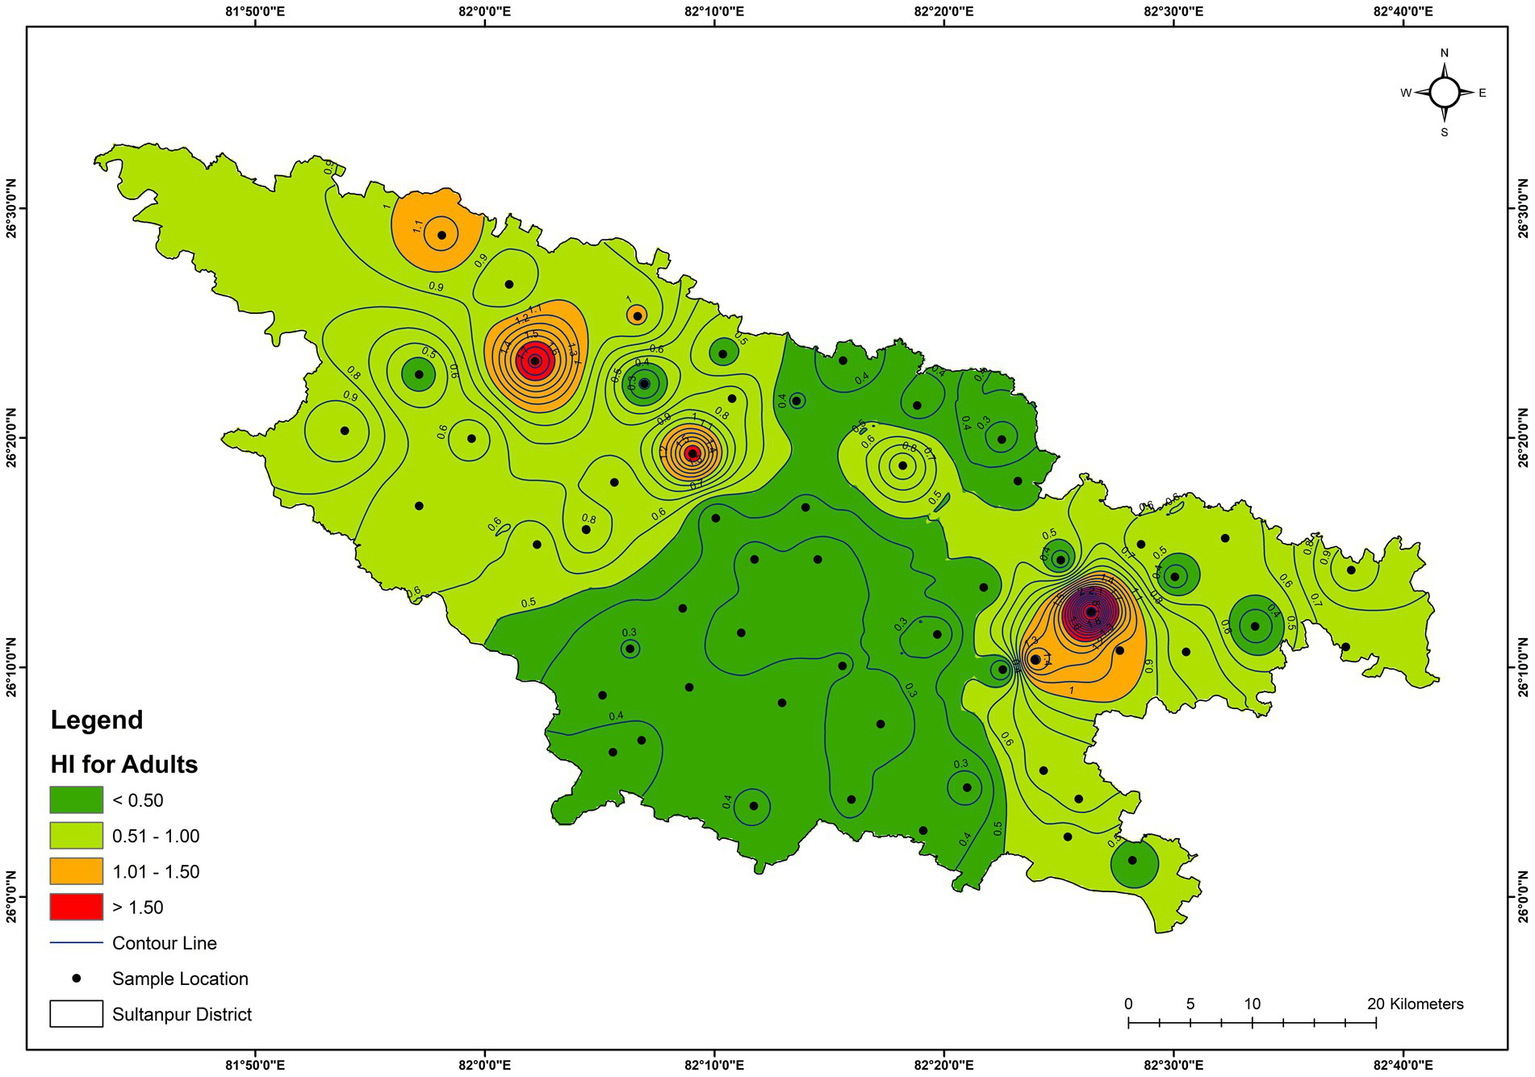
Spatial distribution of HI for adults of the groundwater.
4.12 Suitability for irrigation uses
Different classifications based on several water quality indices, such as %Na, RSC, SAR, KI, and MH, were used to determine the suitability of irrigation water.
The US Salinity Laboratory proposed a diagram to assess the suitability of water for irrigation purposes (Richards, 1954). In the USSL diagram, the groundwater for irrigation purposes is classified based on the EC and the SAR values, as shown in Figure 14. The diagram explains the combined effect of sodium hazard and salinity hazard while classifying irrigation water. Figure 14 shows that the majority of the samples fall in the C2S1 and C3S1 zones. C2S1 denoted medium salinity and low alkali water, indicating that most of the soil is at low risk of exchangeable sodium and salinity. About 25% of samples fell in the C3S1 zone, which denoted high salinity and low alkaline water. Due to high salinity, water in this zone requires special management for salinity control.
Figure 14
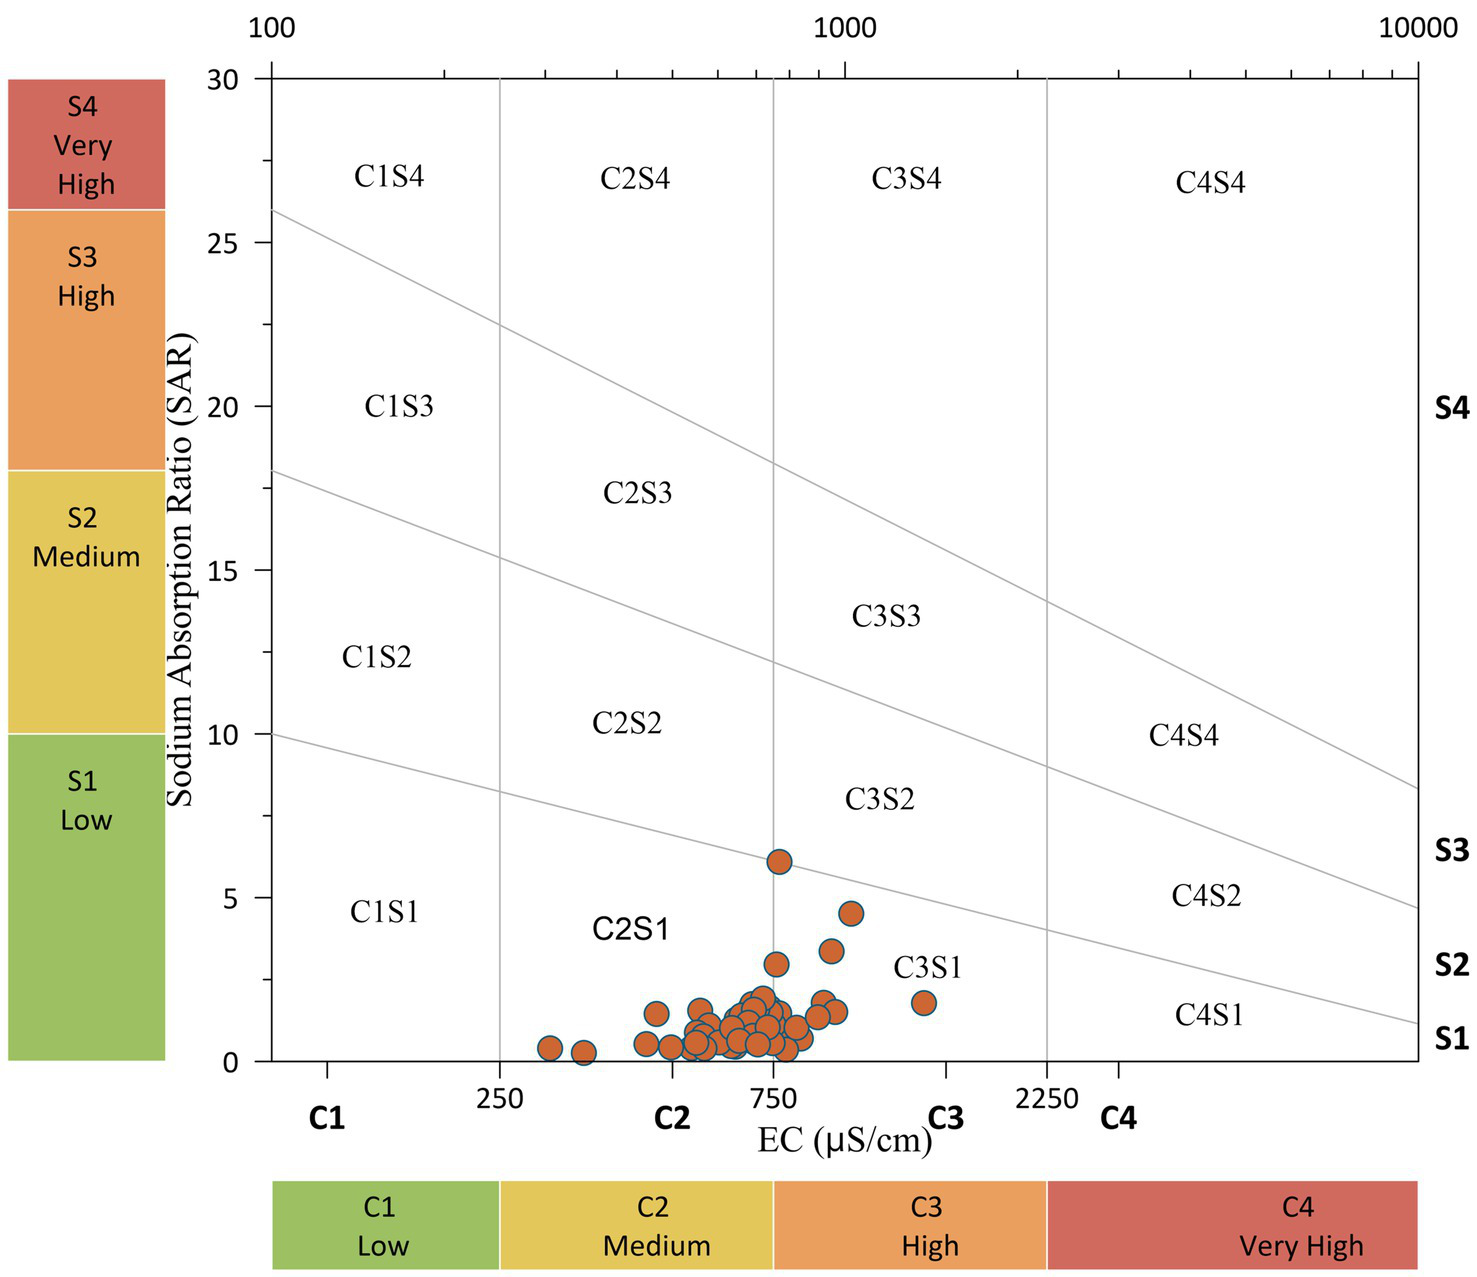
US salinity diagram for classification of irrigation waters (after Richards, 1954).
Richards (1954) proposed the classification of water resources for irrigation purposes based on the SAR value. The water quality SAR measures the amount of sodium relative to the amount of calcium and magnesium in water. The value of SAR varied from 0.26 to 15.8, with a mean value of 1.46 (Supplementary Table S1). The irrigation water is classified into four categories based on SAR values, i.e., ‘low’ (<10), ‘medium’ (10–18), ‘high’ (18–26), and ‘very high’ (>26). Based on this classification, most groundwater samples are classified as ‘low’ (SAR < 10) category.
Percent sodium (%Na) is another parameter used to evaluate the suitability of water for irrigation utilisation. Based on Na% values, the groundwater can be classified into five categories, i.e., ‘excellent’ (<20), ‘good’ (20–40), ‘permissible’ (40–60), ‘doubtful’ (60–80), and ‘unsuitable’ (>80) (Wilcox, 1955). Based on this classification, groundwater was classified into ‘excellent’ (31%), ‘good’ (60%), ‘permissible’ (5.6%), and ‘doubtful’ (3.4%) (Wilcox, 1955). Irrigation with high sodium concentrations in water can cause the exchange of Na+ ions in water for Ca2+ and Mg2+ ions in soils, which reduces the permeability of the soils and causes poor internal drainage (Collins and Jenkins, 1996). Wilcox (1955) used %Na and EC to evaluate groundwater suitability for irrigation, as shown in Figure 15. The plot indicated that 88% of the groundwater samples belonged to the ‘excellent to good’ category.
Figure 15
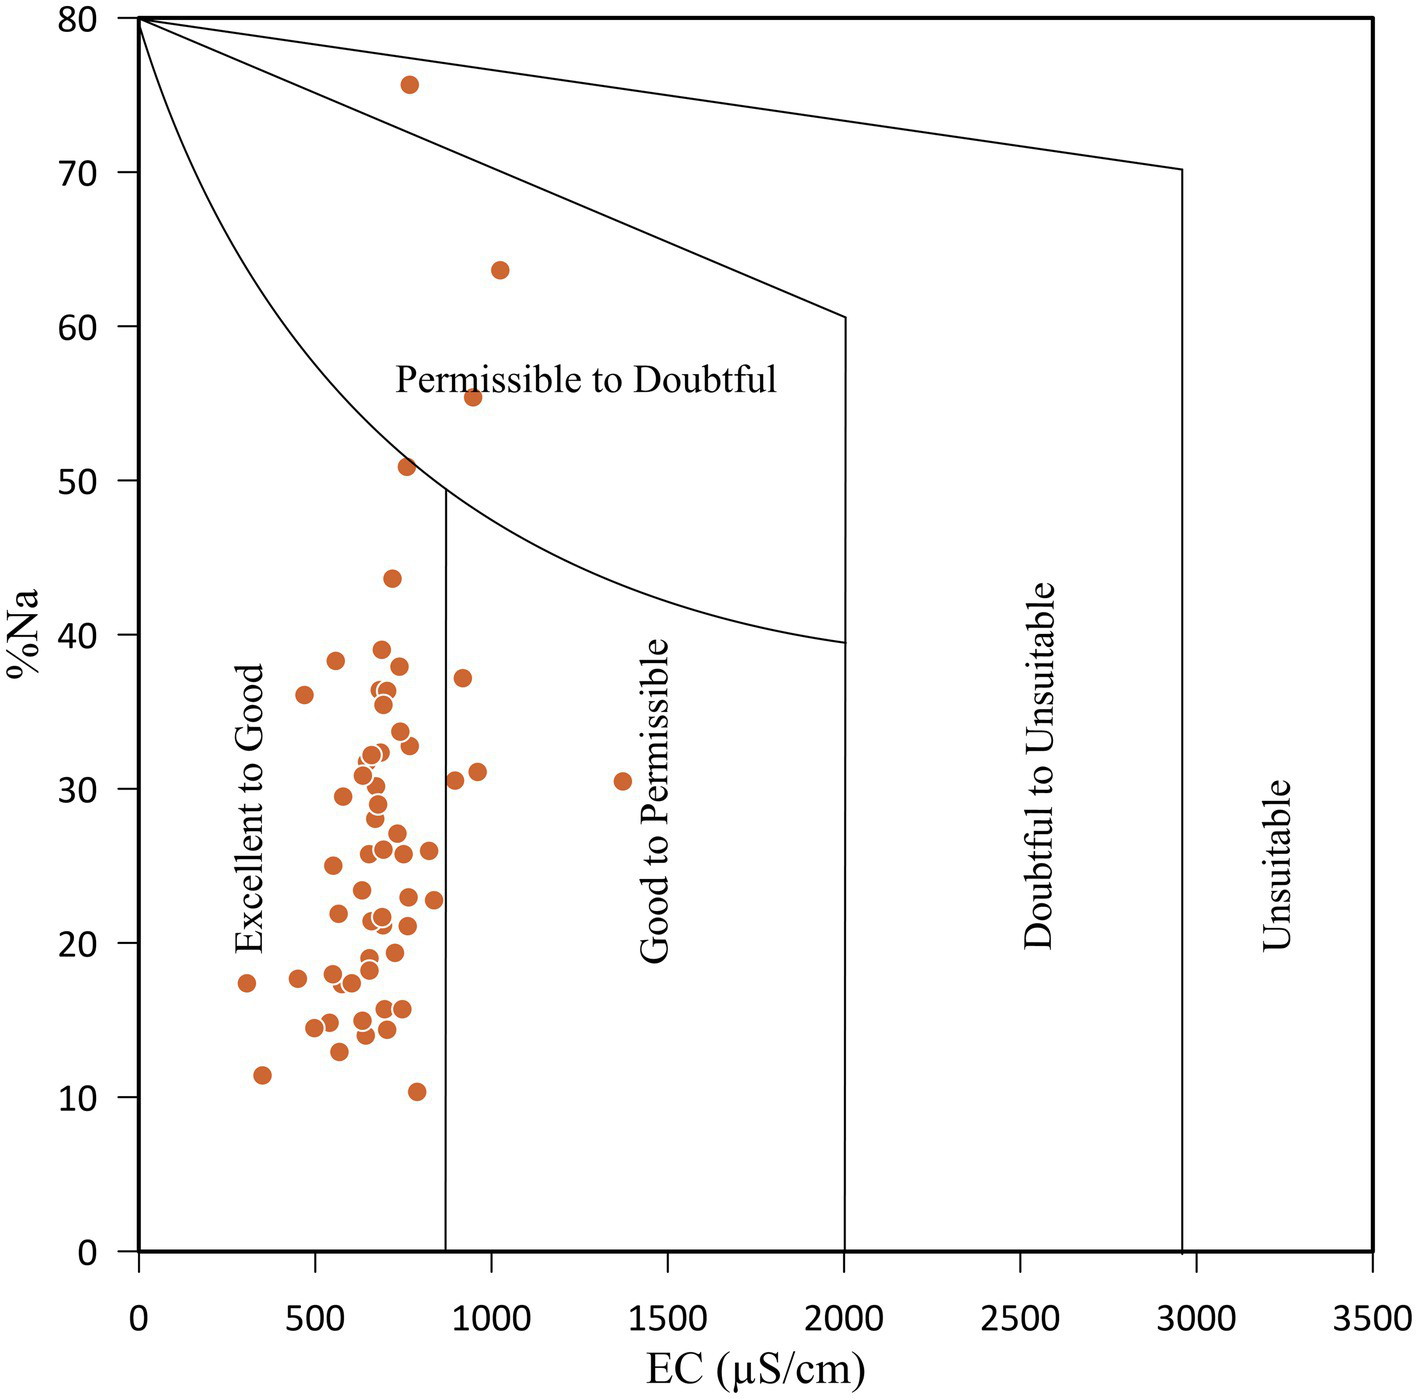
Plot of sodium percent versus electrical conductivity (after Wilcox, 1955).
Excess of bicarbonate and carbonate compared to alkaline earth (Ca2+ + Mg2+) impacts the suitability of groundwater for irrigation usage because it may cause complete precipitation of Ca2+ and Mg2+ ions as carbonate (Karanth, 1987). RSC of the groundwater samples varied from −2.39 meq/L to 5.66 meq/L with a mean value of 0.88 meq/L (Supplementary Table S1). According to Richards (1954) water classification, the suitability of groundwater for irrigation usage is categorised into ‘good’ (<1.25), ‘moderate’ (1.25–2.5) and ‘unsuitable’ (>2.5). Based on this classification, 94.8% of groundwater samples belonged to the ‘good’ category and 5.2% belonged to the ‘unsuitable’ category.
Classification of water for irrigation purposes can also be done by the Kelley index (KI) (Kelley, 1963). KI value (≥1) is considered ‘unsuitable’, and KI value (<1) is considered ‘suitable’ for irrigation usage. By definition, KI evaluates the proportion of sodium concerning calcium and magnesium, signifying sodium-related issues such as reduced permeability and soil infiltration (Kelley, 1963). Based on the KI classification, around 93% of the groundwater samples were ‘suitable’ for irrigation purposes. The remaining 7% of the groundwater samples were ‘unsuitable’ for irrigation usage. Magnesium hazard (MH) is another method for classifying water for irrigation purposes. It indicates the degree of damage caused by magnesium to the soil structure (Tahmasebi et al., 2018). Excess magnesium is absorbed between the clay particles, reducing the soil’s infiltration capacity. It adversely impacts crop growth, resulting in low production (Ravikumar et al., 2011). The value of MH varied from 26.83 to 77.38, with a mean value of 58.82 (Supplementary Table S1). A value of MH > 50 denotes that water is unsuitable for irrigation, while values of MH < 50 denote that water is suitable for irrigation usage. Based on the MH classification, 14% and 86% of groundwater samples belonged to ‘suitable’ and ‘unsuitable’ categories, respectively.
4.13 Groundwater remediation and recommendations for future work
The present study advocates implementing mitigation measures to reduce the concentration levels of major and trace elements in the area’s groundwater, which can pose a risk to the local population. Furthermore, calculated irrigation indices suggested that the study area needed an adequate drainage and water management plan. Awareness and education about groundwater quality and its impact on human health and a water management plan for irrigation practices are strongly recommended for the district. The groundwater sampling and analysis were carried out during the post-monsoon season, which shows the limitations of the present study. Hence, this study recommends a seasonal groundwater sampling and analysis in the district to understand the seasonal variation in the major and trace elements chemistry and their potential impact on the local population’s health. Furthermore, the present study contributes to baseline data generation on major and trace elements of groundwater and offers scope for understanding and comparative studies in future.
5 Conclusion
The present research focused on assessing major and trace elements in the groundwater, identifying potential sources of dissolved elements and determining water suitability for different uses in the Sultanpur district of Uttar Pradesh. The pH of the study area’s groundwater samples was alkaline. The groundwater had ionic order of HCO3− > Na+ > Ca2+ > Mg2+ > SO42− > Cl− > K+ > NO3− > F− abundance in the area. The groundwater chemistry was dominated by alkaline earths (Ca2+ + Mg2+) over alkalis (Na+ + K+), and weak acids (HCO3−) over strong acids (SO42− + Cl−). The hydrogeochemical facies of the Sultanpur district were mainly Ca–Mg–HCO3 water type. Hydrogeochemical approaches and multi-statistical analysis suggested that the study area’s groundwater chemistry has been primarily controlled by the rock weathering and cation-anion exchange processes, followed by anthropogenic activities in the area.
High concentrations of dissolved TDS, TH, Mg2+, Fe, and Mn exceeded the acceptable BIS limit in many groundwater samples, restricting direct utilisation for drinking purposes. Furthermore, a few samples had high F−, Al, and Pb concentrations and exceeded the BIS acceptable limit. However, the overall water quality calculated using the WQI method suggested that a few samples were unsuitable for drinking in the study area. The human health risk assessment indicated 23% and 12% of the sample had values greater than 1, which may cause potential health risks to children and adults in the study area. High MH values in most samples and high salinity values in some samples restrict groundwater use for irrigation in the study area. The present study recommended that groundwater needs appropriate treatment before its utilisation to protect human health. Also, an irrigation management plan could be implemented at several locations in the district. The results of the present study and GIS-based maps would be helpful to policymakers in making appropriate decisions on the water resources management plan in the area.
Statements
Data availability statement
The analysed data used to support the findings of this article will be made available by the authors, without undue reservation.
Author contributions
CB: Conceptualization, Data curation, Investigation, Writing – original draft. AP: Conceptualization, Data curation, Methodology, Visualization, Writing – original draft. AK: Formal analysis, Validation, Writing – review & editing. VP: Supervision, Writing – review & editing. PavK: Investigation, Methodology, Writing – review & editing. PanK: Investigation, Methodology, Writing – review & editing. AT: Conceptualization, Supervision, Writing – review & editing.
Funding
The author(s) declare that no financial support was received for the research and/or publication of this article.
Acknowledgments
The authors thank the Vice-Chancellor of JNU, New Delhi, and Dean, SES, JNU for the research facilities. We sincerely thank the Editor and reviewer for their valuable comments/suggestions to improve the study in its present form. We also acknowledge the IUAC for extending Q-ICPMS established under the National Geochronology Facility funded by the Ministry of Earth Science (MoES) with project reference number MoES/P.O.(Seismic)8(09)-Geochron/2012.
Conflict of interest
The authors declare that the research was conducted in the absence of any commercial or financial relationships that could be construed as a potential conflict of interest.
Generative AI statement
The authors declare that no Gen AI was used in the creation of this manuscript.
Publisher’s note
All claims expressed in this article are solely those of the authors and do not necessarily represent those of their affiliated organizations, or those of the publisher, the editors and the reviewers. Any product that may be evaluated in this article, or claim that may be made by its manufacturer, is not guaranteed or endorsed by the publisher.
Supplementary material
The Supplementary material for this article can be found online at: https://www.frontiersin.org/articles/10.3389/frwa.2025.1639708/full#supplementary-material
References
1
Abascal E. Gómez-Coma L. Ortiz I. Ortiz A. (2022). Global diagnosis of nitrate pollution in groundwater and review of removal technologies. Sci. Total Environ.810:152233. doi: 10.1016/J.SCITOTENV.2021.152233
2
Alam W. Gyanendra Y. Chanda R. Laishram R. J. Nesa N. (2020). Hydrogeochemical assessment and evaluation of groundwater quality in selected areas of Bishnupur district, Manipur. J. Geol. Soc. India96, 272–278. doi: 10.1007/s12594-020-1547-4
3
Ali S. Mohammadi A. A. Ali H. Alinejad N. Maroosi M. (2022). Qualitative assessment of ground water using the water quality index from a part of Western Uttar Pradesh, North India. Desalin. Water Treat.252, 332–338. doi: 10.5004/DWT.2022.28263
4
Anderson J. J. B. Klemmer P. J. (2013). Risk of high dietary calcium for arterial calcification in older adults. Nutrients5:3964. doi: 10.3390/NU5103964
5
Andrade A. I. A. S. S. Stigter T. Y. (2011). Hydrogeochemical controls on shallow alluvial groundwater under agricultural land: case study in Central Portugal. Environ. Earth Sci.63, 809–825. doi: 10.1007/s12665-010-0752-7
6
APHA . (1998). Standard methods for the examination of water and wastewater. 20th Edn. Washington, DC: American Public Health Association, American Water Works Association and Water Environmental Federation.
7
Arshad I. Umar R. (2023). Status of heavy metals and metalloid concentrations in water resources and associated health risks in parts of Indo-Gangetic plain, India. Groundw. Sustain. Dev.23:101047. doi: 10.1016/J.GSD.2023.101047
8
Baj J. Flieger W. Barbachowska A. Kowalska B. Flieger M. Forma A. et al . (2023). Consequences of disturbing manganese homeostasis. Int. J. Mol. Sci.24:14959. doi: 10.3390/IJMS241914959
9
Baker S. B. Worthley L. I. G. (2002). The essentials of calcium, magnesium and phosphate metabolism: part I. Physiology. Crit. Care Resuscitat.4, 301–306. doi: 10.1016/S1441-2772(23)01193-6
10
Bakshe P. Chandran M. Viju B. J. Narikkatan A. K. Jugade R. M. (2024). Hydrogeochemical factors influencing the dynamics of groundwater characteristics in eco-sensitive areas of the southern Western Ghats, India. Sci. Rep.14, 1–17. doi: 10.1038/s41598-024-67988-6
11
Banerjee P. Prasad B. (2020). Determination of concentration of total sodium and potassium in surface and ground water using a flame photometer. Appl. Water Sci.10, 1–7. doi: 10.1007/s13201-020-01188-1
12
Benkov I. Varbanov M. Venelinov T. Tsakovski S. (2023). Principal component analysis and the water quality index—a powerful tool for surface Water quality assessment: a case study on Struma River catchment, Bulgaria. Water15:1961. doi: 10.3390/W15101961
13
Berman J. J. (2016). “Understanding your data” in Data simplification, 135–187. doi: 10.1016/B978-0-12-803781-2.00004-7
14
Bharat A. P. Singh A. K. (2024). Evaluation of water quality and its non-cancer risk in the rural environment of Bundelkhand region: geochemical and statistical approaches. Int. J. Environ. Anal. Chem.104, 6592–6612. doi: 10.1080/03067319.2022.2149330
15
BIS (2012). Indian standard drinking water- specification.
16
Brindha K. Pavelic P. Sotoukee T. Douangsavanh S. Elango L. (2017). Geochemical characteristics and groundwater quality in the Vientiane plain, Laos. Expo. Health9, 89–104. doi: 10.1007/s12403-016-0224-8
17
Cao X. Shi Y. He W. An T. Chen X. Zhang Z. et al . (2022). Impacts of anthropogenic groundwater recharge (AGR) on nitrate dynamics in a phreatic aquifer revealed by hydrochemical and isotopic technologies. Sci. Total Environ.839:156187. doi: 10.1016/j.scitotenv.2022.156187
18
Cerling T. E. Pederson B. L. von Damm K. L. Cerling T. E. Pederson B. L. von Damm K. L. (1989). Sodium-calcium ion exchange in the weathering of shales: implications for global weathering budgets. Geo17:552. doi: 10.1130/0091-7613(1989)017<0552:SCIEIT>2.3.CO;2
19
CGWB (2023). Aquifer mapping and management plan, Sultanpur district, Uttar Pradesh. Ministry of Jal Shakti, Government of India.
20
Chaturvedi R. Banerjee S. Chattopadhyay P. Bhattacharjee C. R. Raul P. Borah K. (2014). High iron accumulation in hair and nail of people living in iron affected areas of Assam, India. Ecotoxicol. Environ. Saf.110, 216–220. doi: 10.1016/j.ecoenv.2014.08.028
21
Chidambaram S. Sarathidasan J. Srinivasamoorthy K. Thivya C. Thilagavathi R. Prasanna M. V. et al . (2018). Assessment of hydrogeochemical status of groundwater in a coastal region of southeast coast of India. Appl Water Sci8, 1–14. doi: 10.1007/s13201-018-0649-2
22
Chowdhury S. Mazumder M. J. Al-Attas O. Husain T. (2016). Heavy metals in drinking water: occurrences, implications, and future needs in developing countries. Sci. Total Environ.569, 476–488. doi: 10.1016/j.scitotenv.2016.06.166
23
Chowdhury U. K. Rahman M. M. Mandal B. K. Paul K. Lodh D. Biswas B. K. (2001). Groundwater arsenic contamination and human sufferings in West Bengal, India and Bangladesh. Environ. Sci.83, 393–415.
24
Collins R. Jenkins A. (1996). The impact of agricultural land use on stream chemistry in the Middle Hills of the Himalayas, Nepal. J. Hydrol.185, 71–86. doi: 10.1016/0022-1694(95)03008-5
25
Dey R. K. Swain S. K. Mishra S. Sharma P. Patnaik T. Singh V. K. et al . (2012). Hydrogeochemical processes controlling the high fluoride concentration in groundwater: a case study at the Boden block area, Orissa, India. Environ. Monit. Assess.184, 3279–3291. doi: 10.1007/S10661-011-2188-2/FIGURES/7
26
Dhakate R. VV S G. R. (2015). Hydrochemical assessment of groundwater in alluvial aquifer region, Jalandhar District, Punjab, India. Environ. Earth Sci.73, 8145–8153. doi: 10.1007/s12665-014-3973-3
27
Domenico P. (1972). Concepts and models in groundwater hydrology. New York: McGraw-Hill.
28
Elumalai V. Nethononda V. G. Manivannan V. Rajmohan N. Li P. Elango L. (2020). Groundwater quality assessment and application of multivariate statistical analysis in Luvuvhu catchment, Limpopo, South Africa. J. Afr. Earth Sci.171:103967. doi: 10.1016/j.jafrearsci.2020.103967
29
Fisher R. S. Mullican W. F. (1997). Hydrochemical evolution of sodium sulphate and sodium chloride groundwater beneath the northern Chihuahuan desert, trans- Pecos, Texas. USA. Hydrogeol. J.5, 4–16.
30
Fouhy L. E. Mangano K. M. Zhang X. Hughes B. D. Tucker K. L. Noel S. E. (2023). Association between a calcium-to-magnesium ratio and osteoporosis among Puerto Rican adults. J. Nutr.153, 2642–2650. doi: 10.1016/J.TJNUT.2023.05.009
31
Franco H. D. Custodio M. Peñaloza R. De La Cruz H. (2021). Application of multivariate statistical methods and water quality index for the evaluation of surface water quality in the Cunas River basin, Peru. Asian J. Water Environ. Pollut.18, 19–27. doi: 10.3233/AJW210039
32
Freeze R. A. Cherry J. A. (1979). Groundwater. Englewood Cliffs, NJ: Prentice-Hall, 370.
33
Gaillardet J. Dupré B. Louvat P. Allègre C. J. Gaillardet J. Dupré B. et al . (1999). Global silicate weathering and CO2 consumption rates deduced from the chemistry of large rivers. ChGeo159, 3–30. doi: 10.1016/S0009-2541(99)00031-5
34
Gao J. Li Z. Chen Z. Zhou Y. Liu W. Wang L. et al . (2021). Deterioration of groundwater quality along an increasing intensive land use pattern in a small catchment. Agric. Water Manag.253:106953. doi: 10.1016/J.AGWAT.2021.106953
35
García G. M. Hidalgo M.d. V. Blesa M. A. (2001). Geochemistry of groundwater in the alluvial plain of Tucuman province, Argentina. Hydrogeol. J.9, 597–610. doi: 10.1007/s10040-001-0166-4
36
Gautam S. K. Maharana C. Sharma D. Singh A. K. Tripathi J. K. Singh S. K. (2015). Evaluation of groundwater quality in the Chotanagpur plateau region of the Subarnarekha River basin, Jharkhand state, India. Sustain. Water Qual. Ecol.6, 57–74. doi: 10.1016/j.swaqe.2015.06.001
37
Gautam A. Rai S. C. Rai S. P. Ram K. (2022). Impact of anthropogenic and geological factors on groundwater hydrochemistry in the unconfined aquifers of indo-Gangetic plain. Phys. Chem. Earth Parts A B C126:103109. doi: 10.1016/j.pce.2022.103109
38
Gautum J.P. (2004). Groundwater brochure of Sultanpur district, UP, CGWB. Ministry of Jal Shakti, India.
39
Gibbs R. J. (1970). Mechanisms controlling world Water chemistry. Science170, 1088–1090. doi: 10.1126/SCIENCE.170.3962.1088
40
Giri S. Singh A. K. (2015). Human health risk assessment via drinking water pathway due to metal contamination in the groundwater of Subarnarekha River basin, India. Environ. Monit. Assess.187:63. doi: 10.1007/s10661-015-4265-4
41
Government of India (2011). Census 2011 provisional population totals. Ministry of Home Affairs, India.
42
Guo F. Jiang G. Yuan D. (2007). Major ions in typical subterranean rivers and their anthropogenic impacts in southwest karst areas, China. Environ. Geol.53, 533–541. doi: 10.1007/S00254-007-0665-2/FIGURES/20
43
Handa B. K. (1975). Occurrence and distribution of potassium ions in natural waters in India. J. Hydrol.26, 267–276. doi: 10.1016/0022-1694(75)90008-6
44
Hem J. D. (1985). Study and interpretation of the chemical characteristics of natural water. Water supply paper.
45
Horton R. K. (1965). An index-number system for rating water quality. J. Water Pollut. Control Fed.37, 300–306.
46
Hossein M. Rwiza M. J. Nyanza E. C. Bakari R. Ripanda A. Nkrumah S. et al . (2024). Fluoride contamination a silent global water crisis: a case of Africa. Sci. Afr.26:e02485. doi: 10.1016/J.SCIAF.2024.E02485
47
Ibrahim A. Ismail A. Juahir H. Iliyasu A. B. Wailare B. T. Mukhtar M. et al . (2023). Water quality modelling using principal component analysis and artificial neural network. Mar. Pollut. Bull.187:114493. doi: 10.1016/J.MARPOLBUL.2022.114493
48
Jain S. C. Metha S. C. Kumar B. Reddy A. R. Nagaratnam A. (1995). Formulation of the reference Indian adult: anatomic and physiologic data. Health Phys.68, 509–522. doi: 10.1097/00004032-199504000-00008
49
Jollife I. T. Cadima J. (2016). Principal component analysis: a review and recent developments. Philos. Trans. R. Soc. Lond. A Math. Phys. Eng. Sci.374:20150202. doi: 10.1098/rsta.2015.0202
50
Kalpana L. Brindha K. Elango L. (2019). FIMAR: a new fluoride index to mitigate geogenic contamination by managed aquifer recharge. Chemosphere220, 381–390. doi: 10.1016/J.CHEMOSPHERE.2018.12.084
51
Karanth K. R. (1987). Groundwater assessment, development and management, vol. 720. New Delhi: Tata McGraw Hill.
52
Karmakar B. Singh M. K. Choudhary B. K. Singh S. K. Egbueri J. C. Gautam S. K. et al . (2023). Investigation of the hydrogeochemistry, groundwater quality, and associated health risks in industrialized regions of Tripura, Northeast India. Environ. Forensic24, 285–306. doi: 10.1080/15275922.2021.2006363
53
Kaur L. Rishi M. S. Sharma S. Sharma B. Lata R. Singh G. (2019). Hydrogeochemical characterization of groundwater in alluvial plains of river Yamuna in northern India: an insight of controlling processes. J. King Saud Univ. Sci.31, 1245–1253. doi: 10.1016/j.jksus.2019.01.005
54
Kaushal S. S. Groffman P. M. Band L. E. Elliott E. M. Shields C. A. Kendall C. (2011). Tracking nonpoint source nitrogen pollution in human-impacted watersheds. Environ. Sci. Technol.45, 8225–8232. doi: 10.1021/es200779e
55
Kelley W. P. (1963). Use of saline irrigation water. Soil Sci.95, 385–391. doi: 10.1097/00010694-196306000-00003
56
Kim J. H. Kim R. H. Lee J. Cheong T. J. Yum B. W. Chang H. W. (2005). Multivariate statistical analysis to identify the major factors governing groundwater quality in the coastal area of Kimje, South Korea. HyPr19, 1261–1276. doi: 10.1002/HYP.5565
57
Kom K. P. Gurugnanam B. Bairavi S. Chidambaram S. (2023). Sources and geochemistry of high fluoride groundwater in hard rock aquifer of the semi-arid region. A special focus on human health risk assessment. Total Environ. Res. Themes5:100026. doi: 10.1016/J.TOTERT.2023.100026
58
Kumar S. Kumar M. Chandola V. K. Kumar V. Saini R. K. Pant N. et al . (2021). Groundwater quality issues and challenges for drinking and irrigation uses in central ganga basin dominated with rice-wheat cropping system. Water13:2344. doi: 10.3390/w13172344
59
Kumar A. Kumar S. Singh A. T. B. Tewary A. B. K. Sinha A. A. (2008). Major ion chemistry, weathering processes and water quality assessment in upper catchment of Damodar River basin, India. Environ. Geol.54, 745–758. doi: 10.1007/s00254-007-0860-1
60
Kumar A. Sharma D. Tripathi J. K. (2024). Elemental mobilisation and redistribution during the ferromanganese nodule formation in the sediments of ganga plain, India. EGU Gen. Assem. Conf. Abstr.:2822. doi: 10.5194/egusphere-egu24-2822
61
Kumar D. Singh A. Kumar Jha R. Bhushan Sahoo B. Kumar Sahoo S. Jha V. (2019). Source characterization and human health risk assessment of nitrate in groundwater of middle Gangetic plain, India. Arab. J. Geosci.12, 1–12. doi: 10.1007/s12517-019-4519-5
62
Kumar S. Venkatesh A. S. Singh R. Udayabhanu G. Saha D. (2018). Geochemical signatures and isotopic systematics constraining dynamics of fluoride contamination in groundwater across Jamui district, indo-Gangetic alluvial plains, India. Chemosphere205, 493–505. doi: 10.1016/J.CHEMOSPHERE.2018.04.116
63
Kumari B. Keesari T. Roy A. Mohokar H. Pant H. J. (2024). Comprehensive assessment of groundwater quality in the Prayagraj district, ganga basin. Environ. Sci. Pollut. Res.32, 3238–3260. doi: 10.1007/S11356-024-34030-1
64
Laghrib F. Bahaj T. El Kasmi S. Hilali M. Kacimi I. Nouayti N. et al . (2024). Hydrogeochemical study of groundwater in arid and semi-arid regions of the Infracenomanian aquifers (cretaceous Errachidia basin, southeastern Morocco). Using hydrochemical modeling and multivariate statistical analysis. J. Afr. Earth Sci.209:105132. doi: 10.1016/J.JAFREARSCI.2023.105132
65
Lakshmanan E. Kannan R. Kumar M. S. (2003). Major ion chemistry and identification of hydrogeochemical processes of ground water in a part of Kancheepuram district, Tamil Nadu, India. Environ. Geosci.10, 157–166. doi: 10.1306/eg100403011
66
Li C. Gao X. Liu Y. Wang Y. (2019). Impact of anthropogenic activities on the enrichment of fluoride and salinity in groundwater in the Yuncheng Basin constrained by Cl/Br ratio, δ18O, δ2H, δ13C and δ7Li isotopes. J. Hydrol.579:124211. doi: 10.1016/J.JHYDROL.2019.124211
67
Li D. Gao X. Wang Y. Luo W. (2018). Diverse mechanisms drive fluoride enrichment in groundwater in two neighboring sites in northern China. Environ. Pollut.237, 430–441. doi: 10.1016/J.ENVPOL.2018.02.072
68
Liu C. W. Lin K. H. Kuo Y. M. (2003). Application of factor analysis in the assessment of groundwater quality in a Blackfoot disease area in Taiwan. Sci. Total Environ.313, 77–89. doi: 10.1016/S0048-9697(02)00683-6
69
Loizidou M. Kapetanios E. G. (1993). Effect of leachate from landfills on underground water quality. Sci. Total Environ.128, 69–81. doi: 10.1016/0048-9697(93)90180-e
70
Machender G. Dhakate R. Reddy M. N. (2014). Hydrogeochemical characteristics of surface water (SW) and groundwater (GW) of the Chinnaeru River basin, northern part of Nalgonda District, Andhra Pradesh. Environ. Earth Sci.71, 2885–2910. doi: 10.1007/s12665-013-2665-8
71
Macpherson G. L. (2009). CO2 distribution in groundwater and the impact of groundwater extraction on the global C cycle. Chem. Geol.264, 328–336. doi: 10.1016/J.CHEMGEO.2009.03.018
72
Madhav S. Ahamad A. Kumar A. Kushawaha J. Singh P. Mishra P. K. (2018). Geochemical assessment of groundwater quality for its suitability for drinking and irrigation purpose in rural areas of Sant Ravidas Nagar (Bhadohi), Uttar Pradesh. Geol. Ecol. Landscapes2, 127–136. doi: 10.1080/24749508.2018.1452485
73
Mani M. S. Kabekkodu S. P. Joshi M. B. Dsouza H. S. (2019). Ecogenetics of lead toxicity and its influence on risk assessment. Hum. Exp. Toxicol.38, 1031–1059. doi: 10.1177/0960327119851253
74
Mann A. G. Tam C. C. Higgins C. D. Rodrigues L. C. (2007). The association between drinking water turbidity and gastrointestinal illness: a systematic review. BMC Public Health7:256. doi: 10.1186/1471-2458-7-256
75
Matiatos I. (2016). Nitrate source identification in groundwater of multiple land-use areas by combining isotopes and multivariate statistical analysis: a case study of Asopos. Sci. Total Environ.541, 802–814. doi: 10.1016/j.scitotenv.2015.09.134
76
Maurya S. Ashok M. B. Gupta G. Saxena A. Singh A. (2025). Hydrochemical evaluation of groundwater quality and human health risk assessment of fluoride and nitrate: a case study of Pratapgarh District UP, India. Water Air Soil Pollut.236, 1–26. doi: 10.1007/S11270-025-07806-5
77
Mayo A. L. Loucks M. D. (1995). Solute and isotopic geochemistry and ground water flow in the central Wasatch range, Utah. J. Hydrol.172, 31–59. doi: 10.1016/0022-1694(95)02748-E
78
McDowell L. A. Chen R. J. Sticco K. L. (2024). “Iron overload” in StatPearls [Internet]. StatPearls Publishing.
79
McLean W. Jankowski J. Lavitt N. (2000). “Groundwater quality and sustainability in an alluvial aquifer, Australia” in Groundwater: past achievements and future challenges, 567–573.
80
Meybeck M. (1987). Global chemical weathering of surficial rocks estimated from river dissolved loads. Am. J. Sci.287, 401–428. doi: 10.2475/AJS.287.5.401
81
Mohamed A. Asmoay A. Alshehri F. Abdelrady A. Othman A. (2022). Hydro-geochemical applications and multivariate analysis to assess the water–rock interaction in arid environments. Appl. Sci.12:6340. doi: 10.3390/APP12136340
82
Mukherjee I. Singh U. K. (2018). Groundwater fluoride contamination, probable release, and containment mechanisms: a review on Indian context. Environ. Geochem. Health40, 2259–2301. doi: 10.1007/S10653-018-0096-X
83
Nasher R. N. M. Ahmed H. M. (2021). Groundwater geochemistry and hydrogeochemical processes in the lower Ganges-Brahmaputra-Meghna River basin areas, Bangladesh. J. Asian Earth Sci.6:100062. doi: 10.1016/J.JAESX.2021.100062
84
Neogi B. Kumar Tiwari A. Singh A. K. (2023). Groundwater geochemistry and risk assessment to human health in north Karanpura coalfield, India. Environ. Nanotechnol. Monit. Manag.20:100897. doi: 10.1016/J.ENMM.2023.100897
85
Nethononda V. G. Elumalai V. Rajmohan N. (2019). Irrigation return flow induced mineral weathering and ion exchange reactions in the aquifer, Luvuvhu catchment, South Africa. J. Afr. Earth Sci.149, 517–528. doi: 10.1016/j.jafrearsci.2018.09.001
86
Njitchoua R. Ngounou N. B. (1997). Hydrogeochemistry and environmental isotope investigations of the north Diamaré plain, northern Cameroon. J. Afr. Earth Sci.25, 307–316. doi: 10.1016/S0899-5362(97)00105-X
87
O'Rourke M. K. Van de Water P. K. Jin S. Rogan S. P. Weiss A. D. Gordon S. M. et al . (1999). Evaluations of primary metals from NHEXAS Arizona: distributions and preliminary exposures. J. Expo. Sci. Environ. Epidemiol.9, 435–445. doi: 10.1038/sj.jea.7500049
88
Papageorgiou S. N. (2022). On correlation coefficients and their interpretation. J. Orthod.49, 359–361. doi: 10.1177/14653125221076142
89
Paul R. Brindha K. Gowrisankar G. Tan M. L. Singh M. K. (2019). Identification of hydrogeochemical processes controlling groundwater quality in Tripura, Northeast India using evaluation indices, GIS, and multivariate statistical methods. Environ. Earth Sci.78, 1–16. doi: 10.1007/S12665-019-8479-6
90
Piper A. M. (1944). A graphic procedure in the geochemical interpretation of water-analyses. EOS Trans. Am. Geophys. Union25, 914–928. doi: 10.1029/TR025I006P00914
91
Prabhu S. Yusuf M. Ahn Y. Park H. Choi J. Amin M. A. et al . (2023). Fluoride occurrence in environment, regulations, and remediation methods for soil: a comprehensive review. Chemosphere324:138334. doi: 10.1016/j.chemosphere.2023.138334
92
Prasad B. Kumari P. Bano S. Kumari S. (2014). Ground water quality evaluation near mining area and development of heavy metal pollution index. Appl. Water Sci.4, 11–17. doi: 10.1007/s13201-013-0126-x
93
Priyadarshi N. (2004). “Sodium in natural waters” in Water encyclopedia, 551–553. doi: 10.1002/047147844X.pc486
94
Qu J. Lin J. Wang J. Yan T. Ren K. Zhou J. et al . (2024). Analysis of the evolution and causes of groundwater chemistry after ecological water replenishment of the Jialu River, China. Sci. Rep.14:18759. doi: 10.1038/S41598-024-69704-W
95
Rahman I. Wahab M. A. Akter M. Mahanta T. R. (2024). Iron in drinking water and its impact on human health – a study in selected units of Jalalabad cantonment. Bangladesh Armed Forces Med. J.56, 58–64. doi: 10.3329/BAFMJ.V56I2.73013
96
Rajmohan N. Elango L. (2004). Identification and evolution of hydrogeochemistry processes in the groundwater environment in an area of the Palar and Cheyyar River basins, southern India. Environ. Geol.46, 47–61. doi: 10.1007/s00254-004-1012-5
97
Rao G. T. Rao V. G. Sarma V. S. Dhakate R. Surinaidu L. Mahesh J. et al . (2012). Hydrogeochemical parameters for assessment of groundwater quality in a river sub-basin. Int. J. Environ. Sci. Technol.9, 297–310. doi: 10.1007/s13762-012-0024-z
98
Ravikumar P. Somashekar R. K. Angami M. (2011). Hydrochemistry and evaluation of groundwater suitability for irrigation and drinking purposes in the Markandeya River basin, Belgaum District, Karnataka state, India. Environ. Monit. Assess.173, 459–487. doi: 10.1007/s10661-010-1399-2
99
Ren X. Li P. He X. Su F. Elumalai V. (2021). Hydrogeochemical processes affecting groundwater chemistry in the central part of the Guanzhong Basin, China. Arch. Environ. Contam. Toxicol.80, 74–91. doi: 10.1007/s00244-020-00772-5
100
Richards L. A. (1954). Diagnosis and improvement of saline alkali soils, agriculture, vol. 160. Washington, DC: US Department of Agriculture.
101
Rogers R. J. (1989). Geochemical comparison of groundwater in areas of New England, New York, and Pennsylvania. Groundwater27, 690–712. doi: 10.1111/j.1745-6584.1989.tb00483.x
102
Rose S. (2002). Comparative major ion geochemistry of Piedmont streams in the Atlanta, Georgia region: possible effects of urbanization. Environ. Geol.42, 102–113. doi: 10.1007/s00254-002-0545-8
103
Rubio-Arellano A. B. Ramos-Leal J. A. Morán-Ramírez J. Vázquez-Báez V. M. (2024). Geogenic and anthropogenic factors influencing groundwater quality for irrigation purposes from a volcano-sedimentary aquifer in the Puebla state, Mexico. Environ. Sci. Pollut. Res.31, 61576–61591. doi: 10.1007/S11356-024-35346-8/FIGURES/9
104
Sajil Kumar P. J. Delson P. D. James E. J. (2014). Evaluation of groundwater chemistry in Vaniyambadi industrial area with special reference on irrigation utility. Natl. Acad. Sci. Lett.37, 493–502. doi: 10.1007/S40009-014-0266-Z
105
Salh Y. H. M. Su C. Iqbal J. Usman U. S. Yousif M. H. Ismail O. (2025). Hydrogeochemical processes regulating groundwater quality and its suitability for drinking purposes in the recent alluvial plain, Blue Nile region, Sudan. Environ. Geochem. Health47, 102–123. doi: 10.1007/S10653-025-02409-9
106
Sarin M. M. Krishnaswami S. Dilli K. Somayajulu B. L. K. Moore W. S. (1989). Major ion chemistry of the Ganga-Brahmaputra river system: weathering processes and fluxes to the Bay of Bengal. Geochim. Cosmochim. Acta53, 997–1009. doi: 10.1016/0016-7037(89)90205-6
107
Sawyer C. McCarty P. (1967). Chemistry for sanitary engineers. Available online at: https://library.wur.nl/WebQuery/titel/153240
108
Sayyed J. A. Arjun B. (2011). Analysis of chloride, sodium and potassium in groundwater samples of Nanded City in Mahabharata, India. Eur. J. Exp. Biol.1, 74–82.
109
Scheelbeek P. F. D. Chowdhury M. A. Haines A. Alam D. S. Hoque M. A. Butler A. P. et al . (2016). High concentrations of sodium in drinking water and raised blood pressure in coastal deltas affected by episodic seawater inundations. Lancet Glob. Health4:S18. doi: 10.1016/s2214-109x(16)30023-7
110
Schoeller H. (1977). “Geochemistry of groundwater” in Groundwater studies—An international guide for research and practice (Paris: UNESCO), 1–18.
111
Selvakumar S. Chandrasekar N. Kumar G. (2017). Hydrogeochemical characteristics and groundwater contamination in the rapid urban development areas of Coimbatore, India. Water Resour. Ind.17, 26–33. doi: 10.1016/j.wri.2017.02.002
112
Shaffer R. M. Wright J. M. Cote I. Bateson T. F. (2023). Comparative susceptibility of children and adults to neurological effects of inhaled manganese: a review of the published literature. Environ. Res.221:115319. doi: 10.1016/j.envres.2023.115319
113
Shainberg I. Oster J. (1979). Quality of irrigation water. Available online at: https://www.cabidigitallibrary.org/doi/full/10.5555/19801954673
114
Shaji E. Sarath K. V. Santosh M. Krishnaprasad P. K. Arya B. K. Babu M. S. (2024). Fluoride contamination in groundwater: a global review of the status, processes, challenges, and remedial measures. Geosci. Front.15:101734. doi: 10.1016/J.GSF.2023.101734
115
Shukla S. Saxena A. (2020). Groundwater quality and associated human health risk assessment in parts of Raebareli district, Uttar Pradesh, India. Groundw. Sustain. Dev.10:100366. doi: 10.1016/j.gsd.2020.100366
116
Singh A. K. Raj B. Tiwari A. K. Mahato M. K. (2013a). Evaluation of hydrogeochemical processes and groundwater quality in the Jhansi district of Bundelkhand region, India. Environ. Earth Sci.70, doi: 10.1007/s12665-012-2209-7
117
Singh M. Kumar S. Kumar B. Singh S. Singh I. B. (2013b). Investigation on the hydrodynamics of Ganga Alluvial Plain using environmental isotopes: a case study of the Gomati River Basin, Northern India. Hydrogeology Journal21:687.
118
Singh G. Rishi M. S. Herojeet R. Kaur L. Sharma K. (2020). Evaluation of groundwater quality and human health risks from fluoride and nitrate in semi-arid region of northern India. Environ. Geochem. Health42, 1833–1862. doi: 10.1007/S10653-019-00449-6
119
Singh P. K. Verma P. Tiwari A. K. (2018). Hydrogeochemical investigation and qualitative assessment of groundwater resources in Bokaro district, Jharkhand, India. Arab. J. Geosci.11, 1–20. doi: 10.1007/s12517-018-3831-9
120
Sinha R. Tandon S. K. Gibling M. R. Bhattacharjee P. S. Dasgupta A. S. (2005). Late quaternary geology and alluvial stratigraphy of the ganga basin. Himal. Geol.26, 223–240.
121
Solanki Y. S. Agarwal M. Gupta A. B. Gupta S. Shukla P. (2022). Fluoride occurrences, health problems, detection, and remediation methods for drinking water: a comprehensive review. Sci. Total Environ.807:150601. doi: 10.1016/J.SCITOTENV.2021.150601
122
Srinivasamoorthy K. Vasanthavigar M. Vijayaraghavan K. Sarathidasan R. Gopinath S. (2013). Hydrochemistry of groundwater in a coastal region of Cuddalore district, Tamilnadu, India: implication for quality assessment. Arab. J. Geosci.6, 441–445. doi: 10.1007/s12517-011-0351-2
123
Srivastava P. Aruche M. Pal D. K. Kumar R. Hameed A. Arya A. et al . (2025). Soil-geochemistry of the ganga basin along a 2000 km transect: implications for chemical weathering during pedogenesis influenced by source, climate, and neotectonics. Appl. Geochem.180:106275. doi: 10.1016/j.apgeochem.2024.106275
124
Stallard R. F. Edmond J. M. (1983). Geochemistry of the Amazon River. The influence of geology and weathering environment on the dissolved load. J. Geophys. Res.88, 9671–9688.
125
Su H. Kang W. Li Y. Li Z. (2021). Fluoride and nitrate contamination of groundwater in the loess plateau, China: sources and related human health risks. Environ. Pollut.286:117287. doi: 10.1016/J.ENVPOL.2021.117287
126
Suthar S. Bishnoi P. Singh S. Mutiyar P. K. Nema A. K. Patil N. S. (2009). Nitrate contamination in groundwater of some rural areas of Rajasthan, India. J. Hazard. Mater.171, 189–199. doi: 10.1016/J.JHAZMAT.2009.05.111
127
Tahmasebi P. Mahmudy-Gharaie M. H. Ghassemzadeh F. Karimi Karouyeh A. (2018). Assessment of groundwater suitability for irrigation in a gold mine surrounding area, NE Iran. Environ. Earth Sci.77, 1–12. doi: 10.1007/s12665-018-7941-1
128
Tarawneh M. S. M. Janardhana M. R. Ahmed M. M. (2019). Hydrochemical processes and groundwater quality assessment in north eastern region of Jordan valley, Jordan. Hydro Res.2, 129–145. doi: 10.1016/J.HYDRES.2020.02.001
129
Thakur R. Nath H. Neog N. Bora P. K. Goswami R. (2024). Groundwater hydrogeochemistry and potential health risk assessment through exposure to elevated arsenic in Darrang district of north bank plain of the Brahmaputra. Sci. Rep.14:29843. doi: 10.1038/s41598-024-81379-x
130
Tiwari A. K. Singh A. K. (2014). Hydrogeochemical investigation and groundwater quality assessment of Pratapgarh district, Uttar Pradesh. J. Geol. Soc. India83, 329–343. doi: 10.1007/S12594-014-0045-Y
131
Tiwari A. Singh A. Singh A. Singh M. P. (2017). Hydrogeochemical analysis and evaluation of surface water quality of Pratapgarh district, Uttar Pradesh, India. Appl. Water Sci.7, 1609–1623. doi: 10.1007/s13201-015-0313-z
132
Tiwari A. K. Suozzi E. Fiorucci A. Lo Russo S. (2021). Assessment of groundwater geochemistry and human health risk of an intensively cropped alluvial plain, NW Italy. Hum. Ecol. Risk. Assess.27, 825–845. doi: 10.1080/10807039.2020.1775484
133
Todd D. K. Mays L. W. (2004). Groundwater hydrology. Hoboken: John Wiley & Sons.
134
Torres-Martínez J. A. Mora A. Knappett P. S. K. Ornelas-Soto N. Mahlknecht J. (2020). Tracking nitrate and sulfate sources in groundwater of an urbanized valley using a multi-tracer approach combined with a Bayesian isotope mixing model. Water Res.182:115962. doi: 10.1016/J.WATRES.2020.115962
135
Tripathi J. K. Ghazanfari P. Rajamani V. Tandon S. (2006). Geochemistry of sediments of the Ganges alluvial plains: evidence of large-scale sediment recycling. Quat. Int.159, 119–130. doi: 10.1016/j.quaint.2006.08.016
136
Tutmez B. Hatipoglu Z. Kaymak U. (2006). Modelling electrical conductivity of groundwater using an adaptive neuro-fuzzy inference system. Comput. Geosci.32, 421–433. doi: 10.1016/J.CAGEO.2005.07.003
137
Ullah Z. Zeng X. C. Rashid A. Ghani J. Ali A. Shah M. et al . (2023). Integrated approach to hydrogeochemical appraisal of groundwater quality concerning arsenic contamination and its suitability analysis for drinking purposes using water quality index. Sci. Rep.13:20455. doi: 10.1038/s41598-023-40105-9
138
USEPA (2004). Risk assessment guidance for superfund volume I: Human health evaluation manual (part E, supplemental guidance for dermal risk assessment) final. Washington, DC: Office of Superfund Remediation and Technology InnovationEPA/540/R/99/005 OSWER 9285.7-02EP PB99-963312 July 2004.
139
USEPA (2011). Exposure factors handbook. Washington, DC: Office of Research and Development, 2–6.
140
Valdiya K. S. (2015). The making of India: geodynamic evolution. Switzerland: Springer.
141
Vasanthavigar M. Srinivasamoorthy K. Vijayaragavan K. Rajiv Ganthi R. Chidambaram S. Anandhan P. et al . (2010). Application of water quality index for groundwater quality assessment: Thirumanimuttar sub-basin, Tamilnadu, India. Environ. Monit. Assess.171, 595–609. doi: 10.1007/S10661-009-1302-1/METRICS
142
Venkatesan G. Swaminathan G. (2009). Review of chloride and sulphate attenuation in groundwater nearby solid-waste landfill sites. J. Environ. Eng. Landsc. Manag.17, 1–7. doi: 10.3846/1648-6897.2009.17.Ia-Ig
143
Vesković J. Sentić M. Onjia A. (2024). Hydrogeochemical facies and health hazards of fluoride and nitrate in groundwater of a lithium ore deposit basin. Metals14:1062. doi: 10.3390/met14091062
144
Wani A. L. Ara A. Usmani J. A. (2015). Lead toxicity: a review. Interdiscip. Toxicol.8, 55–64. doi: 10.1515/INTOX-2015-0009
145
Weng H. X. Qin Y. C. Chen X. H. (2007). Elevated iron and manganese concentrations in groundwater derived from the Holocene transgression in the Hang-Jia-Hu plain, China. Hydrogeol. J.15, 715–726. doi: 10.1007/s10040-006-0119-z
146
WHO (1997). Guidelines for drinking-water quality. Recommendations, vol 1. World Health Organisation, Geneva, pp. 1–4.
147
Wilcox L. V. (1955). Classification and use of irrigation water. Washington, DC: US Department of Agriculture, Circular 969. Washington, DC: Scientific Research Publishing, Circular 969.
148
Wold S. Esbensen K. Geladi P. (1987). Principal component analysis. Chemom. Intell. Lab. Syst.2, 37–52. doi: 10.1016/0169-7439(87)80084-9
149
Wuensch K. L. Evans J. D. (1996). Straightforward statistics for the behavioral sciences. J. Am. Stat. Assoc.91:1750. doi: 10.2307/2291607
150
Xiao J. Jin Z. D. Zhang F. Wang J. (2012). Solute geochemistry and its sources of the groundwaters in the Qinghai Lake catchment, NW China. J. Asian Earth Sci.52, 21–30. doi: 10.1016/J.JSEAES.2012.02.006
151
Yadav A. K. Anita Kulsoom M. Kumar M. Pat Raw K. Kumar N. (2024). Health risk assessment due to heavy metal contamination in groundwater of Basuhi River basin, Jaunpur, India. Environ. Sustain.7, 251–260. doi: 10.1007/s42398-024-00318-8
Summary
Keywords
hydrogeochemistry, statistical analysis, water quality indices, sources identification, GIS
Citation
Bhushan C, Patel AP, Kumar A, Pandey VK, Kumar PV, Kumar P and Tiwari AK (2025) Hydrogeochemical characterisation and human health risk assessment of groundwater in Sultanpur District, Uttar Pradesh, India. Front. Water 7:1639708. doi: 10.3389/frwa.2025.1639708
Received
02 June 2025
Accepted
27 June 2025
Published
05 August 2025
Volume
7 - 2025
Edited by
Pawan Kumar Jha, University of Allahabad, India
Reviewed by
Sughosh Madhav, Jamia Millia Islamia, India
Sandeep K. Gautam, University of Delhi, India
Ashtosh Tripathi, Nagaland University, India
Updates
Copyright
© 2025 Bhushan, Patel, Kumar, Pandey, Kumar, Kumar and Tiwari.
This is an open-access article distributed under the terms of the Creative Commons Attribution License (CC BY). The use, distribution or reproduction in other forums is permitted, provided the original author(s) and the copyright owner(s) are credited and that the original publication in this journal is cited, in accordance with accepted academic practice. No use, distribution or reproduction is permitted which does not comply with these terms.
*Correspondence: Ashwani Kumar Tiwari, ashwani.enviro@gmail.com; ashwaniktiwari@jnu.ac.in
Disclaimer
All claims expressed in this article are solely those of the authors and do not necessarily represent those of their affiliated organizations, or those of the publisher, the editors and the reviewers. Any product that may be evaluated in this article or claim that may be made by its manufacturer is not guaranteed or endorsed by the publisher.