 Danieli Mara Ferreira1
 Rosane Barbosa Lopes Cavalcante2
 Gabriel Negreiros Salomão2
 Paulo Rógenes Monteiro Pontes2*
- 1Sistema de Tecnologia e Monitoramento Ambiental do Paraná, Curitiba, Brazil
- 2Instituto Tecnologico Vale Desenvolvimento Sustentavel, Belém, Brazil
Water quality monitoring provides essential insights into the health and safety of water resources in a watershed. This study presents a comprehensive analysis of water quality spatial and temporal trends in the rivers of Minas Gerais, Brazil, from 1997 to 2022. For this aim, we use 258,233 samples from 675 water quality stations monitored by the Minas Gerais Institute for Water Management (IGAM). The study evaluates the risk of exceeding the established limits for class 2, as defined by a national guideline (CONAMA 357/2005). The analysis includes water quality parameters representing organic matter, nutrients, and metals related to agriculture runoff, urban and mining activities, and vegetation cover. The spatial–temporal changes in water quality are evaluated using exploratory data analysis techniques the machine learning Extra Tree regressor method, and the Theil-Sen non-parametric trend estimator. As an example, the Extra Trees regressor provided a reliable adjustment for total arsenic, yielding a mean absolute error of 0.002 mg/L. The results indicate that, while median concentrations have declined over the 25-year period, exceedance frequencies remain substantial for Mn, Fe, and TP. The results also indicate a higher risk of limit transgressions during the rainy season, underlining the importance of controlling diffuse sources and understanding hydrological processes. Using surrogate monthly mean flow, the Extra-Trees regressor ranked flow as the most important predictor among the tested variables, followed by urban infrastructure and areas with high metal content. The role of forest cover in reducing the risk of transgressions is also emphasized. In this sense, the study provides valuable insights to support decision-making for pollution control and remediation efforts to guarantee water quality safety. This study uniquely combines robust, non-linear statistical modeling with a 25-year water quality dataset in Minas Gerais, offering new insights into long-term environmental changes in a socially and economically important region.
1 Introduction
1.1 Research problem
Rainfall drains pollutants to rivers after interacting with land use and cover (e.g., forest and deforested areas, agriculture, industry, and urban areas), influencing the water quality and biological processes (de Mello et al., 2018; Vörösmarty et al., 2010; Zanin et al., 2024). Streams in pasture-dominated watersheds might have higher total nitrogen concentrations, which may decrease water quality. Oppositely, streams within forested watersheds and large riparian vegetation may have more macroinvertebrate diversity and protected communities of fish (Tanaka et al., 2016), in addition to controlling soil erosion and improving water quality in streams (Monteiro et al., 2016; Panagos et al., 2015). Also, the water quality changes during different seasons (Xu et al., 2019). For instance, it is expected a decrease in point source dilution capacity during dry periods (low flows; Carpenter et al., 1998). Critical water quality related to diffusive sources is expected during storm periods (Carpenter et al., 1998).
Long-term water quality monitoring is essential for tracking the effectiveness of planning and monitoring measures, identifying emerging trends, and adapting strategies to the expected dynamic changes over time and space (e.g., Fu et al., 2023). Besides, water quality studies need to adopt a multi-scale approach, such as watershed scale, which better explains variability in water quality patterns (de Mello et al., 2018).
Exploratory data analysis (EDA) combines visual and numerical techniques to gain meaningful insights from the data. It has been widely used to gain an overview of water quality patterns in terms of spatial and temporal variations, as well as correlations between water quality variables and relevant factors such as land cover and land use (e.g., Gorgoglione et al., 2020; Wang et al., 2023; Castrillo and García, 2020). The EDA encompasses from basic descriptive statistics to complex machine learning techniques. The Extra Tree and random forest regression are examples of machine learning methods that may be used to assess the water quality and its relationship with land use and hydrological features (e.g., Marani and Nehdi, 2020; Asadollah et al., 2021; Wasko et al., 2020; Fu et al., 2023).
Recent studies have further expanded the scope of machine learning applications in hydrology. For instance, transformer-based and representation learning approaches have been proposed for cross-basin prediction tasks (Zheng et al., 2025), while hybrid ensemble strategies, such as ExtraTrees combined with AdaBoost, have been explored for salinity forecasting in estuarine systems (Yousefi et al., 2024). These contributions highlight the diversity of methodological developments currently underway. Our work differs by focusing on interpretability and the statewide scale, combining Extra Trees with Theil–Sen trend analysis to provide insights across 25 years of monitoring in Minas Gerais.
In a recent review of the relationship between land use and surface water quality, Cheng et al. (2022) point out that most studies focus on river reaches, riparian zones, and sub-basins and that the research methods primarily include correlation and redundancy analysis, the Soil and Water Assessment Tool (SWAT) model, Geographically Weighted Regression (GWR) model, or multiple linear regression. Principal Component Analysis (PCA) is also a linear method frequently used to achieve this goal (Cruz et al., 2019; Gorgoglione et al., 2020). Still, Cheng et al. (2022) acknowledge that accurately establishing the relationship between land cover/land use and water quality is challenging due to hydrological properties, soil structure, and seasonal and historical land use patterns. Therefore, the regression methods employed in this study contribute to this matter by addressing non-linear aspects and dealing with skewed data.
Despite studies of exploratory water quality data focused on local events, such as mining accidents (e.g., Guimarães et al., 2022; Thompson et al., 2020), and temporal and spatial on a regional scale, long-term and broad-scale assessments are scarce and essential because the impacts of anthropogenic or natural activities can take time to manifest in surface water, and past conditions can leave lasting contamination legacies in the water bodies, as highlighted by Mello et al. (2020). This study evaluates the long-term evolution (1997–2022) of water quality in the Minas Gerais river network, using monitoring data from the Minas Gerais Institute for Water Management (IGAM). The exploratory analysis aims to identify key aspects that may contribute to the risk of exceeding the established limits for protecting the lotic systems, particularly the classification defined for class 2 by the CONAMA n°357/2005 (Brazil, 2005). The study focuses on discussing the role of land cover and river flow in the spatial–temporal changes in water quality, as these factors can impact the pollutant loads entering water bodies and their behavior within them (Gorgoglione et al., 2020).
Therefore, the main objectives of the exploratory data analysis can be summarized as follows: (i) verify data integrity and understand the water quality overall behavior, including central tendency and extreme values, through descriptive statistics, (ii) demonstrate if water quality has improved over the years, using the Theil–Sen slope estimator, (iii) identify regions and periods (dry or rainy season) with a higher risk of threshold transgressions, comparing risk coefficients, (iv) determine the role of land cover types and river flow in the concentration of pollutants in river water using Extra Trees regression to evaluate feature importance, and (v) identify parameters of greater concern by analyzing the frequency of exceedances relative to environmental standards. Therefore, land cover and river flow act as pressures/drivers, water quality indicators represent the state, and observed long-term changes provide evidence relevant for management responses; it should be noted that discharge data are limited, and surrogate monthly averages were used to approximate flow. This comprehensive analysis may support decision-making and policy formulation by identifying hotspots, analyzing trends over time, and providing a holistic understanding of water quality dynamics.
Despite previous studies on water quality in Minas Gerais, most analyses are limited to short-term periods, small spatial scales, or conventional statistical methods, leaving a gap in understanding long-term, statewide trends using modern data-driven approaches. Previous regional assessments rarely leverage machine learning techniques or robust trend estimators to account for non-linearities and outliers in the data, limiting their predictive and explanatory power. Our study compiles an extensive dataset of 675 monitoring stations and 258,233 measurements spanning 25 years, providing a uniquely comprehensive view of water quality dynamics across Minas Gerais. The novelty of this work lies in combining Extra Trees Regressor with Theil–Sen trend analysis to deliver a robust, multi-decadal, machine-learning-driven assessment of long-term water quality changes in a socially and economically critical region.
1.2 Study area
Figure 1 presents Minas Gerais state, which is the Brazil’s fourth largest state (586.528 km2, similar to France and Kenya), with a population estimated at 20,538,718 inhabitants (IBGE, 2022). Almost 30% of the population is concentrated in the metropolitan area surrounding the capital city, Belo Horizonte. The state is responsible for the third-largest gross domestic product in the country, emphasizing agricultural activities and mineral extraction (FJP, 2022). The region has one of Brazil’s most important mineral provinces, the Iron Quadrangle, accounting for 65% of the national iron and steel production (Haddad et al., 2021). Furthermore, it is densely populated, particularly in the metropolitan area surrounding the capital city, Belo Horizonte. In this context, the state serves as a representative case study for many regions worldwide, where surface water quality is affected by complex relationships and multiple land and water use. Therefore, analyzing water quality data becomes a crucial tool for guiding pollution control and remediation efforts undertaken by governmental and industrial sectors. Figure 1 also presents the land use and geology over Minas Gerais state and the precipitation (annual and seasonal patterns). The land use classes were obtained from MapBiomas project and the precipitation from CHIRPS (1981 to 2024).
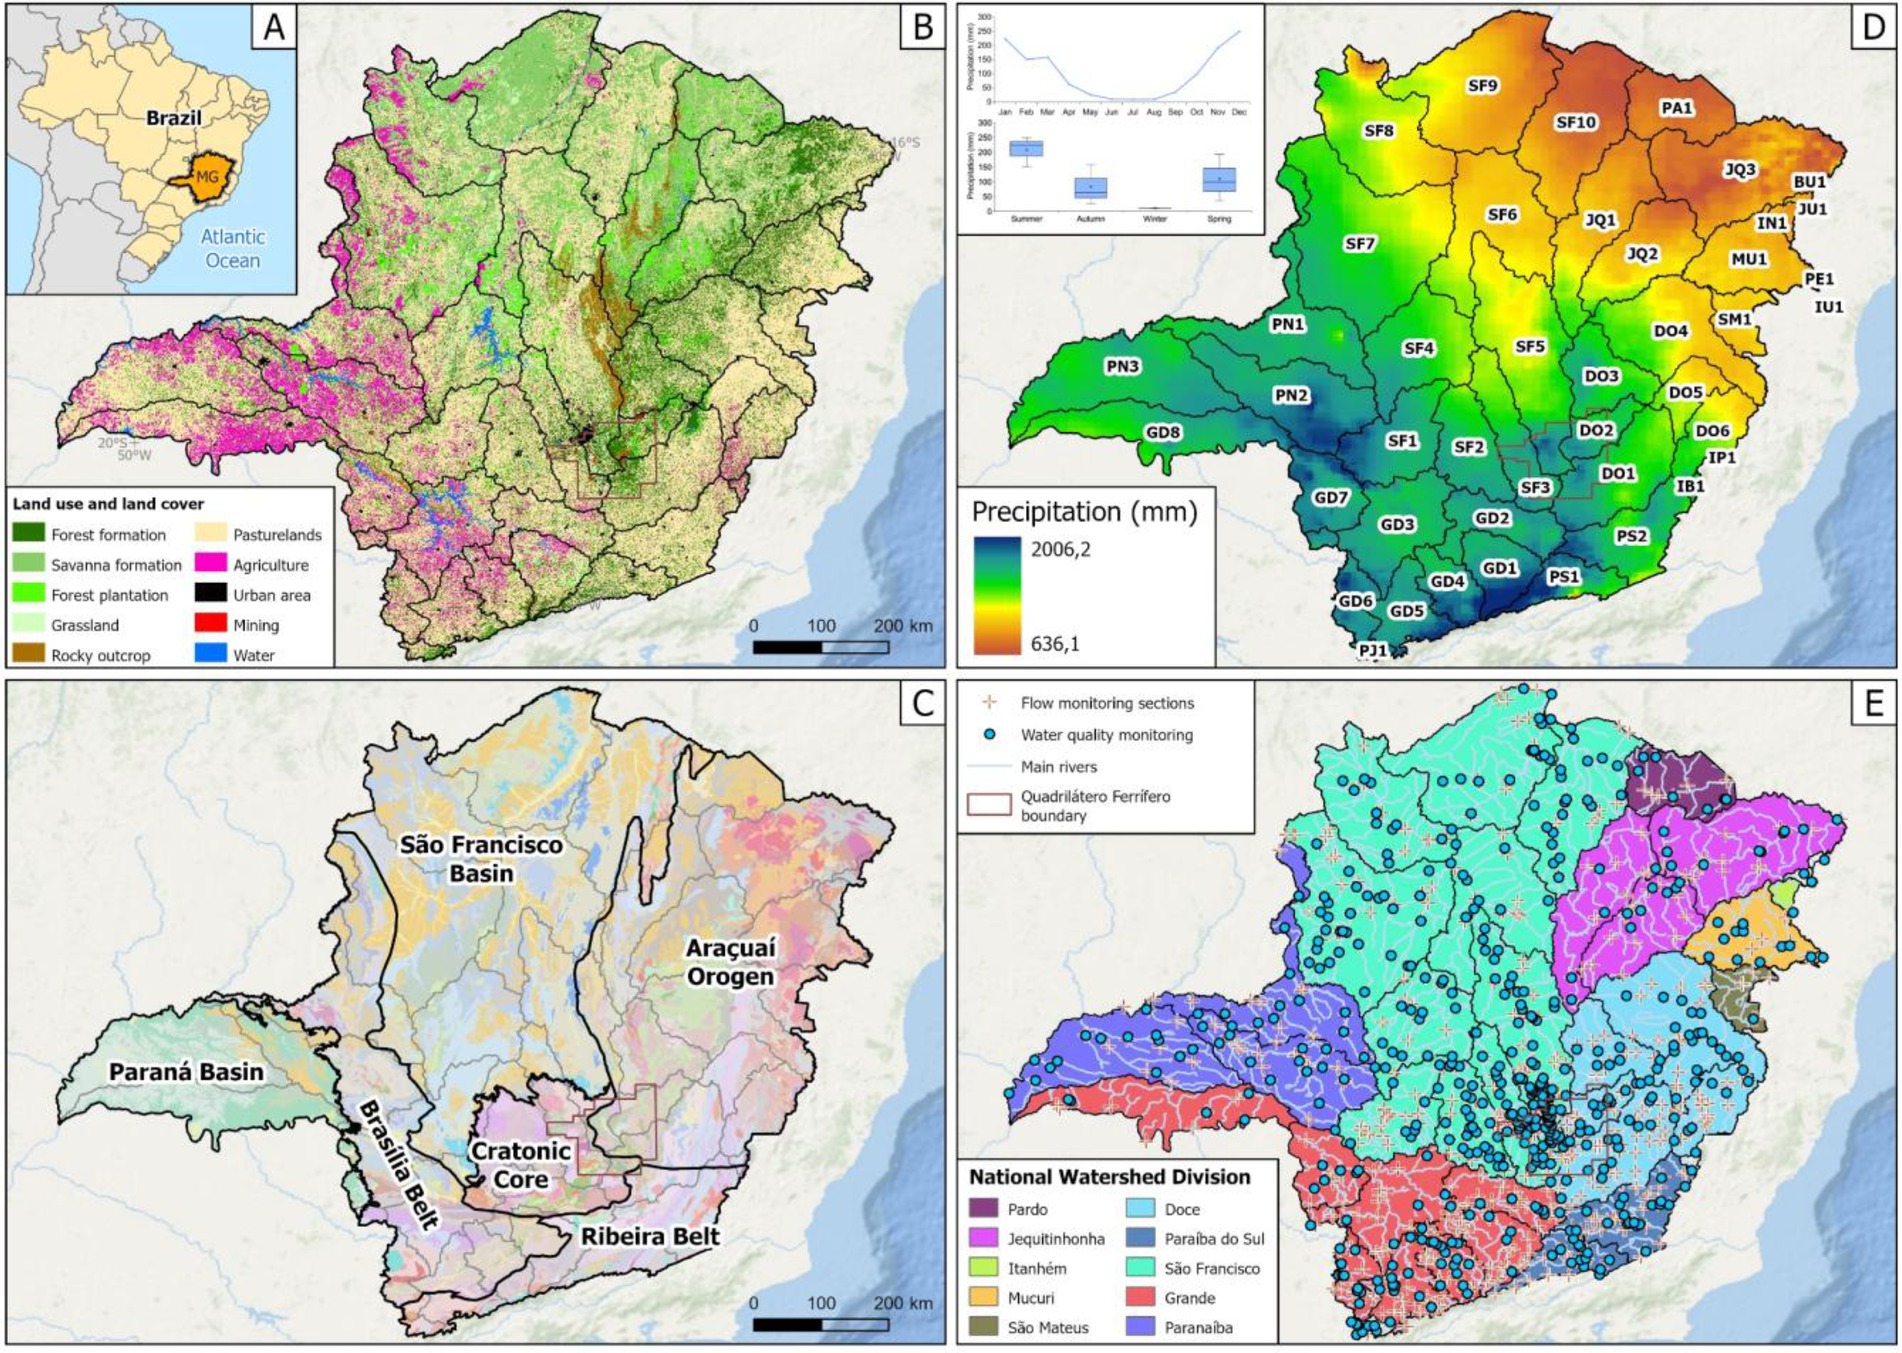
Figure 1. Map indicating the location of Minas Gerais and Brazil (A); land use (B); geology (C); mean annual and seasonal precipitation (D); and its sub-basins, river network, and monitoring stations (water quality and flow) (E).
2 Materials and methods
The material and methods employed in this study are designed to systematically analyze water quality dynamics and their relationship with river flow and land cover. We use statistical metrics, feature importance assessment, risk analysis, seasonal variation, trend analysis, and spatial–temporal variation evaluation to gain insights to support informed decision-making in the watershed scale.
2.1 Data sources
The Minas Gerais Institute for Water Management (IGAM) has been actively monitoring surface water quality in the state since 1997, providing a valuable historical dataset for various parameters. The dataset employed in this study comprises monthly data collected from 675 monitoring stations spanning 381 rivers across the state (Figure 1). The analyzed dataset includes a total of 35,019 for dissolved iron (Fe), 34,118 samples for total manganese (Mn), 26,021 samples for total arsenic (As), 33,784 samples for total lead (Pb), 43,019 samples for biochemical oxygen demand (BOD), 43,000 samples for total phosphorus (TP), and 43,272 samples for turbidity. According to IGAM, the network is strategic, with sampling locations at the boundaries between states, confluences of water bodies, and sites with known or potential quality impacts.
The territory of Minas Gerais was divided into 36 units for water resource planning and management (UPGRH) by the State Council of Water Resources CERH-MG, 2002, as illustrated in Figure 1. The influence of land use cover (LULC) and flow on river water quality was considered at the catchment scale because this approach is often a better predictor of water quality than only in the riparian zone, as stated by Mello et al. (2020).
A water quality class is a set of conditions and standards necessary to meet the preponderant uses, current or future. Class 2 is for river water that can be used for human consumption after conventional treatment, protection of aquatic communities, primary contact recreation, irrigation, aquaculture, and fishing activities. To be classified as class 2, it must comply with a lot of water quality criteria, including: dissolved iron (≤ 0.3 mg/L), total manganese (≤ 0.1 mg/L), total arsenic, and total lead (≤ 0.01 mg/L each), biochemical oxygen demand (≤ 5 mg/L), total phosphorus (≤ 0.1 mg/L), and turbidity (≤ 100 NTU).
To investigate seasonal variations, particularly during rainy (October–March) and dry periods (April–September), flow data from monitoring stations across the state are utilized (ANA, 2022).
The LULC data is obtained from Map Biomas (2021), following the suggested level of division by this database: forest encompasses forest and savanna formations; agriculture includes a variety of cultivations (sugar cane, citrus, cotton, soybeans, and coffee), forest plantation, pasture, mosaic of agriculture and pasture, other perennial crops, and mosaic of crops.
2.2 Exploratory data analysis methods
2.2.1 Data description
After collecting the data, the data cleaning phase primarily focused on rectifying the identification of sampling points, including latitude, longitude, and subbasin names. Statistical metrics of central tendency, dispersion, and asymmetry describe the concentration dataset. Central tendency metrics, such as the mean or median, indicate the average or typical value around which the concentrations cluster. Dispersion metrics, such as the standard deviation, quantify the spread or variability of the concentrations. Asymmetry metrics, such as skewness, assess the departure from symmetry in the concentration distribution.
Furthermore, the study calculates the percentage of samples that exceed the class 2 water quality standards. This analysis determines the proportion of samples that surpass the established thresholds for various parameters, indicating potential non-compliance with water quality guidelines.
2.2.2 Feature importance analysis
A feature importance analysis was conducted using the Extra Tree regressor algorithm to assess the influence of land cover areas and river flow on water quality parameters. The analysis aimed to determine each feature’s relative importance (score) in predicting pollutant concentrations.
The Extra Tree regression algorithm employs decision trees and ensemble learning techniques (Asadollah et al., 2021). In each ensemble tree, a random subset of features is considered when splitting nodes. This random selection of features introduces diversity among the trees, mitigating overfitting and enhancing the model’s robustness. By only considering a subset of features at each split and aggregating predictions from multiple trees, the algorithm also reduces the impact of outliers. Since the method introduces additional randomness when selecting feature splits, the impact of multicollinearity is mitigated, which is an advantage compared to traditional regression models.
The model is fitted with land cover areas (agriculture, forest, mining, urban infrastructure) and river flow as the independent variables and the corresponding target as the dependent variable. Because flow data is not available simultaneously with concentrations, the discharge corresponding to each sample was defined as the average value for each month of water quality sampling, encompassing all monitoring stations within the sub-basin.
In general, model hyper-parameter tuning significantly affects the feature importance (Marani and Nehdi, 2020). Hyperparameters are the parameters set before the learning process, found in this study using Bayesian optimization and cross-validation concepts (Pedregosa et al., 2011). This approach iteratively explores the search space based on previous evaluations, building a probabilistic model of the objective function (e.g., model performance metric). The cross-validation process, in its turn, splits the available data into multiple subsets (folds), then it trains and evaluates the model multiple times, each time using a different combination of training and validation sets. Although model performance is not the focus of this study, these techniques increase the model’s generalization ability and ensure reliable results; performance metrics are presented in the Supplementary material.
2.2.3 Risk of threshold exceedance
To evaluate the extent to which the limits for class 2 are exceeded within the water quality series in Minas Gerais, the monitoring concentrations are compared to the thresholds using the ratio C/Clim. Here, C is the pollutant concentration in the water column (mg/L) and Clim denotes the limit concentration defined by national regulations (Brazil, Pub, 2005). This relationship establishes the risk quotient (RQ), where RQ ≥ 1 indicates that the observed concentration exceeds the limit and signifies the risk of transgression. This quotient is commonly employed in studies associated with ecotoxicological assessments (e.g., Viana et al., 2021).
2.2.4 Seasonal variation analysis
The seasonal variation analysis compares monthly RQ and the state’s flow conditions. Box plots of RQ are grouped by month for each pollutant of interest. This approach depicts a comparison of medians, interquartile ranges, and outliers.
2.2.5 Trend analysis
Trends of pollutant concentrations, river flows, and land cover areas (target variables) are evaluated over the study period. Like the approach used in the feature importance analysis, flow data is incorporated by considering the average value for each month of water quality sampling. This average value is derived from the data collected across all monitoring stations within the respective UPGRH, available at ANA (2022).
Firstly, the median of each target variable (Y, including concentrations of water quality parameters, land cover areas, and river flow) is calculated for each year within each sub-basin. After sorting the dataset by year, a Theil-Sen Regressor model is fitted using the years as the independent variable (predictor, X), and the corresponding target variable as the dependent variable. This fitted line captures the overall direction and magnitude of the relationship. The model parameters are defined similarly to the approach used in the feature selection phase, employing Bayesian search and a time series cross-validation technique from the sklearn Python library.
The slope of the regression line represents the trend over time, providing a measure of how the target variable (Y) changes in response to changes in the independent variable (X). Positive or negative slopes indicate increasing or decreasing trends over the years. According to Fu et al. (2023), the method is particularly useful for handling skewed and heteroskedastic data; furthermore, compared to simple linear regression, it can provide significantly more accurate results.
To assess whether the observed trend holds statistical significance (i.e., if the change in median over the years is statistically significant or if it remains unchanged), a t-statistic was computed. We established a significance level of 0.05, with degrees of freedom equal to n - 2 (where n is the number of observations in the sample), and then calculated a p-value using the two-tailed t-distribution and the t-statistic value. If the p-value is less than the chosen significance level, the null hypothesis is rejected, indicating that the slope significantly differs from zero. Additionally, statistical significance was evaluated with the Yue–Pilon modification of the Mann–Kendall test, as presented in the Supplementary material.
2.2.6 Spatial–temporal variation analysis
To assess the spatial–temporal variation of RQ and land cover areas, maps depicting the median values are generated for every 5-year interval throughout the study period. The median RQ values of the river stations are organized into sub-basins, visually represented using a color scale. The selection of the median as the metric of interest is motivated by its ability to capture the central tendency of water quality behaviors. By focusing on the median, the potential influence of outliers is mitigated, allowing for a more robust assessment of the overall water quality within each sub-basin.
These maps provide insights into the spatial distribution and changes in pollutant concentrations and land cover classes over time, enabling the identification of areas with higher or lower levels of pollutants and changes in land cover patterns.
3 Results and discussion
Statistical metrics provide a detailed data description, capturing variability and distribution patterns. The feature importance analysis using the Extra Tree regression depicts the contributions of river flow and land cover in influencing water quality concentrations. Seasonal variation analysis highlights the effect of dry and rainy seasons on the risk of threshold exceedance. Trend analysis using Theil-Sen regression reveals long-term trends, indicating whether the variables increase, decrease, or stabilize over time. Lastly, spatial–temporal variation analysis maps the risk of threshold exceedance and land cover evolution. Together, these results provide a comprehensive understanding of long-term water quality dynamics in Minas Gerais, supporting effective management strategies for sustaining healthy aquatic ecosystems.
3.1 Data description
The dataset utilized in this study comprises 258,233 samples, including 35,019 for dissolved Fe, 34,118 for total Mn, 26,021 for total As, 33,784 for total Pb, 43,272 for turbidity, 43,000 for Tp, and 43,019 for BOD (Table 1). Furthermore, the dataset encompasses discharge and land use and cover.
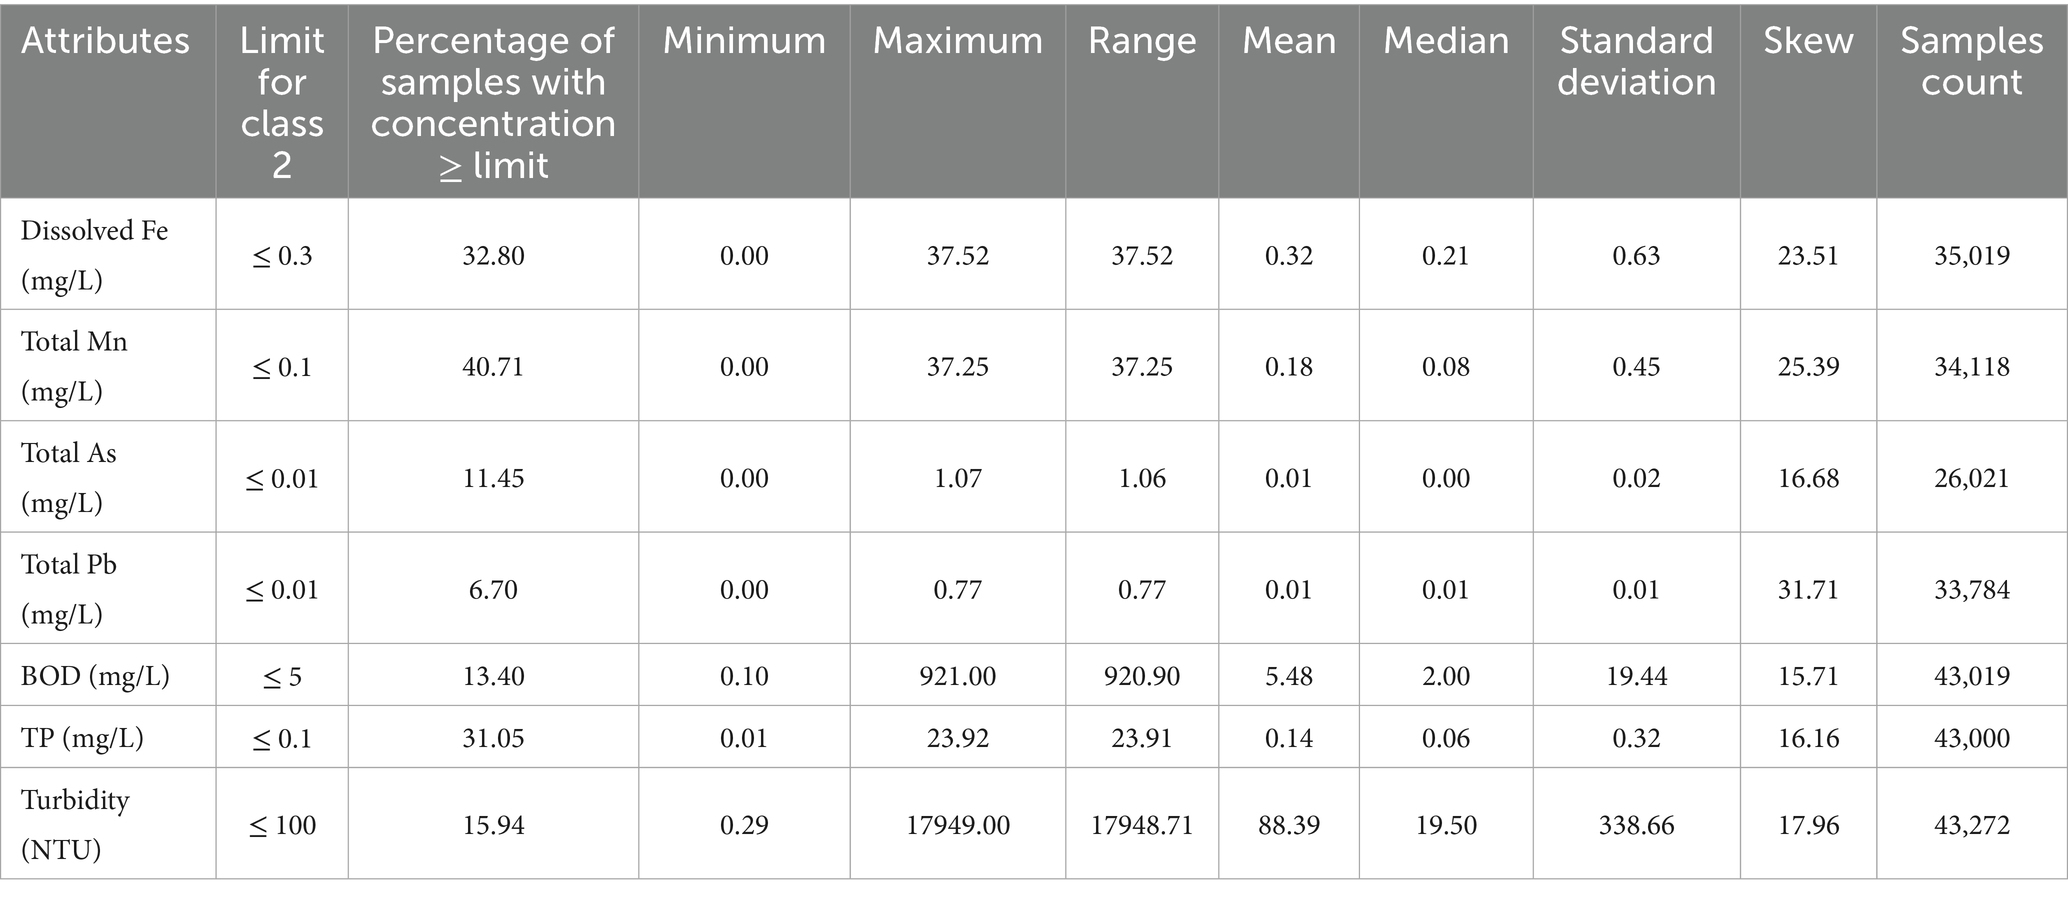
Table 1. Statistical metrics of water quality parameters monitored from 1997 to 2022 (IGAM, 2022).
These parameters were selected to reflect the effects of prominent anthropic or natural activities in the state, such as urban occupation, mining, and agriculture. Land cover areas and river flow are key practical aspects that watershed managers can effectively control to mitigate pollution and ensure water quality. This process may involve, for instance, implementing practices to reduce soil erosion and promote natural filtration and employing flow regulation, sediment control, and sustainable drainage solutions.
The samples show high asymmetry and extreme maximum values for all water quality parameters (Table 1). Positive skewness is observed, ranging from 15.71 for BOD to 31.71 for total Pb. These findings indicate a significant departure from a normal distribution, with a greater concentration of values around the mean and outliers in the dataset. These deviations of water quality data from common probability distributions, such as normal and lognormal distributions, are often found (Lettenmaier et al., 1991; Helsel et al., 2020). Several factors can explain the high ranges and skewness, such as natural and anthropogenic variability, non-linearity of geochemical processes, and problems related to data collection and detection limits (Helsel, 2006; Hirsch et al., 1982; Vega et al., 1998; Withers and Jarvie, 2008).
Among the analyzed parameters, 31% of the samples exceeded the thresholds for total phosphorus, 13% for BOD, and 16% for turbidity. Regarding metals, total Mn and dissolved Fe exhibited the highest frequency of exceedances at 41 and 33%, respectively; this is likely due to persistent sources, slow metal release from sediments, or limited effectiveness of current mitigation measures. Except dissolved Fe, total Mn and Turbidity, the median values of all attributes are according to typical wastewater values (Gaillardet et al., 2003). However, it is worth noting that despite these critical events, the median concentrations for all parameters remained below the limits specified for class 2 water quality.
3.2 Seasonal variation and risk of threshold exceedance
The risk quotient for each sample was meticulously calculated and then grouped by month, considering all the monitoring points. The results, as depicted in Figure 2, offer valuable insights into periods with a heightened risk of exceeding limits. The figure also illustrates the monthly flows, calculated based on discharges recorded between 1997 and 2022 across the state. This comparison is crucial, given the interplay between discharge and concentrations. Variations in water discharge can have an impact on temporal fluctuations and changes in the probability distribution of chemical concentrations within a stream (Antonopoulos et al., 2001; Helsel et al., 2020).
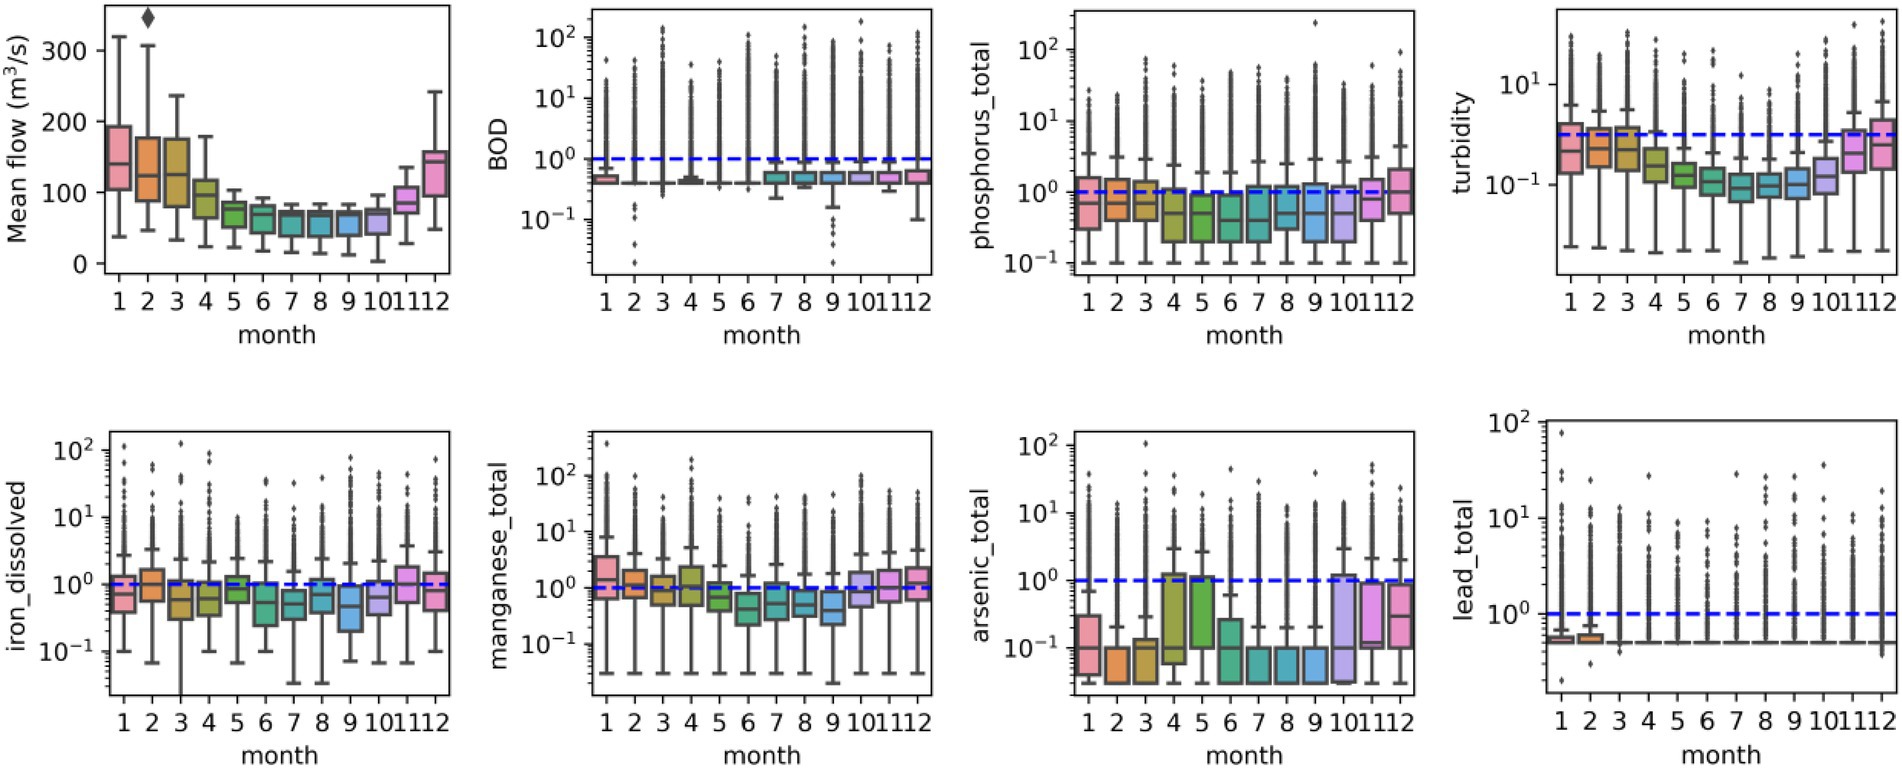
Figure 2. Risk quotient and flow by month in Minas Gerais (the dashed blue line indicates RQ = 1; values > 1 indicate concentrations larger than the threshold for class 2).
The results reveal a distinct pattern: during the rainy season (October to March), when the median flow fluctuates from 70 m3/s in October to 143 m3/s in December, there is a pronounced risk of threshold exceedance (i.e., RQ ≥ 1) for turbidity, TP, dissolved Fe and total Mn. The median RQ for dissolved Fe is particularly noteworthy, nearing 1 in February and November, with a minimum of 0.5 in July. Total Mn exhibits the highest median RQ in January (1.4) and December (1.2), with a minimum of 0.4 in June and September. December emerges as the month with the highest risk for TP, with a median RQ of 1; the months with decreased risk were June and July, with a median RQ of 0.4. Turbidity shows higher median RQ values during December (0.62) and February (0.53), with a smaller value in July (0.09).
The median RQ for arsenic remains close to 0.1 throughout most of the year, indicating that median concentrations are only 10% of the limit for class 2. Similarly, the median of RQ for total Pb and BOD is 0.5 and 0.4, respectively, indicating that the central tendency of concentrations remains close to 50% of the threshold for class 2 in the case of Pb and 40% of the limit of BOD.
Critical events are not limited to specific times of the year, as evidenced by extreme cases where maximum RQ values reach as high as 200. Severe water quality impacts attributed to point source pollution typically manifest during summer or dry periods when river flows are low, diminishing the dilution capacity, and during storm periods when combined sewer overflows operate more frequently (Carpenter et al., 1998). Conversely, the critical water quality impacts stemming from diffuse source pollution tend to occur during storm periods, particularly after a dry spell, when rainfall triggers hillslope hydrological processes and the runoff of pollutants from the land surface (Carpenter et al., 1998). Considering that the transgression limits are generally higher during the rainy season in Minas Gerais, these results emphasize prioritizing the control of diffuse sources to manage surface water pollution effectively.
The relationship between river flow and parameters such as BOD, Pb, and As in Figure 2 did not exhibit a linear correlation. BOD, Pb, and As sources in rivers can be diverse, including both natural and anthropogenic origins, which may not be directly tied to flow rates. Additionally, these parameters’ spatial and temporal variability can be influenced by localized sources and processes, detaching them from flow dynamics. Furthermore, the transformation and degradation processes that BOD, Pb, and As undergo within the river system can be influenced by biological, chemical, and sediment-water interactions, making their relationship with flow rates complex.
3.3 Influence of land cover and river flow on pollutant concentrations
Figure 3 presents the results of the feature importance analysis conducted using the Extra Tree regressor; a threshold of 0.10 was adopted to interpret feature importance, since values below this level likely reflect noise rather than meaningful contributions. The findings indicate that river flow was ranked highest in feature importance (however, this reflects correlation with the monthly, sub-basin-average surrogate flow rather than synchronous discharge and should not be interpreted causally), followed by urban infrastructure and mining areas.
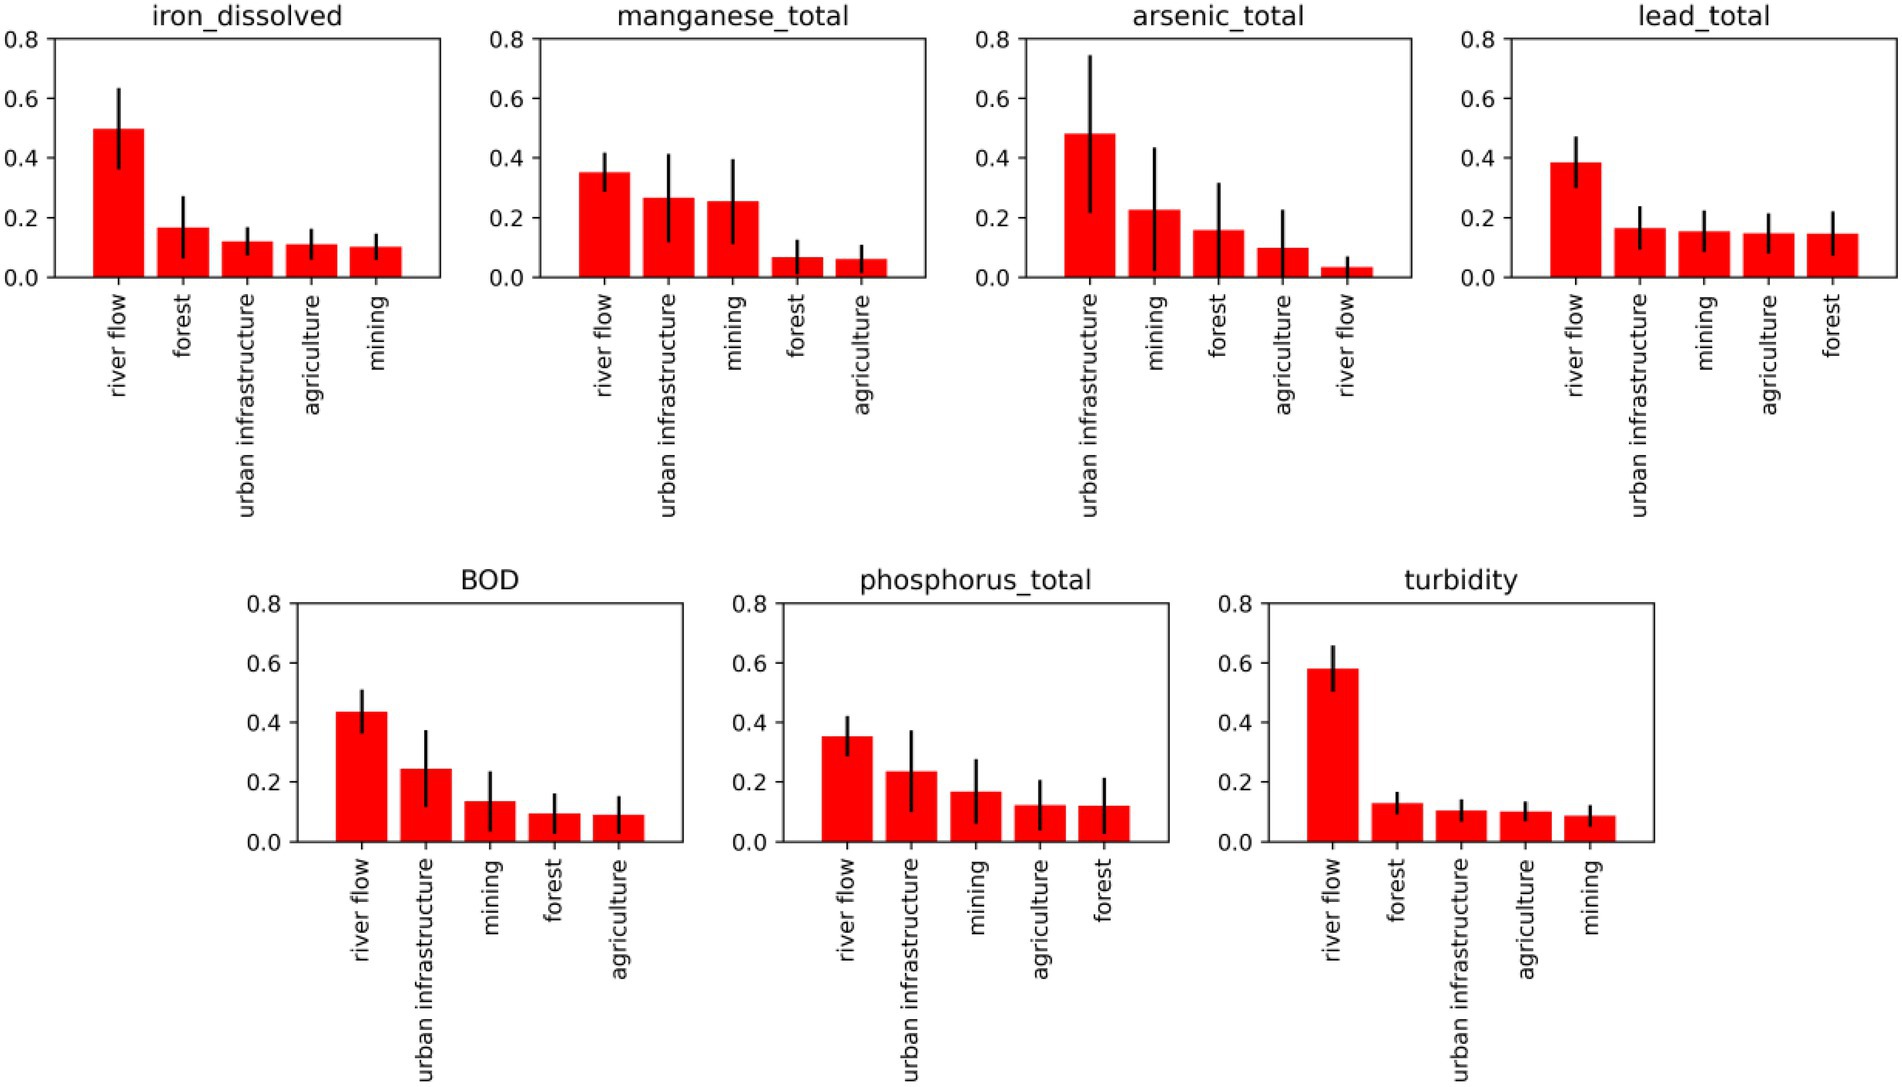
Figure 3. Importance of land cover areas and flow over concentrations; the vertical axis represents the feature importance score, estimated with the Extra Tree regression method; the error bar is a standard deviation that indicates how much the values might vary across different decision trees in the ensemble.
River flow plays a crucial role in the transport, dilution, and dispersion of pollutants within the river system, facilitating the mixing of different water masses and influencing chemical reactions that can alter the composition of pollutants. Additionally, river flow is closely linked to sediment transport, which affects the fate and transport of sediment-bound pollutants, including metals (Ferreira et al., 2023; Xue et al., 2022).
However, it is essential to acknowledge that the distribution of pollutants in rivers is a complex outcome influenced by various physical, chemical, and biological processes. Factors such as soil type, geology, vegetation cover, geomorphological features, point sources of pollution, atmospheric deposition, human activities, and hydrological and hydrochemical processes all contribute to the overall concentration of pollutants (Hill and Neal, 1997). Other features not evaluated in this study (e.g., pH, temperature, conductivity etc) might play significant roles in pollutant concentration dynamics (Peng et al., 2021). Additionally, because discharge for each sample was defined as the monthly average across all sub-basin monitoring stations, spatial and temporal mismatches may alter correlations.
Nonetheless, the findings from this study emphasize the importance of monitoring both discharge and pollutant concentrations. Effective pollution control measures need to address the contributions from urban and mining areas, as they have been identified as key factors influencing river pollutant concentrations. These findings align with previous research conducted in Brazil, where studies have shown that urban occupation and mining (although they represent a small percentage of the territory) are among land uses with substantial impacts on water quality (Mello et al., 2020).
Although the relationship between river flow and parameters such as BOD and Pb did not exhibit a clear behavior when comparing monthly boxplots (Figure 2), the feature importance analysis showed that river flow significantly affects these concentrations. This highlights the importance of employing non-linear methods such as the Extra Tree regression in understanding and predicting river pollutant concentrations.
The models were also evaluated preventing temporal and spatial leakage using blocked TimeSeriesSplit and GroupKFold by station. For each target, the fold-averaged performance metrics (Coefficient of determination: R2, Mean Absolute Error: MAE, and Root Mean Squared Error: RMSE; mean ± standard deviation: SD) are presented in the suplementary material. In addition, per-fold permutation feature importance was computed, and quantified the stability of feature rankings across folds using Kendall’s τ. Additionally, tests for turbidity and BOD transformed using log1p were added.
Model performance under blocked temporal and spatial cross-validation revealed that predictive skill was generally low for several targets, with small or slightly negative R2 values. Permutation feature importance identified river flow and mining as recurrently relevant predictors, though stability across folds (Kendall’s τ) varied by target. For variables not meeting the ideal threshold, results are presented for transparency but interpreted cautiously.
3.4 Yearly trend of the variables
Supplementary Table 2 presents the average change in median concentrations, land cover area, and median river flow per year over the 25-year period (the red font color indicates a negative slope, i.e., a decreasing trend over the years; the red cells with values accompanied by “*” indicate statistically significant changes). To illustrate the table interpretation, for the sub-basin DO1: dissolved Fe increased by 0.00013 mg/L per year, the flow rate increased by 0.014 m3/s per year, agricultural area decreased by 31.78 km2 per year, and forest area increased by 28.56 km2 per year. Dissolved Fe shows a small rising trend over the years in some sub-basins, from 3.51 × 10⁻⁵ to 0.015 mg/L. Similarly, total As has increased across the State, although the magnitude is relatively less significant for most regions (𝜇g/L). The results generally indicate that changes from 1 year to the next are stable, with negligible changes in the central tendency.
The yearly trend analysis also revealed a few rapid changes in specific sub-basins. For example, the sub-basin GD8 has faced a significant decrease in the central tendency of river flow. These conditions have led the state to recognize the water shortage issues in recent years and to prompt restrictions on water resource uses (e.g., CERH-MG, 2002; IGAM, 2022). Nonetheless, regional perspectives might be attributed to specific events like pollution incidents, sampling timing (for instance, if most samples were collected before a rainfall event, results might be biased), construction of dams and reservoirs, weather patterns, or policy changes.
The analysis of land cover changes reveals that urban infrastructure and mining have expanded over the years, primarily concentrated in the sub-basins SF3 and SF5 (corresponding to the state’s central region). A trade-off has been observed between forest cover and agriculture in some basins. For instance, in the SF6 sub-basin, agriculture has been expanding at a rate of 99.32 km2 per year, while forest cover has been decreasing at 93.6 km2 per year.
It is important to acknowledge that the interpretation of the findings assumes a linear relationship between the year and the variables. Moreover, this interpretation represents an approximate rate of change over the entire study period and may not reflect specific variations or fluctuations within shorter time intervals (i.e., intra-annual variabilities, such as seasonal patterns, are not accounted for—for reference, the Supplementary material presents figures with annual sample counts per period in each sub-basin, highlighting a consistent pattern of similar sample counts between dry and rainy periods across most years).
Annual trends were also estimated using the Theil–Sen estimator with blocked temporal and spatial cross-validation. Residual autocorrelation was checked using ACF and PACF diagnostics (lag 1). Additionally, tests for turbidity and BOD transformed using log1p were included. The results are presented in the excel file as Supplementary material. Despite the high variability at some sites, the non-parametric Mann–Kendall trend analysis was able to corroborate the changes at certain locations. Moreover, although minor residual autocorrelation was observed, its effect on the detected trends is considered minimal.
3.5 Spatial–temporal variation trends: risk quotient and land cover
The spatial–temporal variation in water quality in Minas Gerais was assessed by comparing the median risk quotient (RQ) every 5 years within each sub-basin. Figure 4 illustrates the spatial–temporal variation of the median RQ values, while Figure 5 presents the same for land cover areas (forest, agriculture, urban infrastructure, and mining).
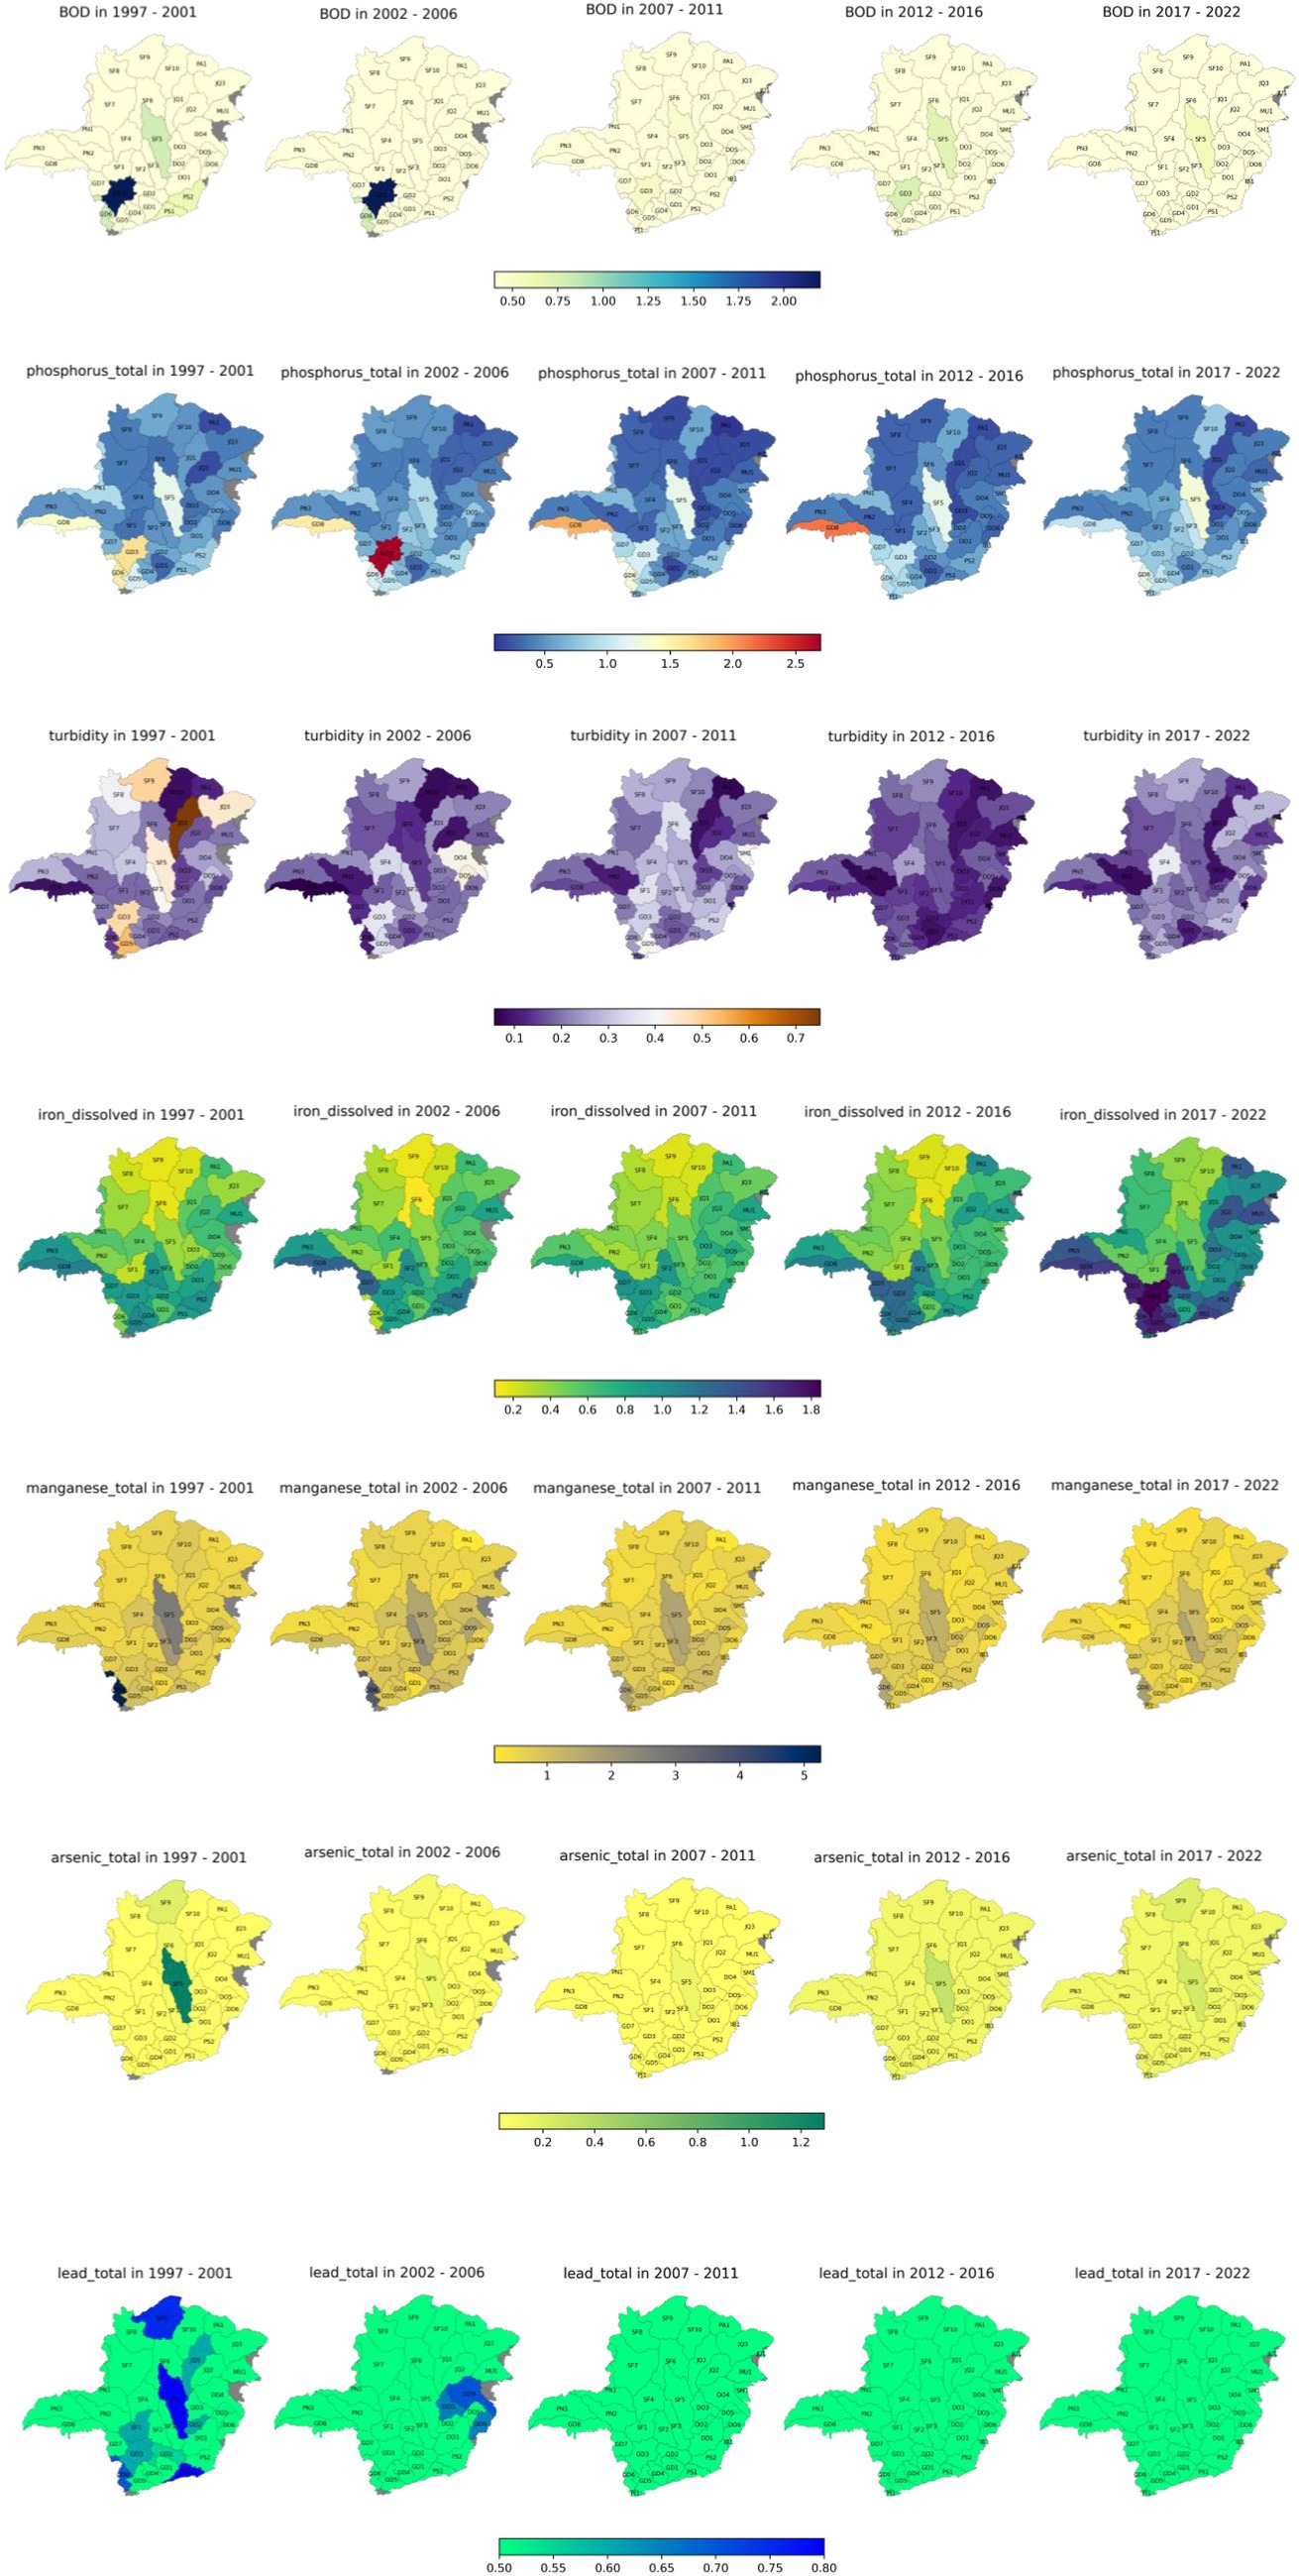
Figure 4. Risk quotient every 5 years in rivers of Minas Gerais; each sub-basin is colored with the median RQ in its rivers (in the gray areas the value was not calculated due to lack of data).
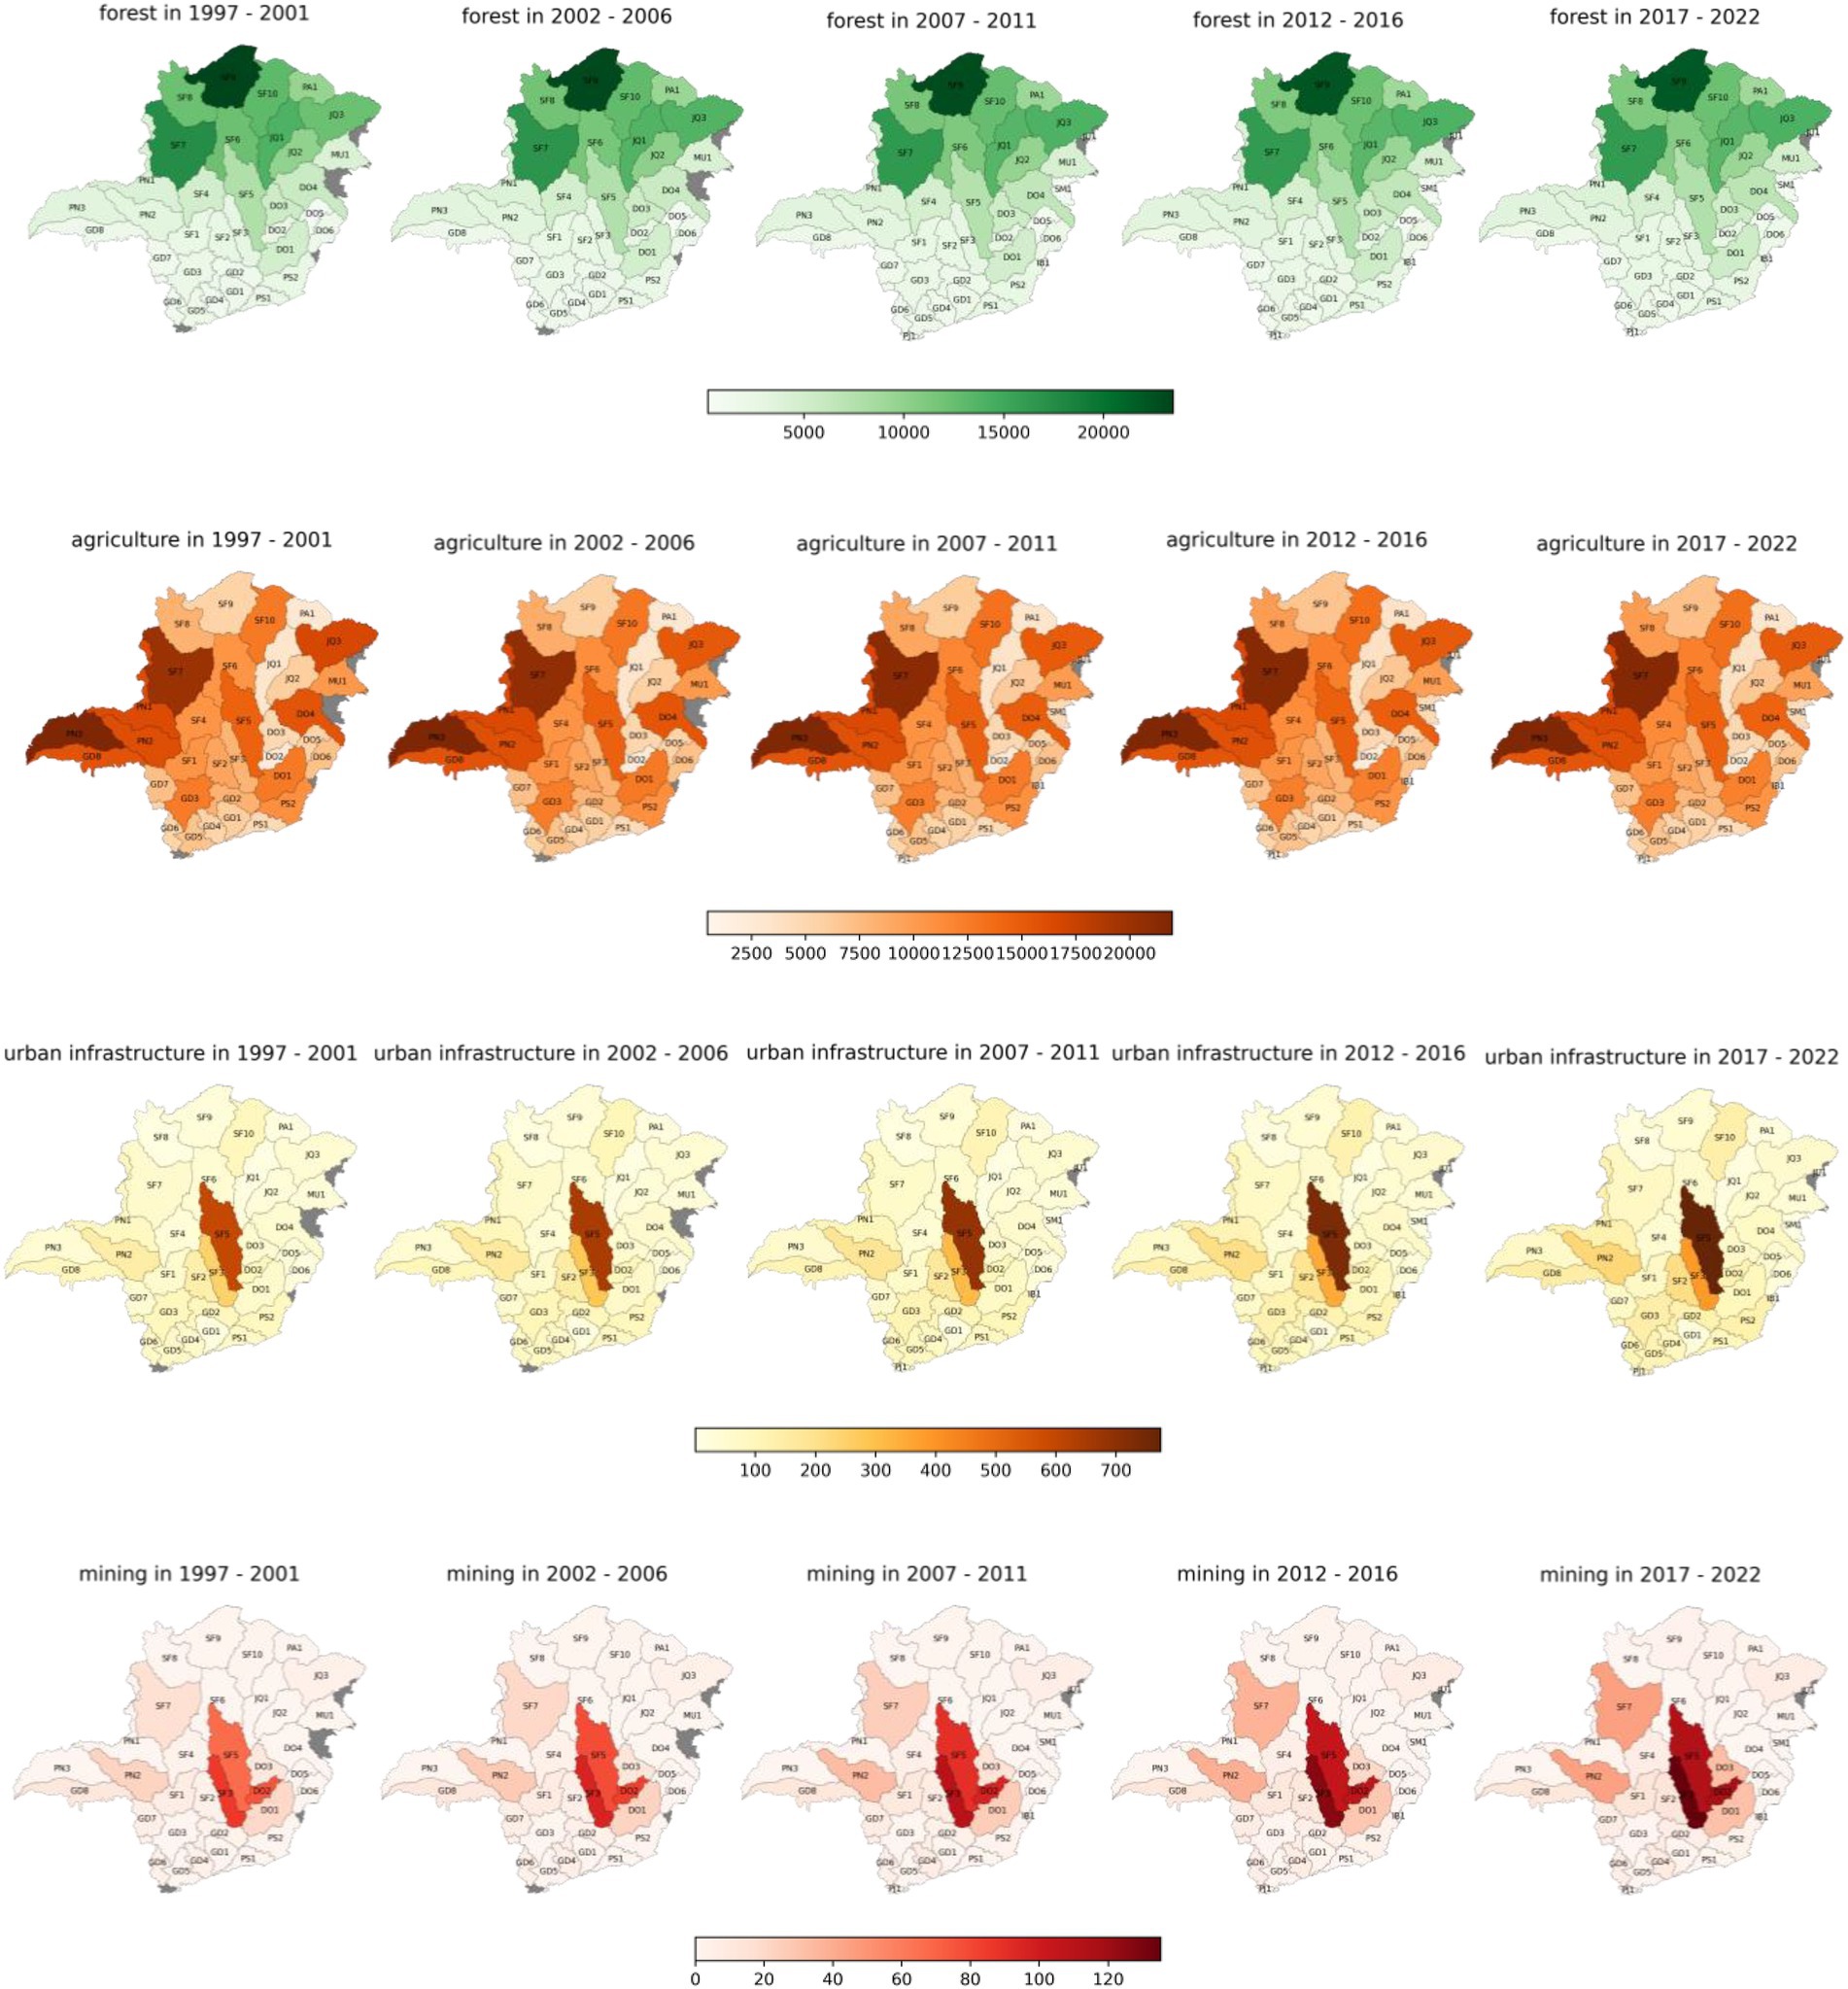
Figure 5. Median land cover area (km2) every 5 years in Minas Gerais (in the gray areas the value was not calculated due to lack of data).
Overall, forest and agriculture, which cover most of the state, have remained relatively stable over the years across most sub-basins. Despite that, the changes over the 25 years were significant in most sub-basins (Supplementary Table 2). However, on a regional scale, land use has changed over time, for instance, the slight increase in the silviculture area in the north of Minas Gerais (Cerrado Biome) between 2000 and 2015 (Espírito-Santo et al., 2016).
There has been notable growth in urban infrastructure and mining activities, particularly in the central region of Minas Gerais. Despite these land cover trends, there has been an overall decrease in the risk of exceeding thresholds for most water quality parameters throughout the state. This improvement can be attributed to better control of point and diffuse sources that reach the rivers. The study conducted by Pataca et al. (2020) revealed that, although the population of Minas Gerais has grown, the improvement of socioeconomic variables (such as HDI, poorness, and sanitation percentage) has contributed to the improvement of surface water quality in the State.
The median RQ reached maximums of 1.85 for dissolved Fe, 5.25 for total Mn, 1.29 for total As, 2.2 for BOD, and 2.7 for TP; total Pb and turbidity exhibited median concentrations below the limits for class 2, with maximum median RQ of 0.8 and 0.7, respectively.
Notably, dissolved Fe is the only parameter that showed increasing concentrations over the years. The increase in RQ for dissolved Fe was more pronounced in the state’s southern areas rather than in regions with marked urbanization and mining. For example, in the SF9 region (north of the state), the median RQ changed from 0.17 during 1997–2001 to 0.40 during 2017–2022. This change could be attributed to the overall reduction in pH levels in river waters (the mean pH in the state decreased from 7.12 in 1997 to 6.81 in 2021, according to data from IGAM), potentially increasing the solubility of metals and resulting in higher dissolved metal concentrations; nonetheless, other processes (such as mining activity, changes in analytical procedures, and socioeconomic influences) could also play a role. Additionally, a lower risk of transgression for dissolved Fe was observed in the state’s northern region, where forest cover is higher. This can be explained by the fact that vegetation cover helps reduce erosion and sedimentation, regulating the input of iron-rich sediments into the water.
Higher concentrations of total Mn, total As, total phosphorus, and BOD were observed in the state’s center, particularly in sub-basin SF5. However, it is worth noting that the RQ of manganese and arsenic tended to decrease over time in these areas despite the increase in urbanization and mining activities, reinforcing overall improvement in the state’s environmental controls.
Despite some improvements resulting from the recent implementation of sewage collection and treatment methods, the condition of the region is highly affected by domestic and industrial sewage originating in Belo Horizonte (Mello et al., 2020). Moreover, stormwater runoff carrying improperly disposed of garbage, detritus, and toxic substances from the basin into water bodies may also result in water quality impairment. Mello et al. (2020) I further emphasize that, within the Brazilian context, a distinction exists between sewage treatment systems and stormwater drainage systems—only the former undergoes treatment, leaving the latter untreated. Therefore, if urban land use increases without careful planning, it can significantly impact water quality.
Previous studies have also shown that, when hydrological processes are properly accounted for, the apparent influence of land use on water quality may be reduced, although outcomes depend on multiple factors and remain constrained by observational data limitations (Shadmehri Toosi et al., 2025). Flow variability, dilution, and storage can also act as controls on pollutant transport. Recent modeling advances further integrate meteorological predictors to improve water-quality forecasting, highlighting their importance in trend interpretation (Zheng et al., 2025). In Minas Gerais, persistent contaminant inputs from mining and expanding urban areas contribute to chronic pollutant loads and increased runoff from urbanized catchments, reinforcing the detectable influence of land use on water quality in this region.
The state’s central region is under the influence of the Iron Quadrangle, one of the most important mineral provinces in the country. Higher river concentrations in these areas may be attributed to dissolution processes from nearby rocks, which are transported by hydrological fluxes (Moldovan et al., 2022). For instance, da Costa et al. (2015) identified anomalous metal concentrations in stream sediment samples in the Iron Quadrangle due to the natural weathering process of geological materials rather than solely from anthropic interference.
4 Conclusion
Exploratory Data Analysis (EDA) techniques were employed in this study to gain insights into the spatial and temporal variations in water quality of rivers in Minas Gerais. Additionally, the study investigated the impact of land cover and river flow on the risk of exceeding water quality limits. The reference is the national guideline CONAMA 357/2005, that defines class 2 for water bodies safe for aquatic life and suitable for human consumption after conventional treatment.
The water quality data analysis indicated high asymmetry and the presence of extreme values, deviating from normal distribution patterns. Although exceedances of threshold limits were common in the historical series, the median concentrations for all parameters remained below the defined limits for class 2 water quality since 1997. Among the parameters analyzed, metal concentrations exhibited the highest frequency of exceedances for class 2, with total Mn at 41% and dissolved Fe at 33%. TP exhibited a 31% exceedance rate, BOD at 13%, and turbidity at 16%.
The risk quotient analysis demonstrated that the rainy season was associated with a higher risk of threshold transgressions, emphasizing the significance of controlling diffuse sources, which are highly correlated with hydrological processes. The study also employed the Extra Tree regressor to assess the factors influencing pollutant concentrations. River flow was identified as the most influential aspect, followed by urban infrastructure and areas with high metal content. These findings underline the necessity of monitoring flow simultaneously with concentration levels, as the values were approximated to averages in this study; future studies could refine flow estimates using gauge-pair data or hydrological regionalization techniques. Another relevant outcome is that, given that Minas Gerais has one of the largest mineral deposits in Brazil (Iron Quadrangle), further investigation is also needed to understand the role of geological traits and natural weathering processes over surface water quality.
The quantification of trends using Theil-Sen regression indicated an overall stagnation in concentrations throughout the state, suggesting that most sub-basins have not undergone rapid median fluctuations. In addition, the assessment of maps at 5 years intervals indicates an overall reduction of the risk of threshold exceedances, demonstrating improved effectiveness of measures to regulate pollution sources over the last 25 years. However, the increasing risk of dissolved iron concentrations larger than the limit indicates the need for further analysis to identify its causes, such as physical–chemical processes within the water column, and to develop targeted interventions. The comparison between land cover and the risk of threshold exceedances also suggests that forest cover may contribute to lower risks of transgressions, emphasizing the importance of vegetation maintenance.
While the study provides valuable insights to support decision-making for pollution control and remediation efforts, further evaluation is suggested. For instance, the analysis did not consider other influential environmental factors such as pH, temperature, conductivity, and precipitation. Additionally, no specific censoring strategy was applied, and serial autocorrelation in the Theil–Sen slopes was not assessed, as monthly samples were used and residual autocorrelation is often low or statistically insignificant (e.g., Monteiro and Costa, 2018). Future studies should explore the role of these additional parameters and investigate their relationships with other substances, as river concentration dynamics in time and space a result from complex and interconnected aspects (e.g., physical–chemical-biological reactions, hydrodynamic conditions, and geological influence). In addition, other steps for advancing this line of research include: installing high-frequency in situ sensors to capture temporal variability; testing flow-event sampling strategies to improve machine-learning; and coupling hybrid machine learning–process frameworks to represent non-linear pollutant dynamics at catchment scale; for formal trend inference in individual series, pre-whitened Mann–Kendall or similar approaches are recommended, as well formally assess assumptions such as normality, homoscedasticity, and independence when interpreting results. Finally, a more comprehensive risk analysis is recommended for health assessment, encompassing exposure pathways, duration, and sensitivity of organisms or individuals.
Data availability statement
The raw data supporting the conclusions of this article will be made available by the authors, without undue reservation.
Author contributions
DF: Conceptualization, Data curation, Formal analysis, Investigation, Methodology, Validation, Writing – original draft, Writing – review & editing. RC: Data curation, Investigation, Writing – original draft, Writing – review & editing. GS: Investigation, Writing – original draft, Writing – review & editing, Validation. PP: Investigation, Writing – original draft, Writing – review & editing, Conceptualization, Funding acquisition, Project administration, Resources, Supervision.
Funding
The author(s) declare that financial support was received for the research and/or publication of this article. This research is part of the project Hydrological and Climate Risks (R100603. RH.08), funded by Vale S. A. The authors gratefully acknowledge the financial support, which enabled the development of this research. The company was not involved in the study design, collection, analysis, interpretation of data, the writing of this article, or the decision to submit it for publication.
Conflict of interest
The authors declare that the research was conducted in the absence of any commercial or financial relationships that could be construed as a potential conflict of interest.
Generative AI statement
The authors declare that Gen AI was used in the creation of this manuscript. During the preparation of this work, the author(s) used the Microsoft Copilot tool to enhance the language and readability of the text.
Any alternative text (alt text) provided alongside figures in this article has been generated by Frontiers with the support of artificial intelligence and reasonable efforts have been made to ensure accuracy, including review by the authors wherever possible. If you identify any issues, please contact us.
Publisher’s note
All claims expressed in this article are solely those of the authors and do not necessarily represent those of their affiliated organizations, or those of the publisher, the editors and the reviewers. Any product that may be evaluated in this article, or claim that may be made by its manufacturer, is not guaranteed or endorsed by the publisher.
Supplementary material
The Supplementary material for this article can be found online at: https://www.frontiersin.org/articles/10.3389/frwa.2025.1673441/full#supplementary-material
References
ANA (2022). ANA - Agência Nacional de Águas e Saneamento básico (National Water and Sanitation Agency). Sistema Nacional de Informações sobre Recursos Hídricos (SNIRH). Available online at: http://www.snirh.gov.br/hidroweb/serieshistoricas (Accessed June 11, 2023).
Antonopoulos, V. Z., Papamichail, D. M., and Mitsiou, K. A. (2001). Statistical and trend analysis of water quality and quantity data for the Strymon River in Greece, Hydrol. Earth Syst. Syst. Sci 5:679–692. doi: 10.5194/hess-5-679-2001
Asadollah, S. B. H. S., Sharafati, A., Motta, D., and Yaseen, Z. M. (2021). River water quality index prediction and uncertainty analysis: a comparative study of machine learning models. J. Environ. Chem. Eng. 9:104599. doi: 10.1016/j.jece.2020.104599
Brazil (2005). L. No. 357, Conselho Nacional do Meio Ambiente - CONAMA N° 357. Brazil: República Federativa do Brasil.
Carpenter, S. R., Caraco, N. F., Correll, D. L., Howarth, R. W., Sharpley, A. N., and Smith, V. H. (1998). Nonpoint pollution of surface waters with phosphorus and nitrogen. Ecol. Appl. 8, 559–568.
Castrillo, M., and García, Á. L. (2020). Estimation of high frequency nutrient concentrations from water quality surrogates using machine learning methods. Water Res. 172:115490. doi: 10.1016/j.watres.2020.115490
CERH-MG. (2002). Deliberação Normativa CERH-MG no 06, de 04 de outubro de 2002. (Normative Resolution CERH-MG no 06, of October 4, 2002.).
Cheng, C., Zhang, F., Shi, J., and Kung, H. T. (2022). What is the relationship between land use and surface water quality? A review and prospects from remote sensing perspective. Em Environ. Sci. Pollution Res. 29, 56887–56907. doi: 10.1007/s11356-022-21348-x
Cruz, M. A. S., Gonçalves, A. d. A., de Aragão, R., de Amorim, J. R. A., da Mota, P. V. M., Srinivasan, V. S., et al. (2019). Spatial and seasonal variability of the water quality characteristics of a river in Northeast Brazil. Environ. Earth Sci. 78:68. doi: 10.1007/s12665-019-8087-5
Costa, R. de V. F.da, Leite, M. G. P., Mendonça, F. P. C., and Nalini, H. A. (2015). Geochemical mapping of arsenic in surface waters and stream sediments of the Quadrilátero Ferrífero, Brazil. REM Rev. Esc. Minas, 68, 43–51. doi: 10.1590/0370-44672015680077
de Mello, K., Valente, R.A., Randhir, T.O., Santos, A.C.A.dos, and Vettorazzi, C.A. (2018). Effects of land use and land cover on water quality of low-order streams in southeastern Brazil: watershed versus riparian zone Catena 167 130–138 doi: 10.1016/j.catena.2018.04.027
Espírito-Santo, M. M., Leite, M. E., Silva, J. O., Barbosa, R. S., Rocha, A. M., Anaya, F. C., et al. (2016). Understanding patterns of land-cover change in the Brazilian Cerrado from 2000 to 2015. Philosop. Trans. Royal Society B: Biolog. Sci. 371:20150435. doi: 10.1098/rstb.2015.0435
Ferreira, D. M., Pontes, P. R. M., Dall’Agnol, R., Guimarães, T., Salomão, G., and Silva, M. S. (2023). Modeling transport and fate of metals for risk assessment in the Parauapebas River. Environ. Impact Assess. Rev. 102:107209. doi: 10.1016/j.eiar.2023.107209
Fu, X., Wu, R., Qi, H., and Yin, H. (2023). Long-term trends in surface water quality of China’s seven major basins based on water quality identification index and big data analysis. Environ. Impact Assess. Rev. 100:107090. doi: 10.1016/j.eiar.2023.107090
Gorgoglione, A., Gregorio, J., Ríos, A., Alonso, J., Chreties, C., and Fossati, M. (2020). Influence of land use/land cover on surface-water quality of Santa Lucía River, Uruguay. Sustainability 12:4692. doi: 10.3390/su12114692
Guimarães, R. N., Moreira, V. R., Cruz, J. R. A., Saliba, A. P. M., and Amaral, M. C. S. (2022). History of tailings dam failure: impacts on access to safe water and influence on the legislative framework. Sci. Total Environ. 852:158536. doi: 10.1016/j.scitotenv.2022.158536
Haddad, M. A., Moura, A. C. M., Cook, V. M., and Lima e Lima, T. (2021). The social dimensions of the Iron quadrangle region: an educational experience in geodesign. Prof. Geogr. 73, 504–520. doi: 10.1080/00330124.2021.1895849
Helsel, D. R. (2006). Fabricating data: how substituting values for nondetects can ruin results, and what can be done about it. Chemosphere 65, 2434–2439. doi: 10.1016/j.chemosphere.2006.04.051
Helsel, D. R., Hirsch, R. M., Ryberg, K. R., Archfield, S. A., and Gilroy, E. J. (2020). Statistical methods in water resources: U.S. Geological Survey techniques and methods.
Hill, T., and Neal, C. (1997). Spatial and temporal variation in pH, alkalinity and conductivity in surface runoff and groundwater for the Upper River Severn catchment. Hydrol. Earth Syst. Sci. 1, 697–715.
Hirsch, R. M., Slack, J. R., and Smith, R. A. (1982). Techniques of trend analysis for monthly water quality data. Water Resour. Res. 18, 107–121.
Lettenmaier, D. P., Hooper, E. R., Wagoner, C., and Faris, K. B. (1991). Trends in stream quality in the continental United States, 1978-1987. Water Resour. Res. 27, 327–339.
Marani, A., and Nehdi, M. L. (2020). Machine learning prediction of compressive strength for phase change materials integrated cementitious composites. Constr. Build. Mater. 265:120286. doi: 10.1016/j.conbuildmat.2020.120286
Mello, K., Taniwaki, R. H., Paula, F. R., Valente, R. A., Randhir, T. O., Macedo, D. R., et al. (2020). Multiscale land use impacts on water quality: assessment, planning, and future perspectives in Brazil. J. Environ. Manag. 270:110879. doi: 10.1016/j.jenvman.2020.110879
Moldovan, A., Török, A. I., Kovacs, E., Cadar, O., Mirea, I. C., and Micle, V. (2022). Metal contents and pollution indices assessment of surface water, soil, and sediment from the Arieș River basin mining area, Romania. Sustainability 14:8024. doi: 10.3390/su14138024
Monteiro, M., and Costa, M. (2018). A time series model comparison for monitoring and forecasting water quality variables. Hydrology 5:37. doi: 10.3390/hydrology5030037
Monteiro, J. A. F., Kamali, B., Srinivasan, R., Abbaspour, K., and Gücker, B. (2016). Modelling the effect of riparian vegetation restoration on sediment transport in a human-impacted Brazilian catchment. Ecohydrology 9, 1289–1303. doi: 10.1002/eco.1726
Panagos, P., Borrelli, P., Meusburger, K., Zanden, E. H., van der,, Poesen, J., et al. (2015). Modelling the effect of support practices (P-factor) on the reduction of soil erosion by water at European scale. Environ. Sci. Pol. 51, 23–34. doi: 10.1016/j.envsci.2015.03.012
Pataca, L. C. M., Pedrosa, M. A. F., Zolnikov, T. R., and Mol, M. P. G. (2020). Water quality index and sanitary and socioeconomic indicators in Minas Gerais, Brazil. Environ. Monit. Assess. 192:476. doi: 10.1007/s10661-020-08425-9
Pedregosa, F., Varoquaux, G., Gramfort, A., Michel, V., Thirion, B., Grisel, O., et al. (2011). Scikit-learn: machine learning in Python. J. Mach. Learn. Res., 2825–2830.
Peng, C., Huang, Y., Yan, X., Jiang, L., Wu, X., Zhang, W., et al. (2021). Effect of overlying water pH, temperature, and hydraulic disturbance on heavy metal and nutrient release from drinking water reservoir sediments. Water Environ. Res. 93, 2135–2148. doi: 10.1002/wer.1587
Shadmehri Toosi, A., Batelaan, O., Shanafield, M., and Guan, H. (2025). Land use-land cover and hydrological modeling: A review. Wiley Interdiscip. Rev. Water 12:e70013. doi: 10.1002/wat2.70013
Tanaka, M. O., Souza, A. L. T., Moschini, L. E., and Oliveira, A. K. (2016). Influence of watershed land use and riparian characteristics on biological indicators of stream water quality in southeastern Brazil. Agric. Ecosyst. Environ. 216, 333–339. doi: 10.1016/j.agee.2015.10.016
Thompson, F., de Oliveira, B. C., Cordeiro, M. C., Masi, B. P., Rangel, T. P., Paz, P., et al. (2020). Severe impacts of the Brumadinho dam failure (Minas Gerais, Brazil) on the water quality of the Paraopeba River. Sci. Total Environ. 705:135914. doi: 10.1016/j.scitotenv.2019.135914
Vega, M., Pardo, R., Barrado, E., and Debán, L. (1998). Assessment of seasonal and polluting effects on the quality of river water by exploratory data analysis. Water Res. 32, 3581–3592.
Viana, L. F., Crispim, B. d. A., and Sposito, J. C. V. (2021). High iron content in river waters: environmental risks for aquatic biota and human health. Ambiente Agua - An Interdiscip. J. Appl. Sci. 16, 1–20. doi: 10.4136/ambi-agua.2751
Vörösmarty, C. J., McIntyre, P. B., Gessner, M. O., Dudgeon, D., Prusevich, A., Green, P., et al. (2010). Global threats to human water security and river biodiversity. Nature 467, 555–561. doi: 10.1038/nature09440
Wang, G., Zhao, B., Wu, B., Zhang, C., and Liu, W. (2023). Intelligent prediction of slope stability based on visual exploratory data analysis of 77 in situ cases. Int. J. Min. Sci. Technol. 33, 47–59. doi: 10.1016/j.ijmst.2022.07.002
Wasko, C., Nathan, R., and Peel, M. C. (2020). Trends in global flood and streamflow timing based on local water year. Water Resour. Res. 56:233. doi: 10.1029/2020WR027233
Withers, P. J. A., and Jarvie, H. P. (2008). Delivery and cycling of phosphorus in rivers: A review. Sci. Total Environ. 400, 379–395. doi: 10.1016/j.scitotenv.2008.08.002
Xu, G., Li, P., Lu, K., Tantai, Z., Zhang, J., Ren, Z., et al. (2019). Seasonal changes in water quality and its main influencing factors in the Dan River basin. Catena 173, 131–140. doi: 10.1016/j.catena.2018.10.014
Xue, S., Jian, H., Yang, F., Liu, Q., and Yao, Q. (2022). Impact of water-sediment regulation on the concentration and transport of dissolved heavy metals in the middle and lower reaches of the Yellow River. Sci. Total Environ. 806:150535. doi: 10.1016/j.scitotenv.2021.150535
Yousefi, M., Oskoei, V., Esmaeli, H. R., and Baziar, M. (2024). An innovative combination of extra trees within adaboost for accurate prediction of agricultural water quality indices. Res. Eng. Des. 24:103534. doi: 10.1016/j.rineng.2024.103534
Zanin, P. R., Cavalcante, R. B. L., Fleischmann, A. S., Peres, C. A., Ferreira, D. M., Serrão, E. A. d. O., et al. (2024). Do protected areas enhance surface water quality across the Brazilian Amazon? J. Nat. Conserv. 81:126684. doi: 10.1016/j.jnc.2024.126684
Keywords: water quality in rivers, machine learning, environmental risk assessment, watershed management, water quality monitoring
Citation: Ferreira DM, Cavalcante RBL, Salomão GN and Pontes PRM (2025) Water quality in Minas Gerais, Brazil: evaluating the past 25 years using ensemble decision trees and robust trend analysis. Front. Water. 7:1673441. doi: 10.3389/frwa.2025.1673441
Edited by:
Emmanuel Daanoba Sunkari, Sir Padampat Singhania University, IndiaReviewed by:
Dickson Abdul-Wahab, University of Ghana, GhanaJurandir Rodrigues de Souza, Universidade de Brasília, Brazil
Copyright © 2025 Ferreira, Cavalcante, Salomão and Pontes. This is an open-access article distributed under the terms of the Creative Commons Attribution License (CC BY). The use, distribution or reproduction in other forums is permitted, provided the original author(s) and the copyright owner(s) are credited and that the original publication in this journal is cited, in accordance with accepted academic practice. No use, distribution or reproduction is permitted which does not comply with these terms.
*Correspondence: Paulo Rógenes Monteiro Pontes, cC5yb2dlbmVzQGdtYWlsLmNvbQ==