 Paige Tunby
 David J. Van Horn
 Ricardo González-Pinzón
- 1Gerald May Department of Civil, Construction and Environmental Engineering, University of New Mexico, Albuquerque, NM, United States
- 2Department of Biology, University of New Mexico, Albuquerque, NM, United States
Wildfires significantly alter hydrological and biogeochemical processes, impacting downstream water quality and posing risks to ecosystems and human communities. Following the 2022 Hermit’s Peak-Calf Canyon (HPCC) wildfire in New Mexico, the largest wildfire recorded in the state of New Mexico, we deployed high-resolution in-situ sensors at three locations along a > 160 km fluvial network to investigate event-scale solute transport dynamics and their environmental drivers. Our objective was to evaluate how post-fire runoff events influenced water quality behavior across spatial (headwaters to mid- and high-order streams) and temporal (event to seasonal) gradients. We found that acute water quality impacts were most severe near the burn area, where turbidity reached ~8,500 FNU and dissolved oxygen fell below regulatory thresholds. These extremes, largely missed by traditional discrete sampling, were strongly driven by storm event size and seasonal variability. In contrast, farther downstream, solute export behavior was better predicted by longer-term indicators such as time since the fire and vegetation recovery metrics. Our analysis reveals distinct spatial shifts in concentration-discharge behavior that depend on the water quality parameter type, event features, and site position in the watershed. These findings highlight the need for longitudinal, high-frequency monitoring to detect and anticipate wildfire-induced water quality risks and inform more adaptive, spatially targeted watershed management strategies.
Introduction
Wildfires are increasing in frequency, severity, and spatial extent across the western United States (Dennison et al., 2014), driven by various factors including historical fire suppression, land use change (Allen et al., 2002), and anthropogenic climate change (Westerling et al., 2006; Abatzoglou and Williams, 2016; Romero, 2023). These shifts in fire regimes are reshaping terrestrial ecosystems and introducing profound and complex impacts on downstream hydrology and water quality. Because more than half of the U.S. drinking water supply originates from forested watersheds (Brown et al., 2008), the integrity of post-fire water resources has become an urgent national concern.
Following wildfires, the loss of vegetation and alteration of soil properties increase surface runoff, sediment delivery, and the mobilization of nutrients, metals, and organic matter (Bladon et al., 2014). These changes can persist for months to years, and are often most acute during storm events, which can flush large volumes of previously immobilized material into river systems (Stone et al., 2011). Resulting changes in water quality, such as elevated turbidity, dissolved oxygen sags, altered pH, and changes in specific conductance (Dahm et al., 2015; Raoelison et al., 2023), can impair aquatic habitats, reduce reservoir lifespans (Bladon et al., 2014), and overwhelm municipal water treatment systems (Emelko et al., 2011). These effects can pose substantial operational and public health challenges for communities that rely on surface water from recently burned watersheds (Emelko et al., 2011).
Despite a growing awareness of the hydrologic consequences of wildfires, the temporal and spatial dynamics of post-fire water quality responses remain poorly understood. Much of what is known derives from opportunistic studies (Dahm et al., 2015), short-duration monitoring (Sherson et al., 2015; Emmerton et al., 2020; Crandall et al., 2021), or infrequent discrete sampling campaigns (Johnston and Maher, 2022; Richardson et al., 2024), which may miss the short-lived but extreme changes that define post-fire water quality hazards. High-frequency sensor deployments now enable capturing these rapid changes in real time. Yet, such tools have rarely been deployed systematically across spatial gradients within burned fluvial networks. Consequently, it remains unclear how wildfire impacts unfold over space, from heavily burned headwaters to downstream river reaches, and how solute transport behavior evolves, particularly in relation to event characteristics, seasonal forcing, and watershed recovery processes.
In April 2022, the Hermit’s Peak–Calf Canyon (HPCC) wildfire burned over 1,380 km2 of forested terrain in northern New Mexico, producing severe ecological and hydrologic impacts across a large swath of the Pecos River basin. In response, we established a rapid response, sensor-based water quality monitoring network across three locations on the Gallinas Creek–Pecos River system (Tunby et al., 2023). These sites, separated by more than 160 km and differing markedly in burn extent and watershed characteristics, provided a unique opportunity to evaluate how wildfire-induced concentration-discharge (C-Q) behavior varies across spatial and temporal scales.
This study analyzes 18 months of high-frequency water quality data to address three research questions. First, how did the HPCC wildfire affect water quality within the fluvial network? Second, how did C-Q transport regimes (i.e., mobilization, dilution, or chemostasis) vary across parameters and along the fluvial network? Third, to what extent are solute behavior and environmental metrics correlated, and can solute behavior be predicted using environmental metrics such as event size, seasonality, and post-fire recovery indicators?
We hypothesized that runoff events at the most severely burned, upstream sites would exhibit dominant mobilization (e.g., turbidity) or dilution (e.g., DO) associated with post-fire storm events. In contrast, we expected that the downstream site, more distally connected to the burned area, would exhibit more attenuated or mixed C-Q behavior due to increased contributions of unaffected tributaries and in-stream processing.
This work seeks to advance understanding of post-fire C-Q dynamics in river networks by integrating continuous water quality measurements with event-scale hydrologic and environmental drivers. In doing so, we aim to inform both scientific understanding and practical monitoring approaches that support water resource management in fire-impacted regions.
Methods
To clearly communicate our research methods, we moved some details to the Supplementary information of this article. The accompanying data and analysis code can be found in Tunby (2025).
Study area and monitoring network
The HPCC fire began in April 2022 and burned over 1,382 km2 of forested land in the Santa Fe National Forest, New Mexico (National Interagency Fire Center, 2022). This fire affected the Gallinas Creek-Pecos River-Santa Rosa Lake network. Gallinas Creek supplies drinking water to the City of Las Vegas, NM, and supports downstream users and ecosystems. In response, we deployed water quality sensors at three sites along this fluvial network: P2, P3, and P5, located 26, 61, and 167 km downstream of the headwaters of Gallinas Creek. These sites were selected to capture changes in the spatial relevance of fire impact. From the 198 km2 draining to P2, ~95% were burned; from the 826 km2 draining to P3, ~36% were burned; and from the 6,008 km2 draining to P5, ~10% were burned. All sites were co-located with U. S. Geological Survey (USGS) stream gages to enable synchronized hydrologic and water quality data collection (Figure 1). Site characteristics for each of the sampling sites’ watershed areas are listed in Supplementary Table S1.
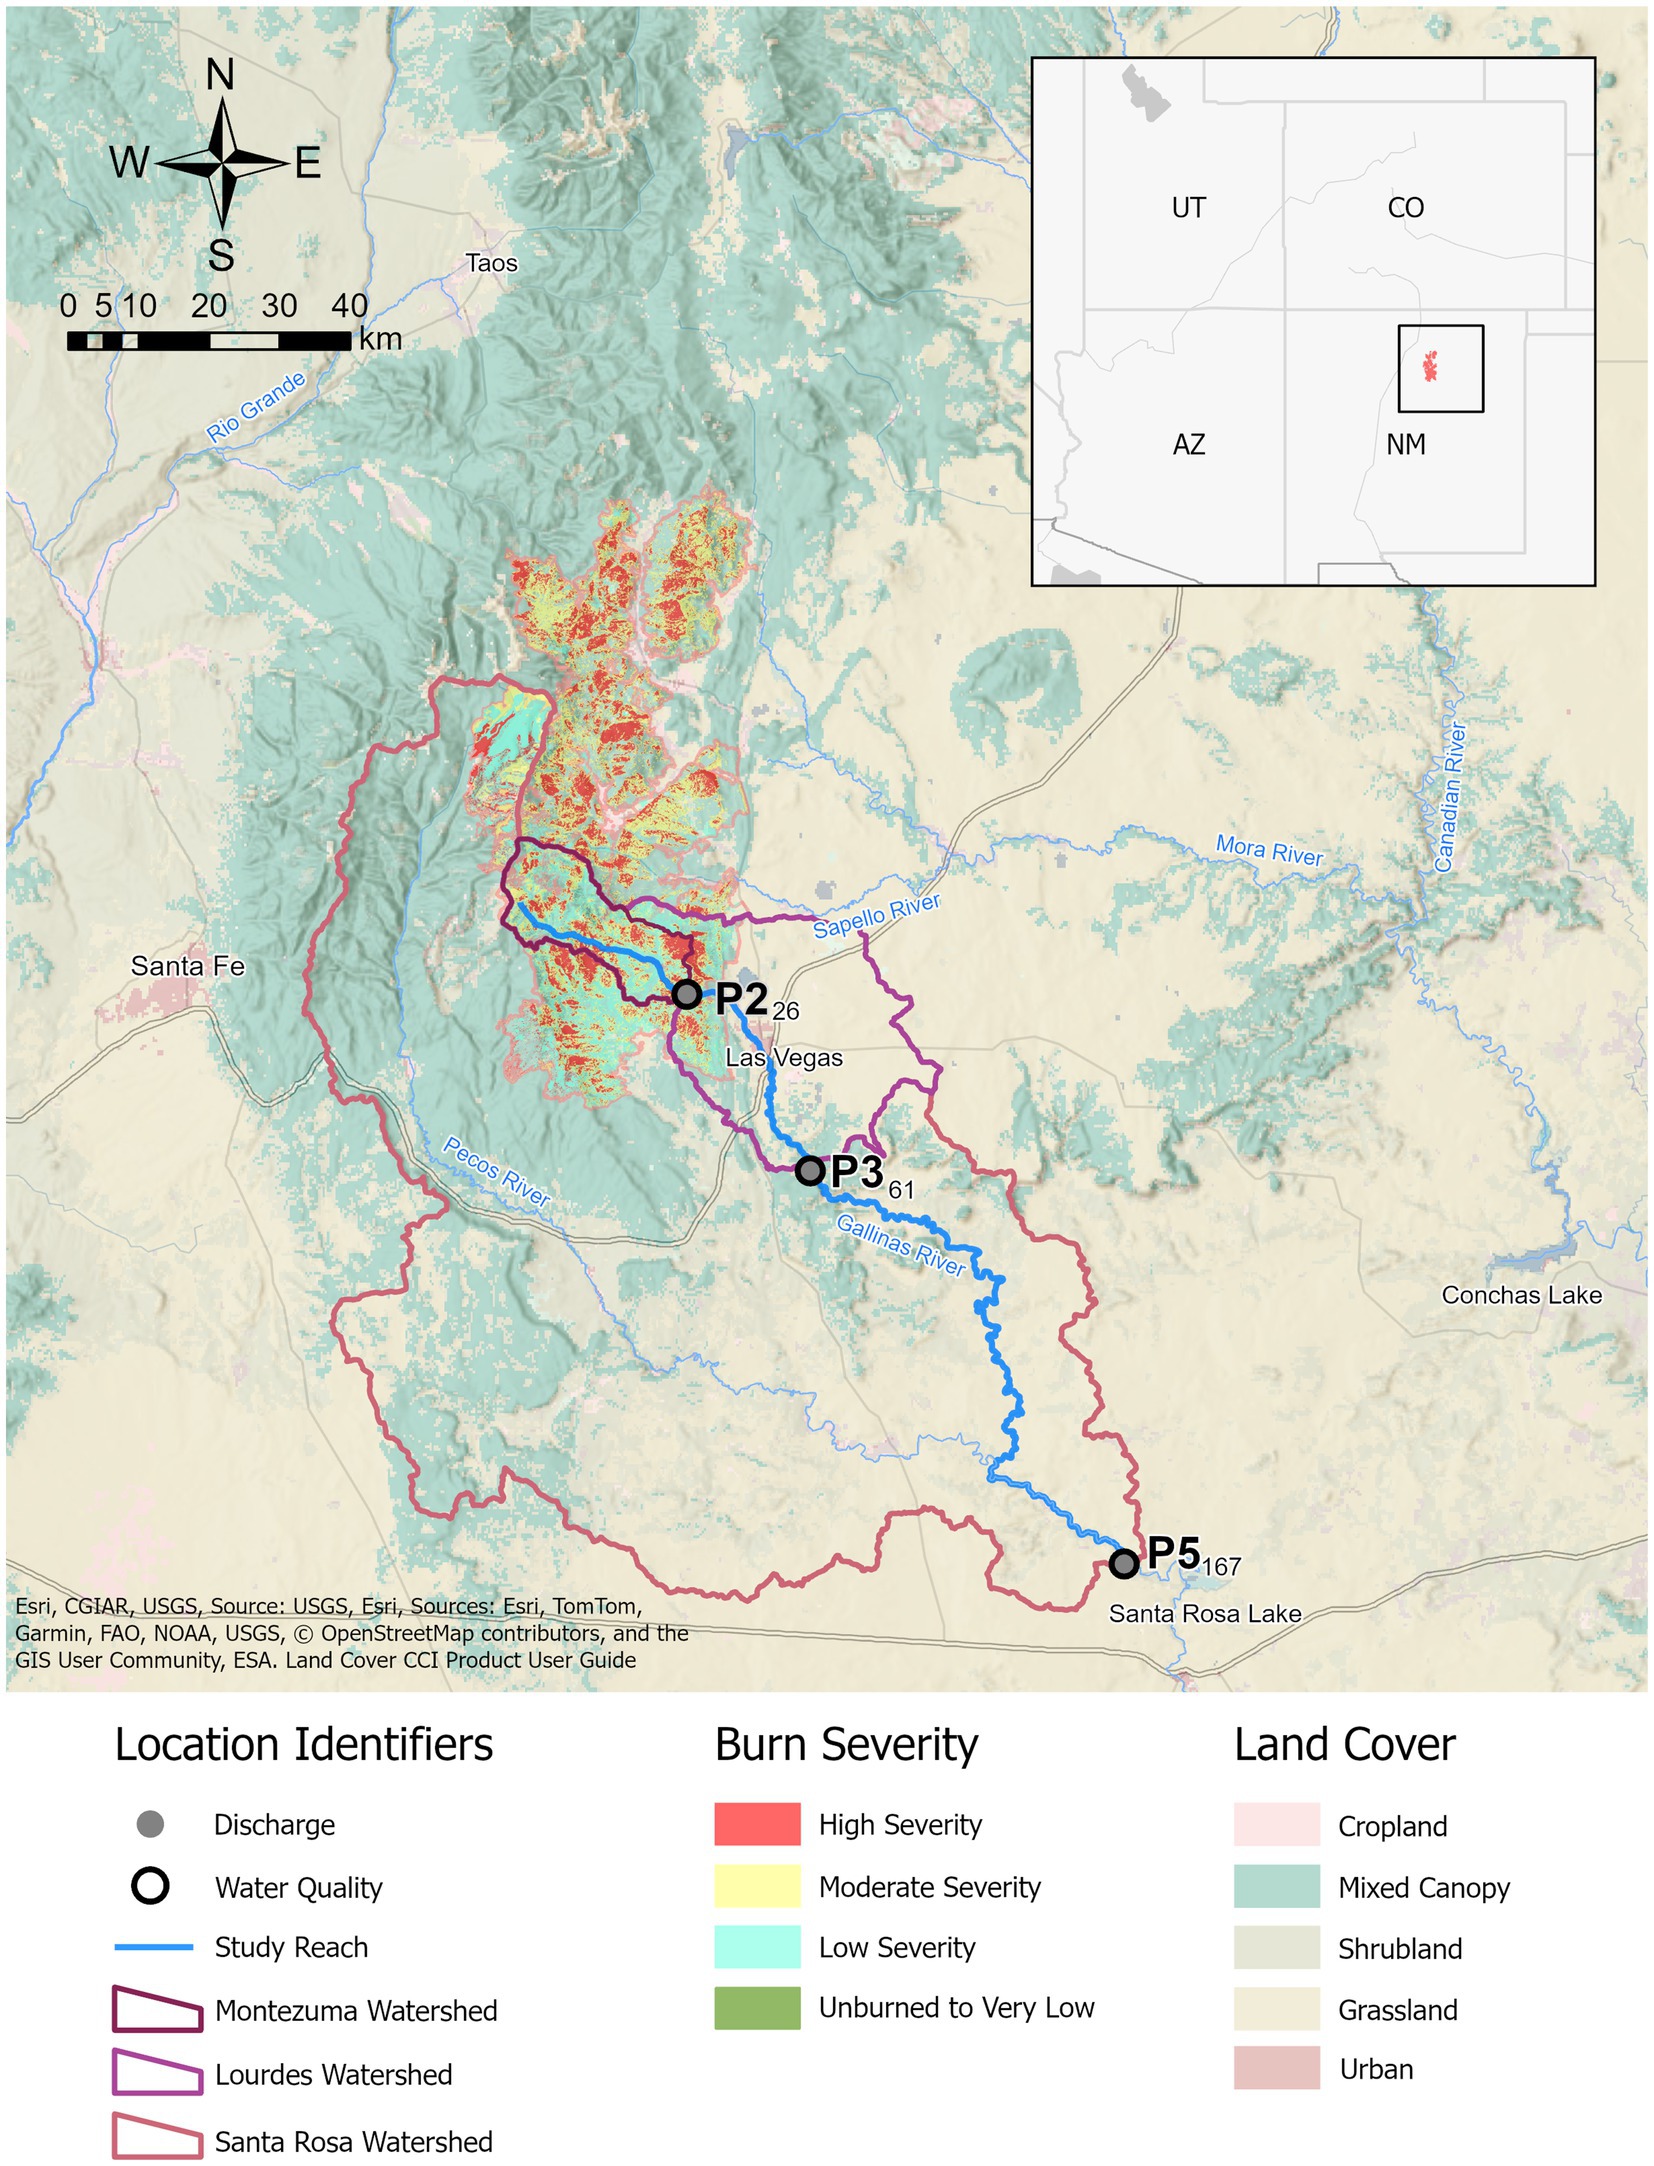
Figure 1. Map of the area burned by the Hermit’s Peak–Calf Canyon wildfire. The locations of sampling sites and water discharge data are indicated as P2, P3, and P5, with subindices indicating the kilometers from the headwaters of Gallinas Creek in accordance with Nichols et al. (2024). P indicates that sites drain to the Pecos River.
Water quality and discharge monitoring
We measured water quality parameters using YSI EXO2 multiparameter sondes installed in April 2022, i.e., 2 weeks after the fire began and before any precipitation mobilized burned material to the fluvial network, and maintained the sensors through September 2023. The sensors were collocated next to USGS stream gages (P2 with 08380500, P3 with 08382000, and P5 with 08382650), which collect discharge data at a 15-min resolution. The length of the USGS data used was the same as the sensor’s deployment (April 18, 2022). These sensors recorded dissolved oxygen (DO), specific conductance, turbidity, pH, and water temperature at 15-min intervals. We inspected and calibrated the sensors every 2 weeks, and all data were corrected for drift and fouling using manufacturer-recommended procedures and site-specific calibration offsets. We identified and removed spurious readings using a moving window filter with a ± 20% threshold, following protocols adapted from Wagner et al. (2006).
Historical discrete sampling data
To establish pre-fire water quality baselines, we compiled discrete sample data from the USGS and EPA Water Quality Portal for P2, the only site with records before and after the fire (National Water Quality Monitoring Council, 2025). Discrete samples were collected randomly, over multiple different hydrologic conditions that were inconsistently recorded. When available, records indicated water level (i.e., low, normal, or peak) and whether flow conditions were changing (i.e., falling, stable, or rising). Lack of flow-related information appears as ‘Not determined’ (Supplementary Table S2). These records span from 1964 to 2009 for pre-fire conditions and 2022 to 2023 for post-fire discrete samples. Depending on the parameter, sample sizes ranged from 12 to 99 for pre-fire and 8 to 37 for post-fire datasets.
In most cases, the discrete samples were collected multiple times a year for consecutive years, with subsequent multi-year gaps in data collection, as shown in Supplementary Table S2. Discrete sample turbidity measurements have three different units, i.e., Jackson Turbidity Units (JTU), nephelometric turbidity units (NTRU), and Formazin Nephelometric Units (FNU), while post-fire YSI EXO2 sensor data is only in FNU. However, the measurements in JTU and NTRU are roughly equivalent and were used interchangeably for comparisons (Bash et al., 2001). The use of FNU has high variability between sensors, and it has been shown that EXO sensor response is typically lower than that of other field and laboratory sensors when compared to in situ and discrete samples. As a result, the turbidity measurements and their comparison are likely underestimating the actual values (Snazelle, 2020; Davies-Colley et al., 2021).
Runoff event delineation
Runoff events were delineated using the USGS stream gage data at each site for the duration of sensor deployment and the HydRun toolbox in MATLAB, which identifies hydrograph peaks based on user-defined thresholds. We applied a filter coefficient of 0.995 to remove baseflow, a return ratio of 0.25 to define the end of each event, and set the peak threshold equal to the mean annual baseflow at each site following established recommendations (Tang and Carey, 2017). These parameters were selected to capture meaningful storm-driven runoff events at each site, independent of each other, while filtering out minor fluctuations in flow. Since in the region of the fire, the North American Monsoon system brings heavy rainfall during the summer (Hoell et al., 2016), which contributes up to 50% of the annual rainfall (Sheppard et al., 2002), we classified events into monsoon (June 15 through September 30) and non-monsoon seasons (National Weather Service, 2024).
Event-scale water quality metrics
We estimated the concentration–discharge (C-Q) behavior for each post-fire event across monitoring sites. Each event’s C-Q behavior was estimated using a power-law relationship (Equation 1) with exponent , using site- and event-specific concentrations ( ) paired with discharge ( ) records:
In log–log space, is the slope of the linear form of the relationship and is the intercept. Discharge ( ) values were normalized by the mean discharge of each event ( ), i.e., , to facilitate comparison of intercept values across events with differing discharge magnitudes (Knapp et al., 2020; Johnston and Maher, 2022). The C-Q slope ( ) and intercept ( ) for each event were estimated using the SciPy curve fit function (Equation 2) (Virtanen et al., 2020). The fit quality was calculated using the standard error of the slope and intercept with the Statsmodel package (Seabold and Perktold, 2010). Events with poor model fit (standard error > 0.5 for either slope or intercepts, or > 0.25 for both) were excluded from further analysis.
The slopes of each post-fire event were used to classify C-Q behaviors. A positive slope (b > 0) indicates mobilization (increase) of a water quality parameter, a negative slope (b < 0) indicates dilution (decrease), and a slope close to zero (b ≈ 0) indicates changes in water quality that are independent of discharge (Knapp et al., 2020) (Figure 2). The significance of the C-Q slope was calculated using the t-statistic of the slope (H0 = 0) and a significance level of 0.05. If the slope (b) was significant (p < 0.05), the sign of the slope was used for classification. Nonsignificant slopes (p > 0.05) were then evaluated using an additional criterion based on the ratio of the coefficient of variation of concentrations ( ) to that of discharges ( ) (Equation 3):
where and represent the mean and standard deviations of associated quantities (Musolff et al., 2015). If the absolute value of the ratio is < 0.5, the event behavior is classified as chemostasis, and if the ratio is > 0.5, the sign of the slope is used as above (Kaphle et al., 2025). This helps avoid misclassifying chemostatic and chemodynamic events due to issues associated with detection limits or low sample concentrations (Musolff et al., 2015).
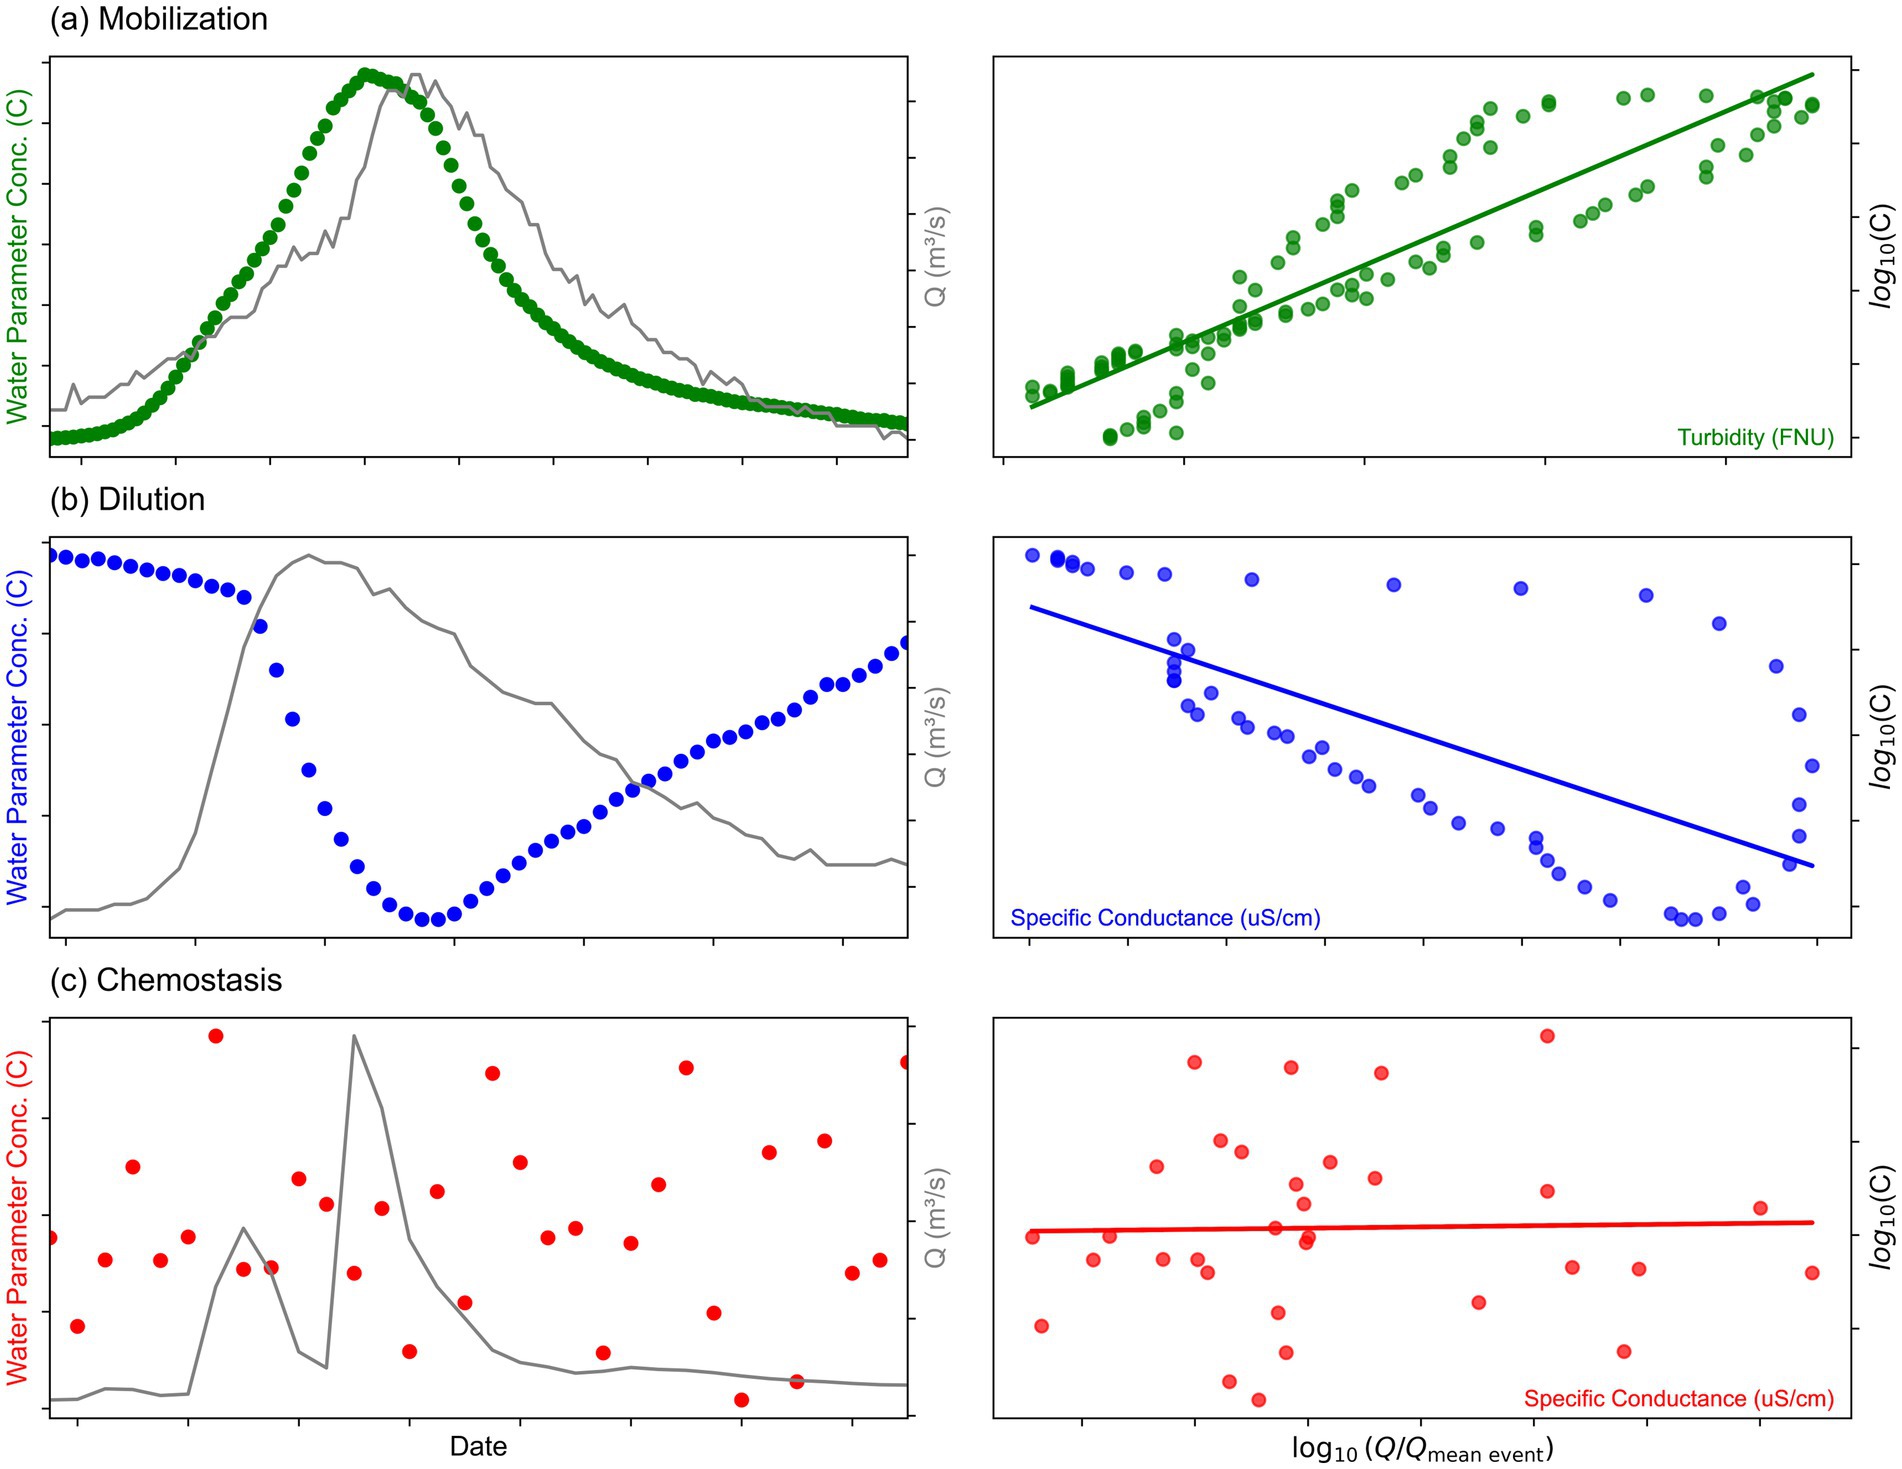
Figure 2. Left panels show the conceptual representation of runoff events observed at a site, featuring water quality changes associated with mobilization (a), dilution (b), and chemostasis (c). The right panels show the corresponding concentration-discharge (C–Q) relationships.
If events were missing water quality data or lacked continuous sensor records for one of the water quality parameters, the events were excluded for all water quality parameters to facilitate comparability across events. We made an exception for pH at P3, where sensor failure after June 2023 resulted in missing data during the entire second monsoon season. If all events had been discarded, it would have limited the understanding of water quality behavior for the other water quality parameters.
We examined spatial changes in water quality along the fluvial network using the C-Q slopes and intercepts for each water quality parameter at each sampling site. We calculated the medians and interquartile ranges (IQRs) to facilitate interpretation.
Comparison of pre- and post-fire discrete samples and post-fire sensor event extremes
For each water quality parameter, we compared: pre-fire discrete samples vs. post-fire discrete samples to evaluate overall baseline changes using the same sampling method; pre-fire discrete samples vs. post-fire event sensor extremes to evaluate fire effects and differences due to sample resolution; and post-fire discrete samples vs. post-fire event sensor extremes to isolate differences due to sampling frequency and capture short-term post-fire extremes. We evaluated statistical significance between the above groups using two-sided Mann–Whitney U tests (p-value < 0.05) and reported effect sizes using Cohen’s d (Cohen, 1992). A small effect size (d ≈ 0.2) indicates a modest difference between groups that, while statistically real, may have a limited impact. A medium effect size (d ≈ 0.5) indicates a more meaningful shift likely to affect water quality dynamics. A large effect size (d ≥ 0.8) suggests a substantial and impactful change that is statistically significant and highly relevant. A negative sign indicates that the second group (e.g., post-fire discrete samples) had higher values than the first group (e.g., pre-fire discrete samples). This analysis allowed evaluation of fire impacts on water quality and a direct comparison of discrete sampling with high-frequency sensor data following a wildfire.
Derivation of event features
We computed six explanatory features for each runoff event to explore the environmental drivers of C-Q transport behavior. Three features were derived directly from hydrograph characteristics: runoff volume (event area under the curve), event duration (time from hydrograph start to return to baseflow), and the prior runoff volume (antecedent 3-day runoff volume excluding baseflow) (Figure 3). Three additional features were spatial or temporal: average air temperature during the event, enhanced vegetation index (EVI), and days since fire declaration. Runoff volume, event duration, and prior runoff volume examine event scale drivers of behavior; average air temperature and EVI assess seasonal drivers; and days since fire declaration look at recovery post-fire. Air temperature was extracted from PRISM 4-km gridded daily data and averaged over the event period for each watershed (Oregon State University, 2014). EVI was derived from MODIS (MOD13Q1 and MYD13Q1) 250 m 16-day composites (Ba et al., 2022), and the phased satellites provided an 8-day resolution (Nichols et al., 2024). The EVI raster was masked to the burned portion of each watershed, and the mean value was calculated. The events were adjusted for watershed travel time by lagging data 10 h at P3 and 25 h at P5, based on estimated flow velocities, allowing for the best estimation of storms originating from burn areas. The EVI value corresponding to the timestamp closest to the middle of the adjusted event time was used for each site’s corresponding burned watersheds. The time since fire was computed as the number of days between April 6, 2022 (fire declaration) and the midpoint of each delineated event’s duration.
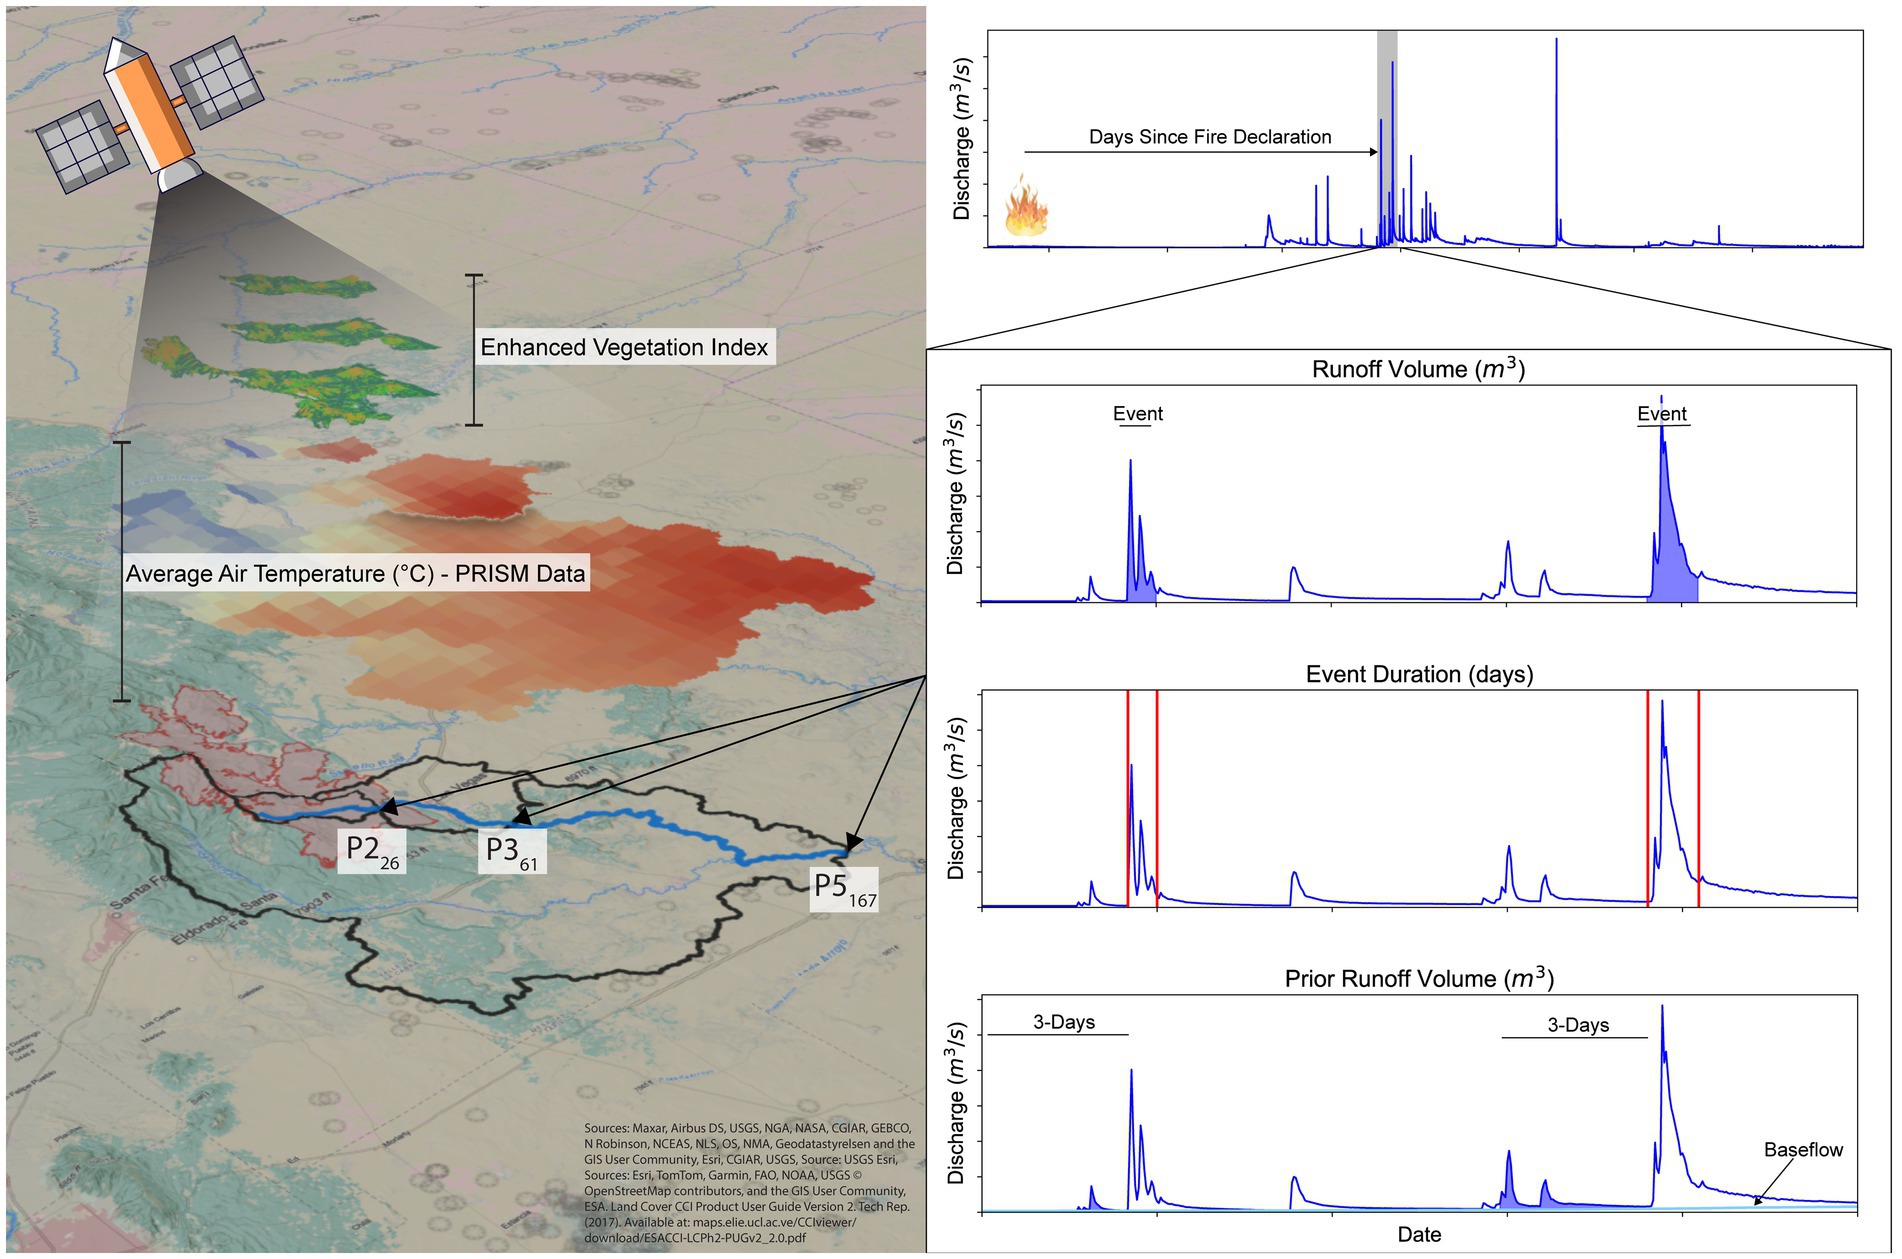
Figure 3. Conceptual representation of the six event features used to contextualize concentration-discharge (C-Q) relationships at each site: enhanced vegetation index (EVI), average air temperature, runoff volume, event duration, prior runoff volume, and days since fire declaration.
Principal components and correlation analyses
We conducted principal components analysis (PCA) using the prcomp function in R to examine multivariate patterns in C-Q transport behavior (R Core Team, 2021). All variables were centered and scaled before analysis (Jolliffe and Cadima, 2016). We created PCA biplots for each sampling site using the C-Q slopes obtained from post-fire events for the five parameters (excluding pH at P3 due to missing data) and the six event features described above. These biplots visualized dominant gradients in C-Q behavior and their association with event drivers. To simplify and make our results objective, we grouped PCA vectors falling within a 45-degree° arc.
We further quantified the strength of association between individual event features and C-Q behavior using Spearman rank-order correlations. Correlations between each C-Q slope and the six event features were computed at each site and for each water quality parameter using the spearmanr function in SciPy (Virtanen et al., 2020). Significance was assessed at p < 0.05 (*), with additional emphasis on highly significant results p < 0.01 (**). In the main text, we focused our interpretation on event features significantly correlated with three or more C-Q slope relationships and present the complete correlation matrices in Supplementary Figure S1. Detailed methods can be found in the Supplementary information.
Results
Post-fire runoff events and data availability
Across the three monitoring sites, we identified 108 runoff events from April 2022 through September 2023. These included 35 events at the upstream site (P2), 40 at the midstream site (P3), and 33 at the downstream site (P5). Event frequency was influenced by site-specific hydrologic responses and data continuity. Notably, sensor failure at P3 in June 2023 limited pH data availability during the second monsoon season, and only one runoff event was recorded at P5 during that same period due to data loss that occurred during storm events. A summary of events in this analysis is shown in Supplementary Table S3, with monsoonal events indicated with light blue shading.
Post-fire changes in water quality extremes
Our high-frequency sensors captured extreme water quality disturbances post-fire that were systematically missed by discrete sampling. Comparison of pre-fire discrete samples, post-fire discrete samples, and high-frequency post-fire event sensor extremes at P2 (Figure 4) showed that turbidity had significant deviations post-fire. The pre-fire discrete samples did not exceed 100 JTU, whereas discrete post-fire samples reached a maximum of ~1,800 NTRU. High-frequency sensors captured an even greater post-fire maximum of ~8,500 FNU and overall showed greater maxima. There is a significant difference between the discrete sampling pre- and post-fire (p-value = 0.0009), with a large effect size (Cohen’s d = −0.79), indicating an increase in turbidity post-fire using the same sampling method. There is also a significant difference between the discrete post-fire sampling and post-fire sensor event maximum (p-value = 0.0002) and a large effect size (Cohen’s d = −0.79) (Supplementary Table S4).
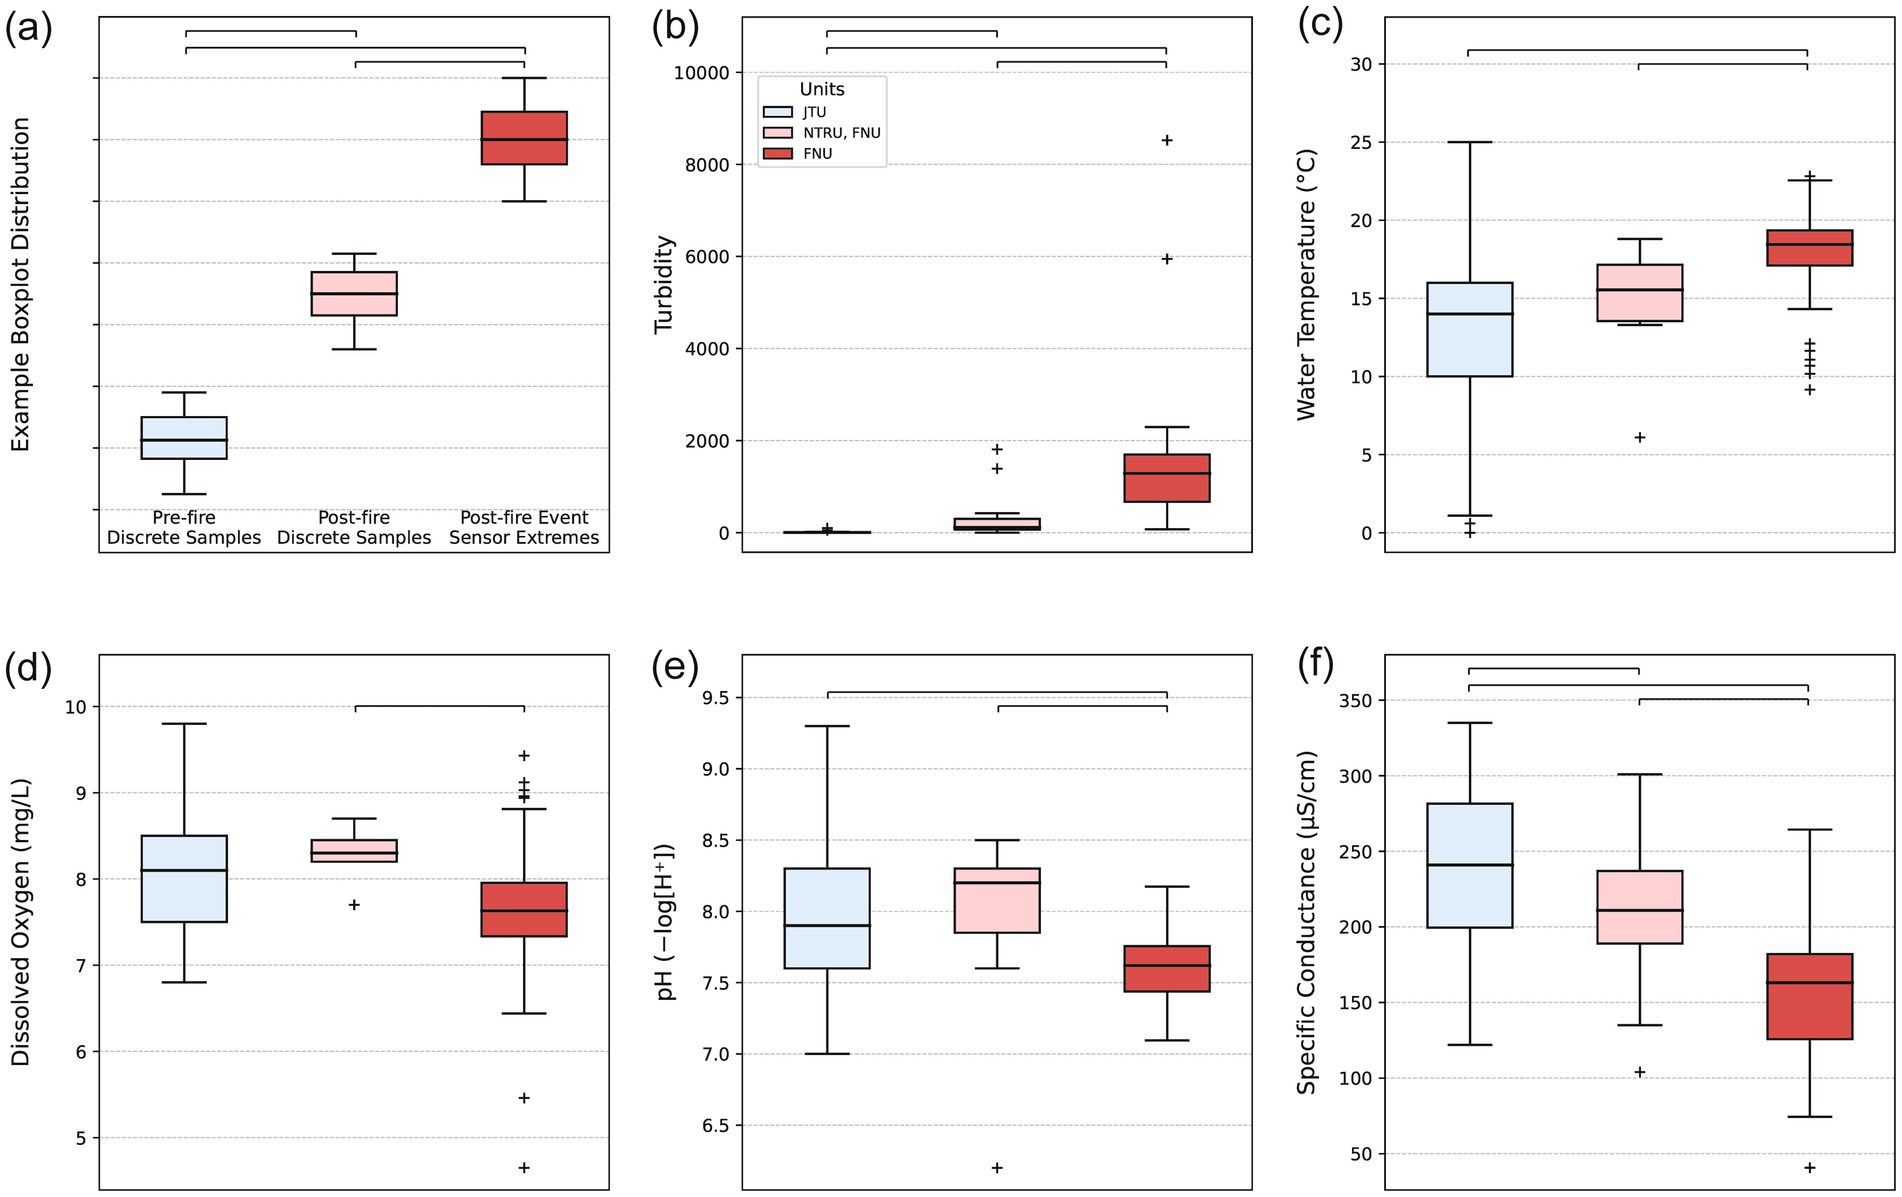
Figure 4. (a) Example of boxplots comparing all pre-fire and post-fire discrete sample data available to minima (min) or maxima (max) post-fire extremes captured with YSI EXO2 sensors at P2. The bars identify significant differences between groups (p-value < 0.05) using the Mann–Whitney U nonparametric statistical tests. Panels (b–f) show actual data of: (b) turbidity (max), (c) water temperature (max), (d) DO (min), (e) pH (min), (f) specific conductance (min).
Water temperatures were also elevated post-fire. The maximum temperature reading (25 °C) was from the pre-fire discrete sampling dataset (Supplementary Table S5). The pre-fire median was 14 °C, while post-fire discrete sampling and sensor event maxima were 15.6 and 18.4 °C (Supplementary Table S5). The post-fire event sensor maximums differed significantly from pre- and post-fire discrete samples (Cohen’s d ≈ −0.91 and −0.75, p-value = 0.0002 and 0.0169), confirming that low-frequency sampling failed to capture high thermal pulses from runoff events. However, due to the small to medium effect size (Cohen’s d = −0.34) (Supplementary Table S4), and the lack of significant difference detected between pre- and post-fire discrete samples, there are not likely enough discrete samples to detect changes post-fire.
The maximum post-fire sensor value for specific conductance is 883 μS/cm, higher than the pre-fire and post-fire discrete sampling maximum of 335 and 301 μS/cm. However, there are no significant differences between sensor event maxima and the pre- and post-fire discrete samples. In contrast, the comparison of the minimum post-fire sensor event values and the pre- and post-fire discrete samples shows significantly lower sensor values (p-value = 3.60×10⁻¹⁰ and 8.99×10⁻⁷), with large sample effects (Cohen’s d = 1.53 and 1.28) (Supplementary Table S4), indicating that the sensor systemically captured lower values.
The maximum pH values captured post-fire using the sensors were similar to the pre- and post-fire discrete sampling distributions, with only small effect sizes and no statistically significant differences across groups. However, when comparing the minimum pH values measured post-fire using the sensors, it was significantly different from pre- and post- fire discrete sampling (p-value = 0.00005 and 0.00002) with large sample effects (Cohen’s d ≈ 0.88 and 1.12) (Supplementary Table S4), indicating episodic acidification events potentially driven by ash-laden runoff or organic acid loading, which were not captured using discrete sampling.
DO dynamics showed the most considerable short-term impacts regarding ecological risk and emphasized the need for high-resolution sampling to capture the dynamics accurately. While discrete samples pre- and post-fire are not significantly different, the post-fire sensor event minimum values captured DO values as low as 4.7 mg/L, which is below the New Mexico Environmental Department (NMED) requirements of > 6.0 mg/L (New Mexico Administrative Code, 2023), compared to pre-fire discrete measurements of 6.8 and post-fire of 7.7 mg/L (Supplementary Table S5). The post-fire discrete samples significantly differed from post-fire sensor event minima (p-value = 0.0131) and had a medium to large effect size (Cohen’s d ≈ 0.75), highlighting substantial under-detection of DO sags in discrete samples post-fire (Supplementary Table S4).
Spatial variability in concentration–discharge behavior
The event median C-Q values of water quality parameters at each site are shown in Figure 5. Supplementary Table S6 shows interquartile ranges (IQR) and Supplementary Table S7 presents the counts of each transport regime.
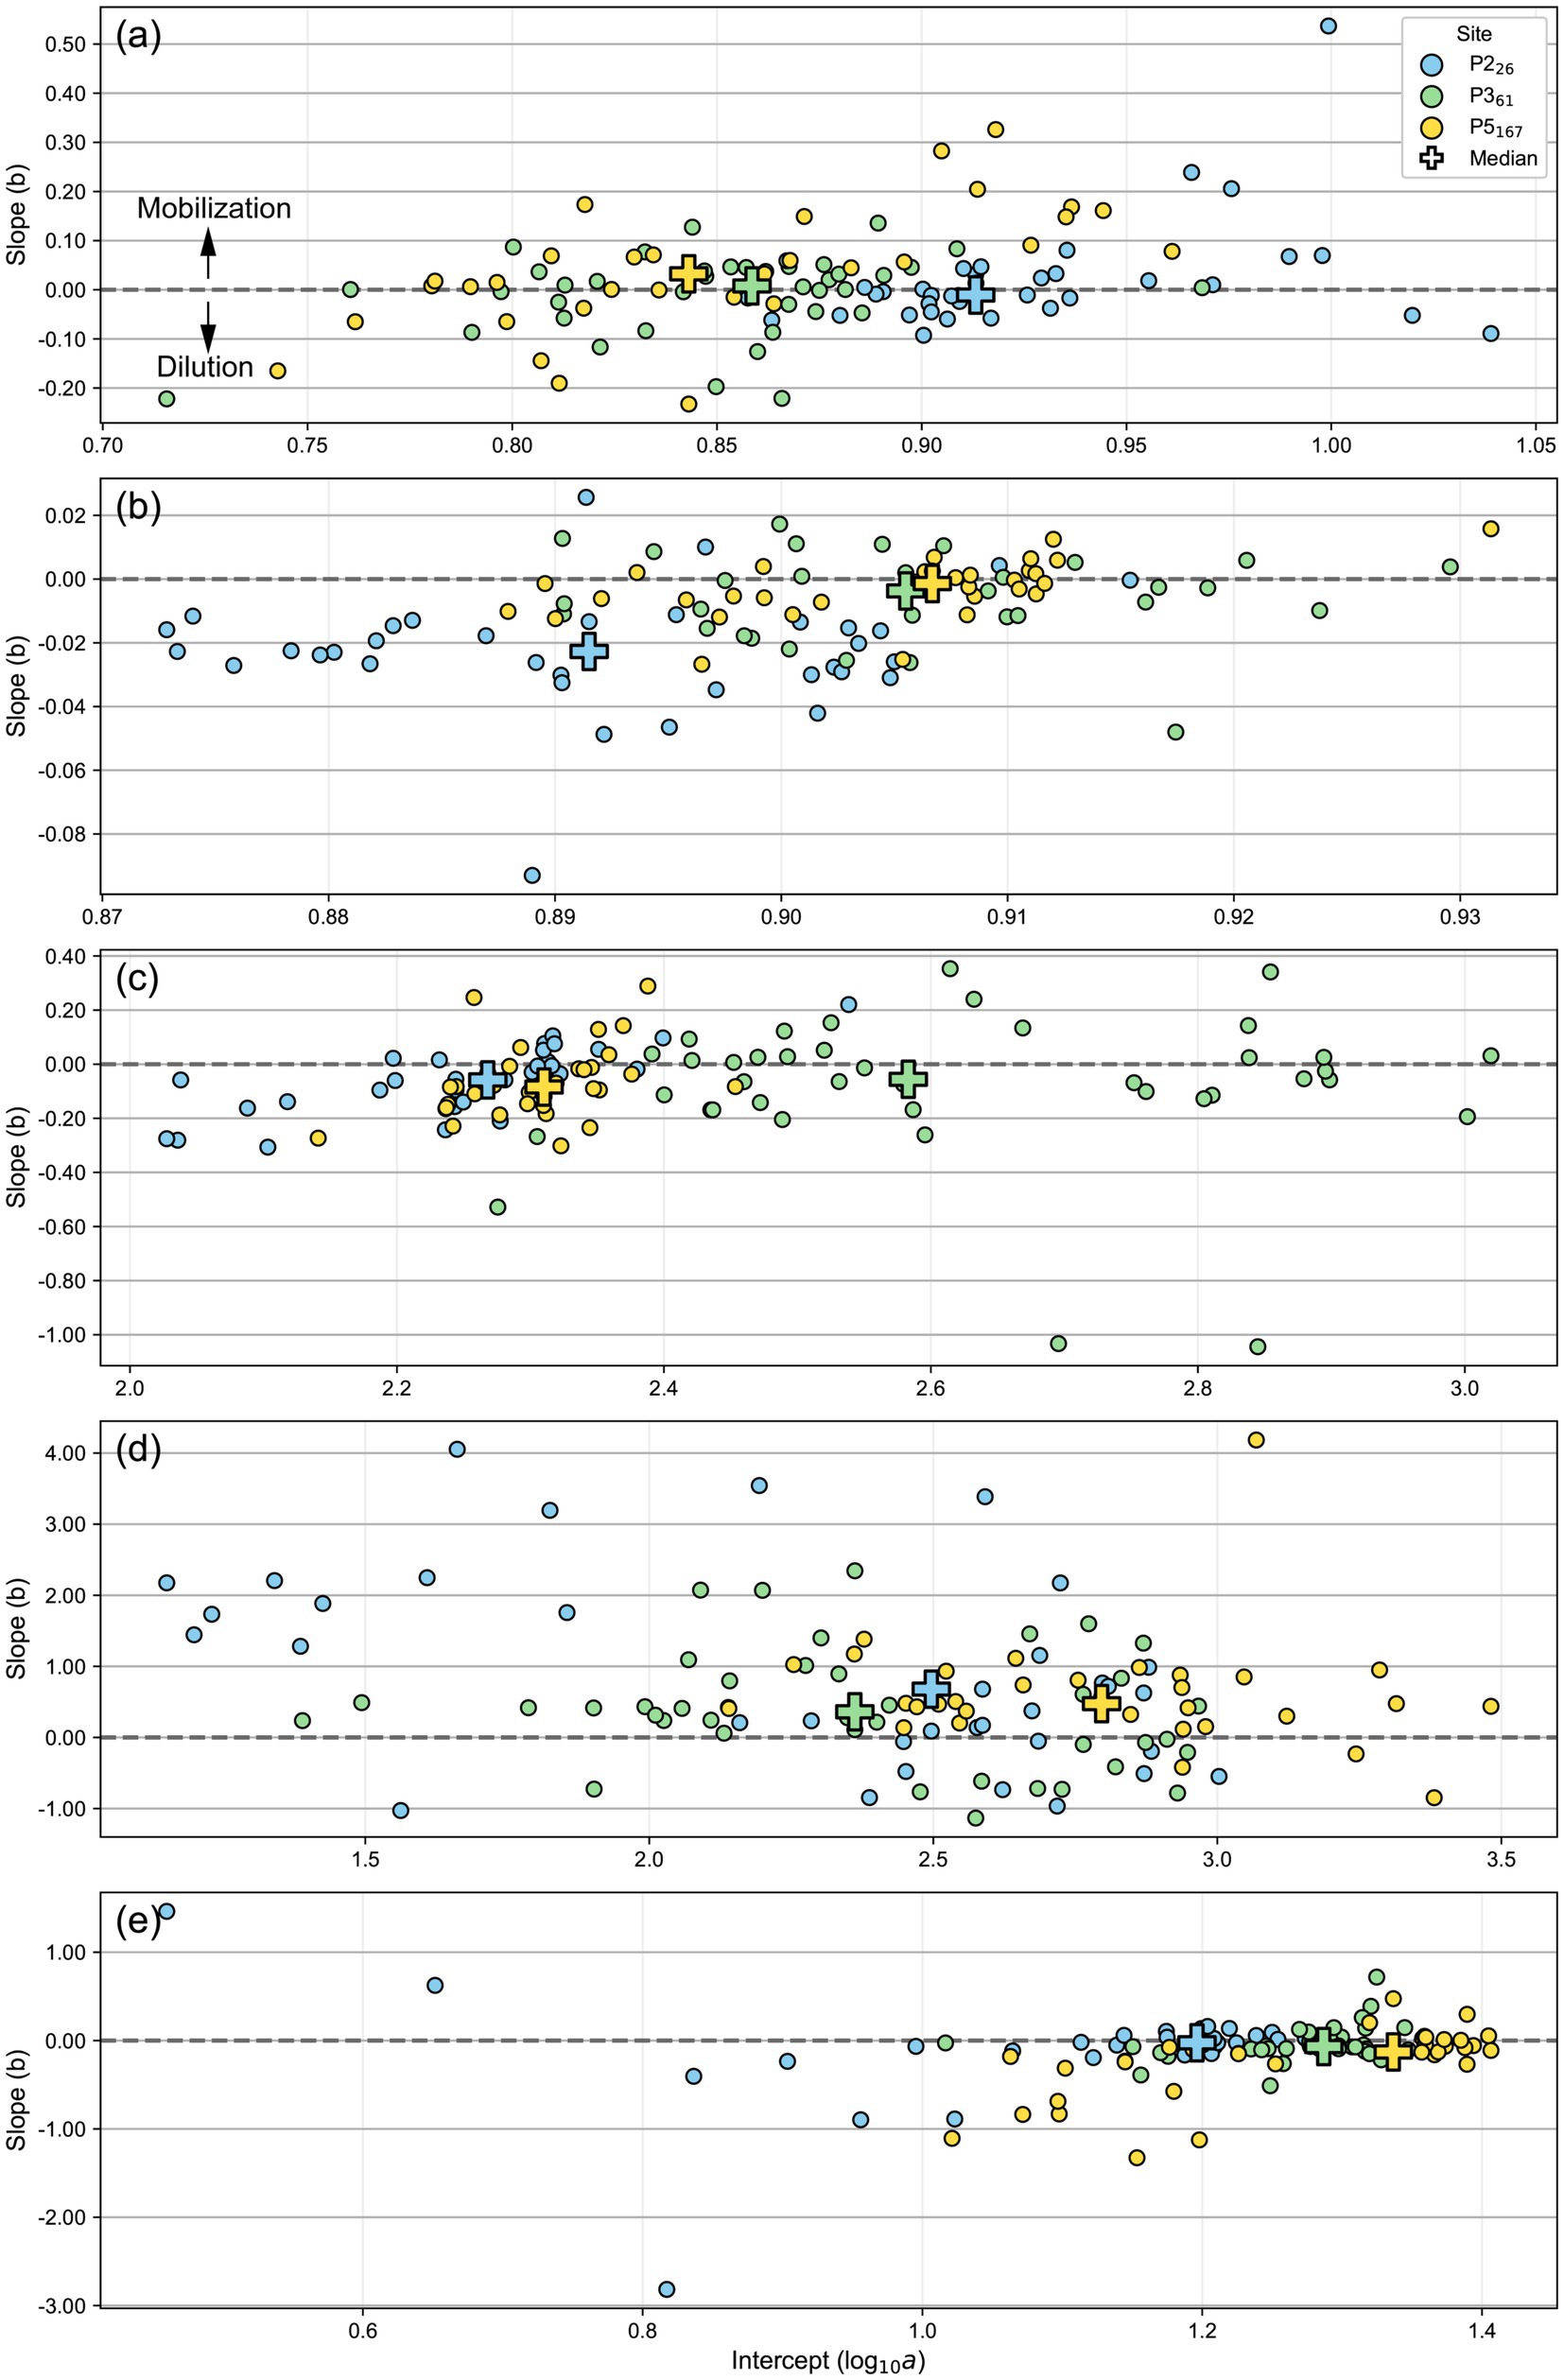
Figure 5. Post-fire, event-based concentration-discharge (C-Q) slope versus intercept plots for (a) DO, (b) pH, (c) specific conductance, (d) turbidity, and (e) water temperature at sampling locations P2, P3, and P5. Each circle, colored by sampling site, represents the slope and intercept pair obtained for an individual runoff event analysis. Cross markers show the median values for each site. The dashed line at zero slope indicates the transition between mobilization (positive) and dilution (negative) behaviors, and the arrows in the first box illustrate directional trends in the C-Q slope.
The C-Q behavior of DO shifted from dilution to mobilization along the fluvial network. At P2, the median slope was slightly negative (−0.011, IQR = 0.073), with 46% of events exhibiting dilution behavior. Downstream locations showed positive median slopes at P3 (0.008) and P5 (0.032), with the dominant behavior shifting towards mobilization (48 and 45% of the events). The IQRs of both also increased (0.090 and 0.106, respectively), indicating larger variability in transport behavior in downstream sites. In contrast, the median intercept, which is the log10 of the concentration, decreases downstream, from 0.913 (8.2 mg/L) at P2 to 0.843 (7.0 mg/L) at P5. This shift suggests a longitudinal change in DO dynamics, potentially reflecting decreased DO demand and increased reaeration capacity downstream.
The C-Q behavior of pH trended toward chemostatic behavior downstream. The median slopes were more negative at P2 (−0.023) and continued to trend more positive moving downstream to P3 and P5 (−0.004 and −0.001), with a decreasing variability in the observed slope values from P2 to P5 (IQR = 0.015 and 0.009). Dilution was the most prominent behavior observed at 89, 55, and 39% at P2, P3, and P5, but chemostasis and mobilization behavior increased from P2 to P5. The median intercept values also increased slightly downstream, from 0.892 (7.80) at P2 before stabilizing at 0.905 (8.04) and 0.907 (8.07) at P3 and P5.
Specific conductance exhibited a consistently negative median slope at all sites (P2 = −0.058, P3 = −0.056, and P5 = −0.084), suggesting that dilution was the dominant response to increasing discharge. Dilution events accounted for over half of the events at each site, with the largest proportion (73%) of dilution events observed at P5. The median intercept values increased from 2.268 at P2 (185 μS/cm) to 2.583 at P3 (383 μS/cm) before decreasing to 2.310 at P5 (204 μS/cm).
Turbidity exhibited the most consistently mobilizing behavior along the fluvial network. The median slopes were positive at all sites (0.680 at P2, 0.361 at P3, and 0.475 at P5), and most of the events were classified as mobilization (69% at P2, 70% at P3, and 91% at P5). The variability of the slope values decreased downstream from P2 to P5 (IQR = 1.876 and 0.554, respectively). The median intercept decreased from 2.496 (313 FNU) at P2 to 2.362 (230 FNU) at P3, before increasing to its highest value of 2.796 (625 FNU) at P5 after joining the Pecos River.
Water temperature exhibited consistent dilution behavior, with the proportion of all events classified as such increasing from 46% at P2 to 67% at P5. The median slopes were increasingly negative through the fluvial network (−0.025, −0.068, and −0.129 at P2, P3, and P5, respectively), suggesting that runoff events cooled down the stream water. There was an expected consistent increase in the water temperature through the network due to increasing aridity and lower elevations, with median intercepts changing from 1.196 (15.7 °C) to 1.337 (21.7 °C).
These results show that C-Q behavior differed by parameter and by location along the fluvial network. Some parameters (e.g., turbidity, temperature) displayed consistent patterns across sites, while others (e.g., DO, pH) showed longitudinal transitions in behavior (Figure 5). The spatial variations in slope and intercept magnitudes highlight the importance of considering network position when assessing post-fire solute export.
Multivariate patterns in C-Q behavior and event drivers
At P2, the PCA revealed three distinct groups (Figure 6). The first, comprising the C-Q slope of turbidity, runoff volume, and event duration, reflects strong mobilization of particulate matter during larger, longer-duration events. A second group links the C-Q slope of specific conductance, average air temperature, EVI, prior runoff volume, indicating seasonal warming, vegetation recovery and greenness, and antecedent wetness are jointly associated with the mobilization of dissolved ions. A third group includes the C-Q slopes of pH and water temperature, which respond similarly to events but independently of event size or seasonality. Notably, the C-Q slope of DO was orthogonal to that of turbidity, suggesting that DO replenishing mechanisms countered expected increases in biochemical DO demand when turbidity increased. The Days from Fire vector was short and misaligned with any C-Q slope, suggesting that recovery time had not yet emerged as a dominant influence. Instead, acute hydrologic and seasonal drivers remained the primary controls on C-Q export behavior during the first 18 months post-fire.
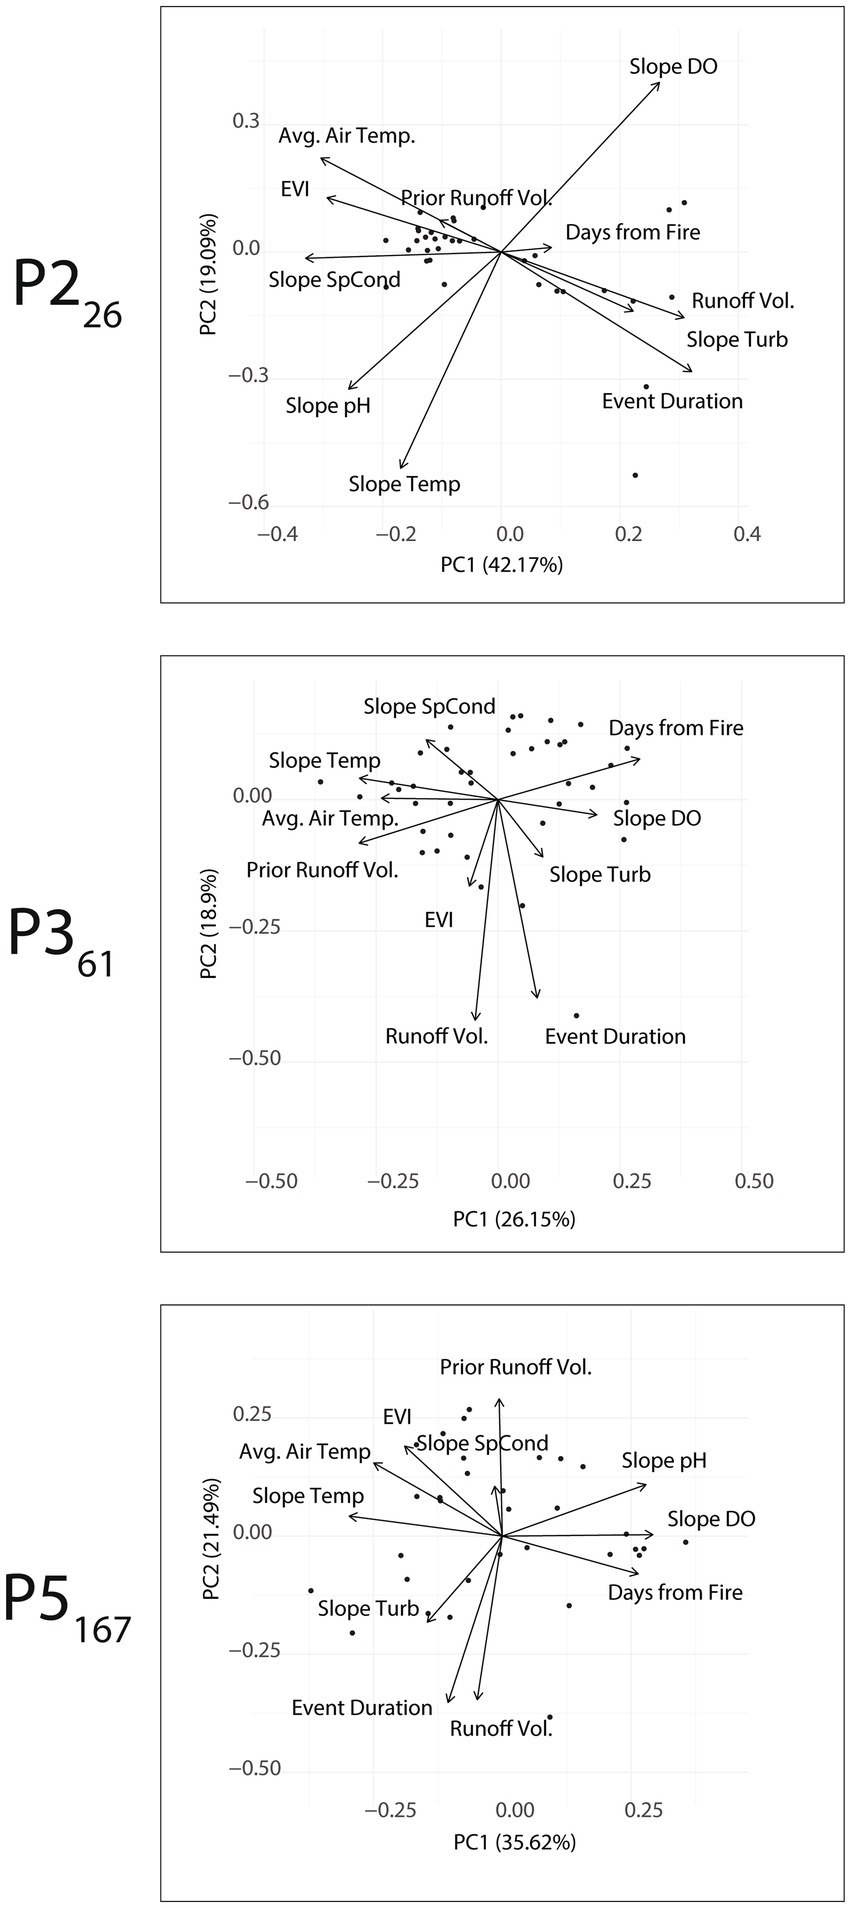
Figure 6. PCA biplots including event features and C-Q slopes for each water quality parameter and sampling location. Some feature and water quality parameter names were simplified to improve clarity, i.e., average air temperature (Avg. Air Temp.), runoff volume (Runoff Vol.), prior runoff volume (Prior Runoff Vol.), enhanced vegetation index (EVI), days since fire declaration (Days from Fire), water temperature (Temp.), specific conductance (SpCond), turbidity (Turb.), dissolved oxygen (DO). The pH slope was excluded from PCA analysis at P3 due to missing values for the second Monsoon season.
At P3, the PCA biplot reveals distinct groupings of C-Q behavior that reflect the combined influence of seasonal conditions, event magnitude, and post-fire recovery. One group includes the C-Q slope of water temperature, average air temperature, and prior runoff volume, indicating a relationship between seasonal and antecedent watershed conditions and thermal responses. A second group links EVI, runoff volume, and event duration, highlighting the role of snowmelt and monsoon-season events, where greener vegetation coincides with larger, longer runoff episodes. Closely aligned with this, the C-Q slope of turbidity clusters with event duration and runoff volume, showing that turbidity export remains strongly event-driven at this site. In contrast, the C-Q slope of DO aligns with Days from Fire, indicating that DO export is increasingly shaped by longer-term recovery processes rather than immediate hydrologic forcing. Finally, the C-Q slope of specific conductance stands apart from other variables, suggesting that it reflects more localized or variable dissolved ion transport. These patterns indicate that P3, as a mid-network site, is shaped by a blend of upstream fire effects, seasonal hydrology, and ongoing recovery, with different water quality parameters responding to distinct environmental timescales.
At P5, the PCA analysis using 45° arcs reveals more groups of a small number of clearly aligned vectors, reflecting distinct environmental controls on C-Q behavior. The C-Q slope of water temperature and average air temperature form one group, indicating that thermal C-Q behavior responses are closely tied to seasonal warming, consistent with increased solar input and reduced canopy shading during warmer periods far from the forested mountains. EVI aligns with average air temperature and prior runoff volume, which indicates vegetation greenness and antecedent moisture co-occur and shape runoff dynamics. The C-Q slope of specific conductance and prior runoff volume is also directionally consistent, highlighting a pathway where wet antecedent conditions promote ion flushing. The C-Q slope of DO and Days from Fire form a recovery-aligned pair, indicating that DO behavior continues to reflect long-term ecological stabilization post-fire. On the event-driven side, runoff volume and event duration align tightly, and the C-Q slope of turbidity and event duration are also linked, highlighting that the magnitude and persistence of runoff events still influence sediment mobilization at P5. The C-Q slope of pH does not fall within 45° of any group, indicating more complex or isolated behaviors. Therefore, seasonal forcing, antecedent wetness, storm intensity, and recovery time each leave measurable and distinct signatures on C-Q transport behavior post-fire.
Figure 7 summarizes the event features that exhibit strong correlations (p < 0.05) with three or more of the C-Q event slopes. At P2, average air temperature, runoff volume, and event duration were key drivers strongly associated with changes in C-Q behavior. Warmer air temperatures were correlated with events featuring more mobilization of specific conductance and increased water temperatures, while DO and turbidity were more diluted. Larger and longer runoff events drove more mobilization of turbidity and DO, but more dilution of pH and specific conductance, suggesting that the runoff event size modulates both sediment and chemical responses. At P3, only average air temperature emerged as a significant predictor, associated with more mobilization of pH and specific conductance, but dilution of turbidity, suggesting a seasonal pattern with less influence from runoff size. By contrast, P5 reflected a division between seasonal and recovery influences. There, the increases in the average air temperature during events were linked to more dilution of DO and pH and increases in water temperature. In contrast, Days from Fire was associated with more mobilization of DO and pH, potentially signaling improving ecosystem function over time, alongside more reductions of water temperature. All significant correlations of event features and event slopes can be found in Supplementary Figure S1, and a summary of the minimum and maximum values for the event features can be found for each site in Supplementary Table S8.
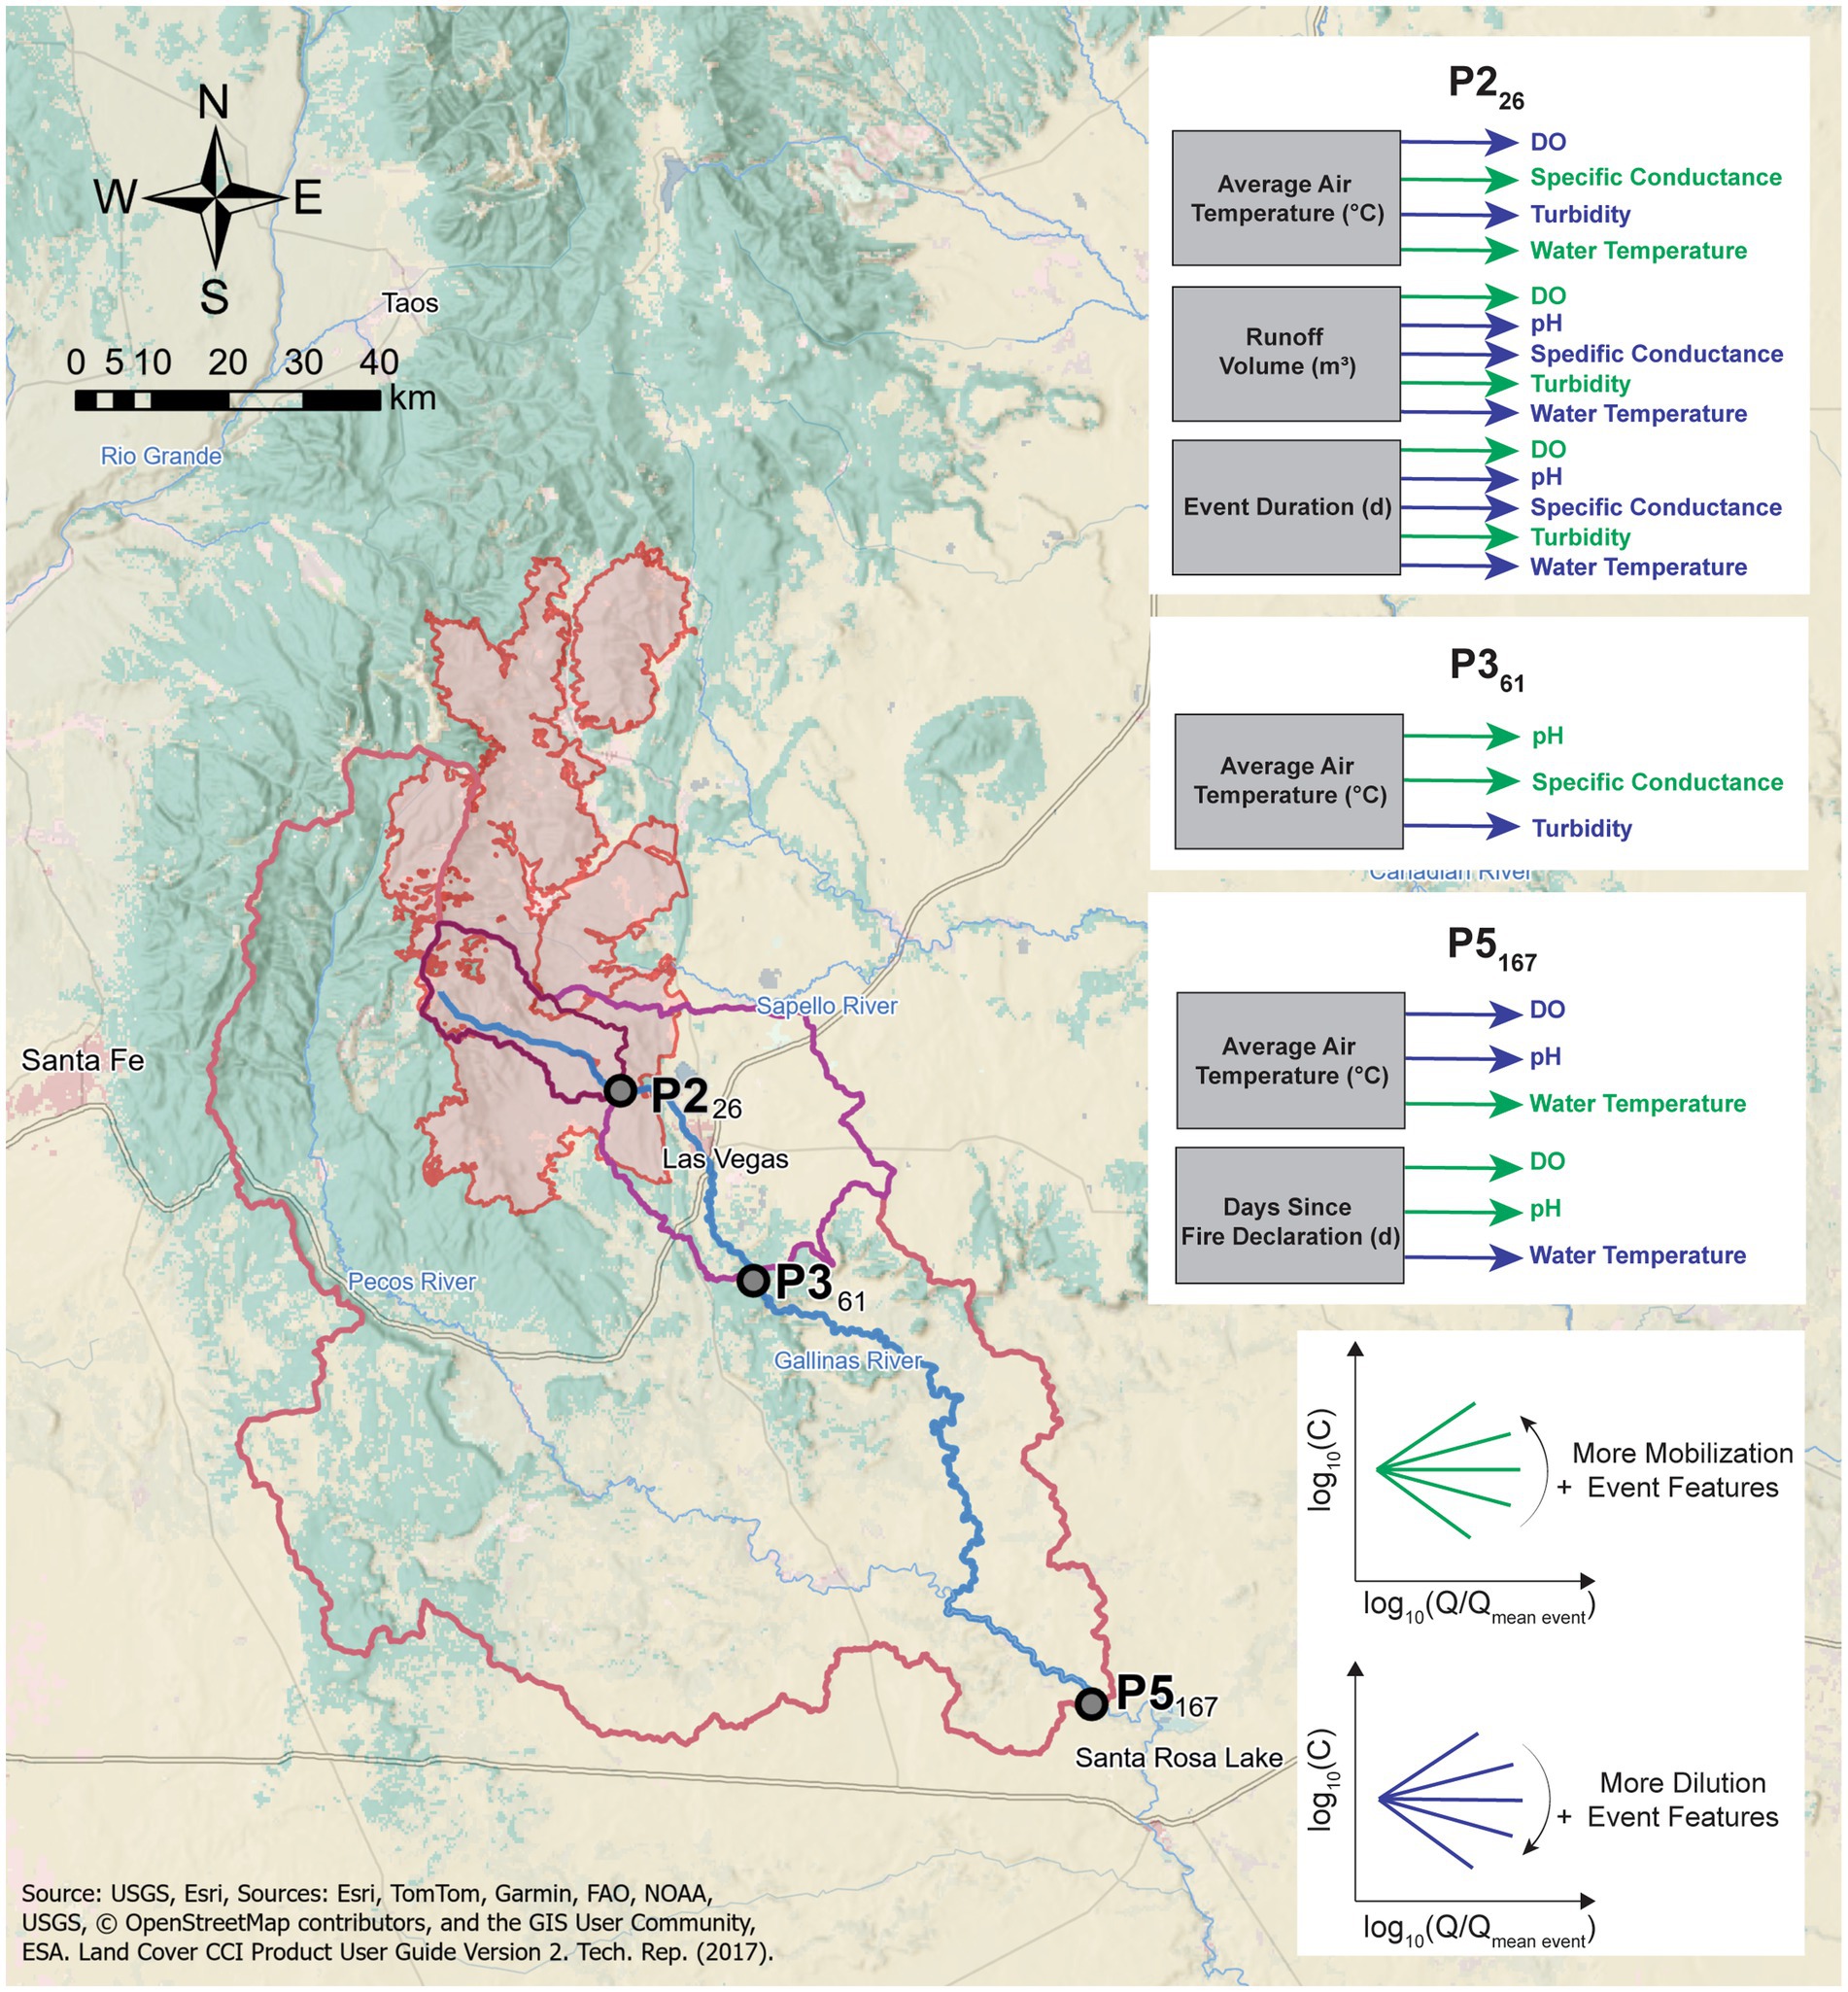
Figure 7. Summary of significant correlations between event features and at least three water quality parameters at each site. Positive Spearman correlations (blue) indicate increasing mobilization behavior of the water quality parameter with increased event feature values. A negative correlation (green) indicates increased dilution behavior with increases in the event feature values. The matrix of correlations with all values is available in Supplementary Figure S1.
These patterns show that C-Q transport behavior evolved downstream, shifting from more acute, event-driven responses at P2 to seasonally modulated export at P3, and longer-term recovery dynamics at P5.
Discussion
This study provides a high-resolution, spatially distributed assessment of post-wildfire water quality behavior in a semiarid fluvial network impacted by the 2022 Hermit’s Peak—Calf Canyon (HPCC) wildfire. Using continuous sensor data collected over 18 months across three locations spanning >160 km, we identified runoff-driven changes in water quality post-fire and pronounced shifts in C-Q export patterns that varied across parameters and watershed position. These shifts reflected differences in burn percentage, hydrologic connectivity, and landscape recovery processes that are detectable only through high-frequency sensor data (Dahm et al., 2015; Nichols et al., 2024).
The value of high-frequency sensors compared to traditional sampling
Comparison of pre- and post-fire discrete samples with sensor-derived event extremes showed that conventional sampling severely underestimates both the magnitude and frequency of post-wildfire water quality disturbances. It is well known that even monthly discrete samples miss most variability of storm events and only provide long-term trends in water quality (Kirchner et al., 2004). Therefore, the comparison of discrete samples before and after the fire only allows us to observe persistent changes in post-fire water quality. The use of post-fire, high-frequency sensor data provides the temporal resolution to examine event-driven extremes, offering a picture of severe and persistent impacts.
Discrete samples showed significant increases in turbidity after the fire (100 JTU and 1,810 NTRU), but the use of sensors post-fire saw values of ~8,500 FNU during storm-driven peaks, which exceeded the maximum post-fire discrete sample by nearly fivefold. There was also a maximum sensor value for specific conductance of 882 μS/cm, which is approximately 2.6 times higher than the post-fire maximum of 335 μS/cm and three times higher than the post-fire discrete sample maximum of 301 μS/cm. Similarly, DO concentrations dropped below 5 mg/L during several events, crossing a threshold of ecological concern never detected in discrete samples (Rosenfeld and Lee, 2022). Event-scale sensor minima and maxima for specific conductance, pH, and temperature also revealed episodic spikes and sags that were invisible in the discrete sampling record.
These findings align with previous studies highlighting the limitations of low-frequency sampling in capturing short-duration water quality disturbances (Dahm et al., 2015; Sherson et al., 2015; Emmerton et al., 2020; Snazelle, 2020). Dahm et al. (2015) showed that extreme post-fire water quality degradation, including rapid declines in DO and increases in turbidity, can only be captured with semi-continuous sensor measurements. Similarly, Emmerton et al. (2020) emphasized that discrete sampling missed key event-driven spikes in water quality parameters following major Canadian wildfires. Such transient but extreme episodes are particularly consequential for aquatic ecosystems and drinking water utilities (Emelko et al., 2011; Bladon et al., 2014; Paul et al., 2022), and our data confirm that without sensor deployments, managers would likely have underestimated the severity of fire-related impacts on turbidity, DO, and pH.
Moreover, even though the EXO2 sensors used in this study are known to underestimate turbidity at high values (Snazelle, 2020), the fact that these instruments still recorded values well beyond the discrete sample range suggests that the actual post-fire extremes may have been even more severe than reported. This supports the routine integration of high-frequency monitoring technologies into post-disturbance response frameworks, particularly in regions where fire impacts intersect with surface water supply systems (Smith et al., 2011; Ball et al., 2021).
Parameter-specific mechanisms driving water quality change
Each water quality parameter responded uniquely to post-fire conditions, reflecting distinct biogeochemical mechanisms and interactions with hydrologic and landscape processes.
Turbidity was the most consistent indicator of post-fire disturbance. Its consistent mobilizing behavior, observed across all events and sites, reflects disturbance pulses triggered by erosion and ash transport following vegetation loss (Moody and Martin, 2001). The magnitude of turbidity responses was most significant at P2, where 95% of the watershed was burned, but high turbidity persisted downstream (P5), suggesting continued sediment sourcing from tributaries and mainstem processes even beyond the immediate burn zone. These patterns are consistent with prior observations in burned headwaters and show the long spatial footprint of sediment impacts after wildfire (Smith et al., 2011).
DO concentrations showed a spatial transition from dilution near the burn area to mobilization downstream. At P2, sharp DO declines during events likely resulted from the influx of oxygen-demanding materials such as fire-related organic matter, fine sediments, and nutrients. These inputs can reduce DO despite increased flow and reaeration (Dahm et al., 2015; Sherson et al., 2015). At P5, DO mobilizes with discharge, showing larger increases from pre-event baselines, likely due to enhanced reaeration, DO solubility, and primary production, a recovery trend also noted by Reale et al. (2015). This spatial gradient suggests a recovery trajectory in which the acute oxygen stress associated with runoff events diminishes with distance from the burn scar and time since fire.
pH values also showed episodic acidification near the burn area. Dilution behavior at P2 is consistent with the mobilization of organic acids, pyrogenic carbon, and sulfates during stormflows, which are common post-fire water chemistry features (Bayley et al., 1992; Rupert, 2001; Cheng et al., 2006). Downstream, the trend toward chemostasis may be associated with buffering from baseflow and unburned tributaries, as well as reduced fire-related inputs due to a smaller burn percent of the contributing watershed.
Specific conductance is typically expected to increase post-fire due to elevated ion concentrations from ash leachate (Raoelison et al., 2023). However, specific conductance declined with increasing discharge throughout the network, supporting a dilution-dominated model. This pattern aligns with observations in arid western streams, where stormflow dilutes ion-rich baseflows (Phillips et al., 2003; Reale et al., 2015). However, elevated median intercepts at mid-network site P3 suggest localized solute contributions from tributaries.
Water temperature showed consistent dilution behavior (i.e., event-driven cooling) across all sites, likely due to cooler stormwater mixing with warmer baseflows. However, intercepts increased downstream, consistent with cumulative solar exposure, lower elevation, and reduction of riparian canopy across the more arid landscape.
Our data showed that the pH and water temperature were within New Mexico Environmental Department regulations. However, DO (< 6.0 mg/L) and specific conductance (> 300 μS/cm) (Figure 4) violated these standards (New Mexico Administrative Code, 2023). Similarly, New Mexico’s surface water quality standards require that turbidity from non-natural sources remain ≤ 10 NTU above background when baseline values are ≤ 50 NTU, or within 20% above background for higher baseline values. Additionally, sustained turbidity episodes beyond durations known to disrupt feeding behavior are considered violations. During several post-fire events in our study, post-fire disturbances with increased turbidity exceeded these thresholds, especially in baseline periods under 50 NTU, indicating potential ecological impairment under state standards.
Longitudinal shifts in C-Q transport behavior
A key contribution of this study is the documentation of how C-Q transport regimes shift with position along a fluvial network following a gigafire (Linley et al., 2022). Turbidity and water temperature maintained consistent behavior across sites, characterized by mobilization and dilution, respectively. These patterns suggest that both parameters are tightly coupled with hydrologic inputs, particularly storm-driven sediment pulses post-fire and thermal dilution, and are less sensitive to in-stream biochemical or recovery-driven processes (Brown and Hannah, 2007; Smith et al., 2011).
In contrast, DO and pH exhibited clear longitudinal shifts in their C–Q behavior. At the upstream site (P2), DO and pH predominantly showed dilution behavior, consistent with the acute effects of post-fire runoff, including elevated biochemical oxygen demand, sediment and nutrient influx, and acidification from pyrogenic organics (Bayley et al., 1992; Cheng et al., 2006; Dahm et al., 2015). By the time water reached the downstream site (P5), these same parameters shifted toward mobilization or chemostasis. pH showed reduced slope variability and higher intercepts, suggesting increased buffering capacity, mixing with unburned tributaries, sediment attenuation, and possible metabolic recovery (Rupert, 2001; Reale et al., 2015). This spatial increase in chemostasis for pH and DO supports the hypothesis that fire-related disturbances attenuate along the river continuum, particularly due to dilution, sediment deposition, and ecosystem recovery processes (Emelko et al., 2011; Nichols et al., 2024).
The persistence of elevated turbidity at P5, despite a > 160 km separation from the burn area, indicates that fire-related signals can propagate over long distances. Previous results from our studies have shown turbidity, nutrients, and metal propagation to Santa Rosa Lake (downstream of P5) (Khandelwal et al., 2023; Kaphle et al., 2025).
Khandelwal et al. (2023) used the Navigator, an autonomous surface vehicle with GPS and water quality sensors, to carry out high-resolution spatial mapping of water quality conditions in response to post-wildfire runoff events from the wildfire. Those observations, downstream of the last station in this analysis, revealed the continuation of water quality impacts along the watershed’s network and the spatial shifts across the Pecos River- Santa Rosa Lake delta. DO dropped from already low ~6 mg/L concentrations in the Pecos River upstream of the delta to anoxic levels (~0 mg/L) within the delta zone, before recovering closer to the dam. Those DO sags and subsequent recoveries were inversely correlated with turbidity levels, indicating that sediment influx driven by wildfire debris played a critical role in controlling microbial respiration and photosynthetic activity. Zones with low DO also exhibited reduced pH values, suggesting elevated aerobic microbial metabolism and CO₂ release associated with high organic loads from fire-related sediment inputs.
Kaphle et al. (2025) conducted longitudinal assessments of post-fire water quality dynamics and found that NO₃− and TON exhibited strong mobilization trends at P5. They found elevated concentrations of Cr3+, Pb2+, Zn2+, and Sr2+ at P5. Cr3+ concentrations at that site (~0.05 mg/L) were more than double the typical background levels for unaffected streams (0.01–0.02 mg/L) and closely matched concentrations in other post-fire studies (0.03–0.07 mg/L). Similarly, Pb2+ levels at P5 exceed natural background values (<0.05 mg/L). Zn2+ concentrations (~0.30 mg/L) also fell within the elevated post-fire range (0.25–0.35 mg/L), more than doubling the concentrations typically seen in unburned watersheds (~0.10 mg/L). Sr2+ levels (~0.20 mg/L) at P5 were elevated relative to background (~0.10 mg/L) and consistent with limited post-fire data showing increases up to 0.25 mg/L.
Overall, this spatial divergence in C-Q behavior highlights the complex and parameter-specific nature of post-fire water quality recovery and supports the importance of monitoring both proximal and distal sites to capture the full trajectory of aquatic system response (Ball et al., 2021; Paul et al., 2022; Nichols et al., 2024).
Transition from event-scale to recovery-driven controls
Our correlation and PCA analyses revealed a shift in the dominant drivers of C-Q behavior, from short-term hydrologic features upstream to longer-term recovery metrics downstream. At P2, event volume and duration were the strongest predictors of C-Q responses, particularly for turbidity and DO. This pattern shows the rapid mobilization of ash, sediment, and oxygen-demanding materials initiated by post-fire storms, a well-documented driver of post-fire erosion and water quality degradation (Moody and Martin, 2001; Emelko et al., 2011; Murphy et al., 2015).
In contrast, at P5, significant correlations emerged between C-Q behavior and long-term recovery indicators, including time since fire declaration. Positive correlations between DO and pH C-Q slopes and time since fire suggest a gradual improvement in biogeochemical function, potentially due to microbial recovery, enhanced organic matter processing, and the reestablishment of riparian buffers (Bixby et al., 2015; Crockett and Hurteau, 2024). These findings are consistent with studies showing that as burned watersheds transition out of the acute disturbance phase, C-Q dynamics are increasingly related to seasonal (average air temperature) and ecological recovery processes (days since fire declaration), rather than being dominated by individual runoff events.
This temporal evolution of C-Q drivers was further evidenced by a decline in event-driven correlation strength from P2 to P5. While upstream sites responded consistently to runoff-event characteristics, downstream responses became more nuanced and context-dependent, integrating antecedent moisture conditions, vegetation status, and catchment memory.
Implications for monitoring and management
Our findings have important implications for post-wildfire water quality monitoring and watershed management. First, the failure of sporadic discrete sampling to detect critical disturbances, especially in DO and turbidity, highlights the need to expand high-frequency sensor deployments in fire-impacted watersheds. Such sensors can capture rapid water quality disturbances that discrete sampling consistently misses (Sherson et al., 2015; Emmerton et al., 2020; Snazelle, 2020). These omissions can be ecologically consequential, particularly near drinking water intakes and sensitive aquatic habitats. For example, the City of Las Vegas, NM continues to face treatment challenges two years after the HPCC fire, primarily due to recurring turbidity spikes and sediment loads that complicate water treatment operations (Olague, 2024; Wulfeck, 2024).
Second, the transition from event-driven to recovery-driven C-Q behavior downstream suggests that monitoring programs should extend beyond the immediate post-fire period and be adaptively tailored by watershed position. Upstream sites may benefit from real-time alerts to capture acute impacts on water quality, while downstream sites could emphasize long-term ecological recovery metrics, including vegetation regrowth (EVI), baseflow stabilization, and sediment attenuation (Paul et al., 2022; Crockett and Hurteau, 2024; Nichols et al., 2024).
Finally, the spatial divergence in C-Q behavior highlights the importance of distributed monitoring networks. Relying on single-site data can obscure the heterogeneity of post-fire responses across a river network. To capture acute disturbances and chronic recovery signals, longitudinal data collection across multiple nodes is essential, particularly in systems where fire severity, hydrology, and connectivity vary with distance from the burn scar (Dahm et al., 2015; Nichols et al., 2024).
Conclusion
This study provides a detailed, multi-parameter evaluation of post-wildfire water quality responses using high-resolution sensor data collected over 18 months across a > 160 km fluvial network impacted by the Hermit’s Peak—Calf Canyon fire. Through the integration of event-scale C-Q dynamics, spatial comparisons across watershed positions, and multivariate analyses of environmental drivers, we advance understanding of how wildfire affects riverine water quality over time and space.
Our findings show that the most severe and ecologically consequential impacts, including turbidity surges exceeding 8,500 FNU and DO concentrations falling below water quality standards (~5 mg/L), occurred near the burn area during runoff events. These extremes were entirely missed by traditional discrete sampling. Concentration-discharge behavior also varied substantially across sites: turbidity consistently increased with flow (mobilization) at all locations, while DO and pH transitioned from dilution-dominated behavior upstream to more chemostatic or mobilizing behavior downstream. Specific conductance declined with flow across the network, and water temperature consistently exhibited dilution, with stronger effects at downstream sites.
These patterns indicate a spatial and temporal evolution in dominant controls on water quality. Upstream C-Q behavior was closely linked to event-scale hydrologic features such as runoff volume, runoff duration, and air temperature (seasonal indicator), consistent with acute post-fire disturbance. In contrast, downstream responses were less unique and more strongly influenced by longer-term indicators of watershed recovery, including time since fire.
Importantly, our results highlight the limitations of low-frequency sampling in capturing post-fire water quality disturbances and demonstrate the value of continuous monitoring for research and management. The persistence of elevated turbidity and evolving C-Q behavior more than a year after the fire suggests that monitoring efforts should extend beyond the immediate post-burn period and be spatially distributed to account for network-scale heterogeneity.
This study contributes new insight into the trajectories of post-fire water quality and integrates sensor-based monitoring with hydrologic and landscape analysis by capturing both acute impacts and early signs of recovery. Our findings can inform the design of more responsive, risk-aware water resource management strategies in fire-prone regions.
Data availability statement
Publicly available datasets were analyzed in this study. This data can be found here: 10.5281/zenodo.16587249.
Author contributions
PT: Software, Visualization, Formal analysis, Data curation, Resources, Writing – original draft, Conceptualization, Investigation, Validation, Methodology, Writing – review & editing. DH: Methodology, Investigation, Funding acquisition, Writing – review & editing. RG-P: Writing – original draft, Software, Data curation, Writing – review & editing, Funding acquisition, Resources, Investigation, Visualization, Project administration, Formal analysis, Methodology, Validation, Supervision, Conceptualization.
Funding
The author(s) declare that financial support was received for the research and/or publication of this article. The National Science Foundation funded this work through grants CBET 2054444 to RG-P and DH, and HDR 1914490 to RG-P. USACE supported part of this research through Cooperative Agreement W912HZ-14-2-0014 to DH and RG-P.
Acknowledgments
We would like to thank Eric Joseph, Justin Nichols, Asmita Kaphle, Lina Rodríguez-Castillo, and Aashish Khandelwal for their work on our rapid response research team, which included the setup, maintenance, and data acquisition tasks.
Conflict of interest
The authors declare that the research was conducted in the absence of any commercial or financial relationships that could be construed as a potential conflict of interest.
Generative AI statement
The authors declare that no Gen AI was used in the creation of this manuscript.
Any alternative text (alt text) provided alongside figures in this article has been generated by Frontiers with the support of artificial intelligence and reasonable efforts have been made to ensure accuracy, including review by the authors wherever possible. If you identify any issues, please contact us.
Publisher’s note
All claims expressed in this article are solely those of the authors and do not necessarily represent those of their affiliated organizations, or those of the publisher, the editors and the reviewers. Any product that may be evaluated in this article, or claim that may be made by its manufacturer, is not guaranteed or endorsed by the publisher.
Supplementary material
The Supplementary material for this article can be found online at: https://www.frontiersin.org/articles/10.3389/frwa.2025.1676600/full#supplementary-material
References
Abatzoglou, J. T., and Williams, A. P. (2016). Impact of anthropogenic climate change on wildfire across western US forests. Proc. Natl. Acad. Sci. USA 113, 11770–11775. doi: 10.1073/pnas.1607171113
Allen, C. D., Savage, M., Falk, D. A., Suckling, K. F., Swetnam, T. W., Schulke, T., et al. (2002). Ecological restoration of southwestern ponderosa pine ecosystems: a broad perspective. Ecological Applications. 12, 1418–1433. doi: 10.2307/3099981
Ba, R., Song, W., Lovallo, M., Zhang, H., and Telesca, L. (2022). Informational analysis of MODIS NDVI and EVI time series of sites affected and unaffected by wildfires. Phys. A Stat. Mech. Appl. 604:127911. doi: 10.1016/j.physa.2022.127911
Ball, G., Regier, P., González-Pinzón, R., Reale, J., and Van Horn, D. (2021). Wildfires increasingly impact western US fluvial networks. Nat. Commun. 12:2484. doi: 10.1038/s41467-021-22747-3
Bash, J., Berman, C., and Bolton, S. (2001). Effects of turbidity and suspended solids on salmonids : University of Washington Water Center. Available online at: https://digital.lib.washington.edu/researchworks/items/91e9fb0c-e579-48f2-a897-813416c0faa1
Bayley, S. E., Schindler, D. W., Parker, B. R., Stainton, M. P., and Beaty, K. G. (1992). Effects of forest fire and drought on acidity of a base-poor boreal forest stream: similarities between climatic warming and acidic precipitation. Biogeochemistry 17, 191–204. doi: 10.1007/BF00004041
Bixby, R. J., Cooper, S. D., Gresswell, R. E., Brown, L. E., Dahm, C. N., and Dwire, K. A. (2015). Fire effects on aquatic ecosystems: an assessment of the current state of the science. Freshw. Sci. 34, 1340–1350. doi: 10.1086/684073
Bladon, K. D., Emelko, M. B., Silins, U., and Stone, M. (2014). Wildfire and the future of water supply. Environ. Sci. Technol. 48, 8936–8943. doi: 10.1021/es500130g
Brown, L. E., and Hannah, D. M. (2007). Alpine stream temperature response to storm events. J. Hydrometeorol. 8, 952–967. doi: 10.1175/JHM597.1
Brown, T. C., Hobbins, M. T., and Ramirez, J. A. (2008). Spatial distribution of water supply in the coterminous United States. J. Am. Water Resour. Assoc. 44, 1474–1487. doi: 10.1111/j.1752-1688.2008.00252.x
Cheng, C.-H., Lehmann, J., Thies, J. E., Burton, S. D., and Engelhard, M. H. (2006). Oxidation of black carbon by biotic and abiotic processes. Org. Geochem. 37, 1477–1488. doi: 10.1016/j.orggeochem.2006.06.022
Crandall, T., Jones, E., Greenhalgh, M., Frei, R. J., Griffin, N., Severe, E., et al. (2021). Megafire affects stream sediment flux and dissolved organic matter reactivity, but land use dominates nutrient dynamics in semiarid watersheds. PLoS One 16, e0257733–e0257729. doi: 10.1371/journal.pone.0257733
Crockett, J. L., and Hurteau, M. D. (2024). Climate limits vegetation green-up more than slope, soil erodibility, and immediate precipitation following high-severity wildfire. Fire Ecol. 20:41. doi: 10.1186/s42408-024-00264-0
Dahm, C. N., Candelaria-Ley, R. I., Reale, C. S., Reale, J. K., and Van Horn, D. J. (2015). Extreme water quality degradation following a catastrophic forest fire. Freshw. Biol. 60, 2584–2599. doi: 10.1111/fwb.12548
Davies-Colley, R., Hughes, A. O., Vincent, A. G., and Heubeck, S. (2021). Weak numerical comparability of ISO-7027-compliant nephelometers. Ramifications for turbidity measurement applications. Hydrol. Process. 35:14399. doi: 10.1002/hyp.14399
Dennison, P. E., Brewer, S. C., Arnold, J. D., and Moritz, M. A. (2014). Large wildfire trends in the western United States, 1984-2011. Geophys. Res. Lett. 41, 2928–2933. doi: 10.1002/2014GL059576
Emelko, M. B., Silins, U., Bladon, K. D., and Stone, M. (2011). Implications of land disturbance on drinking water treatability in a changing climate: demonstrating the need for “source water supply and protection” strategies. Water Res. 45, 461–472. doi: 10.1016/j.watres.2010.08.051
Emmerton, C. A., Cooke, C. A., Hustins, S., Silins, U., Emelko, M. B., Lewis, T., et al. (2020). Severe western Canadian wildfire affects water quality even at large basin scales. Water Res. 183:116071. doi: 10.1016/j.watres.2020.116071
Hoell, A., Funk, C., Barlow, M., and Shukla, S. (2016). “Recent and possible future variations in the North American monsoon” in The monsoons and climate change: Observations and modeling. eds. L. M. V. Carvalho and C. Jones (Cham: Springer International Publishing), 149–162.
Johnston, S. G., and Maher, D. T. (2022). Drought, megafires and flood - climate extreme impacts on catchment-scale river water quality on Australia’s east coast. Water Res. 218:118510. doi: 10.1016/j.watres.2022.118510
Jolliffe, I. T., and Cadima, J. (2016). Principal component analysis: a review and recent developments. Phil. Trans. R. Soc. A 374:20150202. doi: 10.1098/rsta.2015.0202
Kaphle, A., Rodríguez, L., Tunby, P., Nichols, J., Khandelwal, A., Joseph, E., et al. (2025). Propagation of nutrients and metals after the 2022 Hermit’s Peak—Calf Canyon gigafire. Front. Water 7:1636421. doi: 10.3389/frwa.2025.1636421
Khandelwal, A., Castillo, T., and González-Pinzón, R. (2023). Development of the navigator: a Lagrangian sensing system to characterize surface freshwater ecosystems. Water Res. 245:120577. doi: 10.1016/j.watres.2023.120577
Kirchner, J. W., Feng, X., Neal, C., and Robson, A. J. (2004). The fine structure of water-quality dynamics: the (high-frequency) wave of the future. Hydrol. Process. 18, 1353–1359. doi: 10.1002/hyp.5537
Knapp, J. L. A., Von Freyberg, J., Studer, B., Kiewiet, L., and Kirchner, J. W. (2020). Concentration–discharge relationships vary among hydrological events, reflecting differences in event characteristics. Hydrol. Earth Syst. Sci. 24, 2561–2576. doi: 10.5194/hess-24-2561-2020
Linley, G. D., Jolly, C. J., Doherty, T. S., Geary, W. L., Armenteras, D., Belcher, C. M., et al. (2022). What do you mean, ‘megafire’? Glob. Ecol. Biogeogr. 31, 1906–1922. doi: 10.1111/geb.13499
Moody, J. A., and Martin, D. A. (2001). Initial hydrologic and geomorphic response following a wildfire in the Colorado front range. Earth Surf. Process. Landforms 26, 1049–1070. doi: 10.1002/esp.253
Murphy, S. F., Writer, J. H., McCleskey, R. B., and Martin, D. A. (2015). The role of precipitation type, intensity, and spatial distribution in source water quality after wildfire. Environ. Res. Lett. 10:84007. doi: 10.1088/1748-9326/10/8/084007
Musolff, A., Schmidt, C., Selle, B., and Fleckenstein, J. H. (2015). Catchment controls on solute export. Adv. Water Resour. 86, 133–146. doi: 10.1016/j.advwatres.2015.09.026
National Interagency Fire Center (2022). National Interagency Fire Center. Inciweb. Available online at: https://inciweb.wildfire.gov/ (Accessed November 26, 2024).
National Water Quality Monitoring Council (2025). Water quality portal. How’s my waterway? Available online at: https://mywaterway.epa.gov/monitoring-report/NWIS/USGS-NM/USGS-08380500/ (Accessed November 12, 2024).
National Weather Service (2024). New Mexico monsoon awareness home. National Weather Service. Available online at: https://www.weather.gov/abq/prepawaremonsoonhome (Accessed October 25, 2024).
New Mexico Administrative Code (2023). Standards for interstate and intrastate surface waters. Available online at: https://www.epa.gov/sites/default/files/2014-12/documents/nmwqs.pdf (Accessed October 13, 2023).
Nichols, J., Joseph, E., Kaphle, A., Tunby, P., Rodríguez, L., Khandelwal, A., et al. (2024). Longitudinal propagation of aquatic disturbances following the largest wildfire recorded in New Mexico, USA. Nat. Commun. 15:7143. doi: 10.1038/s41467-024-51306-9
Olague, B. (2024). The state responds to the water need in Las Vegas following flooding. KRQE News. Available online at: https://www.krqe.com/news/new-mexico/las-vegas-continues-to-ask-residents-to-conserve-water/ (Accessed January 20, 2025).
Oregon State University (2014). PRISM group. Available online at: https://prism.oregonstate.edu (Accessed June 4, 2024).
Paul, M. J., LeDuc, S. D., Lassiter, M. G., Moorhead, L. C., Noyes, P. D., and Leibowitz, S. G. (2022). Wildfire induces changes in receiving waters: a review with considerations for water quality management. Water Resour. Res. 58, 1–28. doi: 10.1029/2021WR030699
Phillips, F. M., Mills, S., Hendrickx, M. H., and Hogan, J. (2003). Environmental tracers applied to quantifying causes of salinity in arid-region rivers: results from the Rio Grande Basin, southwestern USA. Dev. Water Sci. 2003, 327–334. doi: 10.1016/S0167-5648(03)80029-1
R Core Team (2021). R: A language and environment for statistical computing. Vienna, Austria: R Foundation for Statistical Computing.
Raoelison, O. D., Valenca, R., Lee, A., Karim, S., Webster, J. P., Poulin, B. A., et al. (2023). Wildfire impacts on surface water quality parameters: cause of data variability and reporting needs. Environ. Pollut. 317:120713. doi: 10.1016/j.envpol.2022.120713
Reale, J. K., Van Horn, D. J., Condon, K. E., and Dahm, C. N. (2015). The effects of catastrophic wildfire on water quality along a river continuum. Freshw. Sci. 34, 1426–1442. doi: 10.1086/684001
Richardson, C., Montalvo, M., Wagner, S., Barton, R., Paytan, A., Redmond, M., et al. (2024). Exploring the complex effects of wildfire on stream water chemistry: insights from concentration-discharge relationships. Water Resour. Res. 60:e2023WR034940. doi: 10.1029/2023WR034940
Romero, J. (2023). Climate change 2023: synthesis report. Contribution of working groups I, II and III to the sixth assessment report of the intergovernmental panel on climate change, first Geneva, Switzerland.
Rosenfeld, J., and Lee, R. (2022). Thresholds for reduction in fish growth and consumption due to hypoxia: implications for water quality guidelines to protect aquatic life. Environ. Manag. 70, 431–447. doi: 10.1007/s00267-022-01678-9
Rupert, M. G. (2001). Relations among rainstorm runoff, streamflow, pH, and metal concentrations, Summitville Mine area, upper Alamosa River basin, southwest Colorado, 1995-97. doi: 10.3133/wri014027
Seabold, S., and Perktold, J. (2010). Statsmodels: econometric and statistical modeling with python., in 9th Python in Science Conference.
Sheppard, P. R., Comrie, A. C., Packin, G. D., Angersbach, K., and Hughes, M. K. (2002). The climate of the US southwest. Clim. Res. 21, 219–238. doi: 10.3354/cr021219
Sherson, L. R., Van Horn, D. J., Gomez-Velez, J. D., Crossey, L. J., and Dahm, C. N. (2015). Nutrient dynamics in an alpine headwater stream: use of continuous water quality sensors to examine responses to wildfire and precipitation events. Hydrol. Process. 29, 3193–3207. doi: 10.1002/hyp.10426
Smith, H. G., Sheridan, G. J., Lane, P. N. J., Nyman, P., and Haydon, S. (2011). Wildfire effects on water quality in forest catchments: a review with implications for water supply. J. Hydrol. 396, 170–192. doi: 10.1016/j.jhydrol.2010.10.043
Snazelle, T. T. (2020). Field comparison of five in situ turbidity sensors. Virginia: U.S. Geological Survey.
Stone, M., Emelko, M. B., Droppo, I. G., and Silins, U. (2011). Biostabilization and erodibility of cohesive sediment deposits in wildfire-affected streams. Water Res. 45, 521–534. doi: 10.1016/j.watres.2010.09.016
Tang, W., and Carey, S. K. (2017). Hydrun: a MATLAB toolbox for rainfall-runoff analysis. Hydrol. Process. 31, 2670–2682. doi: 10.1002/hyp.11185
Tunby, P. (2025). ptunby/water-quality-HPCC: Data archive: drivers and impacts of changes in water quality behavior from the Hermit’s Peak—Calf Canyon wildfire (v1.0.0). doi: 10.5281/zenodo.16587249
Tunby, P., Nichols, J., Kaphle, A., Khandelwal, A. S., Van Horn, D. J., and González-Pinzón, R. (2023). Development of a general protocol for rapid response research on water quality disturbances and its application for monitoring the largest wildfire recorded in New Mexico, USA. Front. Water 5:1223338. doi: 10.3389/frwa.2023.1223338
Virtanen, P., Gommers, R., Oliphant, T. E., Haberland, M., Reddy, T., Cournapeau, D., et al. (2020). SciPy 1.0: fundamental algorithms for scientific computing in Python. Nat. Methods 17, 261–272. doi: 10.1038/s41592-019-0686-2
Wagner, R. J., Boulger, R. W., Oblinger, C. J., and Smith, B. A. (2006). Guidelines and standard procedures for continuous water-quality monitors: Station operation, record computation, and data reporting., Version 1.0. doi: 10.3133/tm1D3
Westerling, A. L., Hidalgo, H. G., Cayan, D. R., and Swetnam, T. W. (2006). Warming and earlier spring increase Western U.S. Forest Wildfire Activity. Science 313, 940–943. doi: 10.1126/science.1128834
Wulfeck, A. (2024). New Mexico town faces water crisis after burn scar flooding increases risk of pollution. FOX Weather. Available online at: https://www.foxweather.com/weather-news/las-vegas-water-woes (Accessed January 24, 2025).
Keywords: wildfire, water quality, concentration-discharge (C-Q) relationships, semi-continuous monitoring, sensor data
Citation: Tunby P, Van Horn DJ and González-Pinzón R (2025) Drivers and impacts of changes in water quality behavior from the Hermit’s Peak—Calf Canyon wildfire. Front. Water. 7:1676600. doi: 10.3389/frwa.2025.1676600
Edited by:
Marcos D. Mateus, Universidade de Lisboa, PortugalReviewed by:
Nicole Fernandez, Cornell University, United StatesHaley Canham, Utah State University, United States
Copyright © 2025 Tunby, Van Horn and González-Pinzón. This is an open-access article distributed under the terms of the Creative Commons Attribution License (CC BY). The use, distribution or reproduction in other forums is permitted, provided the original author(s) and the copyright owner(s) are credited and that the original publication in this journal is cited, in accordance with accepted academic practice. No use, distribution or reproduction is permitted which does not comply with these terms.
*Correspondence: Ricardo González-Pinzón, Z29uemFyaWNAdW5tLmVkdQ==