 Jared Barber1*
 Amy Carpenter2
 Allison Torsey3Tyler Borgard4
 Rami A. Namas5,6
 Yoram Vodovotz5,6†
 Julia Arciero1†
- 1Department of Mathematical Sciences, Indiana University-Purdue University Indianapolis, Indianapolis, IN, United States
- 2Department of Natural Sciences and Mathematics, Lee University, Cleveland, TN, United States
- 3Department of Mathematics, SUNY Buffalo State, Buffalo, NY, United States
- 4Department of Mathematics, Purdue University, West Lafayette, IN, United States
- 5Department of Surgery, University of Pittsburgh, Pittsburgh, PA, United States
- 6Center for Inflammation and Regeneration Modeling, McGowan Institute for Regenerative Medicine, University of Pittsburgh, Pittsburgh, PA, United States
Sepsis is characterized by an overactive, dysregulated inflammatory response that drives organ dysfunction and often results in death. Mathematical modeling has emerged as an essential tool for understanding the underlying complex biological processes. A system of four ordinary differential equations (ODEs) was developed to simulate the dynamics of bacteria, the pro- and anti-inflammatory responses, and tissue damage (whose molecular correlate is damage-associated molecular pattern [DAMP] molecules and which integrates inputs from the other variables, feeds back to drive further inflammation, and serves as a proxy for whole-organism health status). The ODE model was calibrated to experimental data from E. coli infection in genetically identical rats and was validated with mortality data for these animals. The model demonstrated recovery, aseptic death, or septic death outcomes for a simulated infection while varying the initial inoculum, pathogen growth rate, strength of the local immune response, and activation of the pro-inflammatory response in the system. In general, more septic outcomes were encountered when the initial inoculum of bacteria was increased, the pathogen growth rate was increased, or the host immune response was decreased. The model demonstrated that small changes in parameter values, such as those governing the pathogen or the immune response, could explain the experimentally observed variability in mortality rates among septic rats. A local sensitivity analysis was conducted to understand the magnitude of such parameter effects on system dynamics. Despite successful predictions of mortality, simulated trajectories of bacteria, inflammatory responses, and damage were closely clustered during the initial stages of infection, suggesting that uncertainty in initial conditions could lead to difficulty in predicting outcomes of sepsis by using inflammation biomarker levels.
Introduction
Sepsis is defined as life-threatening organ dysfunction caused by an overwhelming immune response to an infection (Singer et al., 2016). Sepsis and septic shock often lead to organ failure and are leading causes of morbidity and mortality (Singer et al., 2016; Lelubre and Vincent, 2018). In the course of a typical infection, pathogens (e.g., Gram-negative bacteria) infect the host, triggering a pro-inflammatory innate immune response targeted at eliminating the pathogen from the system. The body also mounts an anti-inflammatory response that works to maintain homeostasis and prevent overwhelming inflammation to the system. The acute inflammatory response in sepsis becomes detrimental when it can no longer be contained at the locus of infection (where innate immune mechanisms can help eliminate bacteria) and becomes systemic, leading to collateral damage/dysfunction in the surrounding healthy tissue. Thus, a major goal in sepsis research is to determine why the host mounts an overwhelming inflammatory response to infections which leads to sepsis in some cases but not in others (Horiguchi et al., 2018; Grondman et al., 2020).
Acute inflammatory responses to infection are further complicated by additional variations among sepsis patients (Chen et al., 2011), the complex interplay between pro- and anti-inflammatory mediators and the innate and adaptive immune responses (Delano and Ward, 2016), and a triphasic distribution of patient deaths that occur days, weeks, and years after initial infection (Delano and Ward, 2016). These variations have highlighted the need for patient-specific treatments and novel approaches to sepsis drug design and clinical trials (Vodovotz et al., 2008; Buchman et al., 2016; Day et al., 2018).
Recent decades have brought about improved sepsis treatment practices, including the rapid administration of antibiotics, infection source control, appropriate choice of fluid (crystalloids) for fluid resuscitation, and administration of vasopressors (norepinephrine) (Schorr and Dellinger, 2014). These evolutionary improvements in patient care have reduced in-hospital mortality but have shifted the mortality distribution so that most sepsis-related deaths occur months after treatment (Delano and Ward, 2016). While improved care often allows patients to overcome initial septic episodes, it has been speculated that underlying physiologic/biochemical aberrations combined with sepsis-initiated immune dysfunction place patients at long-term risk for sepsis mortality (Yende et al., 2008). Secondary infections occurring during late stages (>15 days) were shown to correlate with higher levels of opportunistic fungi and bacteria compared to earlier secondary infections (<6 days) (Otto et al., 2011), and impairments in immune function and cytokine secretion were observed in individuals that survived a septic episode (Arens et al., 2016). Despite evidence of late-stage complications or mortality from sepsis (Nedeva, 2021), mortality is still common within a week of sepsis onset; interventions in those cases rely on early identification of septic trajectories, which is often difficult.
Given the complexities of infection and inflammation in vivo and in vitro, mathematical modeling has been used in an attempt to unravel the complexities of inflammation and the immune response (Kumar et al., 2004; Reynolds et al., 2006; Vodovotz et al., 2008; Vodovotz et al., 2009; Day et al., 2018). Multiple mechanistic computational models have described the dynamics of the inflammatory response in the context of a variety of bacterial infections (Clermont et al., 2004; Daun et al., 2008; Kumar et al., 2008). These include equation-based [ordinary (Pilyugin and Antia, 2000; Kumar et al., 2004; Chow et al., 2005; Day et al., 2006; Prince et al., 2006; Reynolds et al., 2006; Vodovotz et al., 2006; Foteinou et al., 2009; Smith et al., 2011; Song et al., 2012; Jarrett et al., 2015; Mai et al., 2015; Shi et al., 2015; Schirm et al., 2016; Brady, 2017; Caudill and Lynch, 2018; Mavroudis et al., 2019) and partial differential equations (Alt and Lauffenburger, 1987; Barber et al., 2013)], agent-based (An, 2001; An, 2004; Cockrell and An, 2017), and hybrid models (Minucci et al., 2020). Although some models are purely theoretical (Alt and Lauffenburger, 1987; Kumar et al., 2004; Day et al., 2006; Reynolds et al., 2006; Cockrell and An, 2017), many were calibrated to experimental data in animals (Chow et al., 2005; Prince et al., 2006; Vodovotz et al., 2006; Smith et al., 2011; Schirm et al., 2016; Brady, 2017) or attempted to replicate clinical outcomes (An, 2001; An, 2004; Foteinou et al., 2009; McDaniel et al., 2019).
The current study implemented a mechanistic model of the immune response to an Escherichia coli (E. coli) infection and aimed to determine whether early data on both the pathogen and the host response are sufficient to predict a health or disease outcome. A parsimonious system of four ordinary differential equations (ODEs) was used to track changes in bacteria, tissue damage, a pro-inflammatory response, and an anti-inflammatory response following the administration of escalating inoculums of E. coli encapsulated in a fibrin clot (an experimental model of Gram-negative peritonitis (Ahrenholz and Simmons, 1980)) in rats. Ultimately, the mathematical model defined in this study was used to evaluate and predict the time dynamics of the bacterial infection, which were observed to vary depending on the initial bacterial dose. The model demonstrated that small changes in the pathogen growth rate or characteristics of the immune response could lead to significantly different mortality times despite identical initial bacterial loads.
Materials and Methods
Experimental Method
Preparation and Dose Estimation of E. coli-Impregnated Fibrin Clot
All animal studies were carried out following approval by the University of Pittsburgh Institutional Animal Use and Care Committee (IACUC approval #0807947) and complied with the NIH Guide for the Care and Use of Laboratory Animals. In this study, experimental data were obtained from rats with peritonitis induced by an E. coli-impregnated fibrin clot, similar to the methods established by Ahrenholz and Simmons (1980) and modified by Namas et al. (2012). In brief, the animals were subjected to a varying dose of E. coli (strain ATCC 25922; American Type Culture Collection, Manassas, VA, United States) inoculum in a fibrin clot introduced into the peritoneum via laparotomy. The E. coli colonies were grown to a specified optical density using a spectrophotometer (DU 530 UV/VIS; Beckman Coulter, Brea, CA, United States) equivalent to a concentration ranging between 1 × 10⁸ to 5 × 10⁸ colony-forming units [CFUs]/clot on the day of bacterial fibrin clot implantation. After the addition of fibrinogen (1%) and Thrombin (15u), the clot was placed in the peritoneum via laparotomy, as described previously (Namas et al., 2012). Since quantification of bacteria at the time of implantation of the fibrin clot via optical density is imprecise, bacteria were quantified after each implantation by limiting dilution plating to obtain a count of implanted E. coli in a given rat (Namas et al., 2012).
We determined that rats that received a fibrin clot inoculum of 1 × 10⁸–2.0 × 10⁸ CFUs/clot had a mortality rate of ∼40–45% after 48 h of clot implantation while rats that received inocula higher than 2.0 × 10⁸ CFUs/clot had a mortality rate of 80% during the first 24 h of implantation (data not shown). All rats in these experiments exhibited signs of septicemia in the form of lethargy, hypothermia, reluctance to feed, tachycardia, and tachypnea after 24 h of E. coli fibrin clot impregnation into the peritoneum. After closing the abdomen, a topical anesthetic was applied over the surgical wound, and the rats were returned to their cages and allowed food and water ad libitum.
Model Calibration and Validation
The experimental studies detailed above generated one experimental data set that was used to calibrate the model and consisted of measurements of bacterial levels at different timepoints in 31 rats injected with increasing doses of bacteria (1.28, 2.48 and 5.05 × 10⁸ bacteria with standard error of the mean of 1.5 × 10⁷, 2.8 × 10⁷, and 1.2 × 10⁸, respectively). A second (separate) experimental data set was used to validate the model and consisted of time to death (mortality; 24, 48, 72, or 96 h) for 27 rats injected with varying doses of bacteria (1–5 × 10⁸ bacteria). We detail the process of model calibration and validation below.
Bacterial levels in the peritoneal cavity measured in individual septic rats, each euthanized at a distinct time point from 24 to 96 h after being impregnated with ≈1 × 10⁸–5 × 10⁸ colony-forming units of E. coli, were used to calibrate the model (“calibration data set”, see Figure 1A; Supplementary Table S1). Observed times to mortality for rats injected with ≈1.4 × 10⁸–4.8 × 10⁸ colony-forming units of E. coli were used to evaluate the predictive capabilities of the ODE model (“validation data set,” see Figure 1B; Supplementary Table S2). These two data sets were derived from two different rat populations.
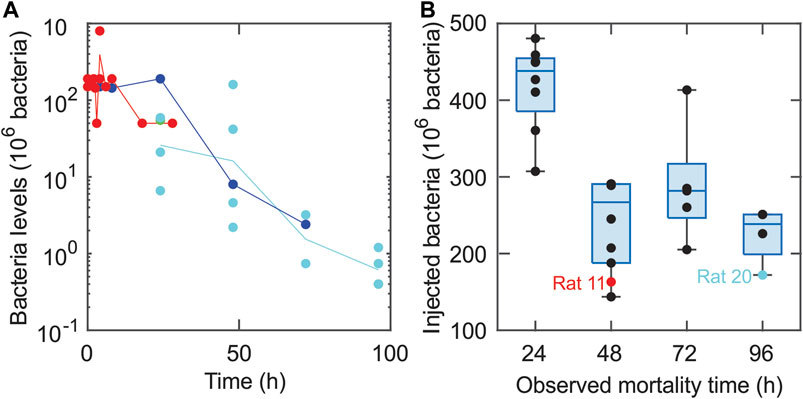
FIGURE 1. Experimental data sets used for model calibration and validation. (A) The calibration data set is depicted using closed circles (●) for each measured bacterial level. Bacterial measurements were obtained for the following three initial bacterial loads: 1.28 × 10⁸ bacteria (cyan), 2.48 × 10⁸ bacteria (blue), and 5.05 × 10⁸ bacteria (red). Lines connect the geometric means of the measurements at each time point. (B) The validation data set includes the observed mortality time for twenty-seven rats injected with varying levels of bacteria via an E. coli-impregnated fibrin clot (each measurement is represented with a ●). The bottoms and tops of the boxes in the box-and-whiskers plot indicate the edges of the first and third quartiles, respectively, and the whiskers extend to the smallest and largest values in each group that are less than 2.7 within-group standard deviations from the mean. The data points for Rat 11 and Rat 20 (Comparison of model simulations and experimental data suggest a high mortality) are denoted by a red and cyan ●, respectively.
The calibration data set (Figure 1A; Supplementary Table S1) was produced using several experiments involving multiple rats in each experiment and three different bacterial levels with mean values of 1.28 × 10⁸, 2.48 × 10⁸, and 5.05 × 10⁸ bacteria. A peritoneal lavage was used to assess the number of bacteria in the peritoneal cavity in each individual animal euthanized at one of the time points indicated in Supplementary Table S1, as detailed in (Namas et al., 2012). This produced an estimate for the expected bacterial levels over time in a rat subject to one of the targeted loads, as seen in Figure 1A. The time points were chosen to be closer together for rats injected with higher bacterial loads, since these animals were more likely to die earlier than animals receiving a lower bacterial inoculum.
In the validation data set (Figure 1B; Supplementary Table S2), the rats were monitored continuously until 96 h, at which time surviving rats were euthanized. If a rat was observed to be dead at a 24-h checkpoint (24, 48, 72, or 96 h), that time point was noted as the “observed mortality time” (OMT) for that rat and the rat was removed from the study. Rats labeled with an OMT = 24, 48, or 72 h either died within the 24 h before their OMT or were euthanized at their OMT (in accordance with IACUC and NIH guidelines) due to being severely unhealthy. Rats labeled with a 96 OMT either died between 72 and 96 h, were severely unhealthy at 96 h, or were relatively healthy at 96 h. Given these distinctions, it is possible that some of the 96 h OMT rats would have survived longer.
Figure 1B depicts the mortality data set (closed circles, •) collected for 27 rats with the observed mortality time on the x-axis and the initial bacterial load on the y-axis. A Bartlett test revealed that the variances of the four groups (OMT = 24, 48, 72, 96 h) were not significantly different (p-value = 0.689) while ten out of ten normality tests (Öner and Deveci Kocakoç, 2017) on the deviations in the data from their respective group norms were passed, suggesting that the data in each group are approximately normally distributed. Analysis of variance (ANOVA), which assumes normally distributed data with equal variances across groups, was then performed to show that the initial bacteria levels for the three OMT = 48-, 72-, and 96-h groups with OMT >24 h were not significantly different from each other (p-value = 0.251). More specific delineation of the health and disease status of the rats in the 96-h group may have led to more variance between the OMT = 48-, 72-, and 96-h groups, but those data were not available at the time of this study. ANOVA on all four groups and use of Tukey’s procedure with 95% confidence intervals suggested that the OMT = 24-h group had significantly different levels of initial bacterial load compared to the OMT = 48-, 72-, and 96-h groups (p-value < 0.0051). The analysis was performed with Matlab (normalitytest (Öner and Deveci Kocakoç, 2017) and Matlab’s vartestn, anova1, and multcompare; Matlab code available via Github, see Supplementary Information), and the resulting conclusions regarding the differences between the groups were consistent with the relationships suggested by the box and whiskers plot shown in Figure 1B. The analysis suggested that there were effectively only two different experimental groups: rats with OMT = 24 h and rats with OMT >24 h. These two categories were therefore used when assessing the predictive capabilities of the model.
Model and Simulations
Model Variables and Interactions
The mathematical model developed in this sepsis study was based on previous models of the immune response (Day et al., 2006; Reynolds et al., 2006; Arciero et al., 2010; Arciero et al., 2013a; Barber et al., 2013). It was used to predict the dependence of health or disease outcomes on pathogen properties and the immune response. Following the administration of E. coli into the peritoneum, the model was used to predict changes in the number of bacteria in the peritoneal cavity of the animal (B), the level of tissue damage (ε), a pro-inflammatory response (M), and an anti-inflammatory response (A). Tissue damage serves as a proxy for whole-organism health status. In vivo, the molecular correlates to tissue damage are damage-associated molecular pattern [DAMP] molecules such as high-mobility group box 1 (HMGB1) (Wang et al., 2004; Lotze and Tracey, 2005). Due to limited calibrating data and a desire for model simplicity, the numerous cells and cytokines that generate the pro- and anti-inflammatory responses were grouped into two general populations, as in previous models (Reynolds et al., 2006; Arciero et al., 2010; Arciero et al., 2013b). Specifically, tissue-specific effects of bacterial infection were assumed to be driven by both resident tissue macrophages and inflammatory cells such as neutrophils and macrophages that infiltrate the tissue from the blood (Cavaillon and Annane, 2006; Remick, 2007; Qiu et al., 2019; Kumar, 2020). Nominally pro-inflammatory cytokines (e.g., TNF, IL-1b, IFN-γ, IL-17A) and anti-inflammatory cytokines (e.g., TGF-β1, IL-10, IL-4, IL-13) were not measured in these experiments, and therefore these cytokines (along with a multitude of chemokines and DAMPs) were grouped into general populations whose effects were assumed independent of inflammatory mediator type.
Figure 2 provides a schematic of the assumed interactions (Remick, 2007) among model populations (schematic adapted from (Reynolds et al., 2006)). A time-dependent dosing function, D(t), defines the release of bacteria from the clot into the surrounding tissue. In response, pro-inflammatory cells activate and begin to destroy the bacteria while also causing collateral tissue damage and promoting self-recruitment. Both pro-inflammatory cells and tissue damage trigger an anti-inflammatory response, which in turn inhibits the growth of the pro-inflammatory response and damage levels. These interactions are labeled in Figure 2 with arrow heads indicating upregulation and blunted ends indicating downregulation.
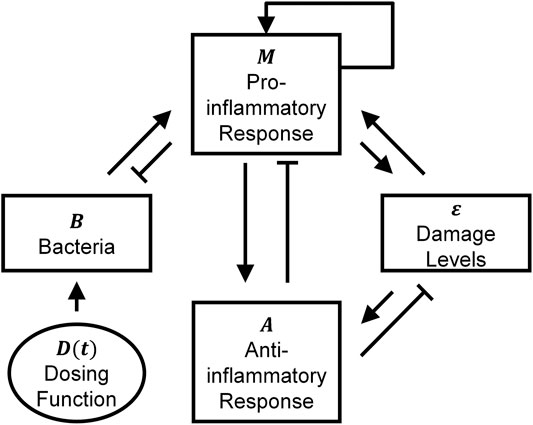
FIGURE 2. Schematic illustrating bacteria-immune interactions among the four model populations. The model schematic shows the interactions between bacteria (B), pro-inflammatory response (M), anti-inflammatory response (A), and damage levels (ε). The external infection is denoted by D(t). The arrow heads correspond to upregulation, and blunted (flat) arrow heads indicate downregulation. This figure was adapted from (Reynolds et al., 2006).
Although it is nearly impossible to state that no other model could account for the variables and interactions depicted in Figure 2 (Ganusov, 2016), the approach utilized in this study adapted previous models (Reynolds et al., 2006; Arciero et al., 2010) of bacterial infection that were successful at reproducing multiple pathophysiological behaviors. The current model was based on clear assumptions, including ones that stemmed from the experimental technique for bacterial administration into the rats. More specifically, Ahrenholz and Simmons (Ahrenholz and Simmons, 1980) originally used the experimental method implemented in this study to consider the theory that increased fibrin levels decrease the severity of infections during E. coli peritonitis. Namas et al. (2012) used the same procedure to explore the effectiveness of hemadsorption techniques on treating septic peritonitis. They performed several initial experiments in which they injected rats with fibrin clots containing varying levels of bacteria. The rats usually died or resolved in a relatively short amount of time, so only the acute immune response was assumed to play a significant role in infection dynamics. Additionally, the experimental technique for bacterial administration introduced bacteria more gradually into the system than instantaneous bacterial injection into the blood. Both observations played a significant role in the modeling choices employed here.
Model Equations
The rate of change of the number of bacteria in an animal is governed by Eq. 1:
The first term, D(t), defines the release of bacteria from the fibrin clot as an exponentially decaying dosing function given by D(t) = D1exp(-kDt). The second term corresponds to logistic growth of bacteria with growth rate k1. The third term corresponds to a non-specific, local, innate immune response that is assumed to eliminate a small amount of pathogen without activating a full systemic inflammatory response (Reynolds et al., 2006). The details of the parameter value derivation for this term are given in (Reynolds et al., 2006). The final term defines the elimination of bacteria by the systemic pro-inflammatory response, which is inhibited by systemic anti-inflammation.
As a first-order approximation, all bacteria initially in the clot were assumed to empty into the surrounding tissue without reproducing or dying, which is equivalent to
We note that multiple dosing functions were considered before choosing the exponential decay model. For example, an additional variable tracking the bacterial levels inside the clot was introduced and allowed to experience growth and/or transfer between the clot and surrounding tissue. Despite providing three additional degrees of freedom, this alternate approach did not yield model fits that were significantly better than using a simple exponential function to define the rate at which bacteria emptied into the surrounding tissue. We also explored making parameter kd a saturating sigmoidal function of Bsource, since experimental observations suggested that a clot with a small number of bacteria had a slower release rate than a clot containing a large inoculum of bacteria. This assumption, however, also did not lead to improved model fits. Thus, an exponential function with constant rate of decay, kd, was implemented in the model and yielded reasonable fits to the data.
Equation 2 defines the rate of change of the systemic pro-inflammatory response (M):
where,
The rate of change of the anti-inflammatory response (A) is defined in Eq. 3:
The first term accounts for the nonzero background level (sA) of anti-inflammatory mediators that resides in the body. In the second term, the pro-inflammatory response and damage activate the anti-inflammatory response. The anti-inflammatory response also self-regulates, which is modeled using the (1 + kAA) term in the denominator. Natural decay of the response occurs at rate µA.
The final model equation (Eq. 4) gives the rate of change of tissue damage levels (ε):
In the first term, damage is repaired at rate 1/τ. In the second term, similar to (Arciero et al., 2010), it was assumed that the system can tolerate a certain level of inflammation before pro-inflammatory cells begin causing damage. This assumption is represented using a threshold function:
T gives the threshold above which immune cells begin to cause damage in the nearby tissue, and f gives the rate at which the cells cause damage.
Initial Conditions
At the onset of each simulation, the rats were assumed to be healthy, corresponding to initial conditions of B(0) = 0, M(0) = 0, A(0) = sA/µA, and ε(0) = 0. Since animals exhibit background levels of anti-inflammatory mediators (e.g., transforming growth factor-β1 (Morikawa et al., 2016)), nonzero initial background levels of anti-inflammatory response mediators were assumed. Parameter Bsource corresponds to the number of bacteria inserted into the clot for each experiment and controls the magnitude of the dosing function, D(t). Thus, Bsource was changed in each simulation (i.e., for each rat) to correspond to the experiment being modeled.
For a sufficiently high Bsource, it was observed that the clots were highly saturated to the point that bacteria left the clot nearly instantaneously. To model this, B(0) was set to Bsource–Bc, where Bc is a fitted parameter thought of as the “clot capacity.” This assumes the number of bacteria that exceed Bc instantaneously enter the surrounding tissue. With only Bc bacteria assumed to remain in the clot after the initial injection, the dosing function is adjusted to depend only on those bacteria (
Parameter Values
Table 1 provides the values, units, and sources for all twenty-six model parameters. Because of the lumped nature of variables M, A, and ε, general units (“M-units”, “A-units”, and “ε-units”) were used to describe these populations, as treated previously (Reynolds et al., 2006; Arciero et al., 2010; Barber et al., 2013). To be consistent with experimental measures, the units for bacteria were given as 106 bacteria. Several parameter estimation techniques were utilized to yield maximum parameter estimation efficiency and physiologically realistic results.
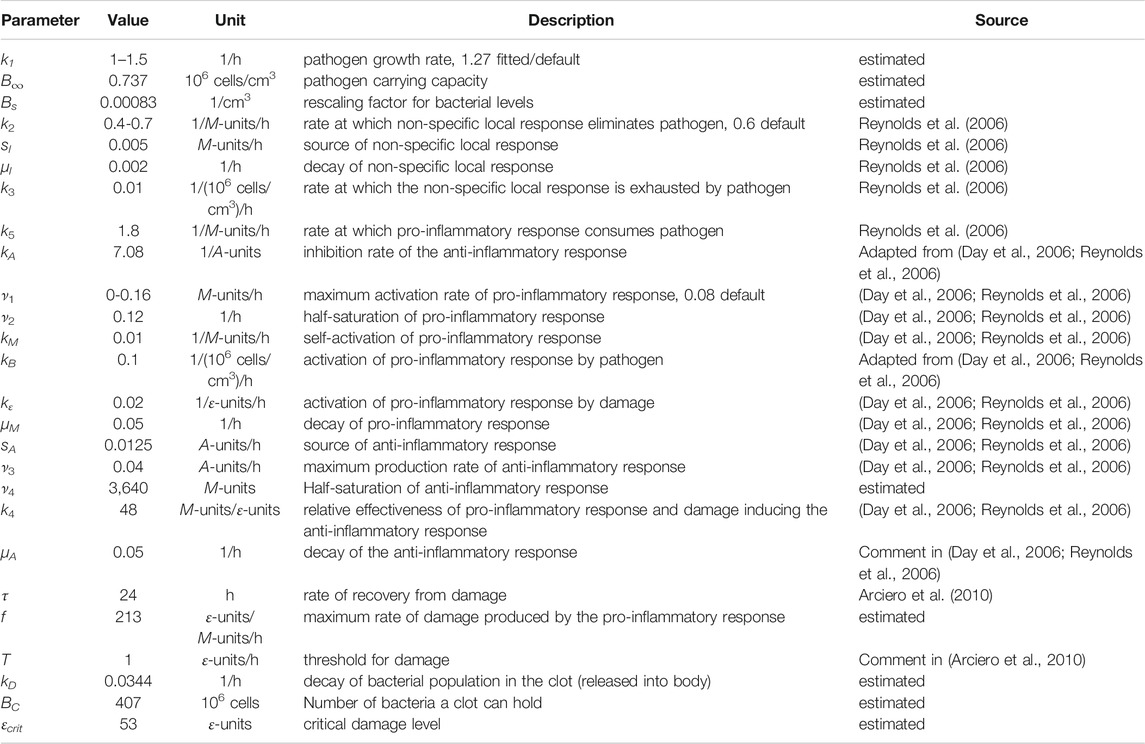
TABLE 1. Model parameter values, units, definitions, and sources.
The unknown parameter space dimension was decreased by estimating several parameter values using previous studies. Following Reynolds et al. (Reynolds et al., 2006), kA was chosen so that anti-inflammatory inhibition is at most 75% (Isler et al., 1999), and μA was chosen to be significantly smaller than typical cytokine decay rates (Bacon et al., 1973; Bocci, 1991; Fuchs et al., 1996; Huhn et al., 1997) because these cytokines have longer lasting downstream effects in the anti-inflammatory cascade. The quality of the parameter fit varied relatively little (<0.1%) when parameter T was allowed to vary. Choosing T too large made [fM ‒ T]+ = 0 for all simulations while choosing T too small made [fM ‒ T]+ ≈ fM, which violates the assumption that the system can tolerate a certain significant level of inflammation (Arciero et al., 2010). Setting T to one avoided both extremes without affecting fit quality.
Seven parameters remained that still had relatively high levels of uncertainty regarding their values. Those parameters (B∞, f, kD, Bs, ν4, Bc, and k1) were estimated using a constrained least squares optimization on log-transformed data. The model fit and corresponding data is shown in Figure 3A. The fit was constrained based on qualitative observations regarding the general inflammation paradigm where typically one of three qualitative outcomes occur (Remick, 2007). In the first type of outcome, termed “healthy recovery,” individuals are affected by an infection, but their inflammatory response is quick and successfully eliminates the infection. In the second type of outcome, termed “aseptic death,” the inflammatory response eliminates many of the bacteria but overwhelms surrounding healthy tissue until death occurs. In the third type, termed “septic death,” large numbers of bacteria survive alongside a mounting inflammatory response and death results. Typical dynamics in other studies (Kumar at al., 2004; Clermont et al., 2004; Reynolds et al., 2006; Day et al., 2006) suggest that lower initial pathogen levels often produce healthy recovery outcomes, mid-level initial pathogen levels often produce aseptic outcomes, and high levels produce septic outcomes. To produce a model capable of similar behavior, the optimization process was constrained so that simulated rats injected with 128 × 106 bacteria experienced healthy recovery outcomes, simulated rats injected with 248 × 106 bacteria experienced aseptic outcomes, and simulated rats injected with 505 × 106 bacteria experienced septic outcomes. Such an approach is supported by the following assumptions: 1) the relatively good fit to the data (R2 = 0.70); 2) relatively low levels of bacteria [O(106)]in the 248 × 106 initial bacterial load calibration experiments after 72 h (i.e., probably not septic); 3) persisting high levels of bacteria [O(107)] in the 505 × 106 initial bacterial load calibration experiments after 48 h (i.e., probably septic); and 4) high mortality rates for loads above 200 × 106 bacteria (Namas et al., 2012). The large range of measured bacterial levels suggested that log-transforming the data was also reasonable. Importantly, the standardized residuals associated with the log-transformed measurements and simulated data (Figure 3B) passed ten out of ten normality tests (Öner and Deveci Kocakoç, 2017). Similar outcomes were not possible for data that were not log-transformed.
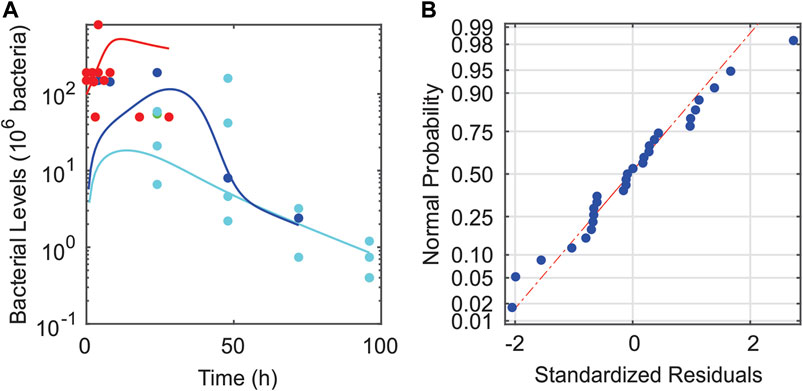
FIGURE 3. Validity of fitting the mathematical model to log-transformed data. (A) Calibrating data set (●) plotted with model-predicted bacterial dynamics over the experimental times considered (solid curves). The following three initial bacterial loads were provided in the data set: 128 × 106 bacteria (cyan), 248 × 106 bacteria (blue), and 505 × 106 bacteria (red). (B) Plot of the standardized residuals for the given fit to log-transformed data. These plots demonstrate the validity of using log-transformation and fitting via least squares.
In the optimization procedure, the following squared residuals of the log-transformed data were minimized:
where yi corresponds to all experimentally measured bacterial levels at the time points and initial bacterial loads listed in Supplementary Table S1, ŷi corresponds to the model-predicted bacterial levels at the same time points and initial bacterial loads, and Nm = 31 is the total number of measurements. Although a range of values for k2 and ν1 are later used to assess their effects on system dynamics (see Outcome Dependence on Parameter Values), during the optimization, and by default unless otherwise stated, k2 and ν1 were set to 0.6 1/M-units/h and 0.08 M-units/h, respectively, to be consistent with the values used in Reynolds et al. (2006). Parameter k1 was fit during the optimization procedure to yield its default value of k1 = 1.27/h; this value was used throughout the study except when assessing the impact of varying this parameter (Outcome Dependence on Parameter Values). Multiple standard optimization techniques were used during the process to ensure the finding of a reasonable optimum, including the Nelder-Mead simplex method, the steepest descent algorithm, and random restarts (Matlab code available via Github, see Supplementary Information). The resulting parameter estimates are given in Table 1.
Sensitivity Calculation
Due to the high dimensionality of parameter space (26 parameters) and the relatively small amount of data (18 independent time points), only a small subset of the parameters should be optimized at any given time to avoid excessive computations and identifiability issues. Identifiability is discussed later in this section but briefly, the larger the number of fitted parameters, the more likely we will encounter an unidentifiable parameter set where multiple sets of parameter values can be used to produce the exact same optimal fit quality. Having no unique optimal parameter set can cause traditional optimization techniques to fail. Here, seven parameters were chosen to be fit based on their associated levels of uncertainty. It is possible that improved fits could be obtained by choosing a different parameter set [e.g., by fixing some of the fit parameters to other estimates found in the literature (Reynolds et al., 2006)]. In addition, while calibrating the model to a given data set will limit the general dynamics that a model may exhibit, it is possible that multiple optimal parameter sets exist whose dynamics significantly differ.
To explore 1) the suitability of the current model, 2) the set of fit parameters, and 3) the possible effects of varying other parameters, a local sensitivity analysis around the current best fit was performed. The relative sensitivities, sij, of the ith simulated measurement (ŷi) with respect to the jth parameter (pj) were estimated using the relative change in ŷi divided by the relative change in the parameter value:
In Eq. 7, the magnitude of δj is chosen to be the square root of machine epsilon. For some parameters, differently signed δj’s would alter the original simulation outcomes (healthy recovery, aseptic, septic). While such changes can happen in reality, this results in significant jumps in simulated measurement values and complicates the analysis. A complete analysis should consider behavior both when such jumps occur and when they do not and average the results. To include all parameters in the jump data analysis, δj would need to be altered so that all parameters experience such jumps. Since the jumps are typically of approximately the same size, an alternate strategy would need to be developed to compare these similarly sized jumps. Because of such complications, only sensitivities with no outcome behavior changes were considered here. At the same time, we note that larger calculated values of |sij| (calculated in the absence of outcome changes) correlate well with increased likelihood of these more significant outcome changes. To gauge the general sensitivity of all measurements to particular parameters and to understand how much a given parameter may affect outcomes, the root mean squared sensitivity (RMSS, Si) was calculated:
where Nm = 31 gives the number of measurements made in the calibrating data set. This sensitivity value (Si) is provided in Supplementary Table S3 and provides an estimate for the relative importance of each parameter in the model fitting process with higher sensitivities corresponding to parameters that affect the fit and corresponding dynamics more. Better and quicker fits tend to result when parameters are more sensitive. For any given set of parameters, a sum of their RMSSs can give an estimate to how sensitive the measurements are to that specific parameter set.
Identifiability is another important consideration when assessing how parameter values affect system dynamics. As an example, model parameters k2 and sl are not identifiable from the data because increasing k2 by 1% will produce the exact same change in the variable outputs as increasing sl by 1%. This is because they only appear in the model as (k2sl), never separately elsewhere. In such scenarios, it is impossible to identify the values of such parameters without additional outside information, as was the case in (Reynolds et al., 2006). Studying the identifiability of a large set of parameters with an associated nonlinear system can be difficult. While standard linear algebra methods can be used for linear systems (Cobelli and Distefano, 1980; Meshkat et al., 2009), nonlinear systems require more specialized and often more computationally and theoretically intensive approaches such as methods utilizing rational functions (Karlsson et al., 2012), methods focusing on local expansions or transformations (Meshkat et al., 2009), and methods centering on observability (Villaverde et al., 2016). Here we employed a local analysis, including linearization about the current model’s parameter values, to consider the issue of identifiability. In the local analysis, identifiability is investigated by considering the collinearity of the parameters, where the effects of changing one parameter can be reproduced by a linear combination of changes in the other parameters. In such cases, parameters can be redundant, with their variations capable of being reproduced by changing the other parameters. The idea of collinearity can be written in terms of the previously mentioned sensitivities: sik = ∑j≠k αjsij ∀i. A corresponding collinearity index can be defined as: CIk = 1/σmin where σmin is the smallest singular value of the associated sensitivity matrix defined by components sij (Brun et al., 2001). Lower collinearity indices indicate more weakly correlated parameters that better describe the local parameter space and typically produce better overall fits and corresponding calibrated models. Such analysis identifies parameters sets that should not be used for fitting (high CIk values) because of the possible presence of redundant parameters. The index can also be used to identify sets of parameters that may produce better fits.
Results
Bacterial Infection Model Dynamics Reproduce Key Sepsis Outcomes
The bacterial infections simulated in this study led to three possible outcomes: healthy recovery, aseptic death, or septic death (Reynolds et al., 2006). In this model, a healthy recovery outcome corresponds to a return to a steady state where pathogenic bacteria are fully eliminated (B = 0) and tissue damage levels return to baseline pre-infection levels (ε = 0). Aseptic death occurs when the bacteria are cleared (B = 0) but damage levels remain elevated (ε > 0). Septic death results when bacteria levels (B > 0) and damage (ε > 0) remain elevated at steady state.
In Figure 4, all three outcomes were predicted to occur given the same level of initial bacterial dose (Bsource = 128 × 106 bacteria) but for three different levels of pathogen growth rate, k1. For a low pathogen growth rate (k1 = 1.2/h), the pro-inflammatory response eliminated the bacteria, and healthy recovery (B/Bmax, M/Mmax, (A-Ahealthy)/Amax, and ε/εmax all less than 1%) was predicted to be restored by 37 h (cyan curve). For a slightly higher pathogen growth rate (k1 = 1.3/h), the pro-inflammatory response also eliminated the bacteria, but caused an elevated and sustained inflammatory response corresponding to aseptic death (blue curve) due to a forward-feedback loop of inflammation → damage → inflammation (Namas et al., 2012). For a high pathogen growth rate (k1 = 1.4/h), the pro-inflammatory response was incapable of eliminating the bacteria, so bacterial levels, damage, and the anti-inflammatory response all remained elevated at the steady state (corresponding to septic death, red curve).
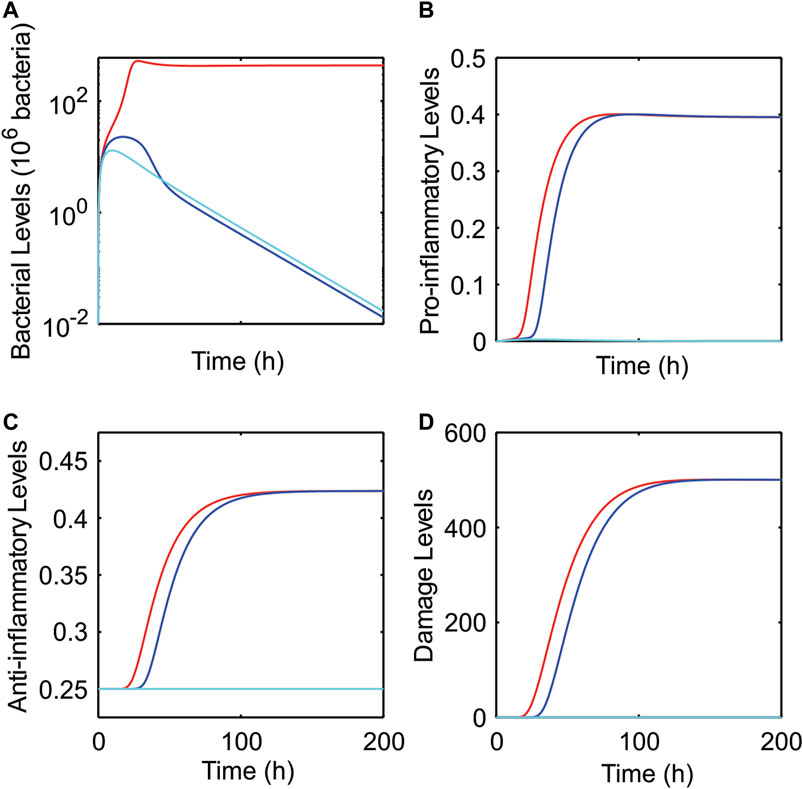
FIGURE 4. Predicted dynamics for healthy recovery, septic, and aseptic outcomes as pathogen growth rate is varied. Model predictions of bacteria (A), pro-inflammatory (B), anti-inflammatory (C), and damage (D) levels as pathogen growth rate (k1) was varied. Three different outcomes were predicted for an initial bacterial infection of Bsource = 128 × 106 bacteria: healthy recovery (k1 = 1.2/h, cyan), asepsis (k1 = 1.3/h, blue), and sepsis (k1 = 1.4/h, red).
Sensitivity Analysis Supports Choice of Initial Model Parameters
Calculating local collinearities and sensitivities allowed for the identification of other parameter sets that are better (from a sensitivity and collinearity point of view) than the best fit identified in this paper. As an example, kD, Bs, Bc, k1, k2, μl, and sA have a sum of RMSSs of 137 and a collinearity index of 17 while the fit used in this paper has a sum of RMSSs of 62 and a collinearity of 55 (less sensitive and more collinear). Despite worse metrics, optimization of this alternative parameter set (originally suggested by our local sensitivity and collinearity analyses) did not significantly improve the overall parameter fit (R2 still approximately 0.70). This suggests that the parameters currently chosen for the model fitting are reasonable despite lower sensitivities and higher collinearities compared to other parameter sets.
The values of RMSS (Supplementary Table S3) showed that the model results are most sensitive to local immune response parameters (i.e., sl, k2, μl and k3) and second-most sensitive to pathogen and dosing related parameters (i.e., k1, kD, Bs, Binf). The other parameters affecting the inflammatory response and damage displayed lower sensitivities.
Comparison of Model Simulations and Experimental Data Suggest a High Mortality Prediction Capacity
Prior studies utilizing reduced models of sepsis-induced inflammation were not docked to data, especially with regard to the level or trajectory of the damage variable that equated with death (Kumar et al., 2004; Day et al., 2006; Reynolds et al., 2006). To address this shortcoming, we compared the behavior of the damage variable in our model to mortality observations in an experimental model of Gram-negative bacterial sepsis.
In Figure 5A, the ability of the model to use damage levels to predict deaths occurring within 24 h (OMT = 24 h) and deaths occurring after 24 h (OMT >24 h) was quantified by comparing damage-based predictions of the mathematical model with the experimental observations in the validation data set. Using the mathematical model, the time of death (i.e., mortality time), tc, for a simulated rat was assumed to be the model-predicted time at which the value of the damage variable, ε, reached a critical damage level (εcrit). If tc ≤ 24 h, the rat was predicted to die within 24 h and to belong to the OMT = 24-h group. Similarly, if 24 < tc ≤ 48, the model-predicted value for the OMT was 48 h and the rat was predicted to belong to the OMT >24-h group. The initial levels of bacteria given to each rat from the validation data set (27 total) were used as inputs to the calibrated model to yield model predictions for survival time (OMT = 24 h or OMT >24 h) for each rat in the study. Model accuracy was defined as the ratio of correct predictions to total number of predictions. Both the predictions and model accuracy are functions of εcrit, as shown in Figure 5A. A relatively high level of accuracy (>80%) was found for a wide range of critical damage levels (49.2 ≤ εcrit ≤ 123.4 ε-units). A maximum accuracy of 96% was attained for εcrit values between 49.8 and 55 ε-units.
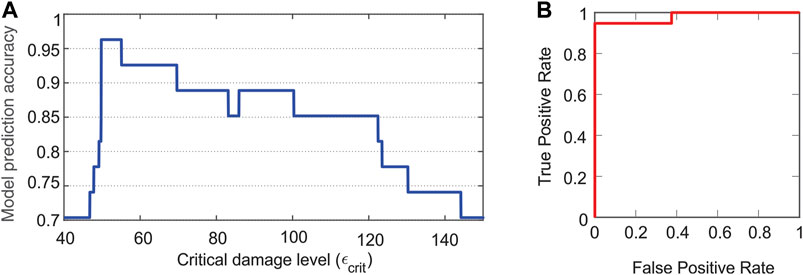
FIGURE 5. Demonstrated accuracy of model predictions of health or disease outcomes. (A) Model prediction accuracy. The number of correct model predictions divided by the total number of predictions (i.e., model prediction accuracy) is shown as a function of the critical damage level (εcrit). Relatively high levels of accuracy are attained for a large range of critical damage levels. (B) Area under the curve-receiver operator characteristics curve. An area under this curve close to one indicates the model is capable of classifying outcomes correctly. The area under the curve is 0.98.
As an additional assessment tool of the predictive capability of the model, an area under the curve-receiver operating characteristics (AUC-ROC) curve was constructed (Figure 5B). In this figure, a positive outcome or identification corresponds to death occurring within 24 h. As such, ‘true positive’ corresponds to a model prediction agreeing with an experimental observation of a rat that dies within 24 h, while ‘false positive’ corresponds to a model prediction of a rat dying within 24 h when the experiment indicated that the rat did not die within 24 h. The recall/sensitivity/true positive rate = (number of true positives)/(number of correct predictions) and the false positive rate = (number of false positives)/(number of correct predictions). These rates are calculated for 0 ≤ εcrit ≤ 200 ε-units to produce the AUC-ROC curve in Figure 5B. An area under this curve that is close to one indicates a model that can classify outcomes correctly. Here, the area under the curve was 0.98.
Since the experimental data in this study suggest significant differences between the OMT = 24-h and the OMT >24-h groups, simulations were conducted to determine whether the model could reveal additional differences that may exist between these two groups. In Figure 6, a simulation was run for each of the 27 different bacterial loads (Bsource) administered to the rats in the validation data set (Figure 1B) assuming that εcrit = 53 ε-units (corresponding to the maximum accuracy determined in Figure 5A). Simulations that correspond to a predicted OMT = 24 h are shown in blue and those corresponding to an OMT >24 h are shown in red. As observed in Figure 6, the OMT 24-h group was predicted to have significantly higher bacteria, inflammatory, and damage levels. While there was a notable divide between model-predicted septic and aseptic cases in terms of bacterial levels (high vs near zero levels) after approximately 36 h, there was no particularly notable divide between the predicted OMT = 24-h (blue) and the septic members of the OMT >24-h (red) groups.
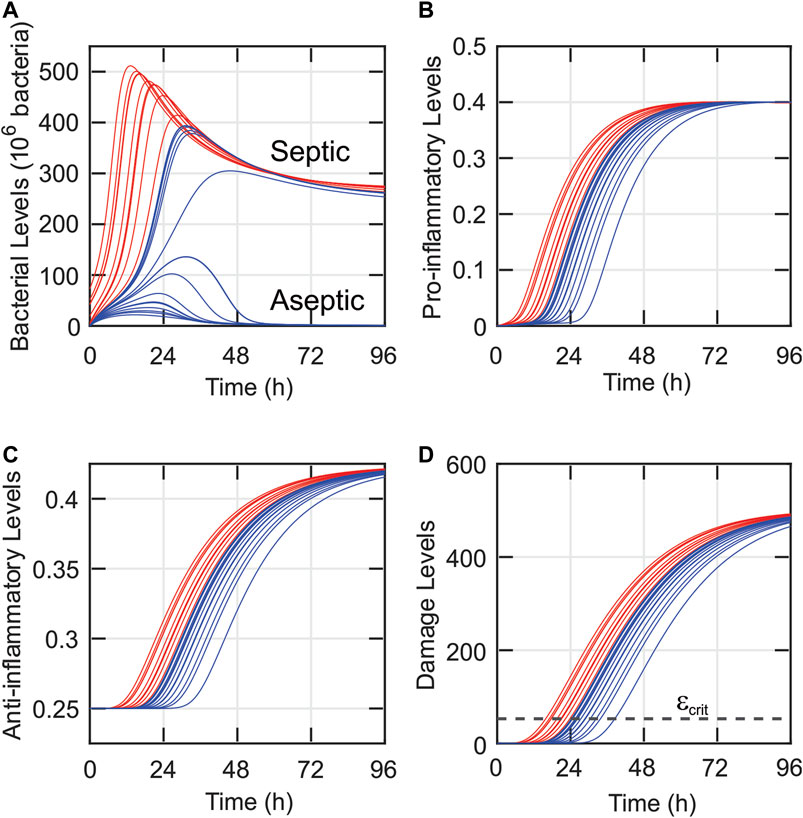
FIGURE 6. Similarities in time dynamics predicted despite varying bacterial loads and mortality data for 27 rats. The model-predicted dynamics of the bacteria (A), pro-inflammatory (B), anti-inflammatory (C), and damage (D) levels are shown for each of the rats from the validation data set. Blue curves correspond to rats that had a predicted observed mortality time of 24 h, and red curves correspond to rats that were predicted to survive for more than 24 h. The clustering of many of the trajectories suggests that small uncertainties in the initial state of the system could lead to significantly different systemic predictions.
The model was also used to give possible explanations for the lack of statistical difference among the three OMT >24-h groups. As shown in Figure 1B and Supplementary Table S2, some rats with similar levels of initial bacterial loads exhibited significantly different outcomes. For instance, Rats 11 and 20 received similar initial bacterial loads, but Rat 11 died within 48 h while Rat 20 lived until 96 h. The model was used to investigate these large discrepancies by varying model parameters and evaluating their impact on system outcomes. For instance, these investigations showed that small changes in pathogen growth rate (k1) had a substantial effect on the predicted outcomes of the system. Figure 7 shows the model-predicted impact of decreasing this parameter slightly, given similar initial bacterial loads of 163 × 106 bacteria in Rat 11 (red) and 172 × 106 bacteria in Rat 20 (cyan). Specifically, k1 = 1.27/h for Rat 11, and k1 = 1.2/h for Rat 20. With these parameter values, the model predicted that Rat 11 died (i.e., its damage levels crossed the critical damage threshold of εcrit = 53 ε-units) at approximately 34 h (corresponding to OMT = 48 h). Rat 20, however, was predicted to be healthy at 96 h (OMT = 96 h) with a low steady state value of bacteria and zero steady state value of damage (since pro-inflammatory levels never rise high enough to cause damage to the surrounding tissue). Similar changes in model predicted outcomes were observed when other parameters, such as those governing the immune response, were varied (Outcome Dependence on Parameter Values and Figure 8).
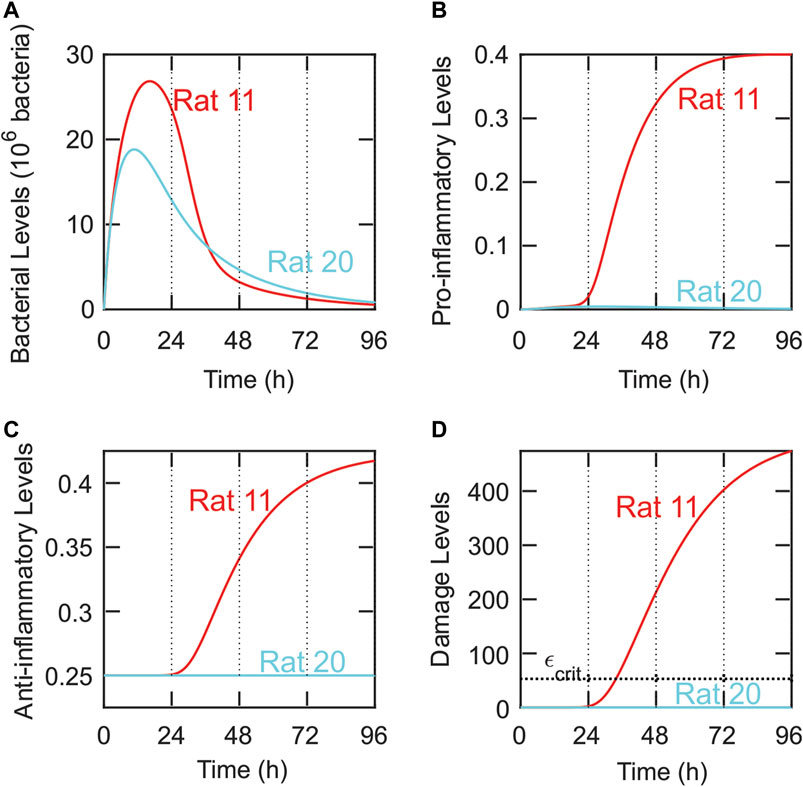
FIGURE 7. Small variations in system parameters produce significantly different outcomes consistent with experimental measurements. Comparison of the predicted dynamics for the bacteria (A), pro-inflammatory (B), anti-inflammatory (C), and damage (D) dynamics for Rat 11 (red) and Rat 20 (cyan) using different parameter values. Parameters for Rat 11: Bsource = 163 × 106 bacteria, k1 = 1.27/h. Parameters for Rat 20: Bsource = 172 × 106 bacteria, k1 = 1.2/h. Despite similar parameter values, the model predicts significantly different OMTs for Rat 11 (OMT = 48 h) and Rat 20 (OMT = 96 h). These OMTs are the same as those observed in the validation data set (Figure 1B). A horizontal dashed line is included in panel D and corresponds to the critical damage level, εcrit = 53 ε-units.
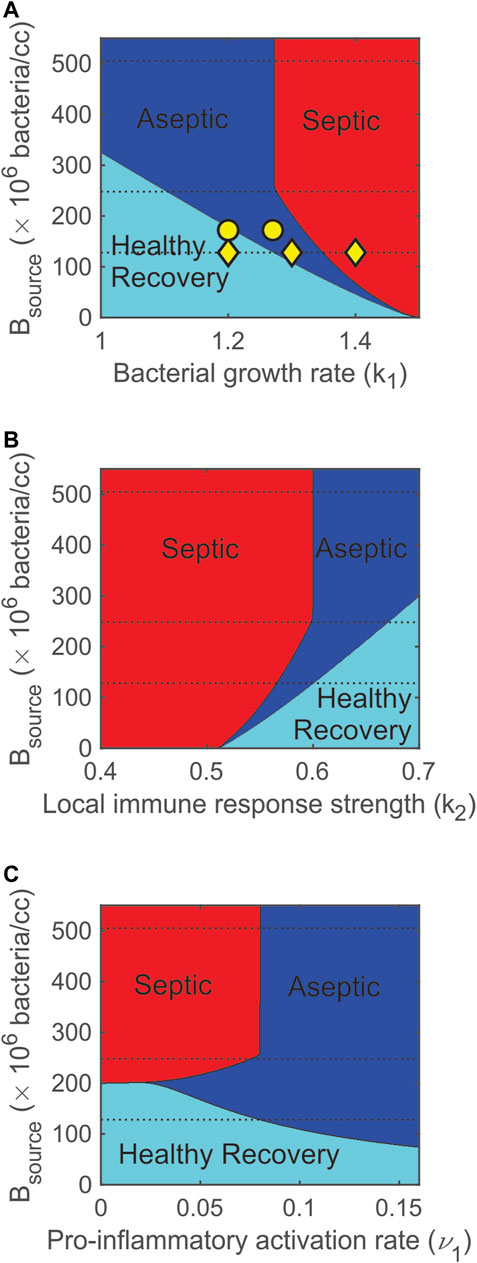
FIGURE 8. Varying bacterial and immune response parameters significantly impacts model predicted outcomes. (A) Increasing the pathogen growth rate (k1) turns healthy (cyan) outcomes into aseptic (blue) and then septic (red) outcomes. (B) Increasing the strength of the local immune response (k2) turns septic outcomes into aseptic then healthy outcomes. (C) Increasing the pro-inflammatory activation rate contributes to more aseptic outcomes and lowers the probability of a healthy outcome. Dashed lines correspond to initial bacterial levels that were used in the experiments. The three yellow ◊‘s in panel A indicate the three values of k1 (1.2, 1.3, 1.4/h) that were simulated in Figure 4. The two yellow ○‘s in panel A indicate the two values of k1 (1.27 and 1.2/h) that were simulated in Figure 7 for Rats 11 and 20.
Outcome Dependence on Parameter Values
Figure 8 summarizes the dependence of stable outcomes (health is cyan, asepsis is blue, and sepsis is red) on the number of bacteria in the fibrin clot (Bsource), pathogen growth rate (k1), strength of the local immune response (k2), and pro-inflammatory activation rate (ν1). As k1 was increased or as k2 was decreased, the number of bacteria that the system could handle and still recover decreased (Figures 8A,B). The dashed lines in the figures indicate the three levels of Bsource that were administered to the rats in the calibration data set. These multiple parameter bifurcation plots suggest that a healthy recovery outcome was not possible for many (high) levels of Bsource. For lower levels of Bsource, the model predicted that regions of healthy recovery become aseptic and then septic as the pathogen growth rate was increased (Figure 8A) or the strength of the local immune response was decreased (Figure 8B). As Bsource was decreased, the width of the aseptic region decreased and completely disappeared when Bsource = 6 × 10⁶ bacteria. This suggests that, regardless of the value of k1 or k2, an aseptic outcome is not possible for a small enough initial bacterial load.
Parameter ν1 is the maximum activation rate of the pro-inflammatory response. As shown in Figure 8C, there was a very narrow region (199 × 106 bacteria < Bsource < 201 × 106 bacteria) in which the model predicted that increasing ν1 causes a change in stable outcome from septic death to healthy recovery and then to aseptic death. This suggests that increasing the recruitment of pro-inflammatory cells and mediators first helps then overwhelms the system. For higher levels of Bsource (Bsource > 258 × 106 bacteria), a moderate activation rate (ν1 = 0.08 M-units/h) divides the septic region (ν1 < 0.08 M-units/h) from the aseptic region (ν1 > 0.08 M-units/h), suggesting that a highly responsive pro-inflammatory activation rate leads to aseptic outcomes.
The nearly equal split between septic and aseptic cases shown in Figure 8C for Bsource > 258 × 106 can be explained by the interactions between the bacteria and inflammatory response. The interaction term involving BM in the bacteria equation (Eq. 1) was initially very small since not enough M had been recruited. Thus, early dynamics for the bacteria equation were governed primarily by the remaining non-interaction terms (which are almost entirely unrelated to ν1). If B values increased above a (relatively low) threshold, the non-interaction terms became large (and positive) enough to outweigh any of the mounting contributions from the interaction term. This means that resulting high values of B depended on initial dynamics when M values were low and ν1 had only a minor impact. In addition, if Bsource > 258 × 106 bacteria, bacterial levels approached a high steady state level, regardless of the size of the interaction term. So, if ν1 < 0.08 M-units/h (right boundary of septic region in Figure 8C), the pro-inflammatory levels never grew large enough to outweigh the non-interaction terms in Eq. 1. If ν1 > 0.08 M-units/h, however, then the pro-inflammatory levels caused the interaction term in Eq. 1 eventually to outweigh the non-interaction terms, and the bacteria were eliminated. This elimination took place after the system attained high bacterial levels and was independent of Bsource so long as Bsource > 258 × 106 bacteria.
Discussion
In this study, a mathematical model of the immune response to a bacterial infection was developed from previous inflammation models (Reynolds et al., 2006; Arciero et al., 2010; Barber et al., 2013) and applied to an experimental study in which variable doses of E. coli were administered to rats. The model was calibrated to bacterial levels in the rats at multiple time points following implantation of the E. coli fibrin clot. The model successfully predicted outcomes of observed mortality times in 27 rats given several different initial bacterial loads. The differences in model-predicted levels of bacteria, pro-inflammatory response, anti-inflammatory response, and damage for rats with OMT = 24 h and rats with OMT >24 h, however, were not as large as expected. Thus, the model accurately predicts observed outcomes when initial conditions are well-known, but predicting final outcomes based on data at early time points is challenging when large uncertainty surrounds the appropriate initial conditions to use for model or statistics-based predictions. The model also showed that variability in experimental outcomes can result from variability in the pathogen growth rate, strength of the local immune response, or maximum activation rate of the pro-inflammatory response, since small changes in these parameter values generated large changes in system outcomes.
An important goal for mathematical models of disease is to yield accurate patient-specific outcomes. Ideally, given early time course data on bacterial levels and cytokine levels in a patient, a model could be used to predict whether that patient will follow a healthy recovery (resolving), septic, or aseptic outcome. Then, depending on the forecasted outcome, appropriate countermeasures could be prescribed, allowing for an efficient and accurate use of resources. In many studies, pure statistics are used to predict the likely status or outcome of a given patient. Applying pure statistics to the validation data set in this study (e.g., using a predictor that predicts death within 24 h if the initial bacterial load exceeds a certain amount) would produce similar successful predictions but would not be able to predict septic vs aseptic outcomes, explain failed predictions, or reveal the underlying system dynamics. While more complex statistics using more data per patient can help to improve the accuracy of statistical methods, ultimately such methods still do not identify the mechanisms leading to observed outcomes as mechanistic mathematical models do. An optimal theoretical approach for understanding disease should include a combination of mathematical modeling and statistical methods (Albers et al., 2018; Baker et al., 2018). The study presented here provides an example of such a combined mathematical and statistical approach.
Mathematical and Statistical Predictions
Statistical analyses applied to the validation data set suggested no significant difference between the bacterial levels in rats with observed mortality times of 48, 72, and 96 h. Therefore, this study considered only two groups from the data set: rats that died before 24 h (OMT = 24 h) and rats that died after 24 h (OMT >24 h).
No clear separation among bacteria, inflammatory, or damage levels was predicted by the model for the OMT = 24-h and OMT >24-h groups. Interestingly, the model predicted very similar trajectories for the pro- and anti-inflammatory response. For example, there was a tight grouping of the pro- and anti-inflammatory response in the OMT = 24-h group. As a result, statistical models for this system would have difficulty predicting whether a septic or aseptic outcome should be expected, especially due to the uncertainty associated with detecting when the infection begins to take hold. These model predictions imply that pro-inflammatory, anti-inflammatory, or bacterial levels at early time points (e.g., 8 h) cannot be used to predict outcomes from a statistical perspective, thereby motivating the need for a combined statistical and mechanistic modeling approach.
Modeling helps to determine the relative importance (and validity) of proposed mechanisms and potential targets for successful interventions. For instance, the sensitivity analysis in this study showed that the local immune response is important. Obtaining patient specific parameters for the local immune response using well-designed measurements could improve parameter estimation, mitigate uncertainty in initial conditions, and enable more accurate patient-specific model-generated predictions regarding potential septic outcomes, corresponding dynamics, and proposed treatments. Such measurement planning and usage rely on well-chosen statistical techniques and could include both patient-specific measurements and/or general population measurements. In the case of the latter, maps of parameter spaces for general populations could be generated and then a few well-chosen measurements could be used to estimate the location of a specific patient in that space and their patient-specific corresponding parameter values. In addition, future models could make similar improvements in predictions by including mechanisms that involve specific (rather than general) cytokines (Chow et al., 2005) or those involving spatial organization of the system (Barber et al., 2013).
The validation data set showed that similar bacterial loads led (in some cases) to significantly different mortality times in rats. Just as previous models have demonstrated the impact of stochasticity on model outcomes (Cockrell and An, 2017; Mavroudis et al., 2019), the current model demonstrated that experimental or clinical variability in sepsis outcomes can be explained by very small differences in parameters governing bacteria or the host response. Additionally, the different outcomes in two rats with nearly identical bacterial loads could result from small differences in initial conditions due to underlying stressors at the beginning of the experiment. As a result, in order to enable patient-specific care, different parameter sets and/or initial conditions must be used for different individuals to capture variability among patients.
Comparison to Prior Mathematical Modeling Studies of Sepsis
Several sepsis modeling studies have been described previously. Kumar et al. (2004) used a model similar to the model developed in the current study to predict that sepsis may have multiple negative outcomes (e.g., septic and aseptic death) that may require different treatment approaches. However, their study did not explicitly incorporate any experimental data. Yamanaka et al. (2019) created a model founded on clinical data focused solely on septic shock, an important subset of sepsis. McDaniel et al. (2019) introduced a “whole-body” sepsis model (via the BioGears Physiology Engine) to be used as an in silico septic simulator. While these and several other sepsis models (An, 2001; An, 2004; Chow et al., 2005; Day et al., 2006; Prince et al., 2006; Vodovotz et al., 2006; Zuev et al., 2006; Song et al., 2012; Shi et al., 2015; Cockrell and An, 2017) have offered many useful insights, the present study emphasized the acute inflammatory dynamics that take place during early sepsis development using a relatively simple and novel modeling framework that can be used to identify the mechanisms that underly vastly different outcomes despite nearly identical initial conditions. Notably, our results using experimental sepsis induced in genetically identical rats support those of Cockrell and An (2017), who used an agent-based model of human sepsis to suggest that mortality could occur under diverse conditions and influences which in turn would defy stratification based on inflammation biomarkers.
Limitations
As is necessary in theoretical modeling, the model presented in this study applies simplifying assumptions to make predictions about the average health status in a system. For example, several immune system mediators are grouped together into two general populations for the pro- and anti-inflammatory responses. Also, the model considered only virulent bacteria; non-virulent (e.g., probiotic) bacteria (Arciero et al., 2010) were not included. Although additional model components could improve predictions, the simplicity of this model allows for very useful analysis of the impact of parameters and interactions on the health of a rat. The simplicity of the model, however, does limit the ability to capture more complicated underlying dynamics. For instance, a single variable, ϵcrit, is used to predict outcomes based on system damage when outcomes likely depend on additional factors. Similarly, differences between species are subsumed into a single parameter (Bs) when converting bacteria-associated quantities from the human system developed by Reynolds et al. (2006) to the rat system considered in this study.
The model was calibrated using both quantitative data (bacterial levels at multiple time points) and qualitative observations (coexistence of healthy recovery/septic/aseptic steady states for some parameter values). The data used in this study did not include measurements of cytokine levels, and thus using data sets with both bacterial and cytokine levels could help to improve model calibration and design. In addition, the validation data only included time points of 24, 48, 72, and 96 h. There is probably a more continuous change in mortality outcomes, and thus a more accurate threshold for death could be obtained given additional time point data. Finally, the model has been calibrated to peritoneal injections that cause sepsis in rats. More experimental data would allow for more general insights.
Concluding Remarks
With complicated processes such as inflammation where hundreds of molecules, cells, and other factors play roles, mathematical models are essential for providing a mechanistic understanding of the system, as in the current sepsis study. This is especially true when very small differences in initial conditions or parameter values in complex systems can have a major impact on outcome, as illustrated in this study. Thus, model reduction is needed to facilitate analysis and interpretation. The parsimonious model of sepsis presented here, after calibration, reproduced experimental results, identified an inherent level of uncertainty associated with experimental data and associated predictions, predicted trends as bacterial load, pathogen growth rate, strength of the local immune response, and activation rate of the pro-inflammatory response were varied, and provided a simplifying paradigm that can be used to understand the life vs death outcomes for septic individuals. As recent studies in blunt trauma (Abboud et al., 2016a), traumatic brain injury (Abboud et al., 2016b), and pediatric acute liver failure (Zamora et al., 2016; Zamora et al., 2019) have shown, a dichotomy in patient outcomes was observed as soon as measurements were taken, suggesting that inflammation, regardless if it results from trauma, disease, or sepsis, exhibits the same features illustrated in this work. Using mathematical modeling provides an understanding of possible mechanisms that could explain such dichotomies in outcomes, in contrast to methods solely based on statistical assessments of clusters or outcomes.
Data Availability Statement
The original contributions presented in the study are included in the article/Supplementary Material, further inquiries can be directed to the corresponding author https://github.com/jarobarb/code_for_sepsis.git.
Ethics Statement
The animal study was reviewed and approved by the University of Pittsburgh Institutional Animal Use and Care Committee.
Author Contributions
JA and YV both equally contributed as senior authors, with JA supervising the modeling components and YV supervising the experiments. RN performed experiments and collected and compiled the experimental data set. JA, JB, TB, AC, and AT developed the model equations and analyzed model behavior. JB finalized all model calibrations to experimental data and statistically analyzed model fits and subsequent predictions. JB, JA, YV, and RN wrote the article. All authors contributed to the article and approved the submitted version.
Funding
YV, National Institutes of Health (NIH; www.nih.gov), NIH Grant U01EB021960. The funders had no role in study design, data collection and analysis, decision to publish, or preparation of the article. JA, NIH Grant 1R01EY030851. The funders had no role in study design, data collection and analysis, decision to publish, or preparation of the article. JA-National Science Foundation (NSF; www.nsf.gov) NSF DMS-1654019. The funders had no role in study design, data collection and analysis, decision to publish, or preparation of the article. JA and JB, NSF DMS-1852146. The grant provided financial support for the REU projects performed by AC and AT that eventually led to this publication. JB, NSF DMS-1951531. The funders had no role in study design, data collection and analysis, decision to publish, or preparation of the article.
Conflict of Interest
YV is a co-founder of, and stakeholder in, Immunetrics, Inc.
The remaining authors declare that the research was conducted in the absence of any commercial or financial relationships that could be construed as a potential conflict of interest.
Publisher’s Note
All claims expressed in this article are solely those of the authors and do not necessarily represent those of their affiliated organizations, or those of the publisher, the editors and the reviewers. Any product that may be evaluated in this article, or claim that may be made by its manufacturer, is not guaranteed or endorsed by the publisher.
Supplementary Material
The Supplementary Material for this article can be found online at: https://www.frontiersin.org/articles/10.3389/fsysb.2021.755913/full#supplementary-material
References
Abboud, A., Mi, Q., Puccio, A., Okonkwo, D., Buliga, M., Constantine, G., et al. (2016). Inflammation Following Traumatic Brain Injury in Humans: Insights from Data-Driven and Mechanistic Models into Survival and Death. Front. Pharmacol. 7 (342), 342. doi:10.3389/fphar.2016.00342
Abboud, A., Namas, R. A., Ramadan, M., Mi, Q., Almahmoud, K., Abdul-Malak, O., et al. (2016). Computational Analysis Supports an Early, Type 17 Cell-Associated Divergence of Blunt Trauma Survival and Mortality*. Crit. Care Med. 44, e1074–e1081. doi:10.1097/ccm.0000000000001951
Ahrenholz, D. H., and Simmons, R. L. (1980). Fibrin in Peritonitis. I. Beneficial and Adverse Effects of Fibrin in Experimental E. coli Peritonitis. Surgery 88 (1), 41–47.
Albers, D. J., Levine, M. E., Stuart, A., Mamykina, L., Gluckman, B., and Hripcsak, G. (2018). Mechanistic Machine Learning: How Data Assimilation Leverages Physiologic Knowledge Using Bayesian Inference to Forecast the Future, Infer the Present, and Phenotype. J. Am. Med. Inform. Assoc. 25 (10), 1392–1401. doi:10.1093/jamia/ocy106
Alt, W., and Lauffenburger, D. A. (1987). Transient Behavior of a Chemotaxis System Modelling Certain Types of Tissue Inflammation. J. Math. Biol. 24 (6), 691–722. doi:10.1007/bf00275511
An, G. (2001). Agent-based Computer Simulation and Sirs: Building a Bridge between Basic Science and Clinical Trials. Shock 16 (4), 266–273. doi:10.1097/00024382-200116040-00006
An, G. (2004). In Silico experiments of Existing and Hypothetical Cytokine-Directed Clinical Trials Using Agent-Based Modeling*. Crit. Care Med. 32 (10), 2050–2060. doi:10.1097/01.ccm.0000139707.13729.7d
Arciero, J., Barber, J., and Kim, M. (2013). Modeling Host–Pathogen Interactions in Necrotizing Enterocolitis. Complex Systems and Computational Biology Approaches to Acute Inflammation. Springer, 231–264. doi:10.1007/978-1-4614-8008-2_13
Arciero, J., Bard Ermentrout, G., Siggers, R., Afrazi, A., Hackam, D., Vodovotz, Y., et al. (2013). Modeling the Interactions of Bacteria and Toll-like Receptor-Mediated Inflammation in Necrotizing Enterocolitis. J. Theor. Biol. 321, 83–99. doi:10.1016/j.jtbi.2012.12.002
Arciero, J. C., Ermentrout, G. B., Upperman, J. S., Vodovotz, Y., and Rubin, J. E. (2010). Using a Mathematical Model to Analyze the Role of Probiotics and Inflammation in Necrotizing Enterocolitis. PLoS One 5 (4), e10066. doi:10.1371/journal.pone.0010066
Arens, C., Bajwa, S. A., Koch, C., Siegler, B. H., Schneck, E., Hecker, A., et al. (2016). Sepsis-induced Long-Term Immune Paralysis-Rresults of a Descriptive, Explorative Study. Crit. Care 20 (1), 93–11. doi:10.1186/s13054-016-1233-5
Bacon, G. E., Kenny, F. M., Murdaugh, H. V., and Richards, C. (1973). Prolonged Serum Half-Life of Cortisol in Renal Failure. Johns Hopkins Med. J. 132 (2), 127–131.
Baker, R. E., Peña, J. M., Jayamohan, J., and Jérusalem, A. (2018). Mechanistic Models versus Machine Learning, a Fight worth Fighting for the Biological Community? Biol. Lett. 14 (5). doi:10.1098/rsbl.2017.0660
Barber, J., Tronzo, M., Harold Horvat, C., Clermont, G., Upperman, J., Vodovotz, Y., et al. (2013). A Three-Dimensional Mathematical and Computational Model of Necrotizing Enterocolitis. J. Theor. Biol. 322, 17–32. doi:10.1016/j.jtbi.2012.11.018
Bocci, V. (1991). Interleukins. Clin. Pharmacokinet. 21 (4), 274–284. doi:10.2165/00003088-199121040-00004
Brady, R. (2017). Mathematical Modeling of the Acute Inflammatory Response & Cardiovascular Dynamics in Young Men.
Brun, R., Reichert, P., and Künsch, H. R. (2001). Practical Identifiability Analysis of Large Environmental Simulation Models. Water Resour. Res. 37 (4), 1015–1030. doi:10.1029/2000wr900350
Buchman, T. G., Billiar, T. R., Elster, E., Kirk, A. D., Rimawi, R. H., Vodovotz, Y., et al. (2016). Precision Medicine for Critical Illness and Injury. Crit. Care Med. 44 (9), 1635–1638. doi:10.1097/ccm.0000000000002028
Caudill, L., and Lynch, F. (2018). A Mathematical Model of the Inflammatory Response to Pathogen Challenge. Bull. Math. Biol. 80 (8), 2242–2271. doi:10.1007/s11538-018-0459-6
Cavaillon, J.-M., and Annane, D. (2006). Compartmentalization of the Inflammatory Response in Sepsis and SIRS. J. Endotoxin Res. 12 (3), 151–170. doi:10.1179/096805106x102246
Chen, X. H., Yin, Y. J., and Zhang, J. X. (2011). Sepsis and Immune Response. World J. Emerg. Med. 2 (2), 88–92. doi:10.5847/wjem.j.1920-8642.2011.02.002
Chow, C. C., Clermont, G., Kumar, R., Lagoa, C., Tawadrous, Z., Gallo, D., et al. (2005). The Acute Inflammatory Response in Diverse Shock States. Shock 24 (1), 74–84. doi:10.1097/01.shk.0000168526.97716.f3
Clermont, G., Bartels, J., Kumar, R., Constantine, G., Vodovotz, Y., and Chow, C. (2004). In Silico design of Clinical Trials: a Method Coming of Age. Crit. Care Med. 32, 2061–2070. doi:10.1097/01.ccm.0000142394.28791.c3
Cobelli, C., and Distefano, J. J. (1980). Parameter and Structural Identifiability Concepts and Ambiguities: a Critical Review and Analysis. Am. J. Physiology-Regulatory, Integr. Comp. Physiol. 239 (1), R7–R24. doi:10.1152/ajpregu.1980.239.1.r7
Cockrell, C., and An, G. (2017). Sepsis Reconsidered: Identifying Novel Metrics for Behavioral Landscape Characterization with a High-Performance Computing Implementation of an Agent-Based Model. J. Theor. Biol. 430, 157–168. doi:10.1016/j.jtbi.2017.07.016
Daun, S., Rubin, J., Vodovotz, Y., Roy, A., Parker, R., and Clermont, G. (2008). An Ensemble of Models of the Acute Inflammatory Response to Bacterial Lipopolysaccharide in Rats: Results from Parameter Space Reduction. J. Theor. Biol. 253, 843–853. doi:10.1016/j.jtbi.2008.04.033
Day, J. D., Cockrell, C., Namas, R., Zamora, R., An, G., and Vodovotz, Y. (2018). Inflammation and Disease: Modelling and Modulation of the Inflammatory Response to Alleviate Critical Illness. Curr. Opin. Syst. Biol. 12, 22–29. doi:10.1016/j.coisb.2018.08.008
Day, J., Rubin, J., Vodovotz, Y., Chow, C. C., Reynolds, A., and Clermont, G. (2006). A Reduced Mathematical Model of the Acute Inflammatory Response II. Capturing Scenarios of Repeated Endotoxin Administration. J. Theor. Biol. 242 (1), 237–256. doi:10.1016/j.jtbi.2006.02.015
Delano, M. J., and Ward, P. A. (2016). The Immune System's Role in Sepsis Progression, Resolution, and Long-Term Outcome. Immunol. Rev. 274 (1), 330–353. doi:10.1111/imr.12499
Foteinou, P. T., Calvano, S. E., Lowry, S. F., and Androulakis, I. P. (2009). Modeling Endotoxin-Induced Systemic Inflammation Using an Indirect Response Approach. Math. Biosciences 217 (1), 27–42. doi:10.1016/j.mbs.2008.09.003
Fuchs, A. C., Granowitz, E. V., Shapiro, L., Vannier, E., Lonnemann, G., Angel, J. B., et al. (1996). Clinical, Hematologic, and Immunologic Effects of Interleukin-10 in Humans. J. Clin. Immunol. 16 (5), 291–303. doi:10.1007/bf01541395
Ganusov, V. V. (2016). Strong Inference in Mathematical Modeling: A Method for Robust Science in the Twenty-First Century. Front. Microbiol. 7, 1131. doi:10.3389/fmicb.2016.01131
Grondman, I., Pirvu, A., Riza, A., Ioana, M., and Netea, M. G. (2020). Biomarkers of Inflammation and the Etiology of Sepsis. Biochem. Soc. Trans. 48 (1), 1–14. doi:10.1042/bst20190029
Horiguchi, H., Loftus, T. J., Hawkins, R. B., Raymond, S. L., Stortz, J. A., Hollen, M. K., et al. (2018). Innate Immunity in the Persistent Inflammation, Immunosuppression, and Catabolism Syndrome and its Implications for Therapy. Front. Immunol. 9, 595. doi:10.3389/fimmu.2018.00595
Huhn, R. D., Radwanski, E., Gallo, J., Affrime, M. B., Sabo, R., Gonyo, G., et al. (1997). Pharmacodynamics of Subcutaneous Recombinant Human Interleukin-10 in Healthy Volunteers*. Clin. Pharmacol. Ther. 62 (2), 171–180. doi:10.1016/s0009-9236(97)90065-5
Isler, P., de Rochemonteix, B. G., Songeon, F., Boehringer, N., and Nicod, L. P. (1999). Interleukin-12 Production by Human Alveolar Macrophages Is Controlled by the Autocrine Production of Interleukin-10. Am. J. Respir. Cel Mol Biol 20 (2), 270–278. doi:10.1165/ajrcmb.20.2.3313
Jarrett, A. M., Cogan, N. G., and Shirtliff, M. E. (2015). Modelling the Interaction between the Host Immune Response, Bacterial Dynamics and Inflammatory Damage in Comparison with Immunomodulation and Vaccination Experiments. Math. Med. Biol. 32 (3), 285–306. doi:10.1093/imammb/dqu008
Karlsson, J., Anguelova, M., and Jirstrand, M. (2012). An Efficient Method for Structural Identifiability Analysis of Large Dynamic Systems*. IFAC Proc. volumes 45 (16), 941–946. doi:10.3182/20120711-3-be-2027.00381
Kumar, R., Chow, C. C., Bartels, J. D., Clermont, G., and Vodovotz, Y. (2008). A Mathematical Simulation of the Inflammatory Response to Anthrax Infection. Shock (Augusta, Ga) 29, 104–111. doi:10.1097/shk.0b013e318067dcfe
Kumar, R., Clermont, G., Vodovotz, Y., and Chow, C. C. (2004). The Dynamics of Acute Inflammation. J. Theor. Biol. 230 (2), 145–155. doi:10.1016/j.jtbi.2004.04.044
Kumar, V. (2020). Pulmonary Innate Immune Response Determines the Outcome of Inflammation during Pneumonia and Sepsis-Associated Acute Lung Injury. Front. Immunol. 11, 1722. doi:10.3389/fimmu.2020.01722
Lelubre, C., and Vincent, J.-L. (2018). Mechanisms and Treatment of Organ Failure in Sepsis. Nat. Rev. Nephrol. 14 (7), 417–427. doi:10.1038/s41581-018-0005-7
Lotze, M. T., and Tracey, K. J. (2005). High-mobility Group Box 1 Protein (HMGB1): Nuclear Weapon in the Immune Arsenal. Nat. Rev. Immunol. 5 (4), 331–342. doi:10.1038/nri1594
Mai, M., Wang, K., Huber, G., Kirby, M., Shattuck, M. D., and O’Hern, C. S. (2015). Outcome Prediction in Mathematical Models of Immune Response to Infection. Plos One 10 (8), e0135861. doi:10.1371/journal.pone.0135861
Mavroudis, P. D., Scheff, J. D., Doyle, J. C., Vodovotz, Y., and Androulakis, I. P. (2019). The Impact of Stochasticity and its Control on a Model of the Inflammatory Response. Computation 7 (1), 3. doi:10.3390/computation7010003
McDaniel, M., Keller, J. M., White, S., and Baird, A. (2019). A Whole-Body Mathematical Model of Sepsis Progression and Treatment Designed in the BioGears Physiology Engine. Front. Physiol. 10, 1321. doi:10.3389/fphys.2019.01321
Meshkat, N., Eisenberg, M., and DiStefano, J. J. (2009). An Algorithm for Finding Globally Identifiable Parameter Combinations of Nonlinear ODE Models Using Gröbner Bases. Math. Biosciences 222 (2), 61–72. doi:10.1016/j.mbs.2009.08.010
Minucci, S. B., Heise, R. L., and Reynolds, A. M. (2020). Review of Mathematical Modeling of the Inflammatory Response in Lung Infections and Injuries. Front. Appl. Maths. Stat. 6 (36). doi:10.3389/fams.2020.00036
Morikawa, M., Derynck, R., and Miyazono, K. (2016). TGF-β and the TGF-β Family: Context-dependent Roles in Cell and Tissue Physiology. Cold Spring Harb Perspect. Biol. 8 (5), a021873. doi:10.1101/cshperspect.a021873
Namas, R. A., Namas, R., Lagoa, C., Barclay, D., Mi, Q., Zamora, R., et al. (2012). Hemoadsorption Reprograms Inflammation in Experimental Gram-Negative Septic Peritonitis: Insights from In Vivo and In Silico Studies. Mol. Med. 18, 1366–1374. doi:10.2119/molmed.2012.00106
Nedeva, C. (2021). Inflammation and Cell Death of the Innate and Adaptive Immune System during Sepsis. Biomolecules 11 (7), 1011. doi:10.3390/biom11071011
Öner, M., and Deveci Kocakoç, İ. (2017). Jmasm 49: A Compilation of Some Popular Goodness of Fit Tests for normal Distribution: Their Algorithms and Matlab Codes (Matlab). J. Mod. Appl. Stat. Methods 16 (2), 30. doi:10.22237/jmasm/1509496200
Otto, G. P., Sossdorf, M., Claus, R. A., Rödel, J., Menge, K., Reinhart, K., et al. (2011). The Late Phase of Sepsis Is Characterized by an Increased Microbiological burden and Death Rate. Crit. Care 15 (4), R183–R188. doi:10.1186/cc10332
Pilyugin, S., and Antia, R. (2000). Modeling Immune Responses with Handling Time. Bull. Math. Biol. 62 (5), 869–890. doi:10.1006/bulm.2000.0181
Prince, J. M., Levy, R. M., Bartels, J., Baratt, A., Kane, J. M., Lagoa, C., et al. (2006). In Silico and In Vivo Approach to Elucidate the Inflammatory Complexity of CD14-Deficient Mice. Mol. Med. 12 (4-6), 88–96. doi:10.2119/2006-00012.Prince
Qiu, P., Liu, Y., and Zhang, J. (2019). Review: the Role and Mechanisms of Macrophage Autophagy in Sepsis. Inflammation 42 (1), 6–19. doi:10.1007/s10753-018-0890-8
Remick, D. G. (2007). Pathophysiology of Sepsis. Am. J. Pathol. 170 (5), 1435–1444. doi:10.2353/ajpath.2007.060872
Reynolds, A., Rubin, J., Clermont, G., Day, J., Vodovotz, Y., and Bard Ermentrout, G. (2006). A Reduced Mathematical Model of the Acute Inflammatory Response: I. Derivation of Model and Analysis of Anti-inflammation. J. Theor. Biol. 242 (1), 220–236. doi:10.1016/j.jtbi.2006.02.016
Schirm, S., Ahnert, P., Wienhold, S., Mueller-Redetzky, H., Nouailles-Kursar, G., Loeffler, M., et al. (2016). A Biomathematical Model of Pneumococcal Lung Infection and Antibiotic Treatment in Mice. Plos One 11 (5), e0156047. doi:10.1371/journal.pone.0156047
Schorr, C. A., and Dellinger, R. P. (2014). The Surviving Sepsis Campaign: Past, Present and Future. Trends Mol. Med. 20 (4), 192–194. doi:10.1016/j.molmed.2014.02.001
Shi, Z., Wu, C. H., Ben-Arieh, D., and Simpson, S. Q. (2015). Mathematical Model of Innate and Adaptive Immunity of Sepsis: A Modeling and Simulation Study of Infectious Disease. Biomed. Res. Int. 2015, 504259. doi:10.1155/2015/504259
Singer, M., Deutschman, C. S., Seymour, C. W., Shankar-Hari, M., Annane, D., Bauer, M., et al. (2016). The Third International Consensus Definitions for Sepsis and Septic Shock (Sepsis-3). JAMA 315 (8), 801–810. doi:10.1001/jama.2016.0287
Smith, A. M., McCullers, J. A., and Adler, F. R. (2011). Mathematical Model of a Three-Stage Innate Immune Response to a Pneumococcal Lung Infection. J. Theor. Biol. 276 (1), 106–116. doi:10.1016/j.jtbi.2011.01.052
Song, S. O. K., Hogg, J., Peng, Z.-Y., Parker, R., Kellum, J. A., Clermont, G., et al. (2012). Ensemble Models of Neutrophil Trafficking in Severe Sepsis. Plos Comput. Biol. 8 (3), e1002422. doi:10.1371/journal.pcbi.1002422
Villaverde, A. F., Barreiro, A., and Papachristodoulou, A. (2016). Structural Identifiability of Dynamic Systems Biology Models. Plos Comput. Biol. 12 (10), e1005153. doi:10.1371/journal.pcbi.1005153
Vodovotz, Y., Csete, M., Bartels, J., Chang, S., and An, G. (2008). Translational Systems Biology of Inflammation. Plos Comput. Biol. 4, e1000014–6. doi:10.1371/journal.pcbi.1000014
Vodovotz, Y., Chow, C. C., Bartels, J., Lagoa, C., Prince, J. M., Levy, R. M., et al. (2006). In Silico models of Acute Inflammation in Animals. Shock 26 (3), 235–244. doi:10.1097/01.shk.0000225413.13866.fo
Vodovotz, Y., Constantine, G., Rubin, J., Csete, M., Voit, E. O., and An, G. (2009). Mechanistic Simulations of Inflammation: Current State and Future Prospects. Math. Biosciences 217 (1), 1–10. doi:10.1016/j.mbs.2008.07.013
Wang, H., Yang, H., and Tracey, K. J. (2004). Extracellular Role of HMGB1 in Inflammation and Sepsis. J. Intern. Med. 255 (3), 320–331. doi:10.1111/j.1365-2796.2003.01302.x
Yamanaka, Y., Uchida, K., Akashi, M., Watanabe, Y., Yaguchi, A., Shimamoto, S., et al. (2019). Mathematical Modeling of Septic Shock Based on Clinical Data. Theor. Biol. Med. Model. 16 (1), 5. doi:10.1186/s12976-019-0101-9
Yende, S., D'Angelo, G., Kellum, J. A., Weissfeld, L., Fine, J., Welch, R. D., et al. (2008). Inflammatory Markers at Hospital Discharge Predict Subsequent Mortality after Pneumonia and Sepsis. Am. J. Respir. Crit. Care Med. 177 (11), 1242–1247. doi:10.1164/rccm.200712-1777oc
Zamora, R., Barclay, D., Yin, J., Alonso, E. M., Leonis, M. A., Mi, Q., et al. (2019). HMGB1 Is a central Driver of Dynamic Pro-inflammatory Networks in Pediatric Acute Liver Failure Induced by Acetaminophen. Sci. Rep. 9 (1), 5971. doi:10.1038/s41598-019-42564-5
Zamora, R., Vodovotz, Y., Mi, Q., Barclay, D., Yin, J., Horslen, S., et al. (2016). Data-Driven Modeling for Precision Medicine in Pediatric Acute Liver Failure. Mol. Med. 22, 821–829. doi:10.2119/molmed.2016.00183
Keywords: mathematical modeling, acute inflammation, immune response, sepsis, E. coli
Citation: Barber J, Carpenter A, Torsey A, Borgard T, Namas RA, Vodovotz Y and Arciero J (2021) Predicting Experimental Sepsis Survival with a Mathematical Model of Acute Inflammation. Front. Syst. Biol. 1:755913. doi: 10.3389/fsysb.2021.755913
Received: 09 August 2021; Accepted: 14 October 2021;
Published: 05 November 2021.
Edited by:
Andreas Dräger, University of Tübingen, GermanyReviewed by:
Mohamed Helal, University of Sidi-Bel-Abbès, AlgeriaAustin Baird, Applied Research Associates, United States
Copyright © 2021 Barber, Carpenter, Torsey, Borgard, Namas, Vodovotz and Arciero. This is an open-access article distributed under the terms of the Creative Commons Attribution License (CC BY). The use, distribution or reproduction in other forums is permitted, provided the original author(s) and the copyright owner(s) are credited and that the original publication in this journal is cited, in accordance with accepted academic practice. No use, distribution or reproduction is permitted which does not comply with these terms.
*Correspondence: Jared Barber, amFyb2JhcmJAaXVwdWkuZWR1
†These authors have contributed equally to this work and share senior authorship