 Chixiang Chen1†
 Libo Jiang2
 Biyi Shen1
 Ming Wang1Christopher H. Griffin3
 Vernon M. Chinchilli1
 Rongling Wu1*
- 1Department of Public Health Sciences, Penn State College of Medicine, Hershey, PA, United States
- 2Center for Computational Biology, College of Biological Sciences and Technology, Beijing Forestry University, Beijing, China
- 3Applied Research Laboratory, The Pennsylvania State University, University Park, PA, United States
The pattern of how gene co-regulation varies across tissues determines human health. However, inferring tissue-specific regulatory networks and associating them with human phenotypes represent a substantial challenge because multi-tissue projects, including the GTEx, typically contain expression data measured only at one time point from highly heterogeneous donors. Here, we implement an interdisciplinary framework for assembling and programming genomic data from multiple tissues into fully informative gene networks, encapsulated by a complete set of bi-directional, signed, and weighted interactions, from static expression data. This framework can monitor how gene networks change simultaneously across tissues and individuals, infer gene-driven inter-tissue wiring networks, compare and test topological alterations of gene/tissue networks between health states, and predict how regulatory networks evolve across spatiotemporal gradients. Our framework provides a tool to catalogue a comprehensive encyclopedia of mechanistic gene networks that walk medical researchers through tissues in each individual and through individuals for each tissue, facilitating the translation of multi-tissue data into clinical practices.
Introduction
Fundamental questions in modern biomedicine include how human diseases result from alterations of gene expression and how these alterations are instructed by the human genome. Mounting evidence suggests that gene expression is differentially regulated across tissues or cell types during the developmental stage of diseases (Melé et al., 2015; Sonawane et al., 2017; Gamazon et al., 2018). A number of genetic alterations show a remarkable degree of tissue specificity; for example, they may promote cancer in one tissue but not another (Haigis et al., 2019). To reveal the cellular mechanisms that underlie complex human diseases and traits, many multi-tissue projects, such as the GTEx (TheEx Consortium, 2015; TheEx Consortium, 2017), have been launched to monitor transcriptional profiles across an array of tissues of the human body. These projects have established resource databases and associated tissue biobanks to study how genes behave in all major human tissues across individuals. With the increasing identification of individual significant genes, it has become clear that the way human cells perform common or unique functions across tissues is also determined by gene co-expression networks (Saha et al., 2017; Girousse et al., 2018).
Networks are central to the functioning of complex biological systems (Omony, 2013; Siegenthaler and Gunawan, 2014). Various approaches have been developed and applied to reconstruct gene regulatory networks, a combinatorial collection of multiple molecular regulators that interact with each other to mediate transcriptional processes (Castro et al., 2019). However, the most widely used approaches can only identify partially informative networks; for example, correlation-based approaches can estimate the strength of gene interactions but fails to identify causality (Bornholdt, 2008), whereas Bayesian networks and their time generalization–dynamic Bayesian networks–can recover causality, but cannot quantitatively describe the behavior of networks (Zou and Conzen, 2005; Werhli and Husmeier, 2007). When networks are modelled as dynamical systems, ordinary differential equations (ODEs) can overcome these issues to infer fully informative networks, i.e., those that code bidirectional, signed, and weighted interactions (Wu et al., 2014; Chen et al., 2017). Yet, the application of ODEs, though powerful, is hindered by the fact that transcriptional profiles are stable in postmortem samples collected by the GTEx project (Melé et al., 2015) so that temporal expression data are neither available nor informative.
The traditional thinking of network modeling using static data is to infer an aggregate network from a large number of expression samples. More recently, Kuijjer et al. (2019) proposed a reverse approach for engineering sample-specific networks by perturbing the aggregate network. Wang et al. (2018) developed a so-called Network Reprogramming using EXpression (NetREX) method to construct context-specific gene regulatory networks (GRNs) from a context-agnostic prior network. However, none of these approaches take advantage of dynamical modeling to make a fully informative inference of network architecture. Also, it is unclear whether and how these approaches can reconstruct high- or even ultrahigh-dimensional gene networks. Analogous to the concept of environmental index coined to evaluate site productivity in terms of crop yield (Lobell et al., 2014), we define the total expression amount of all genes in a tissue as the expression index of the tissue reflecting its carrying capacity to support all genes. By serializing discrete tissues into a continuous gradient, we use the expression index to link two distinct fields, allometric scaling theory (Shingleton, 2010) and evolutionary game theory (Smith and Price, 1973; Hofbauer and Sigmund, 1998), which allows a system of quasi-dynamic ODEs to be derived to specify gene interactions across tissues and individuals (Chen et al., 2019; Wu and Jiang, 2021). We incorporate variable selection into the convex optimization setting of ODE modeling, ensuring that the reconstructed networks meet stability, sparsity, causality, and high-dimensionality properties. Under such interdisciplinary integration, we can assemble and contextualize steady-state expression data into their dynamic domain, making it possible to recover fully informative gene networks from static data. In this article, we implement our interdisciplinary framework to reconstruct, track, and compare tissue-specific differences in GRN topology from the GTEx data. This framework can serve as a tool to chart a comprehensive encyclopedia for how GRN structure and function change from one tissue to next for each individual (tissue specificity), how GRN on a specific tissue varies among individuals (personalized networks), and how a given gene mediates tissue-tissue crosstalk (gene function) differently for healthy and diseased individuals. Results obtained from our framework provide scientific guidance on the translation of multi-tissue data into clinical practices.
Results
Quasi-Dynamic ODE Modeling
In the Methods section, we describe a procedure of how to derive our networking approach by integrating elements of ecology, evolution, and evolutionary biology. Our approach capitalizes on a system of quasi-dynamic ODEs and uniquely combines three features: full recovery of interactions, gene classification, and sample-specific networking. If two genes activates each other, their relationship is defined as synergism. If one gene activates the second to the same extent by which the latter activates the former, symmetric synergism occurs. If the degree of mutual activation is different, this is called asymmetric synergism. If one gene activates the second but the latter has no effect on the former, this relationship is called directional synergism. Similarly, when gene interactions are expressed as inhibitions, we may define symmetric antagonism, asymmetric antagonism, and directional antagonism, respectively. If one gene activates the second whereas the latter inhibits the former, this suggests that the former offers altruism toward the latter or the latter obtains egoism from the former. The relative size of altruism and egoism may vary for a certain pair of genes. As can be seen from the Methods section, our approach can encapsulate all possible patterns of gene-gene interactions into bidirectional, signed, and weighted networks and, therefore, capture the full information a network may possess.
A gene may actively regulate or also be passively regulated by other genes. Thus, the distinction between active (or outgoing) regulation and passive (or incoming) regulation can identify the specific role of a gene in mediating interactions. In a network, hub genes have a connectivity (i.e., the total number of outgoing and incoming links) larger than the average. If the number of outgoing links of a gene is larger than that of its incoming links, this gene tends to be more “social.” If a gene has more outgoing links than the average of all genes, we define this gene as a “leader.” In contrast, if a gene has more incoming links than the average, it is regarded as a “subordinate.” If a majority of genes each have fewer links, either active or passive, than the average, they are “solitary” or peripheral genes. Our approach can identify the “social” class of each gene and study its role in network behavior.
Gene networks may structurally and functionally vary across tissues and among individuals, alter from one health state to next, and change across spatiotemporal gradients. Our approach can recover and convert sample-specific networks into context-specific networks and test how networks change as a function of each of the above-described variables. To interpret tissue-specific networks reconstructed from a given individual, we design a small example illustrated in Figure 1. Genes 1 and 2 interact with symmetric antagonism in tissue 1 and asymmetric antagonism in tissue 2, but they establish symmetric synergism in tissue T. The directional synergism of gene 5 to gene 1 is strong in tissues 1 and T but weak in tissue 2. Tissue-specific differences in terms of the type and strength of other interactions can also be identified. Taken together, these detailed differences in network architecture can be explained as a driver of tissue specificity.
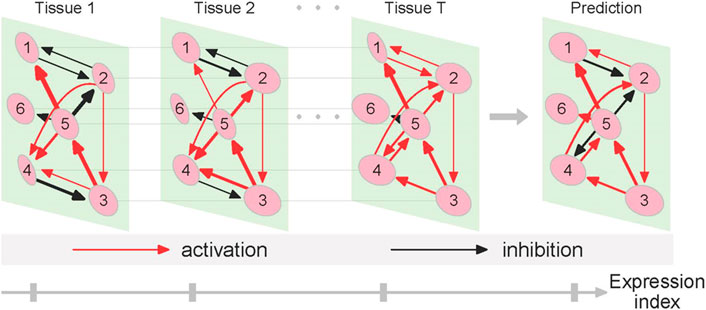
FIGURE 1. Diagram of tissue-specific networks reconstructed from the quasi-dynamic ODE model. We assume six genes (nodes) that link with each other through cooperation or competition to produce a bidirectional, signed, and weighted graph that codes various types of gene-gene interactions. The network of gene interactions structurally and functionally changes from tissue 1 to T and can be predicted along the expression index axis. The strength of gene interactions is proportional to the thickness of lines.
Gene Network Recovery
We apply our approach to identify gene regulatory networks for each tissue from each individual from the GTEx data. We use network theory to explain emergent properties of these networks and identify hub and peripheral genes that mediate network structure, organization, and function. Ultimately, this procedure helps compile and catalogue complete encyclopedias for tissue-specific gene networks and personalized tissue-tissue networks from the GTEx repository, which create a high-level resource that researchers can use to identify key co-regulation pathways responsible for tissue specificity and inter-individual variability in disease risks.
The power law: To demonstrate the utility of our approach, we use and interpret three examples: 1) tissue-specific networks across 38 tissues from individual 15ER7, 2) personalized networks on the liver among 283 individuals, and 3) inter-tissue wiring networks drive by two genes within the body of individual 15ER7. As a first step toward network modeling, we plotted the expression level of individual genes against expression index (the total expression amount of 9,239 genes) across all tissues for 15ER7 and against the expression index (the total expression amount of 7,793 genes) on the liver across all individuals, respectively. In 15ER7, four randomly chosen genes tend to increase their expression levels with expression index, however with different slopes (Figure 2A). For the liver, among the four randomly chosen genes, two decrease their expression with expression index, whereas the other two increase their expression with expression index (Figure 2B). In each case, we found that the power equation well fits the allometric relationship of individual genes’ expression level (the part) with expression index (the whole). From plots of residuals against the predicted values, no pattern is identified, suggesting that the power equation can adequately fit the expression data of individual genes.
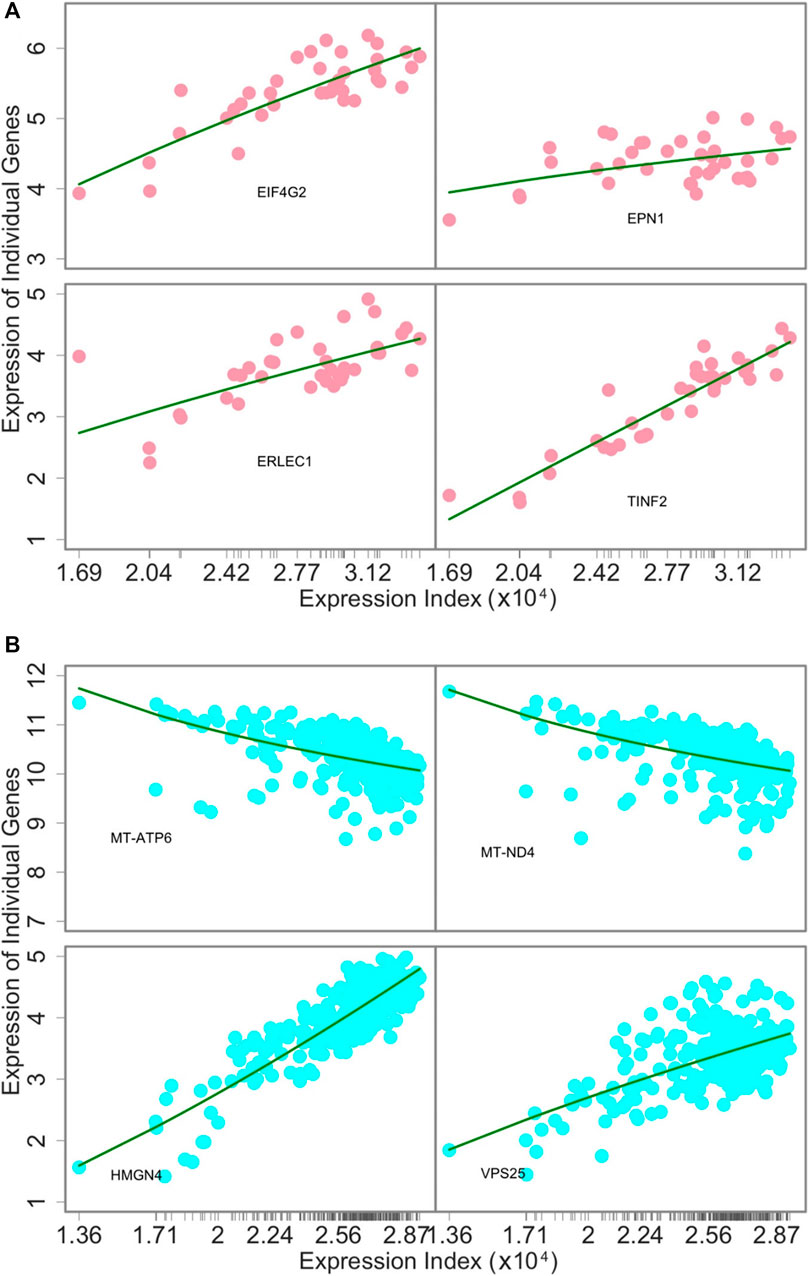
FIGURE 2. The goodness of fit of the power equation to the expression data of four randomly chosen genes across 38 tissues from individual 15ER7 (A) and 283 individuals for the same tissue–liver (B). Ticks on the x-axis represent the positions of each tissue or individual in terms of its expression index.
The number of genes is extremely large, making it impossible to reconstruct a network involving all genes in one step. Modularity theory suggests that a system increases its developmental stability through organizing its components into discrete modules (Espinosa-Soto, 2018), each of which contains components that are more strongly linked with each other than with those from different modules (Melo et al., 2016). Since the expression level of each gene scales with expression index across tissues or individuals in a way that can be fitted by the power law, we incorporated the power equation into the algorithm of functional clustering in a quest to group genes into distinct modules. Based on AIC, we found 60 optimal modules that can well explain tissue-dependent transcriptional variation and 229 optimal modules that can well explain subject-specific variation in liver gene expression. We can reconstruct multi-scale gene networks, one at the high level constituted by different modules and one at the lower level composed of genes within modules.
Tissue-specific networks: Our model allows tissue-specific differences in gene co-regulation to be compared and tested for any individual. As an example, we reconstruct a tissue-perturbed gene network that determines how a pancreas is different from a uterus for 15ER7. These two tissues are substantially different from each other in many functional ways and much of this difference may be explained by, or attributed to, gene co-expression. We first reconstruct the pancreas vs. uterus differential network among 60 modules (Figure 2A). We identify five hub modules 1, 5, 30, 23, and 59 that affect many other modules through outgoing regulation, but three hubs 33, 55, and 57 that affect other modules through incoming regulation. We find that 11 modules are not linked with any others, showing solitary nature. The remaining modules have a number of links that range between hubs and solitary modules. We plot the distribution of the total number of links against modules, which was observed to display a scale-free network structure (Figure 2A). We found that directional synergy and directional antagonism together account for all links and most modules either exert outgoing regulation or receive incoming regulation, with a few having both outgoing and incoming regulation. These differences may explain the mechanistic basis of the alterations of genomic function from pancreas to uterus.
Personalized networks: Considering a tissue of interest, explaining its interpersonal variability is a fundamental step towards understanding disease etiology. As an example, we reconstruct such an individual-specific (or personalized) gene network at the module level for the liver to explain why and how two randomly selected individuals (13X6J and YF7O) differ in the gene co-expression of this tissue (Figure 3B). The gene network among 229 modules is dominated by directional synergy and directional antagonism. Several hub modules play a pivotal role in mediating the overall structure of the network through outgoing regulation. The hub modules mostly exert outgoing directional synergism or outgoing directional antagonism to other genes. One module is found to display self-regulation. If one individual is healthy whereas the other has a diseased liver, we expect to see differences in the underlying gene-network structure of these individuals. This personalized network reconstructed can facilitate our understanding of the genomic mechanisms for human disorders.
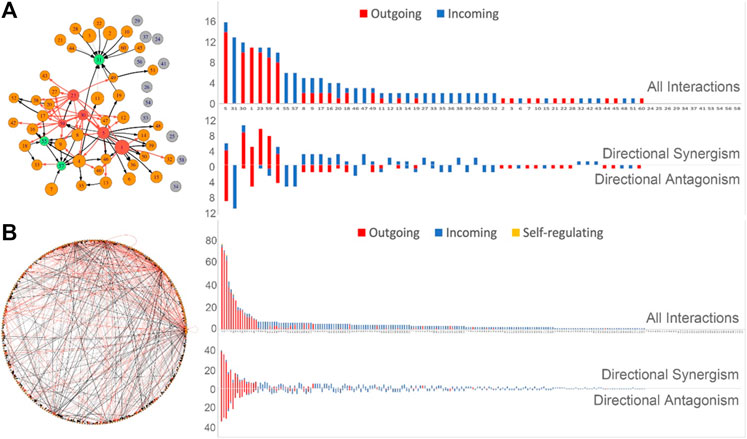
FIGURE 3. Sample-specific gene networks that illustrate structural and organizational changes of gene co-regulation from one sample to another. (A) Tissue-perturbed gene network from pancreas to uterus tissues for individual 15ER7. (B) Individual-perturbed gene network for liver from individuals 13X6J to YF7O. For both (A) and (B), left panel: 60- or 229 node network at the module level, whose edges present activation (arrowed red line) or inhibition (arrowed black line). Deep red circles are social hubs (pursuing outgoing regulation) and green circles are subordinate hubs (receiving incoming regulation). Right panel: The distributions of all interactions and different types of interactions over individual modules. For a given module, directional synergism or directional antagonism is represented by red bars if it exerts outgoing regulation and blue bars if it receives incoming regulation, respectively. In (B), modules 2, 54, and 156 are detected as being self-regulating. Gene names within each module are given in Supplementary Tables S1, S2.
Endogenous and exogenous expression components: To demonstrate the relative contribution of the endogenous and exogenous gene expression components to the overall expression level of a gene, we draw the expression index-varying expression curves of these two components (Figure 4). Among the tissues, the independent expression level of four representative modules increases with expression index (Figure 4A). However, even though the overall module-specific expression levels increase, slight fluctuations across tissues are observed due to the accumulative effect of tissue-specific activation and inhibition by other modules. The overall expression levels of modules 5 and 20 are higher than their independent expression level because the accumulative dependent expression level is positive, suggesting that these two modules are very much reliant upon other modules. An inverse pattern was observed for modules 55 and 50.
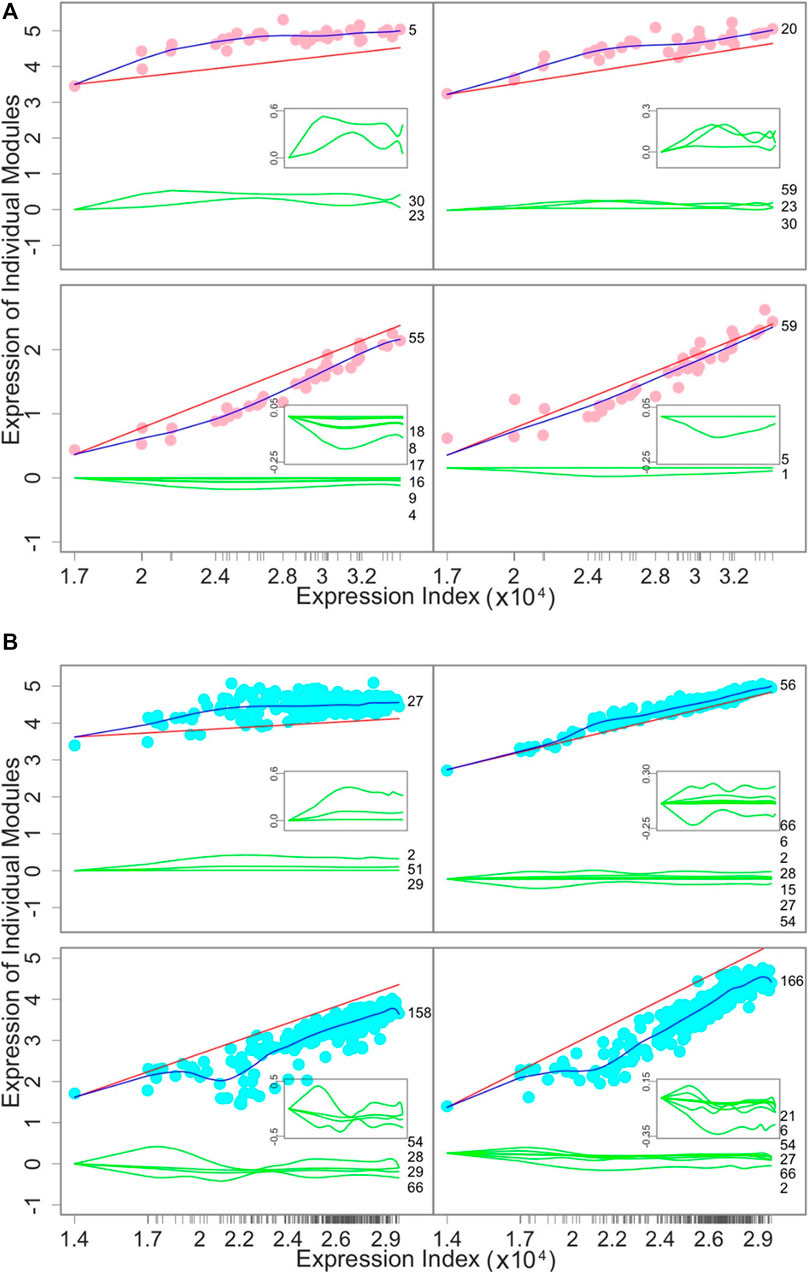
FIGURE 4. Decomposition of the overall expression curve (blue line) of a given module into its endogenous component (red line) and exogenous components due to the effects of other modules (green lines). (A) How the gene expression of four representative modules changes over 38 tissues from individual 15ER7. (B) How the gene expression of four representative modules changes over 283 individuals for liver. The numbers given at the end of green lines are those modules that regulate the focal module. Gene names within each module are given in Supplementary Tables S1, S2.
Similarly, we decompose the overall expression index-varying expression level of a gene into its endogenous and exogenous components across individuals (Figure 4B). The overall expression level of modules 27 and 56 is higher than their respective endogenous component because other modules collectively regulate the expression of these two modules across individuals in a positive manner. Module 27 receives the incoming positive regulation from three modules, whereas module 56 is regulated positively by six modules but negatively by one module. In contrast, modules 158 and 166 each have endogenous components that are higher than their overall expression levels, because other modules collectively have negative regulation, leading to negative exogenous components.
Tissue Networking via Genes
Our approach can compile and curate an encyclopedia for inter-tissue wiring networks, driven by each gene, for each individual. Here, we define the total expression amount of a gene over all tissues in an individual as the expression index of the gene. Using individual 15ER7 as an example, we plot the expression level of each gene on each tissue against the expression index of the gene (over 38 tissues) and found that this relationship can still be well fitted by the power equation (Supplementary Figures S2, S3). Thus, we can derive quasi-dynamic ODEs 5) to infer tissue-tissue networks. Figure 5 illustrates how two randomly chosen genes Z95115.1 and GGA1 drive communication networks among 38 different tissues (Figure 5). From these graphs, it can be seen that under the regulation of each gene which tissues reside at the core of the network and which reside at the periphery of the network. We found that all these tissues are linked with each other to form sparse networks mostly through directional synergism and directional antagonism. These two types of interactions together account for almost all links in inter-tissue networks, although a few tissues are linked through symmetric synergism, symmetric antagonism, and altruism. We identify a few tissue types, such as thyroid and gastroesophageal junction (esophagus) tissue, that are self-regulated. Both gene-driven tissue networks include the same set of core tissues (hubs) that have more links than the average, but the extent and even direction of links differ dramatically between the two networks. For example, liver tissue is inhibited by many other tissue, such as pituitary, substantia nigra (brain), gastroesophageal junction (esophagus), vagina, lung, muscularis (esophagus), subcutaneous (adipose), and adrenal gland in the Z95115.1-driven network (Figure 5A), but promoted by pituitary, substantia nigra (brain), vagina, lung, and subcutaneous (adipose) in the GGA1-driven network (Figure 5B). Under the regulation of Genes Z95115.1 and GGA1, several tissues, such as transverse (colon), cerebellar hemisphere (brain) and muscle, act on the periphery; that is, each is linked with only one tissue. As the most important hub tissue, the expression level of the anterior cingulate cortex (brain) is moderate, suggesting that the intrinsic capacity of a hub tissue to maintain gene expression is not proportional to its influence on the inter-tissue network.
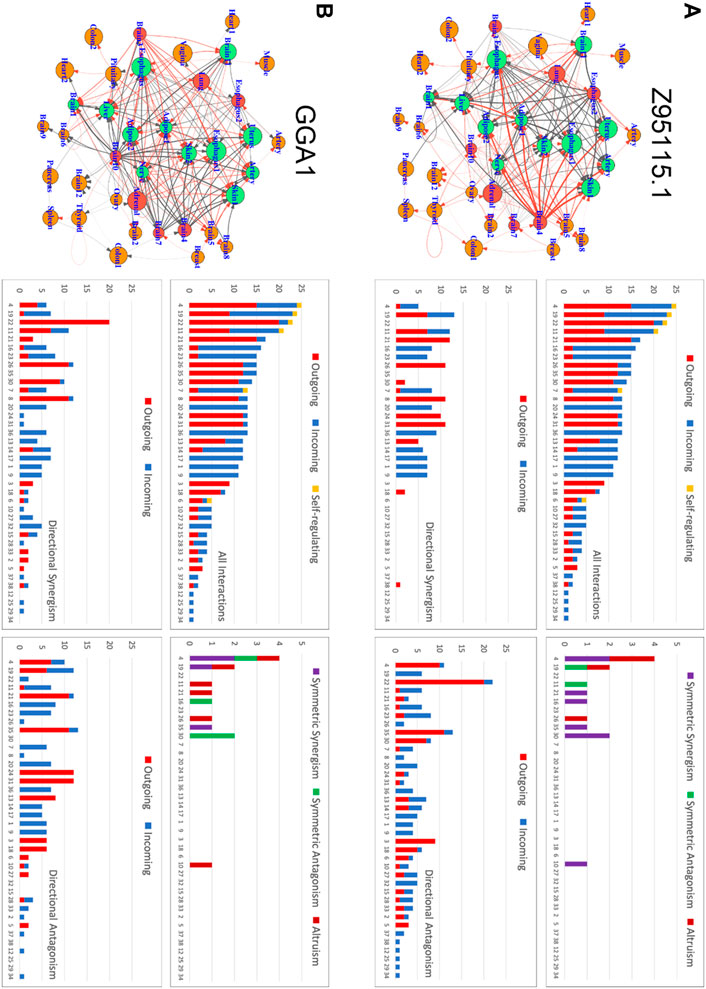
FIGURE 5. Inter-tissue wiring networks driven by genes Z95115.1 (A) and GGA1 (B). Left panel: Graph representation of tissue-tissue interactions in which nodes denote tissues and links stand for interactions. The size of a node is proportional to the expression level of the driving gene on the corresponding tissue. Arrowed red and black lines represent how one tissue activates or inhibits the other, respectively, with the thickness of lines proportional to the strength of activation or inhibition. Right panel: The distribution of all interactions and each type of interaction (including symmetric synergism and antagonism and directional synergism and antagonism) over individual tissues. Outgoing, incoming, and self-regulating interactions are distinguished.
We decompose the overall gene expression profile of each tissue into its endogenous component and exogenous component across genes (Chen et al., 2019; Wu and Jiang, 2021). For example, if uterus tissue functions in an isolated environment, its gene expression level will be higher than what is observed in the socialized environment. This is due to the fact that a total of 11 other tissues accumulatively produces a positive influence on the uterus, although many of these tissues negatively affect it. A similar phenomenon was observed for cerebellar hemisphere (brain) and subcutaneous (adipose) tissues. Yet, mucosa (esophagus) tissue displays no difference between its endogenous expression and observed expression because positive and negative influences by other tissues cancel each other.
Gene Annotations
We conducted a KEGG enrichment analysis to understand the biological function of genes within each module and how genes from one module interact with genes from other modules. We found that gene function varies considerably among modules; for example, module 1 is dominated by the ribosome gene, modules 3–5 contains a number of genes that are associated with Alzheimer’s disease, Oxidative phosphorylation, Huntington’s disease, and Parkinson’s disease, module 14 is mainly comprised of the spliceosome gene, module 36 contains genes for ribosome biogenesis and RNA transcription, genes within module 39 are related to a number of biological processes including viral myocarditis, prion diseases, and staphylococcus aureus infection among others, and module 46 includes the gene for RNA degradation. We further performed a KEGG pathway analysis to examine how the tissue-specific gene network that distinguishes a pancreas from a uterus can be interpreted by protein-protein interactions (Figure 6). From this pathway network, we can illustrate an overall picture of how genes interact with each other regionally (within modules) and globally (between modules). Modules 1, 8, and 5 contain many genes that link with genes from other modules; it is likely that they serve as hub modules due to their “social” roles. Interestingly, modules 1, 8, and 5 were all identified as hubs by our model. Furthermore, the links of module 1 (ribosome) with modules 14 (spliceosome) and 46 (RNA degradation) can be explained by the interactions between module 1’s RPL34 and module 14s UBE2D2 and module 46s C1D, respectively. The links of module 1 with modules 39 and 46 may be attributed to the interactions between module 1’s ACTB and module 39s TBP and module 1’s RPS27A and module 46s C1D, respectively. Despite the fact that some module-module links are not explained by KEGG pathways, all the above consistency indicates the biological relevance of our model. The strength of our model is its ability to estimate the size, sign, and direction of gene co-regulation, thereby gaining additional insight into the genomic mechanisms underlying complex biological processes. Similar consistent results are also detected for the liver-based personalized network (Figure 3B).
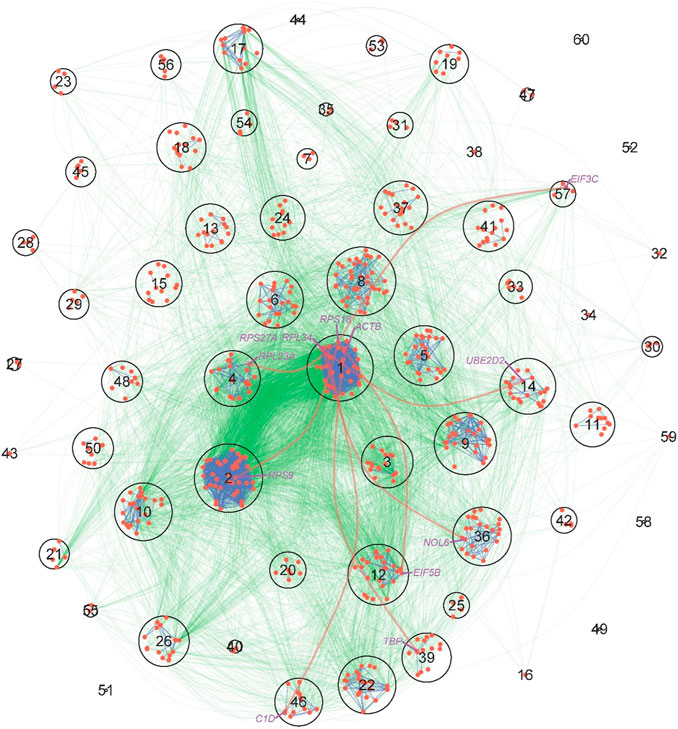
FIGURE 6. KEGG pathway maps of protein-protein interactions (PPI) derived from the tissue-specific gene network of pancreas-uterus differences. The network is described at the module level, where each circle denotes one of the 60 modules, with size proportional to the number of genes within the module. Red dots within circles are key genes that mediate how one protein interacts with other proteins. PPIs within and between modules are denoted by blue and green lines, respectively. The names of several representative genes are given, whose across-module links are indicated by thick red lines.
Discussion
As the most influential multi-tissue project, the GTEx database contains gene expression data on more than 12,000 samples across 53 tissues from nearly 1,000 human donors (https://gtexportal.org/home/). This invaluable database has been extensively analyzed by researchers worldwide, successfully identifying a variety of significant genes that distinguish among tissues and subjects (Fagny et al., 2017; Yang et al., 2017; Gamazon et al., 2018). A majority of these analyses are based on reductionist thinking to characterize individual actions of genes, but it has been increasingly clear that inter-tissue and inter-individual variabilities are also determined by complex interactions among different genes. In this article, we propose an alternative but more powerful approach for mining and interrogating the biological rules hidden in the GTEx data by inferring multiscale gene co-regulation networks across tissues and individuals.
The gene networks reconstructed by our approach are regarded as being mechanistic because of the following four features: 1) they are fully informative, encapsulated by bi-directional, signed, and weighted interactions whose strength is quantified, 2) they are omnigenic but sparse, capturing a systematic but focused view of how a complete set of genome-wide genes interact with each other, 3) they are biologically interpretable, establishing defined types of interactions on a mass, energetic or signal basis, and 4) they are sample-specific, allowing network structure to be compared, tested, and predicted across spatiotemporal gradients. More recently, Boyle et al. (2017) have proposed an omnigenic hypothesis, suggesting that essentially all genes on the entire genome may have played roles in mediating phenotypic variation. Through implementing variable selection and modularity theory, our approach can reconstruct high- or even ultrahigh-dimensional networks that are omnigenic and act across different scales, thus providing a platform to test whether and how the omnigenic model can better explain genetic variation. Glass et al. (2013) developed Passing Attribute between Networks for Data Assimilation (PANDA) for assembling multiple sources of information for network inference, and Sonawane et al. (2017) used PANDA to reconstruct tissue-specific networks with the GTEx data. Despite the power of this approach, the networks inferred by it do not combine all the above four features, thus failing to offer the mechanistic interpretation of gene co-regulation.
By converting steady-state expression data to a dynamical space, our approach makes it possible to recover fully informative, omnigenic, biologically meaningful, and sample-specific networks. The basic tenet of our approach is that individual genes are regulated by each other in sample-specific networks like different organisms interact and work together across ecological communities. Thus, the fundamental rules that govern community behavior also work to shape gene network structure and organization. Taking this as a starting point, we integrate elements of two disciplines, ecology and evolutionary game theory, into a gene networking framework in which a system of quasi-dynamic ODEs are derived and used to capture and quantify the internal workings of regulatory networks.
Our approach can significantly advance biologically and clinically meaningful discoveries from the GTEx data that most existing approaches fail to detect. First, it allows researchers to compile and catalogue an encyclopedia for gene networks for each tissue from any single individual and compare how these networks structurally differ among tissues. By such comparisons, one can identify which and how gene interactions generate a first general rule that distinguishes diseased tissues from normal tissues. Second, focusing on a certain tissue, such as the liver, lung or brain, our approach can curate an atlas for gene networks that act on the focal tissue for each individual and compare how these so-called personalized networks differ topologically among individuals. This allows researchers to identify the second general rule by which certain gene interactions cause the focal tissue to function differently between healthy and diseased individuals. Third, our approach can compile and classify a dictionary of tissue-tissue wiring networks derived by each key gene. Inter–tissue communications in the body are integral to the proper functioning of organisms (Strand et al., 2010). For example, the brain is believed to detect and process signals from the environment and then communicate these signals to distal tissues, such as the gut, to regulate human health (Zhang et al., 2018). How tissues communicate with each other is a poorly understood question. Our approach can not only recover tissue-tissue interactions from gene expression data, but also identify which and how genes drive the communications of one tissue with others.
Tissue- or individual-specific gene networks may be determined by a few hub genes. The expression levels of the hub genes may individuate stereotypical modes of response to external perturbations. Similarly, hub tissues may play a central role in mediating gene-specific tissue networks. In gene networks and tissue networks reconstructed from the GTEx data, such hub genes and hub tissues were found to exist and the role of the hub genes detected in linking other genes can be well interpreted by the annotated KEGG pathways. We found that the architecture of tissue-specific gene networks, personalized gene networks, and tissue networks is predominated by directional synergism and directional antagonism, together accounting for all or almost all links in these networks. This observation is consistent with widely identified cyclic synergism/antagonism (e.g., cyclic dominance) in nature, guided by the rock–paper–scissors game (Sinervo and Lively, 1996). Based on network theory, the emergent properties of each of these individualized networks can be characterized by topological parameters, such as connectivity, closeness, betweenness, eccentricity, eigenvector and PageRank (Newman, 2003). Thus, by linking these properties with the health status of humans, one can identify key topological determinants of health risk and design personalized therapies for tissue-specific diseases.
We are in the midst of a renaissance that enables the holistic, systems-oriented dissection of complex biological phenomena because no biological entity occurs and functions in isolation. Over the past several decades, reductionist thinking as a dominant approach has provided a steady stream of information on the resolution of individual components, such as genes, proteins, or metabolites, which drive complex traits or diseases. However, with the increase in the mining of publicly available genetic and genomic data arising from recent technological advances in genotyping and sequencing, it is becoming clear that trait or disease formation results not only from the influence of individual components but also, more likely, from the interactions of these components that coalesce into an intricate and tightly coordinated network (Costanzo et al., 2019). As such, our approach will potentially find its widespread use in revealing the mechanistic machinery of complex phenotypes from any data type. In particular, genome-wide association studies enable the identification of the genetic architecture of tissue- or individual-specific networks. The establishment of the link between gene networking and SNP variants, available for the GTEx project, will open a window to the prediction of regulatory network structure for personalized medicine.
Methods
In what follows, we show why it is necessary to integrate elements of ecology, evolution, and evolutionary game theory for extracting multi-tissue gene expression networks from the GTEx data. This interdisciplinary integration allows us to define a new concept, expression index, making it possible to derive a system of quasi-dynamic ODEs. These equations form the basis for our networking approach. By implementing developmental modularity theory and variable selection, our approach is equipped with a capacity to infer omnigenic but sparse networks at any dimension involving all genes. Network theory can be used to define and assess the emergent properties of the gene networks reconstructed from our approach.
Expression Index and Allometric Scaling Theory
The GTEx project was launched in 2008, providing a resource to characterize genetic variation in gene expression profiles across diverse tissues of the human body and relate it to the cellular mechanisms that underlie complex human diseases and traits (TheEx Consortium (2015, 2015; TheEx Consortium (2017, 2017). More recently, this database has been expanded to include genotype, gene expression, histological and clinical data on more than 12,000 samples across 53 tissues from nearly 1,000 human donors (https://gtexportal.org/home/). Our approach can recover tissue- and individual-specific gene networks and gene-specific inter-tissue networks from the GTEx database.
Suppose there are m genes measured in tissue ti (ti = 1, … , Ti) from individual i (i = 1, … , n). The relative change of expression of any two genes across tissues reflects their interactive relationship. Consider a situation in which genes X and Y are both expressed in tissue 1 but only gene Y is expressed in tissue 2. If the expression level of Y is lower in tissue 1 than in tissue 2, then gene X is considered to inhibit gene Y. Thus, by modeling how the expression level of each gene changes relative to that of other genes across tissues, we can illustrate gene-gene interactions. Let
We use the expression index to serialize discrete tissues or individuals, across which the allometric scale of
where Eq. 1 describe how the expression of gene j (part) scales allometrically with the expression index (whole) across tissues from individual i and across individuals for tissue t (common to all or part of the individuals), respectively; β.’s are the scaling exponents and α.’s are the constants that represent the expression index-varying characteristic of gene j. The power equation has been regarded as a universal rule to explain biological phenomena, such as how total leaf biomass scales allometrically with whole-plant biomass across spatiotemporal gradients (Mcconnaughay and Coleman, 1999; Xu et al., 2014) as well as how brain size in animals scales with animal mass across individuals or over development (Gayon, 2000).
Evolutionary Game Theory and Its Lotka-Volterra Generalization
No biological entity can exist or function without interacting with others. Remarkably, such interdependence and interactions obey certain rules that can be reasonably explained by evolutionary game theory (Smith and Price, 1973). Game theory originated in economic research (von Neumann and Morgenstern, 1944) and describes how a player rationally obtains his/her maximum payoff based on his/her own and other players’ strategic decisions. Evolutionary game theory extends this concept to understanding how interactions among players change dynamically in a game-like context driven by evolutionary mechanisms (Nowak, 2006). The generalized Lokta-Volterra formulation of evolutionary game theory, via replicator equations, can help to map and quantify specific strategies for each player, i.e., competition or cooperation, armed with a power of capturing spontaneous oscillatory behavior of complex biological systems, without needing to assume decision rationality (Cowden and Cummings, 2012). Evolutionary game theory has been widely used to study and model interdependencies among different biological entities at various levels of organization, including biomolecules, cells, tissues/organs, organisms, and populations (Fu et al., 2018; Jiang et al., 2018; Massey and Mishra, 2018; Swierniak et al., 2018).
Consider a system of m co-regulatory genes. A mechanistic understanding of this system’s behavior and function can benefit from the reconstruction of an interaction network that encapsulates how each gene cooperates or competes with other genes. We integrate evolutionary game theory and the Lokta-Volterra (LV) predator-prey model (Hofbauer and Sigmund, 1998) to derive a system of expression index-derivative ordinary differential equations (ODEs) describing an m-dimensional gene expression space, expressed as
which we call a system of quasi-dynamic ODEs because its derivative is not a function of time, the usual situation. According to Eq. 2, the overall change of the expression level of any gene j in each tissue from a given individual or in each individual for a given tissue is decomposed into its independent component
Inferring Fully Informative Gene Networks From Static Data
Let
where
The precise classification of gene interactions: In biology,
Optimizing the Topological Structure of GRNs
Let
where fi(⋅) is the Ti-dimensional m-variate normal distribution for m genes across Ti tissues with the mean vector
where
Expression index-varying expression levels of each gene are modelled by the quasi-dynamic ODEs (2) that contain the most significant incoming links. As stated above, Qj(⋅), a function of
The estimates of all model parameters
Intuitively, this maximum likelihood optimization implies an optimal topological structure and organization in which genes interact with each other to maximize the chance of the network to function as a whole.
Tissue- and individual-specific network recovery: As a function of
We develop an approach for testing how a network can explain the overall differences between any two tissues. Let ti1 and ti2 denote tissues 1 and 2 from individual i, respectively. The integral of the dependent gene expression component of system of quasi-dynamic ODEs (2) from ti1 to ti2 is calculated as
which quantifies how the exogenous effect of gene j, exerted by gene j′, governs the difference between the two tissues. By calculating
Analogously, we use the procedures described above to recover gene regulatory networks across individuals. These individual-specific networks are called personalized networks, characteristic of individual subjects. Personalized networks can be used to compare whether and how gene co-expression networks are associated with a healthy state or disease state in humans. As a quantitative tool, personalized networks can be used to predict gene co-expression by interpolating or extrapolating expression indices into a system of quasi-dynamic ODEs (2). The predictability of personalized networks can be improved when factors, external to the gene networks, such as demographic information, life style, and environmental factors, are incorporated into the model (2).
Social classifications of genes. Each equation of the quasi-dynamic ODEs (2) includes how many genes a given gene is passively regulated through incoming links, and by counting all equations, one can see how many genes a given gene actively regulates through outgoing links. Thus, a whole system of quasi-dynamic ODEs (2) can inform us of the numbers of outgoing links and incoming links for each gene. According to network theory, this information allows us to classify all genes into hub (core) genes and peripheral genes, leader genes and subordinate genes, or social genes and solitary genes (Allot et al., 2017). We argue that core genes may not necessarily display a strong intrinsic capacity of expression by which to affect network behavior and function. These genes may play important roles through regulating the expression of other genes in a direct way (outgoing) or an indirect way (incoming). Core genes may serve as leaders via outgoing regulation or subordinates if they receive incoming regulation. A distinction between leaders and subordinates may help to better understand the impact of individual genes on the overall structure of networks. Solitary genes generally reside at the periphery of a network, but their endogenous expression level may not necessarily be small. In some cases, the weak link of a solitary gene may collectively wield a sizable impact on the network, raising the possibility of a “butterfly” effect (from chaos theory) of gene interactions, a phenomenon of large unforeseen consequences caused by a sensitive dependence on a small initial change. For these reasons, marginal analysis of single genes would not reveal an overall picture of gene regulatory interactions because their impact may be mediated by non-linear network dynamics.
Sparse Network Recovery
Eq. 2 gives a general form of the quasi-dynamic ODEs that characterizes all possible combinations among a complete set of genes from multi-tissue studies. However, the increasing complexity of the network due to an increasing number of genes may quickly prevent efficient and effective computation of the ODEs. We resolve this issue by implementing variable selection-based statistical reasoning to choose the most significant incoming links for each gene. This implementation has a biological and social foundation. In modeling primate and human social networks, Dunbar’s law (Dunbar, 1992) asserts that there is a limit to the number of relationships within a network an individual can stably maintain given the animal’s neocortex size. This law has been observed to involve a genetic component; for example, Fowler et al. (2009) identified specific genes that control the popularity of a given individual with respect to other individuals. Genetic influence on social networks has been confirmed by many other studies (Allot et al., 2017; Mcdonald and Hobson, 2018). The existence of the genetic basis of Dunbar’s law should allow us to find its implications for biologically relevant networks in general. As such, we will only need to reconstruct a sparse gene network based on some key pathways that forms the network.
Variable selection: As stated above, it is unlikely that each gene interacts with every other gene across tissues. According to a multiple regression model across tissues (3), the observed expression level of gene j is regressed on its endogenous component and exogenous component affected by other genes j′ (j′ = 1, … , j-1, j+1, … , m). LASSO or its variants (Tibshirani, 1996; Yuan and Lin, 2006; Wang and Leng, 2008) can be implemented to reduce the dimension of incoming links owned by gene j, i.e., the dependence of this gene on other genes. In the end, we detect the most significant incoming links (say dj
Network community identification and multiscale network reconstruction: Modularity theory states that biological entities are specified for different functions and, therefore, are organized into distinct modules within which entities are more strongly functionally correlated with each other than with those from other modules (Chen et al., 2019). The identification of distinct modules is an important topic for understanding the intrinsic mechanisms of biological processes (Cantini et al., 2015; Wu and Jiang, 2021). Indeed, this issue is analogous to network community identification (Saelens et al., 2018). A network is regarded as having community modularity if the nodes of the network are partitioned into subsets of nodes such that each partition element is densely connected internally (Fuhrman, 2009).
We implement functional clustering, proposed by Kim et al. (2008), to identify and test community structure for interaction networks. Functional clustering classifies all genes into distinct modules based on the pattern of expression index-varying gene expression. The optimal number of modules can be determined by information criteria, such as the Akaike Information Criterion (AIC) or the Bayesian Information Criterion (BIC). Based on the posterior probabilities of each gene estimated by functional clustering, we can assign genes into their most likely modules. We can reconstruct gene networks among modules at a higher level and among genes within modules at a lower level. Thus, a large gene network is decomposed into multiple functionally different but interconnected network communities based on the theory of biological modularity. If the number of genes within a module is still large, a further analysis using functional clustering can be conducted to identify more fine-grained network communities. In the end, we reconstruct hierarchical gene networks that encapsulate various types of gene interactions for all genes for the GTEx database. These networks can serve as a platform to test how gene co-regulation omnidirectionally drive human complex disease or traits.
Gene-Driven Tissue Networks
No tissue functions in isolation, rather its function critically relies on how other tissues function within the same body. Such interdependence and interrelationships among tissues suggest that reconstruction of a network in which tissues interact with each other through genes will reveal important biomedical information. As before, we use
where the gene expression level of a tissue is decomposed into its endogenous component
We use a similar line of reasoning to recover tissue-tissue networks in terms of gene expression using the quasi-dynamic ODE model. These networks are also fully informative, which can characterize and contextualize how each pair of tissues interact with each other into a bi-directional, signed, and weighed graph. We denote the integrals of
Data Availability Statement
Publicly available datasets were analyzed in this study. This data can be found here: https://gtexportal.org/home/.
Author Contributions
CC derived the model, performed data analysis, and packed computer code. LJ did KEGG gene enrichment analysis. CG provided insight about evolutionary game theory. BS and MW participated in model derivation and data analysis. VC provided critical comments that have led to the significant improvement of the representation. RW conceived of the idea, supervised the work, and wrote the manuscript with inputs from the other authors.
Funding
This work was supported by the grants from the National Institutes of Health (U01 HL119178 and NICHD 5R01HD086911-02).
Conflict of Interest
The authors declare that the research was conducted in the absence of any commercial or financial relationships that could be construed as a potential conflict of interest.
Publisher’s Note
All claims expressed in this article are solely those of the authors and do not necessarily represent those of their affiliated organizations, or those of the publisher, the editors and the reviewers. Any product that may be evaluated in this article, or claim that may be made by its manufacturer, is not guaranteed or endorsed by the publisher.
Supplementary Material
The Supplementary Material for this article can be found online at: https://www.frontiersin.org/articles/10.3389/fsysb.2021.764161/full#supplementary-material
References
Allot, A., Chennen, K., Nevers, Y., Poidevin, L., Kress, A., Ripp, R., et al. (2017). MyGeneFriends: A Social Network Linking Genes, Genetic Diseases, and Researchers. J. Med. Internet Res. 19 (6), e212. doi:10.2196/jmir.6676
Bornholdt, S. (2008). Boolean Network Models of Cellular Regulation: Prospects and Limitations. J. R. Soc. Interf. 5 Suppl 1 (Suppl. 1), S85–S94. doi:10.1098/rsif.2008.0132.focus
Boyle, E. A., Li, Y. I., and Pritchard, J. K. (2017). An Expanded View of Complex Traits: from Polygenic to Omnigenic. Cell 169, 1177–1186. doi:10.1016/j.cell.2017.05.038
Cantini, L., Medico, E., Fortunato, S., and Caselle, M. (2015). Detection of Gene Communities in Multi-Networks Reveals Cancer Drivers. Sci. Rep. 5, 17386. doi:10.1038/srep17386
Castro, D. M., de Veaux, N. R., Miraldi, E. R., and Bonneau, R. (2019). Multi-study Inference of Regulatory Networks for More Accurate Models of Gene Regulation. Plos Comput. Biol. 15 (1), e1006591. doi:10.1371/journal.pcbi.1006591
Chen, C., Jiang, L., Fu, G., Wang, M., Wang, Y., Shen, B., et al. (2019). An Omnidirectional Visualization Model of Personalized Gene Regulatory Networks. Npj Syst. Biol. Appl. 5, 38. doi:10.1038/s41540-019-0116-1
Chen, S., Shojaie, A., and Witten, D. M. (2017). Network Reconstruction from High-Dimensional Ordinary Differential Equations. J. Am. Stat. Assoc. 112, 1697–1707. doi:10.1080/01621459.2016.1229197
Costanzo, M., Kuzmin, E., Van Leeuwen, J., Mair, B., Moffat, J., Boone, C., et al. (2019). Global Genetic Networks and the Genotype-To-Phenotype Relationship. Cell 177, 85–100. doi:10.1016/j.cell.2019.01.033
Cowden, T. L., and Cummings, G. G. (2012). Nursing Theory and Concept Development: a Theoretical Model of Clinical Nurses′ Intentions to Stay in Their Current Positions. J. Adv. Nurs. 68, 1646–1657. doi:10.1111/j.1365-2648.2011.05927.x
Dunbar, R. I. M. (1992). Neocortex Size as a Constraint on Group Size in Primates. J. Hum. Evol. 22, 469–493. doi:10.1016/0047-2484(92)90081-j
Espinosa-Soto, C. (2018). On the Role of Sparseness in the Evolution of Modularity in Gene Regulatory Networks. Plos Comput. Biol. 14 (5), e1006172. doi:10.1371/journal.pcbi.1006172
Fagny, M., Paulson, J. N., Kuijjer, M. L., Sonawane, A. R., Chen, C.-Y., Lopes-Ramos, C. M., et al. (2017). Exploring Regulation in Tissues with eQTL Networks. Proc. Natl. Acad. Sci. USA 114, E7841–E7850. doi:10.1073/pnas.1707375114
Fowler, J. H., Dawes, C. T., and Christakis, N. A. (2009). Model of Genetic Variation in Human Social Networks. Pnas 106, 1720–1724. doi:10.1073/pnas.0806746106
Fu, L., Sun, L., Hao, H., Jiang, L., Zhu, S., Ye, M., et al. (2018). How Trees Allocate Carbon for Optimal Growth: Insight from a Game-Theoretic Model. Brief Bioinform 19, 593–602. doi:10.1093/bib/bbx003
Fuhrman, J. A. (2009). Microbial Community Structure and its Functional Implications. Nature 459, 193–199. doi:10.1038/nature08058
Gamazon, E. R., Segrè, A. V., Segrè, A. V., van de Bunt, M., Wen, X., Xi, H. S., et al. (2018). Using an Atlas of Gene Regulation across 44 Human Tissues to Inform Complex Disease- and Trait-Associated Variation. Nat. Genet. 50, 956–967. doi:10.1038/s41588-018-0154-4
Gayon, J. (2000). History of the Concept of Allometry. Am. Zool 40, 748–758. doi:10.1093/icb/40.5.748
Girousse, C., Roche, J., Guerin, C., Le Gouis, J., Balzegue, S., Mouzeyar, S., et al. (2018). Coexpression Network and Phenotypic Analysis Identify Metabolic Pathways Associated with the Effect of Warming on Grain Yield Components in Wheat. PLoS ONE 13 (6), e0199434. doi:10.1371/journal.pone.0199434
Glass, K., Huttenhower, C., Quackenbush, J., and Yuan, G.-C. (2013). Passing Messages between Biological Networks to Refine Predicted Interactions. PLoS One 8 (5), e64832. doi:10.1371/journal.pone.0064832
Haigis, K. M., Cichowski, K., and Elledge, S. J. (2019). Tissue-specificity in Cancer: The Rule, Not the Exception. Science 363, 1150–1151. doi:10.1126/science.aaw3472
Hofbauer, J., and Sigmund, K. (1998). Evolutionary Games and Population Dynamics. Cambridge, UK: Cambridge University Press.
Jiang, L., He, X., Jin, Y., Ye, M., Sang, M., Chen, N., et al. (2018). A Mapping Framework of Competition-Cooperation QTLs that Drive Community Dynamics. Nat. Commun. 9 (1), 3010. doi:10.1038/s41467-018-05416-w
Kim, B.-R., Zhang, L., Berg, A., Fan, J., and Wu, R. (2008). A Computational Approach to the Functional Clustering of Periodic Gene-Expression Profiles. Genetics 180, 821–834. doi:10.1534/genetics.108.093690
Kuijjer, M. L., Tung, M. G., Yuan, G., Quackenbush, J., and Glass, K. (2019). Estimating Sample-specific Regulatory Networks. iScience 14, 226–240. doi:10.1016/j.isci.2019.03.021
Lobell, D. B., Roberts, M. J., Schlenker, W., Braun, N., Little, B. B., Rejesus, R. M., et al. (2014). Greater Sensitivity to Drought Accompanies maize Yield Increase in the U.S. Midwest. Science 344, 516–519. doi:10.1126/science.1251423
Massey, S. E., and Mishra, B. (2018). Origin of Biomolecular Games: Deception and Molecular Evolution. J. R. Soc. Interf. 15 (146), 20180429. pii. doi:10.1098/rsif.2018.0429
Mcconnaughay, K. D. M., and Coleman, J. S. (1999). Biomass Allocation in Plants: Ontogeny or Optimality? A Test along Three Resource Gradients. Ecology 80, 2581–2593. doi:10.1890/0012-9658(1999)080[2581:baipoo]2.0.co;2
Mcdonald, D. B., and Hobson, E. A. (2018). Edge Weight Variance: Population Genetic Metrics for Social Network Analysis. Anim. Behav. 136, 239–250. doi:10.1016/j.anbehav.2017.11.017
Melé, M., Ferreira, P. G., Reverter, F., DeLuca, D. S., Monlong, J., Sammeth, M., et al. (2015). The Human Transcriptome across Tissues and Individuals. Science 348, 660–665. doi:10.1126/science.aaa0355
Melo, D., Porto, A., Cheverud, J. M., and Marroig, G. (2016). Modularity: Genes, Development, and Evolution. Annu. Rev. Ecol. Evol. Syst. 47, 463–486. doi:10.1146/annurev-ecolsys-121415-032409
Newman, M. E. J. (2003). The Structure and Function of Complex Networks. SIAM Rev. 45, 167–256. doi:10.1137/s003614450342480
Nowak, M. A. (2006). Five Rules for the Evolution of Cooperation. Science 314, 1560–1563. doi:10.1126/science.1133755
Omony, J. (2013). Biological Network Inference: A Review of Methods and Assessment of Tools and Techniques. Ann. Res. Rev. Biol. 4, 577–601.
Saelens, W., Cannoodt, R., and Saeys, Y. (2018). A Comprehensive Evaluation of Module Detection Methods for Gene Expression Data. Nat. Commun. 9 (1), 1090. doi:10.1038/s41467-018-03424-4
Saha, A., Kim, Y., Gewirtz, A. D. H., Jo, B., Gao, C., McDowell, I. C., Engelhardt, B. E., and Battle, A.GTEx Consortium (2017). Co-expression Networks Reveal the Tissue-specific Regulation of Transcription and Splicing. Genome Res. 27, 1843–1858. doi:10.1101/gr.216721.116
Siegenthaler, C., and Gunawan, R. (2014). Assessment of Network Inference Methods: How to Cope with an Underdetermined Problem. PLoS ONE 9 (3), e90481. doi:10.1371/journal.pone.0090481
Sinervo, B., and Lively, C. M. (1996). The Rock-Paper-Scissors Game and the Evolution of Alternative Male Strategies. Nature 380, 240–243. doi:10.1038/380240a0
Smith, J. M., and Price, G. R. (1973). The Logic of Animal Conflict. Nature 246, 15–18. doi:10.1038/246015a0
Sonawane, A. R., Platig, J., Fagny, M., Chen, C.-Y., Paulson, J. N., Lopes-Ramos, C. M., et al. (2017). Understanding Tissue-specific Gene Regulation. Cel Rep. 21, 1077–1088. doi:10.1016/j.celrep.2017.10.001
Strand, D., Franco, O., Basanta, D., Anderson, A., and Hayward, S. (2010). Perspectives on Tissue Interactions in Development and Disease. Cmm 10, 95–112. doi:10.2174/156652410791065363
Swierniak, A., Krzeslak, M., Borys, D., and Kimmel, M. (2018). The Role of Interventions in the Cancer Evolution-An Evolutionary Games Approach. Math. Biosci. Eng. 16 (1), 265–291. doi:10.3934/mbe.2019014
The GTEx Consortium (2017). Genetic Effects on Gene Expression across Human Tissues. Nature 550, 204–213.
The GTEx Consortium (2015). Human Genomics. The Genotype-Tissue Expression (GTEx) Pilot Analysis: Multitissue Gene Regulation in Humans. Science 348, 648–660. doi:10.1126/science.1262110
Tibshirani, R. (1996). Regression Shrinkage and Selection via the Lasso. J. R. Stat. Soc. Ser. B (Methodological) 58, 267–288. doi:10.1111/j.2517-6161.1996.tb02080.x
von Neumann, J., and Morgenstern, S. (1944). Theory of Games and Economic Behavior. Princeton, NJ: Princeton University Press.
Wang, H., and Leng, C. (2008). A Note on Adaptive Group LASSO. Comput. Stat. Data Anal. 52, 5277–5286. doi:10.1016/j.csda.2008.05.006
Wang, Y., Cho, D.-Y., Lee, H., Fear, J., Oliver, B., and Przytycka, T. M. (2018). Reprogramming of Regulatory Network Using Expression Uncovers Sex-specific Gene Regulation in Drosophila. Nat. Commun. 9, 4061. doi:10.1038/s41467-018-06382-z
Werhli, A. V., and Husmeier, D. (2007). Reconstructing Gene Regulatory Networks with Bayesian Networks by Combining Expression Data with Multiple Sources of Prior Knowledge. Stat. Appl. Genet. Mol. Biol. 6, Article15–47. doi:10.2202/1544-6115.1282
Wu, H., Lu, T., Xue, H., and Liang, H. (2014). Sparse Additive Ordinary Differential Equations for Dynamic Gene Regulatory Network Modeling. J. Am. Stat. Assoc. 109, 700–716. doi:10.1080/01621459.2013.859617
Wu, R., and Jiang, L. (2021). Recovering Dynamic Networks in Big Static Datasets. Phys. Rep. 912, 1–57. doi:10.1016/j.physrep.2021.01.003
Xu, S., Li, Y., and Wang, G. (2014). Scaling Relationships between Leaf Mass and Total Plant Mass across Chinese Forests. PLOS ONE 9 (4), e95938. doi:10.1371/journal.pone.0095938
Yang, F., Wang, J., Pierce, B. L., and Chen, L. S.GTEx Consortium (2017). Identifying Cis-Mediators for Trans-eQTLs across many Human Tissues Using Genomic Mediation Analysis. Genome Res. 27, 1859–1871. doi:10.1101/gr.216754.116
Yuan, M., and Lin, Y. (2006). Model Selection and Estimation in Regression with Grouped Variables. J. R. Stat. Soc B 68, 49–67. doi:10.1111/j.1467-9868.2005.00532.x
Zhang, B., Gong, J., Zhang, W., Xiao, R., Liu, J., and Xu, X. Z. S. (2018). Brain-gut Communications via Distinct Neuroendocrine Signals Bidirectionally Regulate Longevity in C. elegans. Genes Dev. 32, 258–270. doi:10.1101/gad.309625.117
Keywords: gene regulatory network, tissue specificity, inter-tissue network, ordinary differential equations, network modeling
Citation: Chen C, Jiang L, Shen B, Wang M, Griffin CH, Chinchilli VM and Wu R (2021) A Computational Atlas of Tissue-specific Regulatory Networks. Front. Syst. Biol. 1:764161. doi: 10.3389/fsysb.2021.764161
Received: 25 August 2021; Accepted: 30 September 2021;
Published: 26 October 2021.
Edited by:
Yuehua Cui, Michigan State University, United StatesReviewed by:
Shaoyu Li, University of North Carolina at Charlotte, United StatesPing Zeng, Xuzhou Medical University, China
Copyright © 2021 Chen, Jiang, Shen, Wang, Griffin, Chinchilli and Wu. This is an open-access article distributed under the terms of the Creative Commons Attribution License (CC BY). The use, distribution or reproduction in other forums is permitted, provided the original author(s) and the copyright owner(s) are credited and that the original publication in this journal is cited, in accordance with accepted academic practice. No use, distribution or reproduction is permitted which does not comply with these terms.
*Correspondence: Rongling Wu, cnd1QHBocy5wc3UuZWR1
†Present address: Department of Epidemiology & Public Health, University of Maryland School of Medicine, Baltimore, MD, United States