 Nevin Tham
 Sarah R. Langley
- Lee Kong Chian School of Medicine, Nanyang Technological University, Singapore, Singapore
Drug repurposing is an approach to identify new therapeutic applications for existing drugs and small molecules. It is a field of growing research interest due to its time and cost effectiveness as compared with de novo drug discovery. One method for drug repurposing is to adopt a systems biology approach to associate molecular ‘signatures’ of drug and disease. Drugs which have an inverse relationship with the disease signature may be able to reverse the molecular effects of the disease and thus be candidates for repurposing. Conversely, drugs which mimic the disease signatures can inform on potential molecular mechanisms of disease. The relationship between these disease and drug signatures are quantified through connectivity scores. Identifying a suitable drug-disease scoring method is key for in silico drug repurposing, so as to obtain an accurate representation of the true drug-disease relationship. There are several methods to calculate these connectivity scores, notably the Kolmogorov-Smirnov (KS), Zhang and eXtreme Sum (XSum). However, these methods can provide discordant estimations of the drug-disease relationship, and this discordance can affect the drug-disease indication. Using the gene expression profiles from the Library of Integrated Network-Based Cellular Signatures (LINCS) database, we evaluated the methods based on their drug-disease connectivity scoring performance. In this first-of-its-kind analysis, we varied the quality of disease signatures by using only highly differential genes or by the inclusion of non-differential genes. Further, we simulated noisy disease signatures by introducing varying levels of noise into the gene expression signatures. Overall, we found that there was not one method that outperformed the others in all instances, but the Zhang method performs well in a majority of our analyses. Our results provide a framework to evaluate connectivity scoring methods, and considerations for deciding which scoring method to apply in future systems biology studies for drug repurposing.
1 Introduction
Drug repurposing is the process of identifying a new therapeutic use for an existing drug. It is a field of growing research interest because the traditional process to discover and develop novel therapeutics is long and expensive with low rates of success. As the pharmacokinetics and toxicology of approved drugs have been well studied, it renders drug repurposing markedly more economical and efficient (Breckenridge and Jacob 2019; Pushpakom et al., 2019). To this end, the Library of Integrated Network-Based Cellular Signatures (LINCS) Project was conceived to facilitate in silico drug repurposing (Subramanian et al., 2017). It involves the generation of a large-scale compendium of transcriptional profiles obtained from small molecule compound perturbations in human cultured cell lines. Over the years, there have been several reported applications on the use of LINCS data for in silico drug repurposing in diseases such as epilepsy (Delahaye-Duriez et al., 2016; Mirza et al., 2017), diabetes (Jin et al., 2014), Alzheimer’s Disease (Lamb et al., 2006; Taubes et al., 2021), aging (Dönertaş et al., 2018), inflammatory bowel disease (Dudley et al., 2011), skeletal muscle atrophy (Kunkel et al., 2011) and cancer (Rho, Kim, and Kang 2011; Lim, Lim, and Cho 2014; H.-W. Cheng et al., 2015; Liu et al., 2018).
The concept behind in silico drug repurposing is to identify connections between the transcriptional profile of a disease and small molecule compounds (Lamb et al., 2006). The mRNA expression state of a cell captures information about the transcriptional regulation processes taking place in the cell. Hence, by comparing the fingerprints of gene expression induced by a drug and a disease, the association between the drug and the disease can be evaluated. To quantify the relationship between a drug and a disease, the direction and magnitude of gene expression changes in the disease signature are compared against that in the drug signature. A signature, herein, refers to the transcriptional profile that characterizes the perturbation, either by drug treatment or a disease state.
A drug that increases the gene expression of downregulated genes (and decreases gene expression of upregulated genes) in the disease signature has an inverse relationship with the disease. Wagner et al., 2015 found that drugs that restore the transcriptional profile of the disease back to the normal state, termed as reversal drugs (Lamb et al., 2006; Fortney et al., 2015; Mirza et al., 2017), are associated with therapeutic effects for the disease. On the other hand, a drug that increases the gene expression of upregulated genes (and decreases gene expression of downregulated genes) in the disease signature, has a positive drug-disease relationship and is predicted to reflect or phenocopy the disease. Using similarity scores (or connectivity scores) between the disease signature and drug signatures, such as those found in LINCS, it is possible to prioritize drugs that can be investigated as potential treatments for the disease.
There have been several proposed algorithms to quantify the similarity between two transcriptional signatures. The first algorithm was adopted by Lamb et al. (2006), and it uses a non-parametric rank-based algorithm, based on the Kolmogorov-Smirnov (KS) statistic. This method was also later referred to as the Gene Set Enrichment Analysis (GSEA) method. Zhang and Gant next introduced a simpler method, known as the Zhang (or statistically significant connectivity map—ssCMap) method (Zhang and Gant 2008). Unlike the KS method, the Zhang method takes account of the direction of regulation of the genes in the reference profile, and it is based on the signed-rank statistic. A third method, eXtreme sum (XSum), proposes that a reference profile can be represented by the most highly up and down regulated genes, known as eXtreme genes (J. Cheng et al., 2014). The fold changes of these genes are then used to quantify the connection between the two signatures. Besides the XSum algorithm, Cheng and Yang explored several other pairwise similarity metrics which utilizes eXtreme genes, such as XCosine, XCorrelation and XSpearman. Among the eXtreme methods, the XSum method is recommended due to its ease of use and minimal information required (J. Cheng and Yang 2013; Samart et al., 2021).
Given multiple gene-based connectivity algorithms, it has been of interest to benchmark the methods. The common approach to evaluate the methods is to first compute drug-drug similarity, and then assess the true relationship of the compounds based on their mechanism-of-action (MOA) similarity (Liu et al., 2018), or their Anatomical Therapeutic Chemical (ATC) classification. However, little work has been done to evaluate the methods based on their ability to quantify drug-disease dissimilarity. It has been highlighted that the validity of such studies may be limited as the quality of the disease signature may not completely portray the disease profile (Musa et al., 2018). Moreover, the influence of the disease signature quality on connectivity score is an aspect of in silico drug repurposing that is widely recognized, yet relatively understudied (Zhang and Gant 2008; J. Cheng et al., 2014; Musa et al., 2018; Samart et al., 2021).
Hence in this work, we evaluated three primary drug repurposing methods—KS, Zhang, XSum—based on their ability to identify approved, or experimentally validated, drugs for repurposing to treat other diseases. The disease signatures were queried against the most recent release of the LINCS database, which contains over a million replicate-collapsed signatures. In addition to benchmarking based on the similarity of drug-drug signatures that have previously been evaluated, we take a first step to investigate the drug-disease indications of these methods when the quality of the disease signature is varied. We further explored how compound prioritization by these methods are altered due to noise in gene expressions. A schematic of the analyses performed in this study is illustrated in Figure 1. We show that the Zhang method generally had a better sensitivity, and is more robust to variation in query signature quality, than the other two methods. Together, this suggests that the Zhang method is better suited to quantify drug-disease relationships for in silico drug repurposing.

FIGURE 1. Evaluation of Connectivity Methods. Three disease and one compound signatures were retrieved from published literature and queried against the CMap LINCS database (updated in 2021). Three connectivity methods—KS, Zhang and XSum—were evaluated based on their sensitivity, and their performance due to signature quality variation and noise in gene expression data.
2 Methods
2.1 Query signatures from literature
To evaluate the relative performance of different scoring algorithms, the query signatures of three diseases (gastric cancer, colorectal cancer and epilepsy) and one drug compound (17b-estradiol) were retrieved from publicly available resources (Table 1). For colorectal cancer and estradiol, the query signatures were retrieved directly from their previous publications (Frasor et al., 2004; Lamb et al., 2006; Jorissen et al., 2009; van Noort et al., 2014). The epilepsy signature as well as the full results from the differential expression analysis was retrieved from the Supplementary Materials in Hansen et al. (2014). From this dataset, genes with absolute fold change >2 and q-value < 0.05 were included in the query signature for this study. As the epilepsy signature was obtained from the mouse model, the mouse genes were mapped to their analogous human genes using biomaRt package (Durinck et al., 2009), in line with the analysis performed in Mirza et al. (2017). To obtain the full results from a differential expression analysis, the raw gene expression data for gastric cancer (GSE13861, Cho et al., 2011) was re-analyzed using the R package “limma”; and the significance of differential expression was calculated using the empirical Bayes moderated t-statistics (Smyth 2004).
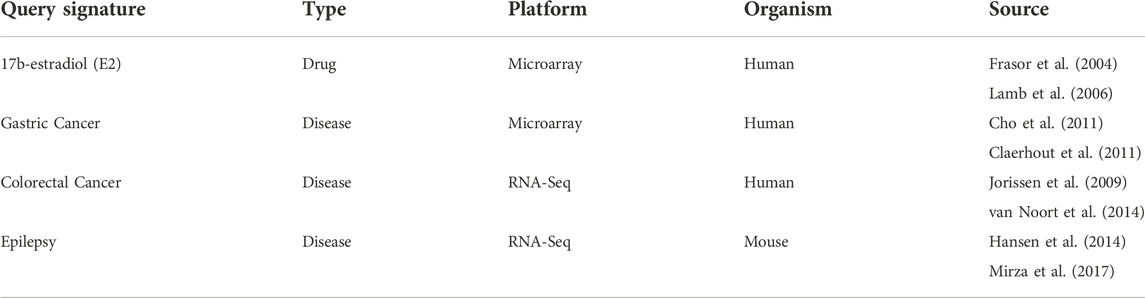
TABLE 1. Drug and disease signatures used to query LINCS drug signature database.
2.2 Library of integrated network-based cellular signatures database
The Library of Integrated Network-based Cellular Signatures (LINCS) level 5 data of compound-treated signatures were downloaded from Clue.io (https://clue.io/data/CMap2020#LINCS2020 (CMap LINCS 2020)). Level 5 data in CMap refers to replicate consensus signatures, where the differential expression (LFC) of genes are moderated across replicated experiments to determine the “de-noised” representation of a drug effect (Subramanian et al., 2017). This database comprises more than 720K signatures of 34K compounds treated onto 248 unique cell lines. The drug signature database was further filtered down to signatures which were only treated with compounds with known targets and MOAs, resulting in 387K signatures of 2,558 unique compounds.
In order to incorporate noise into the LINCS data, the level 3 data was also retrieved from the same web source as the level 5 data. LINCS level 3 data refers to individual instances of normalized gene expressions, due to a functional perturbation. The level 3 data which was retrieved comprises 1.8M compound treated instances.
2.3 Drug-disease/drug-drug similarity score
The three in silico drug repurposing methods discussed in this study are the KS, Zhang and XSum methods. Since the introduction of the concept of drug-disease scoring, there have been several other methods proposed to quantify the relationship between a drug and a disease signature. Most of these other methods are a modification or a weighted combination of these three parent methods. Hence, this study focuses on the evaluation of these three primary methods. The R code used for these three methods was retrieved from the “RCSM” package, which was compiled in an earlier work (Lin et al., 2020). A brief description of their algorithm is summarized in Table 2.
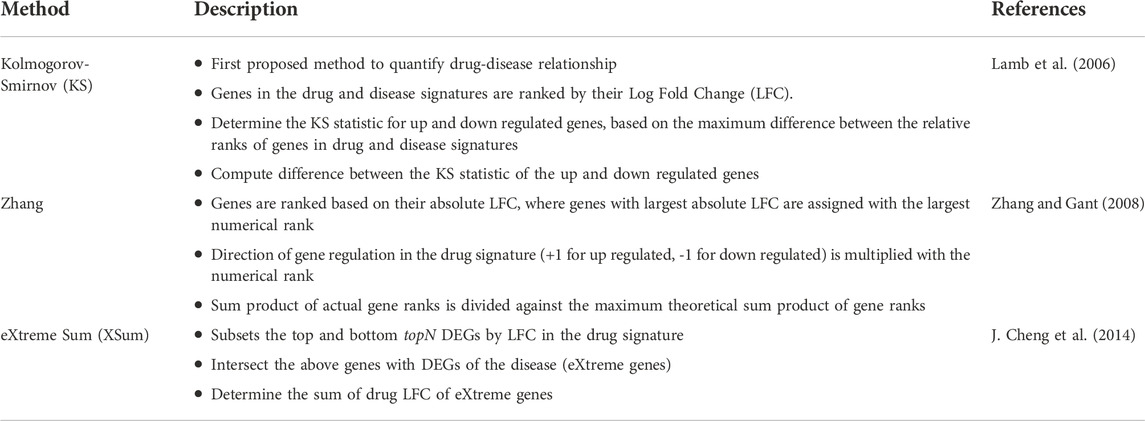
TABLE 2. Brief description of current drug-disease algorithms that are evaluated in this study.
2.3.1 Kolmogorov-Smirnov statistic
The benchmark algorithm proposed by (Lamb et al., 2006) uses a non-parametric, rank-based pattern-matching strategy based on the Kolmogorov-Smirnov (KS) statistic. Essentially, this method calculates the maximum difference in relative ranks of the up and down regulated genes. A strongly downregulated gene by the disease that is strongly upregulated by the drug, results in a large difference between their relative rank. This contributes to a strongly negative drug-disease score, indicating the strong potential of the drug to reverse the disease signature, restoring the transcriptional profile of the disease to the normal state.
2.3.2 Zhang score
Zhang et al. proposed the Zhang scoring algorithm, and have proposed that their method performs better than the KS method (Zhang and Gant 2008). The Zhang Score (ZS) is obtained by finding the ratio of the sum product of the actual gene ranks against the maximum theoretical sum product of the gene ranks. The Zhang method ranks the gene importance based on the absolute value of the gene log fold change (LFC), and assigns heavier weights to the more differentiated genes. It is a sign-rank based algorithm, which assigns a negative rank for genes that are downregulated, and vice versa. They rationalize that ZS is a more accurate quantification of the drug-disease relationship because the highly regulated genes contribute more to the ZS, and are assigned greater weights regardless of the direction of regulation.
2.3.3 eXtreme sum
Cheng et al. proposed the eXtreme Sum (XSum) scoring method, which is based on eXtreme genes (J. Cheng et al., 2014). eXtreme genes are genes that have been changed by the disease and also within the top and bottom topN genes changed by the drug (topN is an arbitrary integer defined by the user). XSum can be computed by: (sum of the LFC of the upregulated eXtreme genes) – (sum of the LFC of the downregulated eXtreme genes). As the size of baseline query signatures used in this study ranges between 80 and 120 genes, topN is set to 150 for this analysis, so that the number of eXtreme genes may be comparable with the query signature. The XSum is also a sign-rank based algorithm, wherein the signs and ranks of the genes influence the overall score.
2.4 Comparison by number of significantly scored signatures
Complementary to calculating drug-disease scores, the significance of a score is also evaluated. This is achieved by comparing the actual drug-disease score against a null distribution of scores. The null distribution of scores is obtained by computing scores between a drug signature and multiple randomly generated disease signatures of identical size. The significance (or empirical p-value) of the actual drug-disease score is determined by the frequency at which its absolute value exceeds the absolute scores of the null distribution (Zhang and Gant 2008; Lin et al., 2020). For the case of a positive (negative) drug-disease score, the p-value indicates if the phenocopy (reversal) score is significantly positive (negative, p < 0.05), or positive (negative) by chance (p ≥ 0.05).
To compare which method was able to significantly score the highest number of true phenocopy (or reversal) signatures, the literature query signatures were queried against signatures that have been perturbed with a compound of the same MOA (or with an actual drug that has been used to treat the disease) (Table 3). The method that has the largest number of significantly scored phenocopy or reversal signatures suggests that it has a better sensitivity.
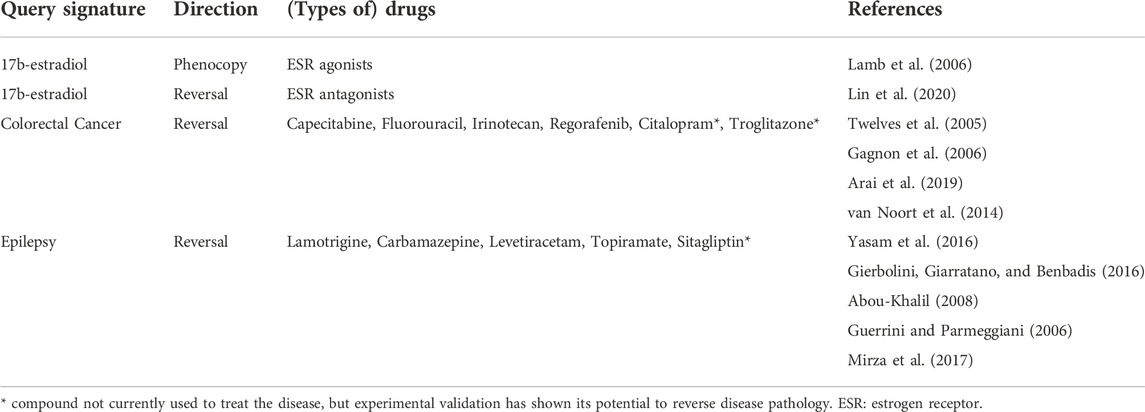
TABLE 3. List of drugs that are marked as phenocopy or reversal of the query signatures used in this study, in order to investigate the accuracy of each method.
For the purpose of this analysis, the signatures in LINCS that were treated with the corresponding drugs (Table 3) regardless of the dosage or treatment duration, are generalized as true phenocopy or reversal signatures. In truth, an excessive (or insufficient) dosage of a drug for an extended (or shortened) duration, may alter the status of a signature as a true positive. As such, these generalized signatures are only putative true positives, and it is unlikely that all of them are true positives. Consequently, the number of true positive signatures cannot be exactly determined, and the score obtained from this analysis is only a close estimate of the true accuracy.
2.5 Comparison by AUC of signature score
To evaluate the relative performance of each scoring metric using the area under the Receiver Operator Curve (ROC, AUC), the set of reversal and non-reversal drugs were first defined. Compounds that have been used to treat the disease were defined as reversal drugs (Table 3), while the complement set of compounds in LINCS were defined as drugs that do not reverse the disease. These compound labels were then used to compute the AUC.
The ROC records how sensitivity of a method changes with respect to its specificity; and methods that attain larger AUC indicate their better accuracy. In the application of drug repurposing, it is prudent to investigate only the top scoring drugs. Hence, the early retrieval performance is also evaluated, which is measured by the AUC at which the false positive rate (FPR) is less than 0.1 and 0.01 (AUC0.1 and AUC0.01) (J. Cheng et al., 2014).
2.6 Comparison by varying signature quality
As highlighted in the earlier section, the quality of the disease signature may affect the performance of a method to quantify drug-disease scores. Common thresholds applied to characterize the quality of a disease signature can be based on differential gene fold-change (e.g., | log2(fold-change) | > 1), level of significance (e.g., adjusted p-value < 0.05) or rank (e.g., top and bottom 100 genes) (Samart et al., 2021). In this work, we estimate the quality of a disease signature by the proportion of significant differentially expressed genes (DEGs), as well as their significance level in the differential expression analysis. Hence, our threshold of choice integrates the three above mentioned thresholds, by calculating the order statistic of each gene (order statistics:
To evaluate how the performance of each method is affected by data quality, we simulated and tested varying qualities of the gastric cancer and epilepsy disease signatures across five different levels (Table 4). For each quality level, the drug-disease scores were calculated against a specific drug signature in LINCS (gastric cancer: ASG002_AGS_24H:G15, epilepsy: REP.A006_MCF7_24H:D05), which had obtained a significantly negative score with the baseline medium sized disease signature (set A). The medium sized signature set A was used as the baseline for this analysis, to understand the score trend when the query signature quality changes. Set A was arbitrarily derived from the top 250 and 120 genes by order statistics in the gastric cancer and epilepsy DEG analysis, respectively. Set B is derived from the top 120 and 60 genes, while Set C is derived from the top 500 and 250 genes, by order statistics in the gastric cancer and epilepsy DEG analysis, respectively (Table 4).
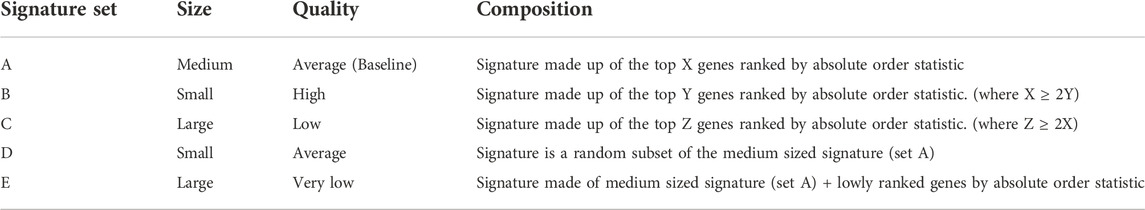
TABLE 4. Different quality levels of disease signatures and its composition. Order statistic of a gene:
For the analysis of set D, the signature of set A was randomly subsetted by one-third 1000 times and two-thirds, also 1000 times, and the drug-disease scores of these signatures were computed. The median and standard deviation of these scores were reported for the analysis of set D. For the analysis of set E, an increasing number of noisy non-DEGs were added to set A signature to dilute the quality of the query signature. We diluted the query signature across four levels, where the number of noisy non-DEGs added is 20%, 50%, 100% and 150% of the size of set A signature. At each dilution level, 1000 different sets of genes were randomly selected from the pool of noisy non-DEGs, and appended to set A. For the gastric cancer study, the noisy non-DEGs are lowly ranked genes which have order statistic <0.02 (ranked 20,000th and beyond), whereas for the epilepsy study, they are identified by their small absolute LFC and large p-adjusted values (absolute LFC <1 and q-value >0.05, order statistics ranked 20,000th and beyond). The drug-disease score, as well as its significance, for each of these noisy signatures were computed. Finally, the number of noisy signatures from set E that still attained a significant score was determined.
2.7 Addition of simulated noise to LINCS data
In order to reasonably evaluate the robustness of the connectivity methods to gene expression noise, the simulated data should closely represent the original data. This can be achieved by using the original data as seeds, and using a simulation model that considers the principles that govern the generation of gene expression data. To fulfill the first condition, the LINCS level 3 expression values of the 978 landmark genes were used as the seed for noise simulation.
For the second condition, the simulated gene expression values,
where
(1) The gene expression varies around an average value,
(2) The range of variation is dependent on the original gene expression,
(3) The gene expression variation is uniformly distributed around its average value,
(4) The weakly expressed genes undergo more variation than the highly expressed genes.
A user-defined parameter,
Four categorical amount of noise was added to 50 randomly selected signatures from LINCS, by increasing the values of
Using an identical pipeline as CMap, the simulated expression values of the landmark genes are used to infer the expression of all other genes in LINCS, and finally converted to level 5 data, which represents the replicate-consensus signature in CMap (Subramanian et al., 2017). The amount of eventual noise introduced to a drug signature in LINCS is estimated using the Spearman rank correlation between the unsimulated and simulated signature.
2.8 Comparison by Spearman correlation of simulated signatures
For each signature that has been randomly chosen (termed randSig) to be simulated, 1000 (for MCF7, HEK293, NEU and NPC) and 784 (for CD34) signatures from the same cell line were randomly selected, including the unsimulated version of randSig, to form the pool of signatures (termed sigPool) to be analyzed.
First, a query signature was derived from the unsimulated version of randSig by subsetting the top 100 genes by absolute LFC. This query signature is a good representation of the transcriptional profile of randSig, and was used to calculate similarity scores with the signatures in sigPool. The signatures in sigPool were then ranked, based on the similarity score, from the strongest phenocopy to the strongest reversal of randSig (sigPoolRankunsim).
Second, noise was introduced to randSig to obtain the simulated version of randSig. The same filter criteria (i.e. top 100 genes by absolute LFC) was applied to the simulated randSig, to generate a simulated query signature to be evaluated against sigPool. The signatures in sigPool were then ranked based on the new similarity score with the simulated query signature (sigPoolRanksim).
Finally, the Spearman rank correlation between sigPoolRankunsim and sigPoolRanksim was determined, for the top and bottom ranked 10% signatures in sigPoolRankunsim. This analysis was repeated for 50 different versions of simulated randSig; and the median correlation was used to compare the performance of the methods at every noise level.
2.9 Comparison by AUC of score significance of simulated randSig
Using the query signature of the unsimulated randSig, its similarity score significance with signatures in sigPool was also determined. Signatures with significance value smaller than 0.05 were labeled to have a significant relationship with randSig, and vice versa; known as “actual” labels.
The score significance of the simulated randSig with signatures in sigPool is then calculated, to obtain the “predicted” labels. Together, the “actual” and “predicted” labels are used to compute the AUC of the simulated randSig. Importantly, if both the “actual” and “predicted” labels are significant, yet the similarity score signs are opposite, the “predicted” label is replaced to be not significant. The median AUC obtained from the 50 simulated randSigs were used to evaluate the performance of the methods, at every noise level.
3 Results
3.1 Comparison by number of significantly scored signatures
The ability of an algorithm to significantly score a reversal signature (drug-disease) or a true phenocopy signature (drug-drug) is an indicator of its ability to identify true positives. Our first evaluation was based on the effects of 17b-estradiol (E2), which is a natural estrogen receptor ligand. The E2 signature in MCF7 was obtained from an independent study, and it was used as the model signature in the initial CMap publication (Frasor et al., 2004; Lamb et al., 2006). Even though it was reported that there were 40 up and 89 down regulated genes in the E2 signature, we found that only 32 and 67, respectively, of these genes were within LINCS L1000 gene space.
We queried the E2 signature against 357 true phenocopy (ESR agonist) and 273 true reversal (ESR antagonist) drug signatures treated on MCF7 breast cancer cell lines. The E2 signature was also previously used in the benchmarking study by (Lin et al., 2020) and here, we perform the evaluation again using the most recent version of the compound annotations and CMap data. The Zhang method was able to significantly score the highest number of true phenocopy drugs, while the KS and Zhang had similar performance to significantly score true reversal drug signatures of E2. Conversely, the XSum method significantly scored the least number of true phenocopy and true reversal signatures of E2 (Figure 2A).
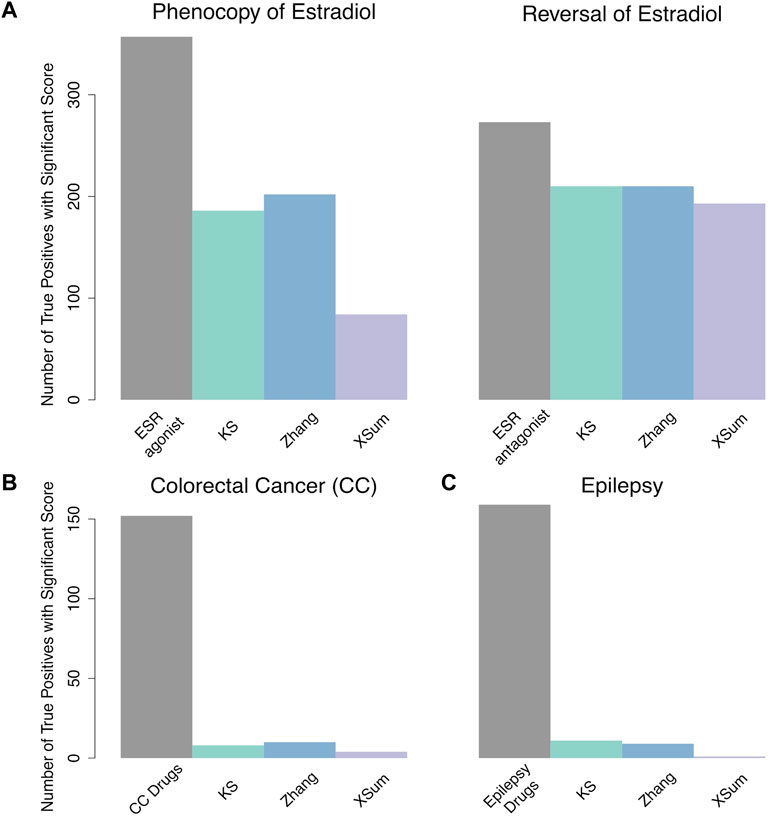
FIGURE 2. Number of significantly scored signatures for (A) true phenocopy and reversal of 17b-estradiol, reversal signatures for (B) colorectal cancer and (C) epilepsy.
We next queried a colorectal cancer (CC) signature against 152 HT29 (colon cancer cell line) signatures that were treated with drugs administered to CC patients (Twelves et al., 2005; Gagnon et al., 2006; Arai et al., 2019) or compounds that were experimentally validated to inhibit CC tumor growth (Table 3, van Noort et al., 2014). Jorissen et al. (2009) derived the CC signature from three independent pairs of comparison between early-stage and metastatic stage colon tumors, and genes which showed consistent expression changes across the three analyses were compiled to form the CC signature. The compiled CC signature consists of 71 up and 57 down regulated genes. However, only 60 and 32, respectively, of these genes were found in the LINCS gene space, and queried against the HT29 signatures. The Zhang method had the greatest number of significantly scored signatures for CC, followed by the KS method. The XSum method had the poorest performance, identifying only four out of 152 signatures that were treated with CC reversal drugs (Figure 2B).
For the third analysis, we obtained an epilepsy signature from a pilocarpine-induced status epilepticus (SE) mouse model (Hansen et al., 2014). Post 6 weeks SE, the RNA-seq evidence suggests increased cellular excitability and morphogenesis in the mice. This epilepsy signature at 6 weeks was made up of 40 up and 77 down regulated genes (absolute fold change >2 and q-value < 0.05) in the LINCS gene space. This signature was queried against epilepsy reversal drug signatures in LINCS (NPC and MCF7 cell lines) (Table 3, Guerrini and Parmeggiani 2006; Abou-Khalil 2008; Gierbolini, Giarratano, and Benbadis 2016; Yasam et al., 2016). Additionally, the signatures of sitagliptin, a recent experimentally validated drug that reduced seizure scores in a mouse model of pharmacoresistant epilepsy, were also labeled as reversal signatures of epilepsy (Mirza et al., 2017). Generally, the three methods performed poorly, significantly scoring only less than 7% of all the reversal signatures. Among them, the KS and Zhang methods were able to significantly score a comparable number of reversal signatures, whereas the XSum method had the lowest number of significantly scored reversal signatures (Figure 2C).
Based on the analysis of the E2, colorectal cancer and epilepsy signatures, the Zhang method significantly scored the greatest number of true phenocopy signatures, whereas the KS and Zhang methods significantly scored a comparable number of reversal signatures. On the other hand, the XSum method had the least number of significantly scored true phenocopy and reversal signatures.
3.2 Comparison by AUC of signature scores
The Receiver Operator Curve (ROC) records how the true positive rate of a predictor model changes with respect to its false positive rate. The method that attains the greatest area-under-the-curve (AUC) suggests that the scores are more indicative of the true drug-disease (or drug-drug) relationship. In the context of drug repurposing, the partial AUC, at lower false positive rate (FPR) thresholds, is also computed (J. Cheng et al., 2014; Lin et al., 2020). The reason is that drug repurposing typically investigates only the top few prioritized drugs, hence a method with higher specificity at low FPR is more desirable.
For the analysis of 17b-estradiol, we queried the E2 signature against 31,471 MCF7 signatures that were treated with 2,325 unique compounds with known targets and MOAs from LINCS. Among these, there are 14 and seven compounds whose MOA was annotated as an ESR agonist and antagonist respectively. The signatures of the 14 ESR agonists are marked as true phenocopy signatures; while the signatures of the 7 ESR antagonists are marked as true reversal signatures. The Zhang method outperforms the other two methods when identifying true phenocopy signatures (AUC – 0.87, AUC0.1 – 0.047, AUC0.01 – 1.8 e-3). For identifying true reversal signatures, the KS and Zhang methods display similar performance and accuracy (KS: AUC – 0.89, AUC0.1 – 0.066, AUC0.01 – 4.2 e-3, Zhang: AUC – 0.90, AUC0.1 – 0.065, AUC0.01 – 4.1 e-3, Table 5). In both analysis for true phenocopy and true reversal signatures of E2, the XSum method attains the lowest AUC.
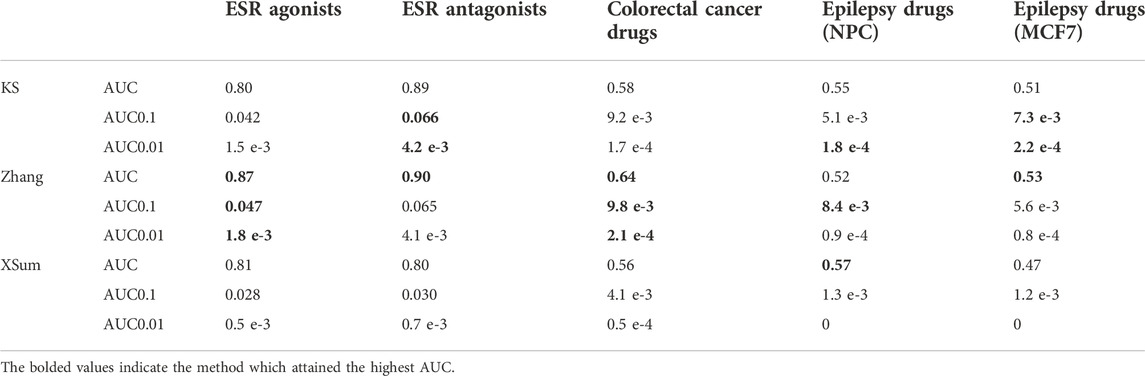
TABLE 5. AUC of each method in the analysis of 17b-estradiol, colorectal cancer and epilepsy signatures.
Next, we queried the CC signature against 20,866 signatures that were obtained from treating 2,221 unique small drug compounds on HT29 cell lines. Signatures that were generated from CC treatment drugs are marked as reversal signatures (Table 3, Twelves et al., 2005; Gagnon et al., 2006; Arai et al., 2019). Additionally, the signatures of citalopram and troglitazone, both drugs were reported to significantly reduce tumor volume in mouse model CC, were also marked as reversal signatures (van Noort et al., 2014). The Zhang method attained the largest AUC across all FPR thresholds (AUC – 0.64, AUC0.1 – 0.01, AUC0.01 – 2.1 e-4), indicating that the Zhang method is more accurate than the KS and XSum methods when predicting drug-disease relationship in CC (Table 5). The XSum method attained a significantly lower AUC at all false positive rate (FPR) thresholds, suggesting its poor early retrieval performance for the CC signature.
Third, we queried the epilepsy signature against 5,638 drug signatures derived from the NPC cell line. Besides NPC, we queried the epilepsy signature against another 31,471 drug signatures derived from the MCF7 cell line, as it has the highest number of drug signatures, including anti-epileptic drugs, in the LINCS database. Signatures that were perturbed with epilepsy treatment drugs (Table 3, Guerrini and Parmeggiani 2006; Abou-Khalil 2008; Gierbolini, Giarratano, and Benbadis 2016; Yasam et al., 2016), as well as sitagliptin (Mirza et al., 2017), were marked as reversal signatures of epilepsy. There were 67 and 92 signatures of these compounds in the NPC and MCF7 cell lines respectively. The KS method attained the largest AUC0.01 in both the NPC and MCF7 cell lines (AUC0.01 – 1.8 e-4 (NPC), AUC0.01 – 2.2 e-4 (MCF7)). The Zhang method attained the largest AUC0.1 (AUC0.1 – 8.4 e-3) for signatures in NPC, while the KS method attained the largest AUC0.1 (AUC0.1 – 7.3 e-3) for signatures in MCF7. For the full AUC, the XSum (AUC – 0.57) attained the largest area for NPC signatures, while the Zhang (AUC – 0.53) attained the largest area for MCF7 signatures (Table 5).
Generally, the Zhang method was able to attain the largest AUC when predicting true phenocopy signatures of E2, as well as reversal signatures of CC. The XSum method generally attained the lowest AUC when predicting true phenocopy or reversal signatures. This suggests that the scores from Zhang method, is the best among the three discussed methods, to reflect the true drug-disease (or drug-drug) relationship, whereas the XSum method is the least accurate.
3.3 Comparison by varying signature quality
To understand how the drug-disease scores change with respect to the quality of the query signature, we varied the quality of the gastric cancer and epilepsy signatures across five different levels (A–E), and computed the drug-disease score at each quality level. The quality of these signatures were varied by applying different order statistics (
Here, we briefly describe each of the five quality levels: Set A to Set C are obtained by first ranking the genes in the DEG analysis by their order statistics. Set A, designated as the baseline for comparison in this analysis, is made up of middle-to-top ranked genes, which are highly and moderately regulated in the disease (top 250 and 120, by order statistics, for gastric cancer and epilepsy, respectively) (Figure 3A; Table 4). Set B comprises only the top few ranked genes and has a high quality, as it is made up of highly regulated genes that define the disease (top 120 and 60, by order statistics, for gastric cancer and epilepsy, respectively). Set C comprises low-to-top ranked genes, and includes mildly regulated genes in addition to Set A (top 500 and 250, by order statistics, for gastric cancer and epilepsy, respectively). As such, Set C is considered to be of low signature quality. Set D is obtained by randomly subsetting baseline set A, and since its proportion of highly-to-moderately regulated genes is comparable with set A, the quality of set D is similar to that of A. The objective of investigating set D scores is to understand the score trend when the query signature size is reduced while its quality is maintained. Set E is generated by including noisy non-DEGs into set A, to form the query signature. As additional noisy non-DEGs are included, the quality of the query signature becomes diluted. Set E explains the score trend when the signature quality is very low (Figure 3A; Table 4).
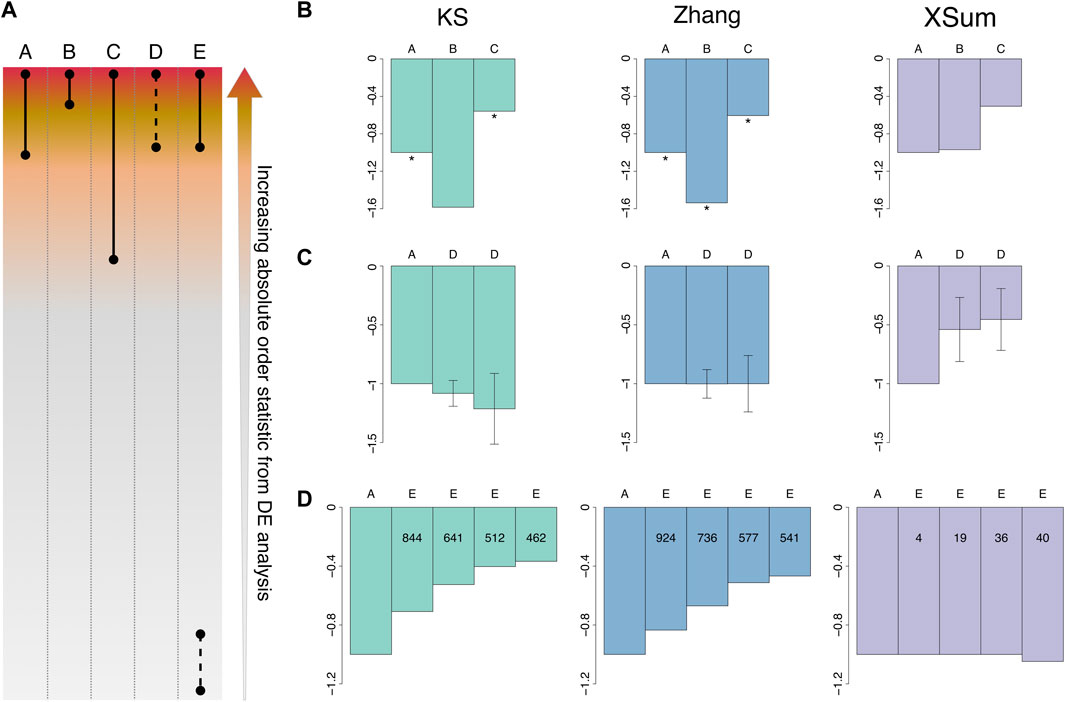
FIGURE 3. Signature quality in gastric cancer. (A) Schematic illustration of signature composition for Set A to E. Solid lines indicate all genes within the range are included in the query signature, dashed lines indicate a random subset of the genes in the range are included in the query signature. (B) Normalized scores by variation of gastric cancer signature quality. Scores are normalized to the baseline set A. Normalized scores for Set A, B and C. Size of set A: 119 genes, set B: 43, set C: 267. * indicates a significant score. (C) Normalized scores for set A and sets D. Size of set A: 119 genes, set D: 78 and 39 respectively. Error bars represent the standard deviation of the scores (n = 1000). (D) Normalized scores for set A and sets E. Size of set A: 119 genes, additional number of non-DEGs in set E: 24, 60, 119 and 148 respectively. Internal numerals indicate the number of significant quality-diluted signatures. Green: KS, blue: Zhang, purple: XSum.
Firstly, for the gastric cancer signatures, we queried them against a vorinostat signature in AGS (stomach cancer cell line, 0.12 µM for 24 h—ASG002_AGS_24H:G15). The gastric cancer signature was obtained from the Yonsei database consisting of 65 cancer and 19 normal gastric tissues (Cho et al., 2011). Another in vitro study performed by (Claerhout et al., 2011) indicated positive therapeutic effects of vorinostat towards gastric cancer; therefore we queried the vorinostat signature against varying signature qualities of gastric cancer. When the quality of gastric cancer signature increases from set A to set B, the drug-disease score becomes more negative for the KS and Zhang methods, indicating that these methods predicted a stronger drug-disease reversal signal. Conversely, as the quality decreases from set A to set C, the KS and Zhang scores become less negative. The Zhang scores obtained across the three sets were also significantly negative, affirming the strong inverse relationship between the vorinostat and gastric cancer signature. The trend of the XSum scores differs from the KS and Zhang methods, as they become less negative across set A, B and C, and the scores are insignificant across the three sets (Figure 3B).
For the analysis of set D for gastric cancer, we generated 1000 random subsets of set A signature. The size of these subset query signatures are approximately two thirds and one third that of set A. The score for each subset signature was calculated, and the median and standard deviation of these 1000 random subset signatures represent the change in drug-disease scores. As the size of the query signature decreases while maintaining the signature quality, only the median of the Zhang scores of set D remain similar to the baseline score of set A. The median KS score of set D is more negative than set A, while the median XSum score is less negative than set A (Figure 3C).
For low quality set E signatures of gastric cancer, we randomly selected noisy non-DEGs and appended them to the baseline set A signature. To investigate how drug-disease scores change as the query signature quality dilutes, we added an increasing number of noisy non-DEGs. The noisy non-DEGs were randomly chosen from the set of genes that are very lowly ranked (absolute order statistics <0.02) from the GC DEG analysis. For each dilution level, 1000 sets of randomly selected non-DEGs were added to set A signature, and the median drug-disease score obtained from these noisy signatures was determined. Additionally, the score significance for each of the noisy signatures was computed, to determine the number of noisy signatures that attained a significant score.
As the quality of the GC signature dilutes, the median score for KS and Zhang method becomes less negative, while the median XSum score remains generally constant. The KS and Zhang methods have notably more diluted signatures that attained a significant score, than XSum (Figure 3D), suggesting that they can better detect true signals in the query signature in spite of the noisy non-DEGs. The number of noisy signatures that attained a significant score also decreases steadily for the KS and Zhang methods, complying with the reduced performance as the query signature quality decreases.
Next, we varied the quality of the epilepsy signature (Hansen et al., 2014) by applying different order statistics cut-off, in a similar manner as the gastric cancer signature. We queried the aforementioned epilepsy signature against a sitagliptin signature treated in MCF7 cell line (0.125 µM, 24 h—REP.A006_MCF7_24H:D05). As the quality of the epilepsy signatures increases from set A to set B, the KS and Zhang scores become more negative, and remain significant; while the XSum scores do not change and are insignificant. As the quality decreases from set A to set C, the scores from all three methods become less negative (Supplementary Figure S1A). Again, these results demonstrate that the KS and Zhang methods produce a stronger drug-disease reversal signal when the query signature has a higher quality.
To obtain set D signatures of epilepsy, we generated 1000 random permutations of two thirds and one thirds of the baseline set A. We computed the score for each signature, as well as their median and standard deviation. As the query signature size decreases while maintaining its quality, only the Zhang score remained stable relative to the baseline score by set A. The median of KS scores becomes more negative, while the median of XSum scores becomes less negative (Supplementary Figure S1B).
For the analysis of low quality set E signatures of epilepsy, we added an increasing number of noisy non-DEGs of epilepsy to the baseline set A signature of epilepsy, to form the noisy query signature. At each quality dilution level, we generated 1000 such query signatures by randomly selecting noisy non-DEGs (order statistic <0.1), and computed their drug-disease score. The median KS and Zhang scores become less negative and tend towards zero as more noisy non-DEGs are included, and the number of significant scores also decreases steadily. However, for the XSum method, the median score at each dilution level remained relatively unchanged; and became less negative only when excessively diluted with noisy non-DEGs. Similar to the gastric cancer analysis, the KS and Zhang methods had more significant scores compared to XSum method, suggesting their better capability to detect true signals in the noisy epilepsy query signatures (Supplementary Figure S1C).
Overall, as the quality of disease signature varies, the KS and Zhang scores change with a similar trend as each other. The changes in the XSum scores generally differ from the other two methods. Table 6 summarizes the changes in the scores of all methods, as the quality of the query signature varies.
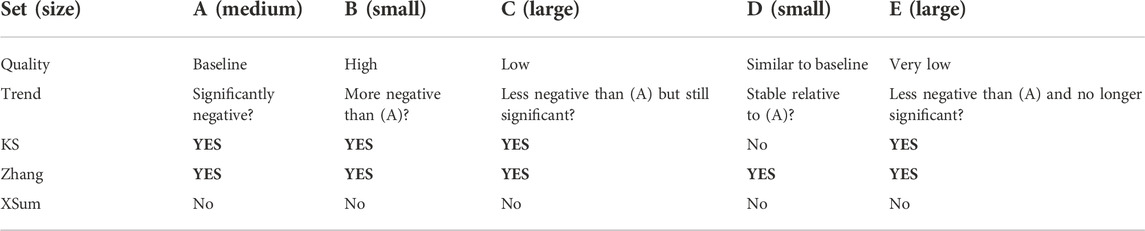
TABLE 6. Summary of changes in KS, Zhang and XSum scores with respect to disease signatures quality.
3.4 Correlation between unsimulated and simulated signatures
To further evaluate the robustness of each method to noise, we added noise to the gene expression values of 50 randomly selected level 5 signatures from the LINCS database (randSig), across four categorical levels (Figure 4A). These noise levels—termed low, medium, high and extreme—are tuned via two user-defined parameters,
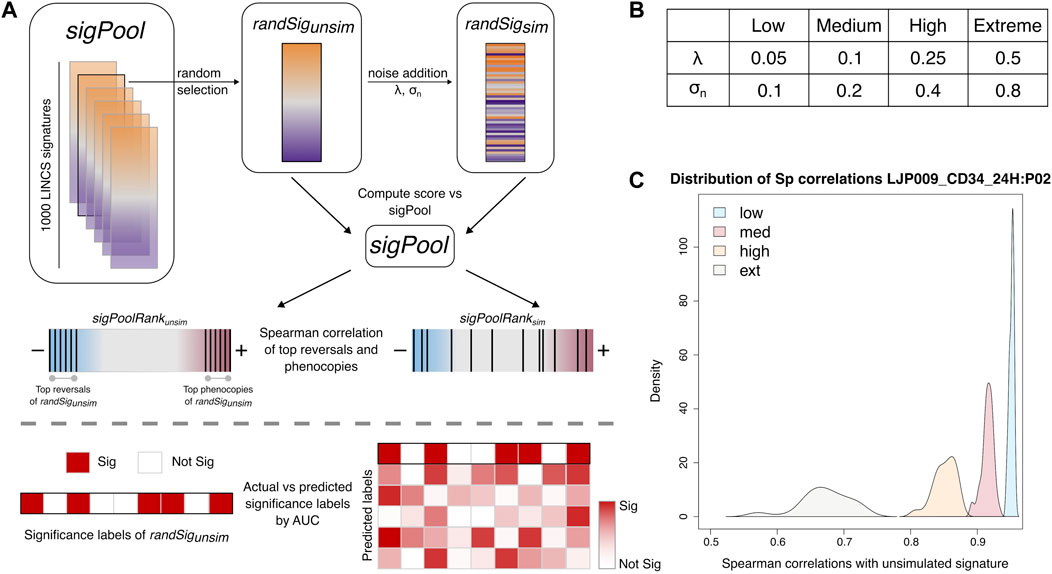
FIGURE 4. Simulation of noise in differential expression. (A) Schematic of noise addition and analyses of the noisy signatures. (B) Parameters used for noise simulation. (C) Representative density plots of Spearman correlations between simulated and unsimulated randSig at each noise level (n = 50).
The eventual amount of noise that has been added to each randSig can be estimated by the Spearman rank correlation of the gene expressions, between the unsimulated and simulated randSig. We found that the correlation between the unsimulated and low-noise simulated randSig is generally above 0.90. As noise level increases, the correlations decrease while the spread of the correlations become wider (Figure 4C). Together, this establishes that noise has been realistically introduced to LINCS data; and at low noise level, the expression profile of the simulated randSig is similar to that of the unsimulated randSig.
3.5 Comparison by Spearman correlation of simulated signature ranks
The ability of a scoring method to consistently prioritize drug signature in spite of noise within the data, gives an indication to its robustness to noise. To determine the extent to which drug prioritization has been altered after introduction of noise to randSig, we randomly selected a pool of signatures (sigPool) from the same cell line as randSig in LINCS. We computed the similarity scores between the unsimulated randSig and the signatures in sigPool, and used them to rank the signatures from the best phenocopy to the best reversal (sigPoolRankunsim). We then applied the same procedure to each of the 50 simulated randSig, to determine the signature ranks after the introduction of noise (sigPoolRanksim, Figure 4A).
The ranks of the top 10% scoring phenocopy and reversal signatures in sigPoolRankunsim were evaluated against its new ranks in sigPoolRanksim. Across noise levels, the correlations for both phenocopy and reversal signatures decrease as noise levels increase (Supplementary Figures S2A,B). This can be expected as a noisier simulated signature can result in a more drastic change in similarity score, and hence the eventual rank of the signatures. The correlations for phenocopy signatures were also generally higher than that of reversal signatures.
Across methods, the XSum has the most instances in which it attained the highest median correlation for phenocopy signatures, followed by the Zhang method (Figure 5A). For reversal signatures, the KS and Zhang methods have a comparable number of instances that attained the highest median correlation (Figure 5B). It is observed that for most randSigs, the method that attained the best correlation at low noise level also has the best correlation at higher noise levels. This suggests that the best performing method is highly dependent on the randSig of choice.
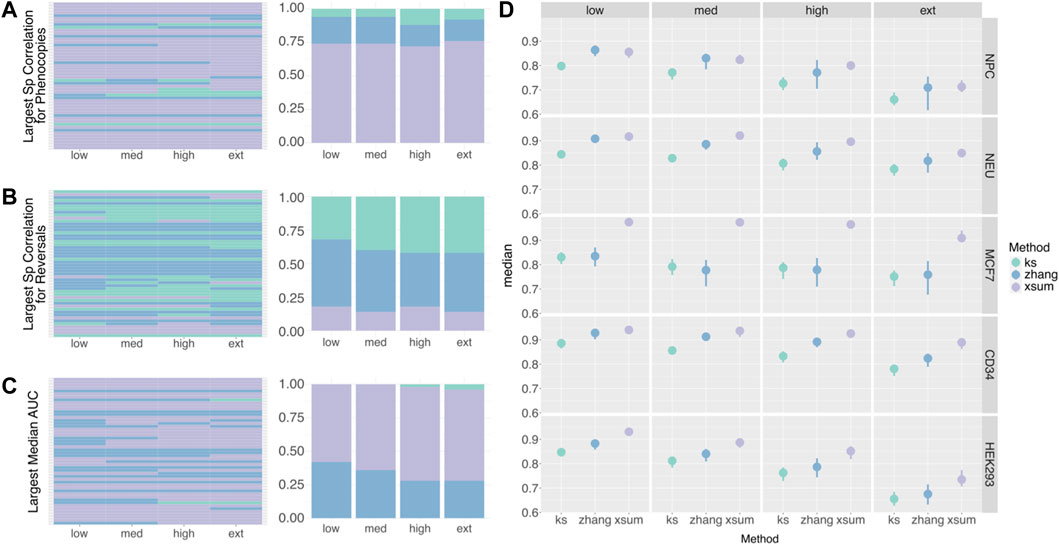
FIGURE 5. Spearman Correlation of Simulated Signature Ranks. (A) Heatmap (left) and proportion plot (right) indicating the method that attained the largest median correlation for phenocopy signature ranks. The rows of the heatmap represent the randSigs that were selected for noise simulation. (B) Heatmap (left) and proportion plot (right) indicating the method that attained the largest median correlation for reversal signature ranks. (C) Heatmap (left) and proportion plot (right) indicating the method that attained the largest median AUC. (D) Point range plot of the median AUC (n = 50) between the actual and predicted significance labels of randSig. The AUCs of a representative signature from each cell line was used to generate the plot. The complete plot for every randSig can be found in the Supplementary Materials. Green: KS, blue: Zhang, purple: XSum.
3.6 Comparison by AUC of score significance of simulated randSig
The second approach we employed to investigate the robustness of the methods, was to determine if the methods retain the significance labels after the inclusion of noise. We first determined the “actual” labels based on the score significance of the unsimulated randSig. Next, the score significance of the simulated randSigs are computed, to obtain the “predicted” labels. Finally, we compare the “actual” and “predicted” labels to compute the AUC by score significance. A larger AUC indicates that the method is able to significantly score a signature in spite of noise within the data.
Similar to the comparison by Spearman correlations, the XSum method has the most instances in which it attained the highest AUC (Figure 5C). The KS method attained the smallest AUC in 41 out of the 50 low-noise simulations, highlighting its inferiority when handling noisy data. As the amount of simulated noise increases from low to extreme, the AUC decreases slightly, indicating that the accuracy of the significance label drops for all three methods (Supplementary Figure S2C). The relative performance of the methods at low-noise level is also reflective of their relative performance at higher noise levels (Figure 5D; Supplementary Figure S2C).
4 Discussion
In this study, we evaluated the relative performance of three primary in silico drug repurposing methods—KS, Zhang and XSum. The methods are compared based on how sensitive they are to true positives, how their scores change with varying signature quality, and how robust they are to noisy DEG data. The analysis was based on gastric and colorectal cancer related signatures, as well as epilepsy signatures in the mouse model, queried against the most recent release of LINCS data. Besides disease signatures, the methods were also compared on their ability to quantify drug-drug similarity using the transcriptional signature of 17b-estradiol.
First, in comparing the methods based on their sensitivity, the XSum method generally has an inferior performance to the KS and Zhang methods. XSum method has the lowest number of significantly scored phenocopy or reversal signatures, as well as the smallest AUC by signature score across the three methods. Between KS and Zhang methods, the latter performed marginally better, notably in identifying phenocopy signatures of E2 and colorectal cancer treatment drug signatures. Our findings from the analysis of E2 signatures with the most recent version of LINCS data supports the results of an earlier study (Lin et al., 2020).
Next, we incorporated noise into the query signature by varying its DEG composition. This gives insight into how the drug-disease scores change with respect to the quality of query signatures. Although frequently acknowledged to be of great relevance, the influence of the query signature quality on drug-disease indication has been understudied (Zhang and Gant 2008; J. Cheng et al., 2014; Musa et al., 2018; Samart et al., 2021). On the basis that a higher quality query signature will produce a stronger drug-disease indication (and vice versa), the results show that the Zhang method best follows this expected change in drug-disease score. The quality of the query signature is approximated to the proportion of highly DEG, based on the order statistic of the genes in a DEG analysis. As the quality of the query signature increases, the magnitude of both KS and Zhang scores increase, suggesting both methods are able to predict a stronger drug-disease reversal potential. When the size of the query signature was reduced while retaining its quality level, only the Zhang scores remained unchanged. The query signature quality was then further diluted by including noisy non-DEGs; the KS and Zhang scores gradually decreased in magnitude and tend towards zero. These methods also detected true signals (true DEGs), within query signatures that have been noised with non-DEGs, better than the XSum method.
Lastly, we simulated noise in the query signature arising from the quantification of gene expressions. We used the Spearman rank correlation to evaluate if the scoring methods were able to replicate the drug prioritization ranks, before and after noise addition in the query signature. For the prioritization of phenocopy signatures, XSum had a superior performance over the other two methods, and attained the highest median correlation in nearly 75% of the randomized signatures (randSigs). For the prioritization of reversal signatures, there is no one method that consistently outperformed the other methods—all methods have a comparable number of randSigs in which it attained the best median correlation. We observed in the analysis of Spearman correlation for the top phenocopy and reversal, generally, the method that has the best performance at low noise, is also the best performing method at higher noise levels (78% and 72% of randSigs, for top phenocopy and reversal, respectively). This suggests that the best performing method is highly dependent on the randSig that has been chosen for simulation.
We further evaluated the ability of the methods to retain significant/non-significant labels after noise addition using the AUC metric. Among the three methods, XSum had the highest median AUC in 60% of the simulations, while the Zhang method had the highest median AUC in 40% of the simulations. There was no simulated signature in which the KS method had the best median AUC. A likely reasoning for the XSum method performing best in most instances, is that the composition of the extreme genes was perturbed to a lesser extent than the actual ranks of the genes. The results from this AUC analysis also show that the relative performance of the methods at low noise is generally reflective of their relative performance at higher noise levels. Together, for the analysis of noise simulation in the query signature, the performance of the Zhang and XSum methods outperforms the KS method, for the ranking of phenocopy signatures and AUC comparisons.
To date, there have been few studies benchmarking across these methods. A potential reason for this is the inconsistent terminologies used in the original publication of these methods, thus it has been a challenge to discern their algorithmic differences and evaluate these methods fairly. To this end, Samart et al., 2021 reconciled the methods using a set of standardized notations, which may pave the way for future benchmarking studies. Separately, Lin et al. (2020) implemented these methods in a user-friendly R package, “RCSM” (https://github.com/Jasonlinchina/RCSM). The inputs required by the package to calculate the connectivity score of these three methods are consistent, i.e., the list of up and down regulated genes in the query signature. As such, they were able to perform a comprehensive evaluation across the methods. In their study, they assessed six connectivity methods, including KS, Zhang and XSum, using the initial LINCS Phase I drug perturbation data. By comparing the methods using query signatures of singular fixed quality, they showed that the Zhang method has a superior accuracy and early retrieval performance for drug-drug prioritization. Our work builds upon that of Lin et al., 2020 by 1) reproducing their results using an updated LINCS Phase II data, 2) showing that the superior performance of the Zhang method is also true for drug-disease prioritization, 3) emphasizing the consistency of the Zhang method across varying query signature qualities, and 4) demonstrating the robustness of the XSum and Zhang methods to handle noise in the disease gene expression data.
Recently, another pair of independent benchmarking standards were developed to evaluate the drug retrieval performance of connectivity methods (Yang et al., 2022). For the AUC-based standard, the authors retrieved the IC50 data of several compounds and categorized them as “effective” (IC50 ≤ 10 µM) or “ineffective” (IC50 ≥ 10 µM) in the HepG2 cell line. This classification was used to calculate the AUC of the connectivity methods, and quantify their ability to distinguish between effective and ineffective compounds. For the KS statistics-based standard, a set of potential therapeutic agents for Hepatocellular carcinoma (HCC) was compiled based on clinical trial outcomes. This set of compounds was subsequently used to calculate the enrichment score of each connectivity method using a KS test. Despite its novel benchmarking approach, this study excluded the Zhang method from their evaluation. Yang et al., 2022 showed that XSum had a better drug retrieval performance compared to KS, contrary to our findings in this study. Interestingly, the authors pointed out that topN = 150 is an optimal parameter for the XSum method, while a query signature size of around 100 is applicable for drug repurposing. These parameters, which were incidentally used in this study, were optimized by iteratively increasing topN and the fold-change threshold of the query signature.
In the same study, the authors investigated the performance and accuracy of these connectivity methods with respect to gene expression variability in the drug signatures (Yang et al., 2022). They focused on the effects of cell type specificity on performance and, as a result, suggest that it is preferable to query drug signatures that are derived from disease-relevant cell lines. Doing so minimizes drug signature noise arising due to drug-cell line specificity, priming the methods to have a higher accuracy in drug retrieval.
To the best of our knowledge, there are no previous studies benchmarking the connectivity methods based on variation in query signature quality nor presence of noise in the disease gene expression data. These aspects are crucial for in silico drug repurposing as they affect the composition of the query signature, and eventually the drug-disease indication. As the criteria of a DEG is not definitive, genes in the neighborhood of the threshold may be included or excluded from the query signature. Likewise, noise in the gene expression data may cause a handful of genes to be marginally included or excluded as a DEG. Hence, we surmise that it is favorable that a connectivity method retains the drug-disease indication and drug prioritization, despite minor alterations in composition of the query signature.
Considering all the comparison metrics, the performances of the three methods are summarized in Figure 6. Our findings suggest that the Zhang method may be most suitable, among the three methods, to predict drug-disease indications with LINCS data. Besides displaying good sensitivity to significantly score true positive signatures, our results show that the Zhang method is robust to noisy query signatures when the composition of DEGs are varied. In terms of noise related to the quantification of gene expressions, the XSum method had most instances in which it performed best, but the Zhang method did not trail far behind. There may be additional factors in the randomly chosen signatures that affect which method performs best with the addition of noise. While out of the scope of this work here, future studies should investigate the qualities of a signature which may dictate the optimal approach.
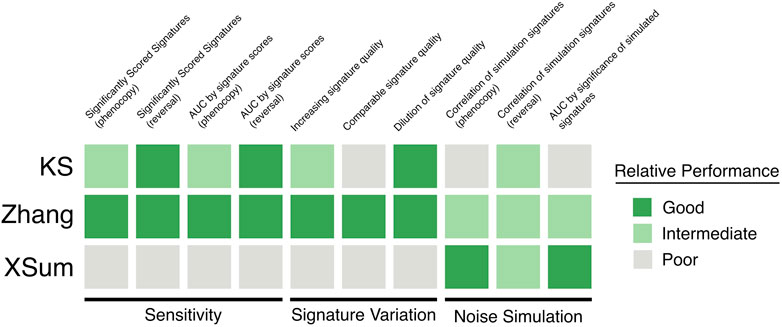
FIGURE 6. Summary of the relative performance of the three in silico drug repurposing algorithms. Bright green: good, dull green: intermediate, grey: poor.
The connectivity methods evaluated in our work are based on the principles of pattern matching between two transcriptional signatures, to understand the association between a drug and a disease. However, the biology of complex diseases is rarely due to transcriptional differences alone, and incorporating other types of biological data may provide researchers a holistic understanding of the disease and its drug discovery (Musa et al., 2018). In addition to querying CMap, Mousavi et al. (2020) used the DEGs from COVID-19 patients to perform functional enrichment and protein-protein interaction (PPI) analysis. Their analysis revealed that several chemokine proteins were densely connected, and the upregulated genes were enriched in cytokine-mediated signaling pathways. These insights can be used to guide the identification of potential therapeutic candidates for COVID-19. Another means to account for the molecular interactions in the diseased state is to integrate disease DEGs with PPI networks to construct functional gene modules, which are then used to query the CMap database (Chung et al., 2014; Chen and Zhou 2021). This approach has been shown to have higher accuracy and sensitivity, especially in identifying anti-cancer drugs. Using a similar pattern matching strategy, Wen, Liu, and Zhang 2021 proposed another novel drug repurposing framework that is based on the restoration of clinical variables instead of gene expressions. Unlike CMap, which describes the drug effect at a cellular level, the use of clinical outcomes directly reveals the effects of the drug in patients. This approach may circumvent downstream translational problems, and hence it may be advantageous to apply it complementary to the findings from the CMap query.
Notwithstanding, our work focused on the robustness of current connectivity methods to noise for the purpose of in silico transcriptional drug repurposing. As noise was introduced to query signatures from the LINCS database in this study, the noise-addition principles were relevant to the LINCS L1000 array platform. It will be ideal to perform a similar noise simulation study to query signatures obtained from RNA-seq platforms, to understand if the findings of this study extend to noisy RNA-seq derived signatures. Further, this study encompasses two different disease types (cancer and epilepsy) and their related cell lines; it remains to be explored how the performance of the methods may be altered for in silico drug repurposing in other disease types.
5 Conclusion
This study presents an assessment of three primary in silico drug repurposing methods—KS, Zhang and XSum. These methods are evaluated based on their sensitivity, and performance as query signature quality changes. The Zhang method displays superior sensitivity, especially for phenocopy signatures. For reversal signatures, the KS and Zhang methods have comparable sensitivity. When the quality of query signature is altered by filtering for only top DEGs or by including non-DEGs, the Zhang scores performed as expected with respect to the query size and strength. When the quality of query signature is altered by noising gene expression, the XSum method, followed by the Zhang, best retains information from the original randomly selected signature. The results also suggest that the method which is most robust to noisy gene expression data, may be dependent on additional factors in the original signature. For the signatures used in this study, the XSum and Zhang methods seem to fare better than the KS method.
Together, this work provides guidelines to understand the suitability of three connectivity methods for in silico drug repurposing. It proposes a novel framework to study how connectivity scores are affected by query signature quality, an aspect of in silico drug repurposing that is widely recognized yet understudied.
Data availability statement
Publicly available datasets were analyzed in this study. The LINCS data was retrieved from the CMap LINCS Resource 2020 (URL: https://clue.io/data/CMap2020#LINCS2020). The epilepsy signature was retrieved from the Gene Expression Omnibus (GEO) database repository, accession number GSE72402 (URL: https://www.ncbi.nlm.nih.gov/geo/query/acc.cgi?acc=GSE72402), Supplementary File. The gene expression data from gastric cancer was retrieved from GEO, accession number GSE13861 (URL: https://www.ncbi.nlm.nih.gov/geo/query/acc.cgi?acc=GSE13861). The processed colorectal cancer signature was retrieved from Supplementary Table S2 of Jorissen et al. (2009) (URL: https://doi.org/10.1158/1078-0432.CCR-09-1431). The 17b-estradiol signature was obtained from Supplementary Material 1132939s_sigS2 of Lamb et al. (2006) (URL: https://doi.org/10.1126/science.1132939).
Author contributions
NT and SRL conceived and designed the project. NT performed and SRL supervised the analysis. NT and SRL wrote the manuscript and all authors approved the final manuscript.
Funding
This research is supported by the Lee Kong Chian School of Medicine, Nanyang Technological University Singapore Nanyang Assistant Professorship Start-Up Grant.
Acknowledgments
We would like to acknowledge the members of the Integrative Biology of Disease group at the Lee Kong Chian School of Medicine for their helpful comments and suggestions on this work. The computational work for this article was partially performed on resources of the National Supercomputing Centre, Singapore (https://www.nscc.sg).
Conflict of interest
The authors declare that the research was conducted in the absence of any commercial or financial relationships that could be construed as a potential conflict of interest.
Publisher’s note
All claims expressed in this article are solely those of the authors and do not necessarily represent those of their affiliated organizations, or those of the publisher, the editors and the reviewers. Any product that may be evaluated in this article, or claim that may be made by its manufacturer, is not guaranteed or endorsed by the publisher.
Supplementary material
The Supplementary Material for this article can be found online at: https://www.frontiersin.org/articles/10.3389/fsysb.2022.1050730/full#supplementary-material
References
Abou-Khalil, B. (2008). Levetiracetam in the treatment of epilepsy. Neuropsychiatric Dis. Treat. 4 (3), 507–523. doi:10.2147/NDT.S2937
Arai, H., Battaglin, F., Wang, J., Lo, J. H., Soni, S., Zhang, W., et al. (2019). Molecular insight of Regorafenib treatment for colorectal cancer. Cancer Treat. Rev. 81, 101912. doi:10.1016/j.ctrv.2019.101912
Breckenridge, A., and Jacob, R. (2019). Overcoming the Legal and regulatory Barriers to drug repurposing. Nat. Rev. Drug Discov. 18 (1), 1–2. doi:10.1038/nrd.2018.92
Chen, H.-G., and Zhou, X.-H. (2021). Mnbdr: A module network based method for drug repositioning. Genes 12 (1), 25. doi:10.3390/genes12010025
Cheng, H.-W., Liang, Y.-H., Kuo, Y.-L., Chuu, C.-P., Lin, C.-Y., Lee, M.-H., et al. (2015). Identification of Thioridazine, an Antipsychotic drug, as an Antiglioblastoma and Anticancer Stem cell agent using public gene expression data. Cell Death Dis. 6 (5), e1753. doi:10.1038/cddis.2015.77
Cheng, J., and Yang, L. (2013). “Comparing gene expression similarity metrics for connectivity map,” in 2013 IEEE International Conference on Bioinformatics and Biomedicine, Shanghai, China, December 2013 (IEEE), 165–170. doi:10.1109/BIBM.2013.6732481
Cheng, J., Yang, L., Kumar, V., and Agarwal, P. (2014). Systematic evaluation of connectivity map for disease indications. Genome Med. 6 (12), 540. doi:10.1186/s13073-014-0095-1
Cho, J. Y., Lim, J. Y., Cheong, J. H., Park, Y.-Y., Yoon, S.-L., Soo, M. K., et al. (2011). Gene expression signature–based Prognostic Risk score in gastric cancer. Clin. Cancer Res. 17 (7), 1850–1857. doi:10.1158/1078-0432.CCR-10-2180
Chung, F.-H., Chiang, Y.-R., Tseng, A.-L., Sung, Y.-C., Lu, J., Huang, M.-C., et al. (2014). Functional module connectivity map (FMCM): A framework for Searching repurposed drug compounds for systems treatment of cancer and an application to colorectal Adenocarcinoma. PLOS ONE 9 (1), e86299. doi:10.1371/journal.pone.0086299
Claerhout, S., Lim, J. Y., Choi, W., Park, Y.-Y., Kim, K. H., Kim, S.-B., et al. (2011). Gene expression signature analysis Identifies vorinostat as a candidate Therapy for gastric cancer. PLOS ONE 6 (9), e24662. doi:10.1371/journal.pone.0024662
CMap LINCS (2020). Expanded CMap LINCS resource 2020. Available at https://clue.io/data/CMap2020#LINCS2020 (Accessed November 23, 2021).
Delahaye-Duriez, A., Srivastava, P., Shkura, K., Langley, S. R., Laaniste, L., Moreno-Moral, A., et al. (2016). Rare and common Epilepsies Converge on a Shared gene regulatory network providing Opportunities for novel Antiepileptic drug discovery. Genome Biol. 17 (1), 245. doi:10.1186/s13059-016-1097-7
Dembélé, D. (2013). A Flexible microarray data simulation model. Microarrays 2 (2), 115–130. doi:10.3390/microarrays2020115
Dönertaş, H. M., Fuentealba Valenzuela, M., Partridge, L., and Thornton, J. M. (2018). Gene expression-based drug repurposing to target aging. Aging Cell 17 (5), e12819. doi:10.1111/acel.12819
Dudley, J. T., Sirota, M., Shenoy, M., Pai, R. K., Roedder, S., Chiang, A. P., et al. (2011). Computational repositioning of the Anticonvulsant Topiramate for inflammatory bowel disease. Sci. Transl. Med. 3 (96), 96ra76. doi:10.1126/scitranslmed.3002648
Durinck, S., Spellman, P. T., Birney, E., and Huber, W. (2009). Mapping Identifiers for the integration of Genomic datasets with the R/Bioconductor package BiomaRt. Nat. Protoc. 4 (8), 1184–1191. doi:10.1038/nprot.2009.97
Fortney, K., Griesman, J., Kotlyar, M., Pastrello, C., Angeli, M., Sound-Tsao, M., et al. (2015). Prioritizing therapeutics for Lung cancer: An integrative Meta-analysis of cancer gene signatures and Chemogenomic data. PLoS Comput. Biol. 11 (3), e1004068. doi:10.1371/journal.pcbi.1004068
Frasor, J., Stossi, F., Danes, J. M., Komm, B., Richard Lyttle, C., and Katzenellenbogen, B. S. (2004). Selective estrogen receptor Modulators: Discrimination of agonistic versus antagonistic Activities by gene expression profiling in breast cancer cells. Cancer Res. 64 (4), 1522–1533. doi:10.1158/0008-5472.CAN-03-3326
Gagnon, J.-F., Bernard, O., Villeneuve, L., Têtu, B., and Guillemette, C. (2006). Irinotecan Inactivation is Modulated by Epigenetic Silencing of UGT1A1 in colon cancer. Clin. Cancer Res. 12 (6), 1850–1858. doi:10.1158/1078-0432.CCR-05-2130
Gierbolini, J., Giarratano, M., and Benbadis, S. R. (2016). Carbamazepine-related Antiepileptic drugs for the treatment of epilepsy - a Comparative Review. Expert Opin. Pharmacother. 17 (7), 885–888. doi:10.1517/14656566.2016.1168399
Guerrini, R., and Parmeggiani, L. (2006). Topiramate and its clinical applications in epilepsy. Expert Opin. Pharmacother. 7 (6), 811–823. doi:10.1517/14656566.7.6.811
Hansen, K. F., Sakamoto, K., Pelz, C., Impey, S., and Obrietan, K. (2014). Profiling status epilepticus-induced changes in Hippocampal RNA expression using high-Throughput RNA Sequencing. Sci. Rep. 4 (1), 6930. doi:10.1038/srep06930
Jin, L., Tu, J., Jia, J., An, W., Tan, H., Cui, Q., et al. (2014). Drug-repurposing identified the combination of Trolox C and Cytisine for the treatment of type 2 diabetes. J. Transl. Med. 12 (1), 153. doi:10.1186/1479-5876-12-153
Jorissen, R. N., Gibbs, P., Christie, M., Prakash, S., Lipton, L., Desai, J., et al. (2009). Metastasis-associated gene expression changes predict poor outcomes in patients with Dukes stage B and C colorectal cancer. Clin. Cancer Res. 15 (24), 7642–7651. doi:10.1158/1078-0432.CCR-09-1431
Kunkel, S. D., Suneja, M., Ebert, S. M., Bongers, K. S., Fox, D. K., Malmberg, S. E., et al. (2011). MRNA expression signatures of human skeletal muscle atrophy identify a natural compound that increases muscle Mass. Cell Metab. 13 (6), 627–638. doi:10.1016/j.cmet.2011.03.020
Lamb, J., Crawford, E. D., Peck, D., Modell, J. W., Blat, I. C., Wrobel, M. J., et al. (2006). The connectivity map: Using gene-expression signatures to Connect small molecules, genes, and disease. Science 313 (5795), 1929–1935. doi:10.1126/science.1132939
Lim, S. M., Lim, J. Y., and Cho, J. Y. (2014). Targeted Therapy in gastric cancer: Personalizing cancer treatment based on patient Genome. World J. Gastroenterol. 20 (8), 2042–2050. doi:10.3748/wjg.v20.i8.2042
Lin, K., Lu, L., Dai, Y., Wang, H., Teng, S., Bao, X., et al. (2020). A comprehensive evaluation of connectivity methods for L1000 data. Brief. Bioinform. 21 (6), 2194–2205. doi:10.1093/bib/bbz129
Liu, T.-P., Hsieh, Y.-Y., Chou, C.-J., and Yang, P.-M. (2018). Systematic Polypharmacology and drug repurposing via an integrated L1000-based connectivity map database mining. R. Soc. Open Sci. 5 (11), 181321. doi:10.1098/rsos.181321
Mirza, N., Sills, G. J., Pirmohamed, M., and Marson, A. G. (2017). Identifying new Antiepileptic drugs through Genomics-based drug repurposing. Hum. Mol. Genet. 26 (3), 527–537. doi:10.1093/hmg/ddw410
Mousavi, S. Z., Rahmanian, M., and Sami, A. (2020). A connectivity map-based drug repurposing study and integrative analysis of transcriptomic profiling of SARS-CoV-2 Infection. Infect. Genet. Evol. 86, 104610. doi:10.1016/j.meegid.2020.104610
Musa, A., Ghoraie, L. S., Zhang, S-D., Glazko, G., Yli-Harja, O., Dehmer, M., et al. (2018). A Review of connectivity map and computational Approaches in Pharmacogenomics. Brief. Bioinform. 19 (3), 506–523. doi:10.1093/bib/bbw112
Pushpakom, S., Iorio, F., Eyers, P. A., Jane Escott, K., Hopper, S., Wells, A., et al. (2019). Drug repurposing: Progress, challenges and Recommendations. Nat. Rev. Drug Discov. 18 (1), 41–58. doi:10.1038/nrd.2018.168
Rho, S. B., Kim, B-R., and Kang, S. (2011). A gene signature-based approach Identifies Thioridazine as an inhibitor of Phosphatidylinositol-3′-Kinase (PI3K)/AKT Pathway in Ovarian cancer cells. Gynecol. Oncol. 120 (1), 121–127. doi:10.1016/j.ygyno.2010.10.003
Samart, K., Tuyishime, P., Krishnan, A., and Ravi, J. (2021). Reconciling multiple connectivity scores for drug repurposing. Brief. Bioinform. 22 (6), bbab161. doi:10.1093/bib/bbab161)
Smyth, G. K. (2004). Linear models and empirical Bayes methods for assessing differential expression in microarray experiments. Stat. Appl. Genet. Mol. Biol. 3 (1), Article3. doi:10.2202/1544-6115.1027
Subramanian, A., Narayan, R., Steven, M. C., Peck, D. D., Natoli, T. E., Lu, X., et al. (2017). A next generation connectivity map: L1000 platform and the first 1, 000, 000 profiles. Cell 171 (6), 1437–1452. doi:10.1016/j.cell.2017.10.049
Taubes, A., Nova, P., Zalocusky, K. A., Kosti, I., Bicak, M., Zilberter, M. Y., et al. (2021). Experimental and Real-World evidence supporting the computational repurposing of Bumetanide for APOE4-related Alzheimer’s disease. Nat. Aging 1 (10), 932–947. doi:10.1038/s43587-021-00122-7
Twelves, C., Wong, A., Nowacki, M. P., Abt, M., Burris, H., Carrato, A., et al. (2005). Capecitabine as Adjuvant treatment for stage III colon cancer. N. Engl. J. Med. 352 (26), 2696–2704. doi:10.1056/NEJMoa043116
van Noort, V., Schölch, S., Iskar, M., Zeller, G., Ostertag, K., Schweitzer, C., et al. (2014). Novel drug candidates for the treatment of metastatic colorectal cancer through Global inverse gene-expression profiling. Cancer Res. 74 (20), 5690–5699. doi:10.1158/0008-5472.CAN-13-3540
Wagner, A., Cohen, N., Kelder, T., Amit, U., Liebman, E., Steinberg, D. M., et al. (2015). Drugs that reverse disease transcriptomic signatures are more effective in a mouse model of Dyslipidemia. Mol. Syst. Biol. 11 (3), 791. doi:10.15252/msb.20145486
Wen, Q., Liu, R., and Zhang, P. (2021). Clinical connectivity map for drug repurposing: Using Laboratory results to Bridge drugs and diseases. BMC Med. Inf. Decis. Mak. 21 (8), 263. doi:10.1186/s12911-021-01617-4
Yang, C., Zhang, H., Chen, M., Wang, S., Qian, R., Zhang, L., et al. (2022). A survey of optimal strategy for signature-based drug repositioning and an application to liver cancer. ELife 11, e71880. doi:10.7554/eLife.71880
Yasam, V. R., Jakki, S. L., Senthil, V., Eswaramoorthy, M., Shanmuganathan, S., Arjunan, K., et al. (2016). A Pharmacological Overview of Lamotrigine for the treatment of epilepsy. Expert Rev. Clin. Pharmacol. 9 (12), 1533–1546. doi:10.1080/17512433.2016.1254041
Keywords: drug repurposing, transcriptomics, in silico, benchmark, connectivity score
Citation: Tham N and Langley SR (2022) Evaluating the robustness of connectivity methods to noise for in silico drug repurposing studies. Front. Syst. Biol. 2:1050730. doi: 10.3389/fsysb.2022.1050730
Received: 22 September 2022; Accepted: 21 November 2022;
Published: 20 December 2022.
Edited by:
Seth Schobel, Henry M. Jackson Foundation for the Advancement of Military Medicine (HJF), United StatesReviewed by:
Thanh Minh Nguyen, University of Alabama at Birmingham, United StatesPaola Lecca, Free University of Bozen-Bolzano, Italy
Copyright © 2022 Tham and Langley. This is an open-access article distributed under the terms of the Creative Commons Attribution License (CC BY). The use, distribution or reproduction in other forums is permitted, provided the original author(s) and the copyright owner(s) are credited and that the original publication in this journal is cited, in accordance with accepted academic practice. No use, distribution or reproduction is permitted which does not comply with these terms.
*Correspondence: Sarah R. Langley, c2FyYWgubGFuZ2xleUBudHUuZWR1LnNn