 Elena Merino Tejero1
 Qirong Mao1
 Danial Lashgari1
 Rodrigo García-Valiente1
 Philippe A. Robert2†
 Michael Meyer-Hermann2,3
 María Rodríguez Martínez4
 Jeroen E. J. Guikema5
 Huub H. C. Hoefsloot6
 Antoine H. C. van Kampen1,6*
- 1Bioinformatics Laboratory, Epidemiology and Data Science, Amsterdam Public Health Research Institute, Amsterdam Institute for Infection and Immunity Amsterdam, Amsterdam, Netherlands
- 2Department for Systems Immunology and Braunschweig Integrated Centre of Systems Biology, Helmholtz Centre for Infection Research, Braunschweig, Germany
- 3Institute for Biochemistry, Biotechnology and Bioinformatics, Technische Universität Braunschweig, Braunschweig, Germany
- 4IBM Research Europe, Cognitive and Industry Solutions, Zürich, Switzerland
- 5Department of Pathology, Lymphoma and Myeloma Center Amsterdam (LYMMCARE), Amsterdam University Medical Centers, Amsterdam, Netherlands
- 6Biosystems Data Analysis, Swammerdam Institute for Life Sciences, University of Amsterdam, Amsterdam, Netherlands
Diffuse large B-cell lymphoma is the most common subtype of non-Hodgkin’s lymphoma. It is a germinal center (GC)–derived, aggressive, and heterogeneous disease. Several transcription factors and signaling pathways that play a central role in the progression of the GC reaction and B-cell differentiation have been shown to play an oncogenic role in diffuse large B-cell lymphoma. B-cell lymphoma 6 (BCL6) is a transcriptional repressor that induces the GC B-cell phenotype and blocks plasma cell (PC) differentiation, while interferon regulatory factor 4 (IRF4) and B lymphocyte-induced maturation protein 1 (BLIMP1), a transcriptional promoter, both mediate PC differentiation and exit from the GC (1). Computational models are useful alternatives to trial-and-error experimental investigation. Ordinary differential equation (ODE) models have been used to study different known mechanisms of lymphomagenesis and suggest candidate tumorigenic alterations (2). Furthermore, multi-scale models (MSMs) have been used to study the role of cellular and molecular mechanisms involved in tumor growth (3–6). In this study, we used an existing MSM of PC differentiation in the GC to simulate eight different models with several candidate genetic alterations of the BCL6-IRF4-BLIMP1 regulatory network that lead to transcription factor deregulation and could explain the onset of diffuse large B-cell lymphoma and recapitulate the GC dynamics observed in such conditions. We observed that models with loss of BLIMP1 function (BLIMPloss and BLIMPlossIRFinc) result in an accumulation of B cells in the GC and a block of PC differentiation and thus correctly recapitulate the observed GC and transcription factor dynamics. Models with constitutive activation of the nuclear factor kappa-light-chain-enhancer of activated B-cell (NF-kB) pathway alone and in codominance or co-expression with the enforced BCL6 expression (IRFinc and BCLincIRFinc) result in a decrease of GC B cells and unaltered PC production at early stages of the GC reaction, as observed experimentally. Interestingly, we also found that in IRFinc and BCLincIRFinc models, an increase in PC production could happen at later stages of the GC reaction. Nevertheless, models with enforced BCL6 expression (BCLauto and BCLinc) result in an expansion of GC B cell population and a block in the PC production that was not observed experimentally. Finally, models with loss of IRF4- and BLIMP1-mediated silencing of BCL6 (IRFsil and BLIMPsil) did not affect GC and transcription factor dynamics.
Introduction
During affinity maturation in the GC, B cells undergo rounds of proliferation, somatic hypermutations, and selections to produce memory B cells (MBCs) and antibody-secreting PCs (De Silva and Klein, 2015). The GC can be categorized into two main zones. A dark zone (DZ) in which B cells at a centroblast (CBs) state rapidly proliferate and accumulate somatic hypermutations in the genes that encode their B-cell receptor (BcR). The light zone (LZ) is characterized by the presence of B cells at a centrocyte (CCs) state, follicular dendritic cells (FDCs) that present the antigen (Ag) in the form of immune complexes in their membrane (Allen et al., 2007), and T follicular helper cells. In the DZ, suppression of the DNA damage response and B-cell proliferation checkpoints increases the risk of malignant transformations that can lead to B-cell lymphomas (Mlynarczyk et al., 2019). Diffuse large B-cell lymphoma, the most common subtype of non-Hodgkin’s lymphoma, is a GC-derived, aggressive, and heterogeneous disease. Genes related to different stages of GC B-cell differentiation and activation are differentially expressed among diffuse large B-cell lymphomas (Alizadeh et al., 2000). Based on gene expression profiling, two subtypes have been defined: GC B-cell and active B-cell (Hu et al., 2013). Active B-cell subtype patients have a poorer prognosis and survival rate than those with the GC B-cell subtype (Miyazaki, 2016). Nevertheless, it is still unclear which genes distinguishing both subtypes are the most important determinants of chemotherapy responsiveness (Alizadeh et al., 2000).
Several transcription factors play a significant role in the progression of the GC reaction. BCL6 is a transcriptional repressor that induces the GC B-cell phenotype and is involved in B-cell survival, proliferation, DNA damage, and blocking PC differentiation. High expression levels of IRF4 and BLIMP1 induce PC differentiation and promote exit from the GC (Mlynarczyk et al., 2019). These are regulated by upstream signals emanating from the B-cell receptor (BcR) and cluster of differentiation 40 (CD40). In particular, the NF-kB pathway, induced by CD40, is involved in the induction of MBC and PC differentiation in the GC light zone (LZ).
The abovementioned transcription factors have also been shown to play an oncogenic role in diffuse large B-cell lymphoma (Mlynarczyk et al., 2019). BCL6 chromosomal translocations have been found more frequently in the active B-cell subtype, leading to a constitutive BCL6 overexpression (Zhang et al., 2015). Furthermore, a majority of active B-cell subtypes fail to express a competent BLIMP1 despite the normal IRF4 expression (Pasqualucci et al., 2006). The loss of IRF4- and BLIMP1-mediated transcriptional silencing of BCL6 have been found in a subset of diffuse large B-cell lymphomas (Saito et al., 2007). Nevertheless, the effect on the GC B-cell dynamics and PC production was not studied. Furthermore, to the best of our knowledge, the effect of diffuse large B-cell lymphoma genetic alterations on MBC production during the GC reaction has not been studied. Signaling pathways have also been linked to diffuse large B-cell lymphoma development, such as constitutive activation of the NF-kB pathway, which is the essential hallmark of the active B-cell subtype (Pasqualucci et al., 2011). Finally, combinations of genetic alterations such as mutations in the NF-kB pathway and BCL6 chromosomal translocations or BLIMP1 deletion worsen diffuse large B-cell lymphoma prognosis (Calado et al., 2010; Zhang et al., 2015).
Computational models are useful alternatives to trial-and-error experimental studies. Martínez et al. (2012) presented an ODE model of a gene regulatory network (GRN) that integrated signals from BcR and CD40. They induced perturbations in the model to study different known mechanisms of lymphomagenesis and suggested candidate tumorigenic alterations. Nevertheless, only the molecular level, not the cellular dynamics, was included in this model. Furthermore, MSMs have been used to study the role of cellular and molecular mechanisms involved in tumor growth (Yeh et al., 2017; Roy et al., 2019; Versypt, 2021). A recent study used the MSM to predict the effectiveness of various therapies for diffuse large B-cell lymphoma (Du et al., 2017). In the latter study, a detailed kinetic model of the BcR signaling network was used. Nevertheless, only its effect on in vitro tumor growth was analyzed.
In this study, we used an existing MSM of PC differentiation in the GC to simulate eight different models with candidate genetic alterations of the BCL6-IRF4-BLIMP1 regulatory network that could explain the onset of diffuse large B-cell lymphoma, in order to recapitulate the GC dynamics observed in such conditions (Merino Tejero et al., 2020). While most of the abovementioned genetic alterations are based on the previous work carried out by Martínez et al. (2012), our model provides additional insights by studying the effect of these alterations at the cellular and GC level. The main cellular processes that take place in our MSM are simulated through agent-based modeling based on a large body of in vitro and in vivo experiments (Meyer-Hermann et al., 2012). Nevertheless, only the differentiation toward PC is determined by the GRN, which integrates signals from BcR and CD40. We found that models with loss of BLIMP1 function (BLIMPloss and BLIMPlossIRFinc) result in an accumulation of B cells in the GC and a block of PC differentiation and thus correctly recapitulate the observed GC and transcription factor dynamics. Models with constitutive activation of the NF-kB pathway alone and in codominance with enforced BCL6 expression (IRFinc and BCLincIRFinc) result in a decrease of GC B cells and unaltered PC production at early stages of the GC reaction, as observed experimentally. Interestingly, we also found that in IRFinc and BCLincIRFinc models, an increase in PC production could happen at later stages of the GC reaction. Nevertheless, models with enforced BCL6 expression (BCLauto and BCLinc) result in an overgrowth of GC B cells and a block in the PC production that was not observed experimentally. While no data have been found to validate models with loss of IRF4- and BLIMP1-mediated silencing of BCL6 (IRFsil and BLIMPsil), our findings suggest that such alterations do not affect GC and transcription factor dynamics.
Transcription factors with restricted patterns of expression are attractive targets for therapy. BCL6 inhibitors have been used to block the BCL6 activity and inhibit the growth of certain diffuse large B-cell lymphomas (Polo et al., 2007). NF-kB inhibitors have also demonstrated to selectively target active B-cell-like diffuse large B-cell lymphomas. Finally, small-molecule inhibitors of BcR downstream pathways are the most promising agents in treating diffuse large B-cell lymphomas and other malignancies (Roschewski et al., 2012). Further identification and study of the molecular mechanisms involved in the pathogenesis of diffuse large B-cell lymphoma tumors are crucial for developing treatments. However, for cancer, it is important to determine how genetic alterations and, hence, changes in the state of molecular pathways affect cellular events such as proliferation, apoptosis, and differentiation. MSMs, as presented in this work, can help determine the molecular and cellular relationships.
Methods
Multi-Scale Model
To study the molecular mechanisms behind the development of diffuse large B-cell lymphoma, we used an already existing MSM of PC differentiation during the GC reaction (Merino Tejero et al., 2020). At the cellular level, we used an agent-based model of the GC reaction based on an existing model (Meyer-Hermann et al., 2012). The agent-based model runs for 21 days (504 h) at a time resolution of 0.002 h (7.2 s) (Supplementary Table 1). Each cell is represented in a three-dimensional space representing the GC and undergoes different processes depending on their state. B cells at a CB state divide, undergo somatic hypermutations, and differentiate in the DZ, while at a CC state, they undergo selection in the LZ Figure 1. In the LZ, CCs interact and collect Ag from follicular dendritic cells (FDCs). CCs may further interact and compete for T follicular helper cell signals. Both processes are dependent on the affinity of the BcR for the Ag. Selected CCs recycle back to the DZ as CBs that carry internalized Ag. Recycled CBs divide in an asymmetric manner in 72% of the cases where all Ag and transcription factors segregate toward one of the daughter CBs. In the remaining 28% of divisions, Ag and transcription factors are divided symmetrically (Barnett et al., 2012; Thaunat et al., 2012). This was based on a recent study that showed coupled Ag and transcription factor asymmetric division with a large segregation between daughter B cells recapitulate the GC output transition (temporal switch) from MBCs to PCs and a DZ-to-LZ ratio, which is the ratio of CBs to non-apoptotic CCs present in the GC. After division, CBs may exit the GC as an output cell or remain in the GC for further rounds of selection.
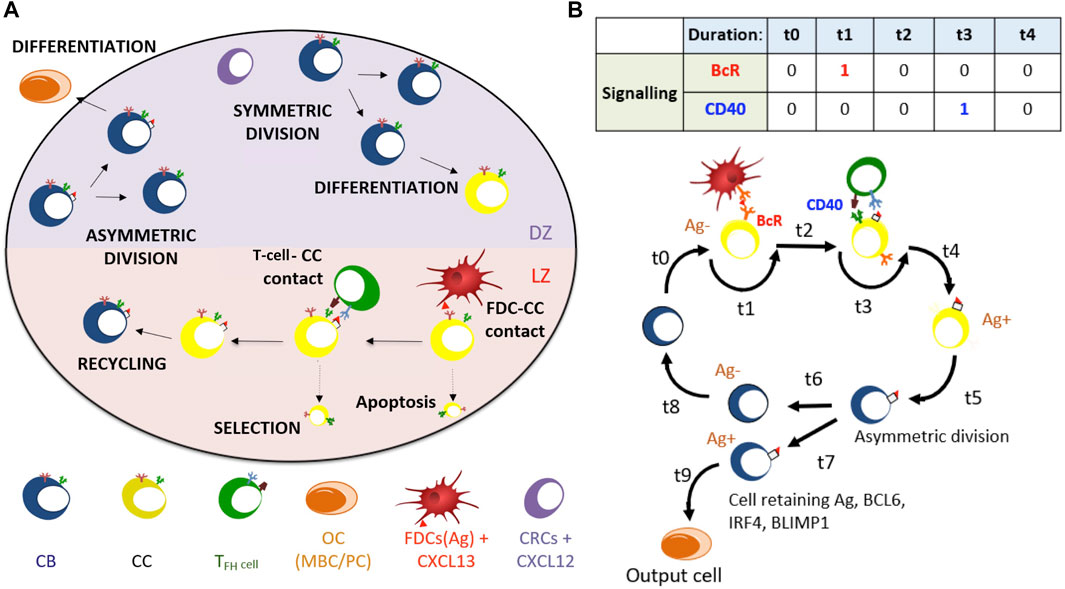
FIGURE 1. (A) Overview of cellular processes in the agent-based model. In an established GC, a dark zone (DZ) and a light zone (LZ) are distinguished. CBs and CCs prefer to move in the direction of the CXCL12 and CXCL13 chemokines produced by stromal cells and FDCs, respectively. T follicular helper cells prefer to move toward the LZ. FDCs carry the Ag that can be captured by CCs. CCs may be positively selected through interaction with T follicular helper cells, after which they can recycle to the DZ. In the DZ, the CB will (a)symmetrically divide. After CB division, an output cell is produced, or the cell differentiates to a CC. CCs die through apoptosis if they do not interact with the FDC and T follicular helper cells. (B) Schematic overview of the BcR and CD40 signaling events during the GC reaction. Durations t indicate non-fixed time intervals (cell states). At the end of each interval, the concentrations of BCL6, IRF4, and BLIMP1 are updated using the differential equations. A CB (Ag−; blue cell) differentiates to a CC (Ag−; yellow cell) within a time duration of t0. The CC interacts with the FDC for a time duration t1, during which BcR signaling occurs. Subsequently, CD40 signaling is active for duration t3 during B-cell and T follicular helper cell interaction. Successful interactions will result in an Ag+ B cell. Asymmetric division occurs with a probability of 0.72. Differentiation of CB to a CC always initializes the CC to Ag−.
At the molecular level, we used an ODE model of a GRN involved in PC differentiation based on an existing model (Martínez et al., 2012). The GRN consists of three transcription factors, i.e., BCL6 (b), BLIMP1 (p), and IRF4 (r). These transcription factors regulate each other, and the concentration levels depend on their dissociation constant (k), transcription (μ), and degradation rates (λ), as shown in Eqs 1–3. Parameter values are shown in Supplementary Table 2. Bcr0 and cd40 parameters were calibrated using the MoonFit graphical user interface (Robert et al., 2018). “Squares” in the equations represent Hill coefficients representing the cooperative binding of transcription factors. The GRN behaves as a bistable system, with one state being the CB- and CC-like state (BCL6 high and BLIMP1 and IRF4 low) and a second state being the PC-like state (BLIMP1 and IRF4 high and BCL6 low). Upstream signals may instruct the system toward one or the other state. Their effect is integrated through BcR and CD40 parameters, as described in Eqs 4, 5. During the CC-FDC interaction in the LZ, CCs receive BcR-mediated signals. The maximum strength of the signal is represented by the bcr0 parameter (Eq. 4). The transition from CC toward the PC state is reversible when the BcR signal cessates, bringing the B cell to its previous CC state. During CC-T follicular helper cell interaction in the LZ, CCs receive signals through CD40. The strength of the signal is represented by the cd40 parameter (Eq. 5). The transition from the CC to PC state is irreversibly determined by the CD40 signal strength, which is dependent on the affinity of the BcR for the Ag (Supplementary Table 2).
The ODE model was adopted, as described in the simulations section, in order to investigate the effect of different genetic alterations in the GC dynamics.
Definition of Output Cells
The definition of output cells, either MBCs or PCs, is based on the Ag status and levels of BLIMP1 (Merino Tejero et al., 2020). Recycled CBs carrying Ag are considered Ag-positive (Ag+). During asymmetric division, Ag inheriting CB is Ag+ while the sibling is Ag-negative (Ag−). During symmetric division, Ag is distributed symmetrically and both siblings are Ag−. This was based on a study that recapitulated the predominant features of Ag segregation in vitro by building a mixed model of B-cell mitosis where 25% of the divisions were fully symmetric, and the remaining were asymmetric (Thaunat et al., 2012). Recycled CBs that finished dividing differentiate to PCs when BLIMP1 levels reach the differentiation threshold (≥8.10−8 M; Figure 2) regardless of their Ag status. Ag+ output cells with BLIMP1 levels below the threshold are considered to be MBCs. Finally, Ag− CBs with BLIMP1 levels below the threshold stay in the GC and recycle back to the LZ as CCs. This definition leads to a transzone migration rate or the DZ-to-LZ ratio close to experimental observations, as described by Victora et al. (2010), and a temporal switch in the output cell production of the MBC and PC dynamics, as described by Weisel et al. (2016).
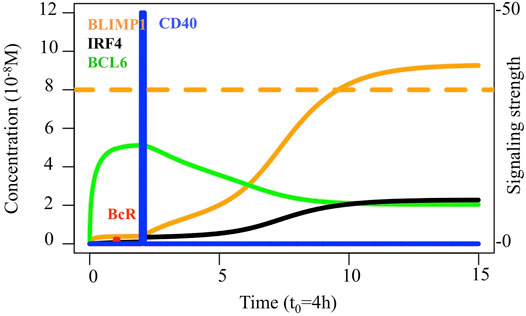
FIGURE 2. Transcription factor dynamics of the reference model upon binding of Ag and CD40L. Each time unit represents 4 h. The protein concentration levels (unit = 10−8 M) of BCL6 (green), IRF4 (black), and BLIMP1 (orange) are shown on the left axes. Transcription factor levels are followed for 52 h after the CD40 signal. The BcR signal (red) results in a slight temporary change in transcription factor concentrations. In contrast, the CD40 signal (blue) results in a switch of all transcription factor levels going from a B-cell to a PC (BLIMP1+) phenotype (in approximately 31 h in this example). The CD40 signal intensity in the MSM varies between 0 and 50 while the BcR signal is fixed to 1 (right axes). The BLIMP1 concentration threshold for PC differentiation is shown at 8 × 10⁻⁸ M (Dashed orange).
Simulations
We investigated the effect of eight different diffuse large B-cell lymphoma models on both molecular and cellular levels. This was performed to show how the MSM can be used to recapitulate the GC dynamics observed in mouse diffuse large B-cell lymphoma models (Zhang et al., 2015; Calado et al., 2010) in terms of B-cell and PC numbers and transcription factor expression levels on day 7 of the GC reaction (day 10 post-immunization (PI); Table 2). Most diffuse large B-cell lymphomas result in alterations, either an increase or decrease, in GC B-cell numbers and/or PCs produced (see Results section). Each diffuse large B-cell lymphoma model simulates one or more genetic alteration(s) (Figure 3). Models were simulated by modifying different ODEs and/or parameters models, as described in Table 1. Six of the models simulated single genetic alterations based on a previous study by Martínez et al. (2012), that is, BCL6 autoregulatory inactivation (BCLauto), BCL6 constitutive expression (BCLinc), loss of IRF4-mediated BCL6 silencing (IRFsil), loss of BLIMP1-mediated BCL6 silencing (BLIMPsil), BLIMP1 inactivation (BLIMPloss), and constitutive activation of the NF-kB pathway (IRFinc). The steady-state levels of BLIMP1, BCL6, and IRF4 after CD40 signal were very close or identical to those derived by Martínez et al. (2012) (Supplementary Table 3). One exception was that the BCLinc model showed a clear difference in the IRF4 and BLIMP1 levels. This is caused by the fact that in our MSM selected CC differentiation into a PC process was around 11 times faster than in the model presented by Martínez et al. The in silico GC B-cell dynamics were compared to data from experimental models carried out by Zhang et al. (2015) and Calado et al. (2010). In our IRFinc model, the perturbation applied to IRF4 was only a 2-fold increase in IRF4 transcription rates as opposed to the 10-fold increase applied by Martínez et al. (2012). This was carried out to obtain transcription factor levels (data not shown) that resembled both experimental models (Zhang et al., 2015; Calado et al., 2010). Both experimental models showed a similar increase in the levels of BLIMP1 on day 7 of the GC reaction compared to an experimental reference. Nevertheless, the GC B-cell dynamics were different (Table 2). These differences observed between both experiments were due to the NF-kB pathway was activated. In a study by Zhang et al. (2015), constitutive induction of NF-kB-inducing kinase restrained activation of the alternative NF-kB pathway. In a study by Calado et al. (2010), constitutive induction of the NF-kB-inhibiting kinase restrained activation of the canonical NF-kB pathway. While our IRFinc model did not explicitly include a distinction between alternative and canonical pathways, it was able to reproduce PC dynamics observed by Calado et al. (2010) (See below). Two additional models were created to simulate experimental findings by combining two of the single models, namely, BCL6 constitutive expression in codominance with constitutive activation of the alternative NF-kB pathway (BCLincIRFinc), based on experiments conducted by Zhang et al. (2015), and BLIMP1 inactivation in codominance with constitutive activation of the canonical NF-kB pathway (BLIMPlossIRFinc), based on experiments conducted by Calado et al. (2010). We repeated all simulations 10 times with different random seeds, which showed that the amount of variability was low. Thus, this was sufficient to observe significant differences between the reference and most of the diffuse large B-cell lymphoma models when looking at the DZ-to-LZ ratio and output cell production (data not shown).
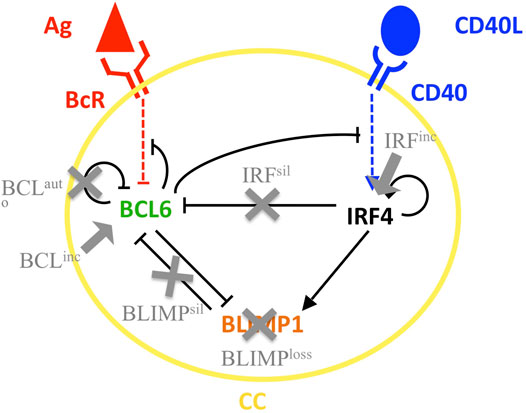
FIGURE 3. Scheme of the GRN involved in PC terminal differentiation. BCL6 (green) is inhibited upon binding of the Ag to the BcR (red). IRF4 (black) is activated upon binding of CD40L to CD40 (blue) during T follicular helper and B-cell interaction. Modifications in the GRN carried out to simulate the different diffuse large B-cell lymphoma models BCLauto, BCLinc, IRFsil, BLIMPsil, BLIMPloss, and IRFinc are indicated in gray. Gray arrows indicate over-induction, and gray crosses indicate removal of the relation. Black, blue, and red arrows and bar-headed lines indicate activation and inhibition, respectively.
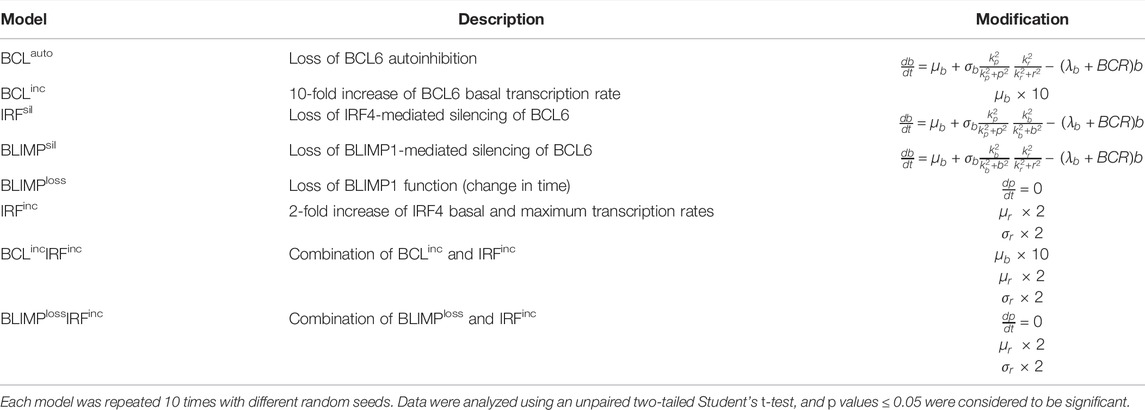
TABLE 1. Eight simulated diffuse large B-cell lymphoma models. For models BCLauto, IRFsil, and BLIMPsil, the ODE equation (Eq. 2) was modified as shown in the following. For models BLIMPloss and BLIMPlossIRFinc, the equation (Eq. 1) was modified as shown in the following. Finally, for models BCLinc, IRFinc, BCLincIRFinc, and BLIMPlossIRFinc, the indicated ODE parameters were modified as shown in the table. The rest of the equations and parameters are kept as described in Supplementary Table 2 and Eqs 1–5.
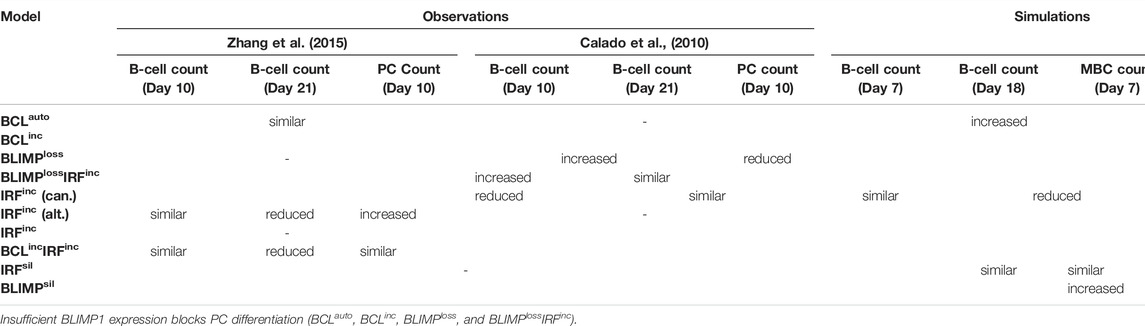
TABLE 2. Qualitative comparison between observed and simulated GC phenotypes in eight different diffuse large B-cell lymphoma models. B-cell and PC counts observed are based on previous studies by Zhang et al. (2015) and Calado et al. (2010) on days 10 and 21 post-immunization. Considering that GCs take 3 days to develop after immunization (Weisel et al., 2016), in our simulations, B cells and PCs were counted on days 7 and 18 of the GC reaction. Words “similar”, “increased”, and “reduced” indicate no significant difference, significant increase, and significant decrease when comparing each model cell count to an observed or simulated reference.
Results
The GC Dynamics (Reference)
Diffuse large B-cell lymphomas are characterized by spleen and/or lymph node hyperplasia (Zhang et al., 2015; Calado et al., 2010). Furthermore, the same studies showed that most diffuse large B-cell lymphoma genetic mutations result in altered GC dynamics, either through an increase or decrease, in GC B-cell numbers and/or PCs produced. Thus, we wondered about the effect of modeling eight diffuse large B-cell lymphoma models on the GC B-cell dynamics. We performed an example simulation at the scale of one B-cell, in which ODEs and parameters were defined as described in Eqs 1–5 and Supplementary Table 2. The initial state at BCL6 high and BLIMP1 and IRF4 low switched to BLIMP1 and IRF4 high and BCL6 low, especially as a consequence of CD40 signal induction (Figure 2). At the scale of a full GC simulation, we found that the DZ-to-LZ ratio was similar to the affinity-based CD40 signaling simulation (Scenario 2) of one of our previous studies (Merino Tejero et al., 2020) (Figure 4A; Supplementary Table 4). Nevertheless, it was slightly higher than previous experimental observations of transzone migration rates (Victora et al., 2010). Finally, a temporal transition from MBC to PC production was observed in the GC output (Figure 4B).
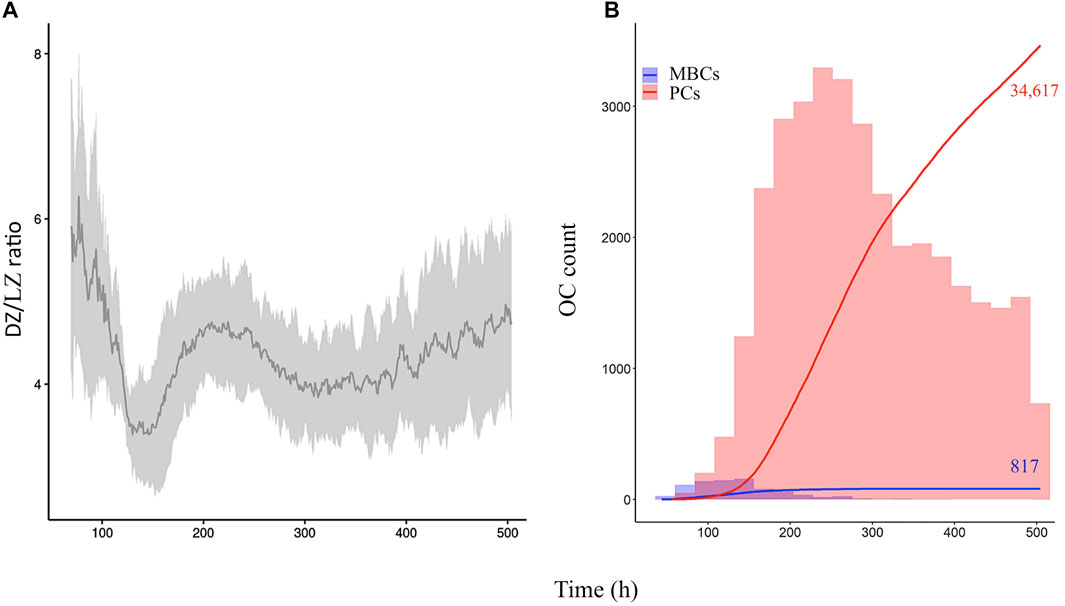
FIGURE 4. Overall GC dynamics of the reference model with the affinity-dependent cd40 signal. (A) Mean DZ-to-LZ ratio (dark gray) calculated from CB and CC counts. Standard deviation of 10 different random seeds is represented in light gray. (B) Cumulative number of MBCs (blue) and PCs (red) produced during the GC reaction represented with two lines. The histogram represents the number of MBCs (blue) and PCs (red) produced per day. The histogram scale is represented in the left axes. The line scale (not shown) ranges between 0 and 100. Numbers show the cumulated number of MBCs (blue) and PCs (red) on day 21 of the GC reaction. Representative of 10 simulations.
Thus, in the reference simulation, the DZ-to-LZ ratio was higher than previously observed transzone migration rates of around 2 (Victora et al., 2010) and similar to the affinity-based CD40 signaling simulation (Scenario 2) (Merino Tejero et al., 2020). A latter large-scale study by Wittenbrink et al. (2011) showed that the GC dynamics is highly variable. They performed a volume-to-volume comparison of both GC zones and showed that dividing B cells are present in both zones constantly over time. Thus, the study did not reflect the dividing vs. non-dividing B-cell DZ-to-LZ ratio, and their measurements are not directly comparable to those by Victora et al. (2010). Further experiments would be required to determine the variability in DZ-to-LZ ratios in GC responses to establish whether or not our model produces deviating values. There was a temporal switch of the GC output from mainly MBC production prior to the peak to mainly PC production after the peak. Finally, there was a 42-fold higher PC than MCB production. Studies have shown the number of PCs and MBCs generated spleen and bone marrow during an immune response (Kishi et al., 2010; Weisel et al., 2016; Sugimoto-Ishige et al., 2020). Nevertheless, these numbers represent percentages of observed PCs and MBCs from the total number of splenic or bone marrow cells, which are not translatable to the number of output cells from a single GC and therefore are not directly comparable with our results.
We now compared the effect of several genetic (models defined in Table 1, see Methods) alterations onto the GC dynamics in order to recapitulate the observed GC phenotype in diffuse large B-cell lymphoma. We first aimed to gain insight into the effect of BLIMP1 suppression (BCLauto and BCLinc) or loss of function (BLIMPloss and BLIMPlossIRFinc) on the GC B-cell dynamics. While previous studies showed that the GC phenotype in diffuse large B-cell lymphomas characterized by BCLauto and BCLinc alterations had unaltered numbers of B cells and PCs produced, they did lead to spleen and lymph node hyperplasia (Zhang et al., 2015). Another study showed that the GC phenotype BLIMPloss and BLIMPlossIRFinc alterations are characterized by an accumulation of B cells, a block of PC differentiation and spleen hyperplasia (Calado et al., 2010).
We analyzed the transcription factor dynamics and B-cell dynamics in the aforementioned models (Table 1). The transcription factor dynamics simulated in single cells showed that for BCLauto and BCLinc models, the system evolved to the BCL6 high and BLIMP1 and IRF4 low steady-state unaffected by the CD40 signal (Figures 5A,B). The steady-state level of BCL6 in the BCLauto model was around four times higher than in the BCLinc model, as shown by Martínez et al. (2012), while steady-state levels of IRF4 and BLIMP1 were similar in both models which were not observed by Martínez et al. (2012) (see Methods section). Thus, we found that within the timing of PC differentiation during the GC reaction, both BCLauto and BCLinc models had a robust BCL6 overexpression that inhibited IRF4 and BLIMP1 expression and blocked PC differentiation. BLIMPloss and BLIMPlossIRFinc models switched to the BCL6 low and IRF4 high steady-state as a result of CD40 signal. Nevertheless, they both failed to express BLIMP1 (Figures 5C,D).
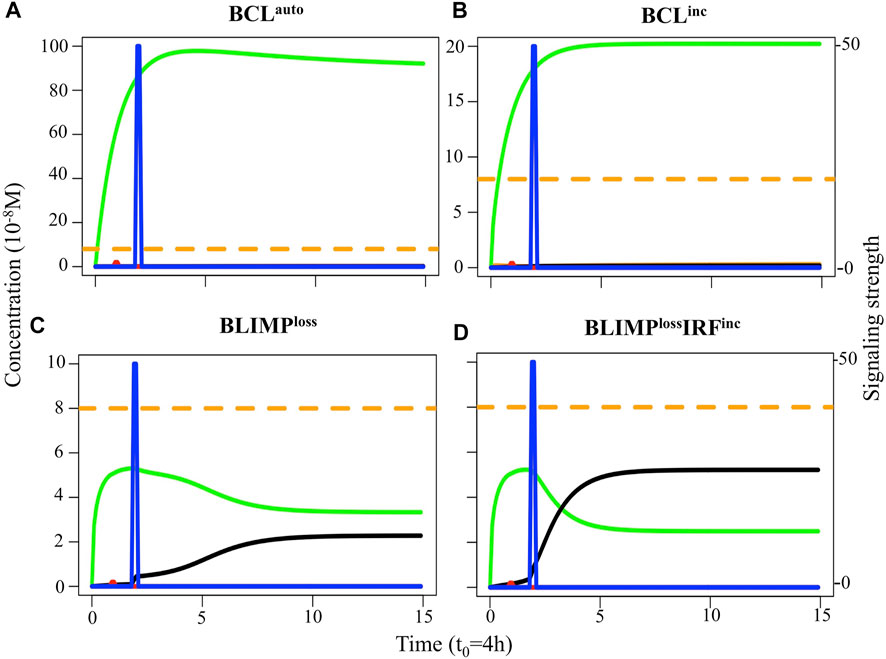
FIGURE 5. Transcription factor dynamics of (A) BCLauto, (B) BCLinc, (C) BLIMPloss, and (D) BLIMPlossIRFinc diffuse large B-cell lymphoma models upon binding of Ag and CD40L. Each time unit represents 4 h. The protein concentration levels (unit = 10−8 M) of BCL6 (green), IRF4 (black), and BLIMP1 (orange) are shown on the left axes. Transcription factor levels are followed for 52 h after CD40 signal. In BCLauto and BCLinc models, CD40 signal (blue) does not affect transcription factor levels. In BLIMPloss and BLIMPlossIRFinc models, the CD40 signal affects BCL6 and IRF4 but not BLIMP1 levels. Thus, in all models, the CD40 signal does not result in a switch of the B-cell to a PC (BLIMP1+) phenotype (in approximately 51 h in this example).
We observed BCLauto, BCLinc, BLIMPloss, and BLIMPlossIRFinc models had a significantly increased DZ-to-LZ ratio throughout the GC reaction, which reached up to a 25-fold increase at day 21 (Supplementary Table 4), compared to the reference model (Figure 6A) resulting on an increased abundance of GC B cells. All output cells were MBCs (Supplementary Table 4), and no PCs were produced (Figure 6B). Statistical analysis of MBC (Figure 7A) and PC (Figure 7B) counts showed a 13,000-fold increase and 35,000-fold decrease compared to the reference. Since BLIMP1 levels were virtually 0 in all cases, and no significant difference in the number of MBCs and PCs was observed between the four models. MBC affinity increased up to its maximum as the GC reaction progressed in all models while it remained low in the reference model (Figure 7C).
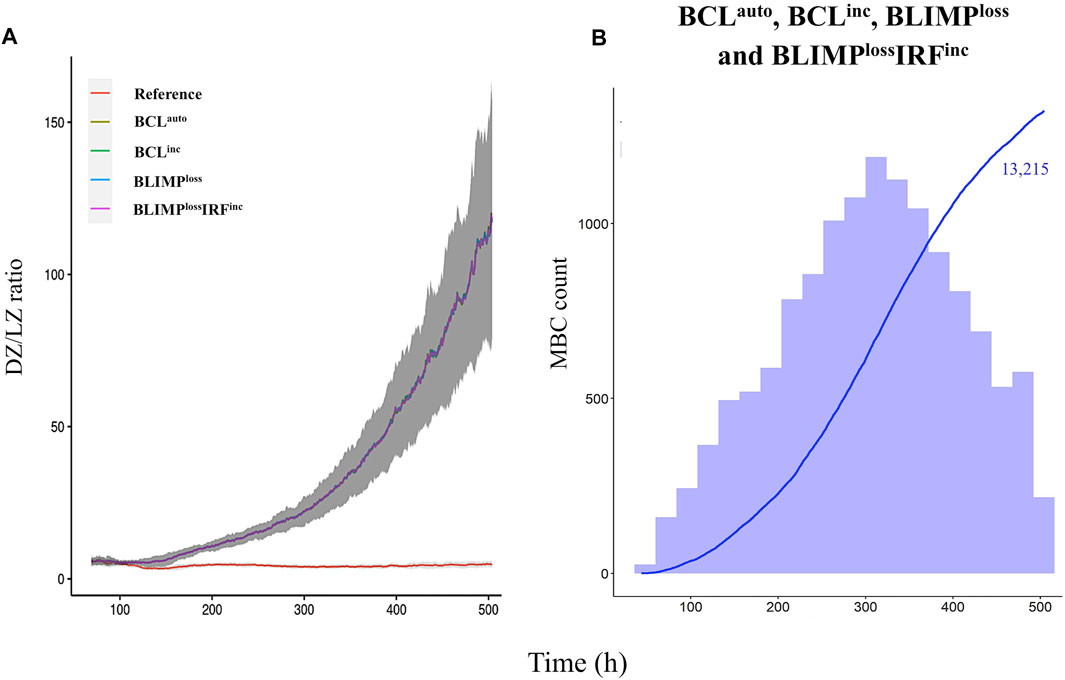
FIGURE 6. Overall GC dynamics with the affinity-dependent CD40 signal. (A) Mean DZ-to-LZ ratio calculated from CB and CC counts during the GC reaction for the reference (red), BCLauto (yellow), BCLinc (green), BLIMPloss (blue), and BLIMPlossIRFinc (purple) diffuse large B-cell lymphoma models. Standard deviation of 10 different random seeds is represented in dark gray. (B) Cumulative number of MBCs produced during the GC reaction for BCLauto, BCLinc, BLIMPloss, and BLIMPlossIRFinc models represented with a blue line. The histogram represents the number of MBCs (blue) produced per day. The histogram scale is represented in the left axes. The line scale (not shown) ranges between 0 and 100. Number shows the cumulated number of MBCs (blue) on day 21 of the GC reaction. No PCs are produced. Representative of 10 simulations.
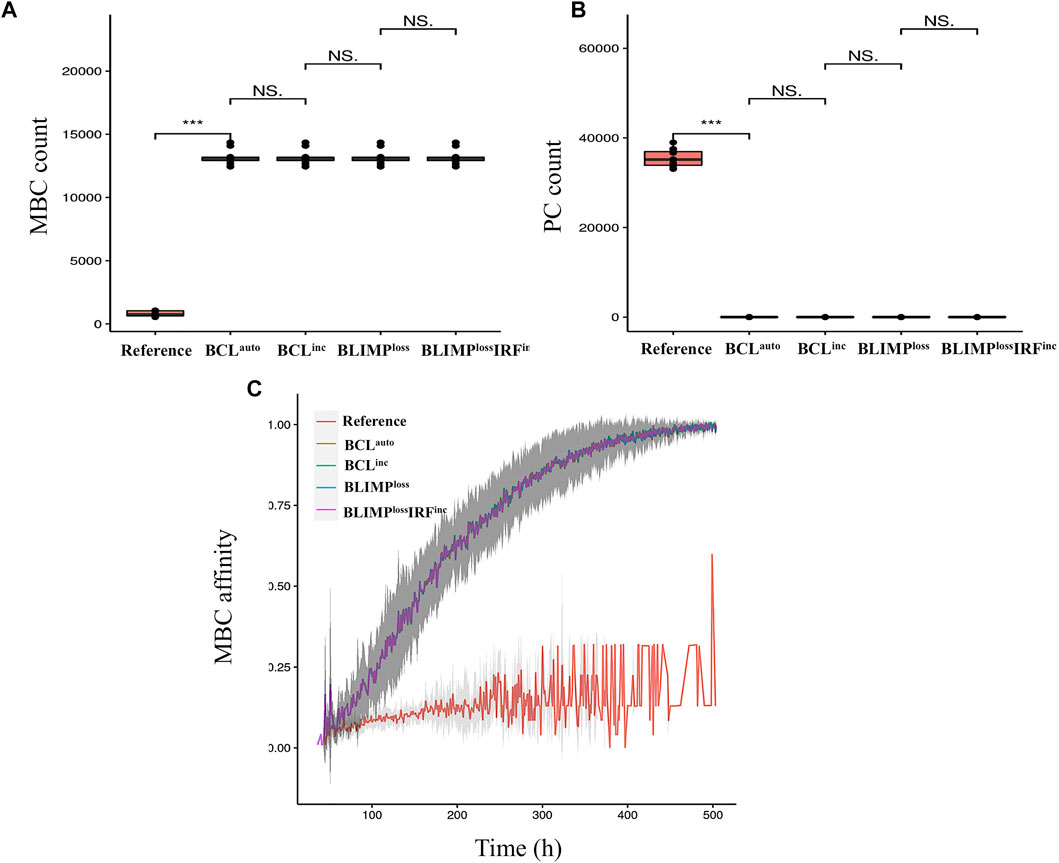
FIGURE 7. Statistical analysis of (A) MBC and (B) PC counts on day 21 of the GC reaction and (C) MBC affinity dynamics during the GC reaction for the reference (red), BCLauto (yellow), BCLinc (green), BLIMPloss (blue), and BLIMPlossIRFinc (purple) diffuse large B-cell lymphoma models. A significant difference in the number of MBCs and PCs produced is observed between the reference and the four diffuse large B-cell lymphoma models. In the diffuse large B-cell lymphoma models, MBCs increase their affinity over time, while in the reference model, MBCs are of low affinity. Standard deviation of 10 different random seeds is represented in dark gray. An unpaired two-tailed Student’s t-test was used. Three asterisks (***) represent p-values ≤ 0.001, “NS.” represents not statistically significant.
To summarize, all models lead to an accumulation of CBs in the DZ. No PCs were generated due to the inability of recycled CBs to express BLIMP1. There was a significant increase in the number and affinity of MBCs. The expansion of GC B cells and significant reduction of PCs in BCLauto and BCLinc models were in disagreement with observations showing the BLIMP1 suppression leads to unaltered GC B-cell numbers on days 10 and 21 post-immunization and PC numbers on day 10 post-immunization (Table 2) (Zhang et al., 2015). This could be due to a decreased but present BLIMP1 expression in the experimental setup, which was not the case in our model. Finally, BLIMPloss and BLIMPlossIRFinc models were consistent with observations showing BLIMP1 inactivation lead to GC B-cell expansion (Table 2) and a lack of PC production on days 10 and 21 post-immunization (Calado et al., 2010). Nevertheless, when in codominance with constitutive NF-KB pathway activation (BLIMPlossIRFinc), on day 21 post-immunization, experimental data showed unaltered GC B-cell numbers as opposed to the expansion of B cells observed in our model (Table 2).
Constitutive Activation of the NF-kB Pathway Alone and in Codominance with Enforced BCL6 Expression Increases PC Differentiation at Latter Stages of the GC Reaction (IRFinc and BCLincIRFinc)
Next, we assessed the effect of constitutive activation of the NF-kB pathway alone (IRFinc) and in codominance with the BCL6 overexpression (BCLincIRFinc) on the overall GC dynamics (Table 1). Previous studies showed that the GC phenotype in diffuse large B-cell lymphomas that are driven by IRFinc and BCLincIRFinc alterations are characterized by unaltered B-cell numbers (Zhang et al., 2015) or slightly decreased B-cell numbers (Calado et al., 2010), in the case of the IRFinc alteration, on day 10 post-immunization and spleen and/or lymph node hyperplasia (Calado et al., 2010; Zhang et al., 2015). While alterations that led to the IRFinc model resulted in an increased PC production on day 10 post-immunization according to Zhang et al. (2015), unaltered PC numbers were observed by Calado et al. (2010). Furthermore, alterations that led to the BCLincIRFinc model resulted in unaltered PC production on day 10 post-immunization (Zhang et al., 2015).
The transcription factor dynamics simulated in single cells showed that in both IRFinc and BCLincIRFinc models, there was a switch to the BLIMP1 and IRF4 high steady-state prior to the CD40 signal (Figure 8A). Nevertheless, only the BCLincIRFinc model had consistently high BCL6 levels due to the effect of the BCL6 overexpression (Figure 8B).
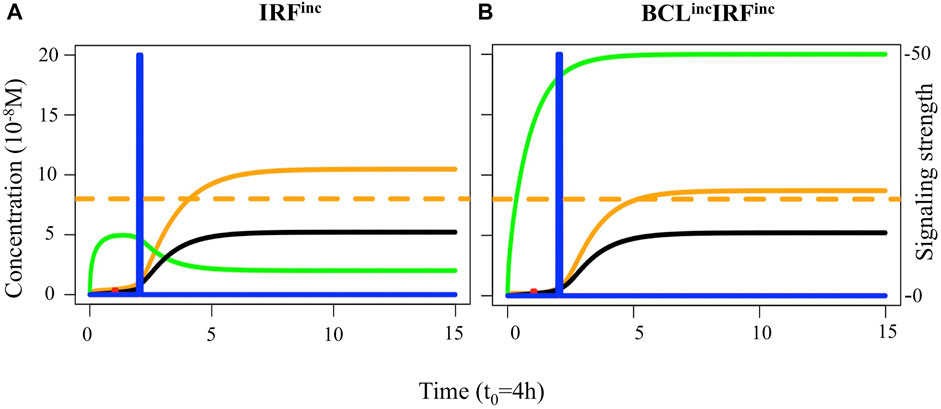
FIGURE 8. Transcription factor dynamics of (A) IRFinc and (B) BCLincIRFinc diffuse large B-cell lymphoma models upon binding of Ag and CD40L. Each time unit represents 4 h. The protein concentration levels (unit = 10−8 M) of BCL6 (green), IRF4 (black), and BLIMP1 (orange) are shown on the left axes. Transcription factor levels are followed for 52 h after the CD40 signal. In IRFinc and BCLincIRFinc models, the CD40 signal (blue) affects transcription factor levels resulting in a switch of the B-cell to a PC (BLIMP1+) phenotype (in approximately 8 and 12 h, respectively, in this example).
We observed both diffuse large B-cell lymphoma models had a 2-to-3-fold decrease in the DZ-to-LZ ratio on day 21 of the GC reaction (Supplementary Table 4; Figure 9A) and a slight decrease of GC B cells (data not shown) and increase in output cells produced on day 21 of the GC reaction (Supplementary Table 4) compared to the reference model. All output cells were PCs, and no MBCs were produced (Figures 9B,C). Statistical analysis of PC counts on day 7 of the GC reaction (Figure 10A) showed no significant difference compared to the reference model. Interestingly, on day 21 of the GC reaction (Figure 10B), a 1.14-fold increase in PC count compared to the reference model was observed. Furthermore, no significant difference in the PC count between IRFinc and BCLincIRFinc models was observed.
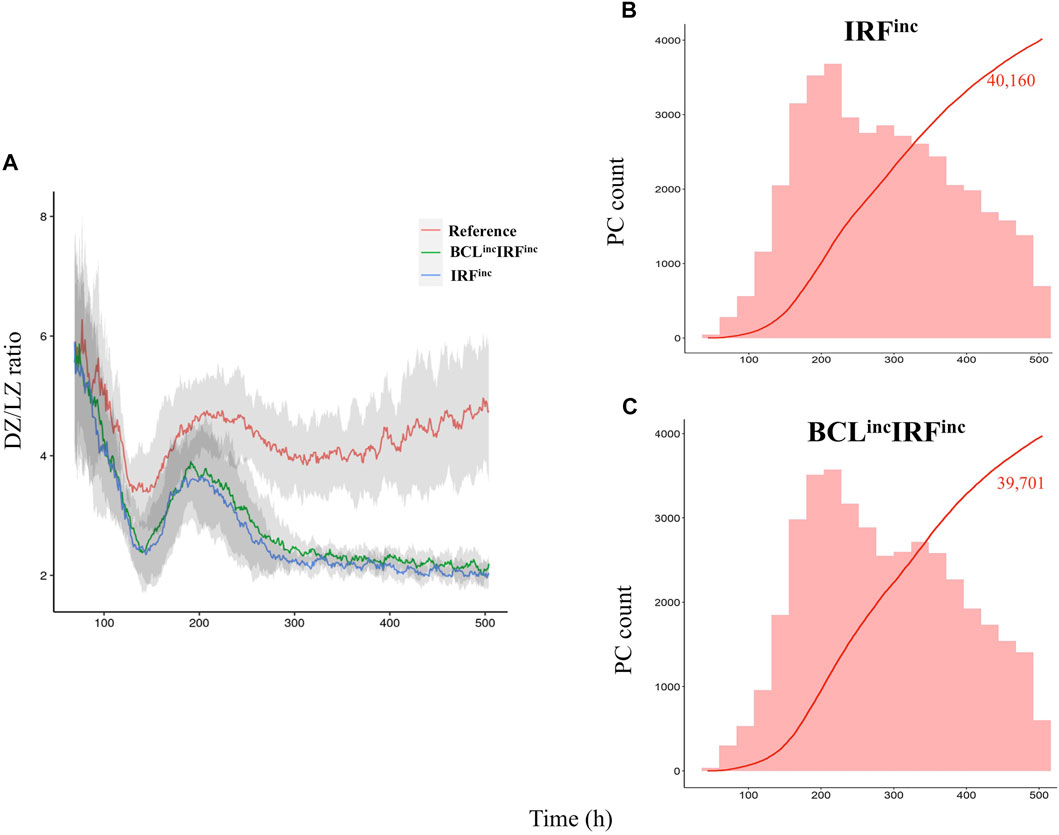
FIGURE 9. Overall GC dynamics with the affinity-dependent CD40 signal. (A) Mean DZ-to-LZ ratio calculated from CB and CC counts during the GC reaction for the reference (red), BCLincIRFinc (green), and IRFinc (blue) diffuse large B-cell lymphoma models. Standard deviation of 10 different random seeds is represented in light gray. There is a 2-fold increase in the DZ-to-LZ ratio of the reference model compared to the diffuse large B-cell lymphoma models. (B) Cumulative number of PCs produced during the GC reaction for IRFinc and (C) BCLincIRFinc models represented with a red line. The histogram represents the number of PCs (red) produced per day. The histogram scale is represented in the left axes. The line scale (not shown) ranges between 0 and 100. The number shows the cumulated number of PCs (red) on day 21 of the GC reaction. No MBCs are produced. Representative of 10 simulations.
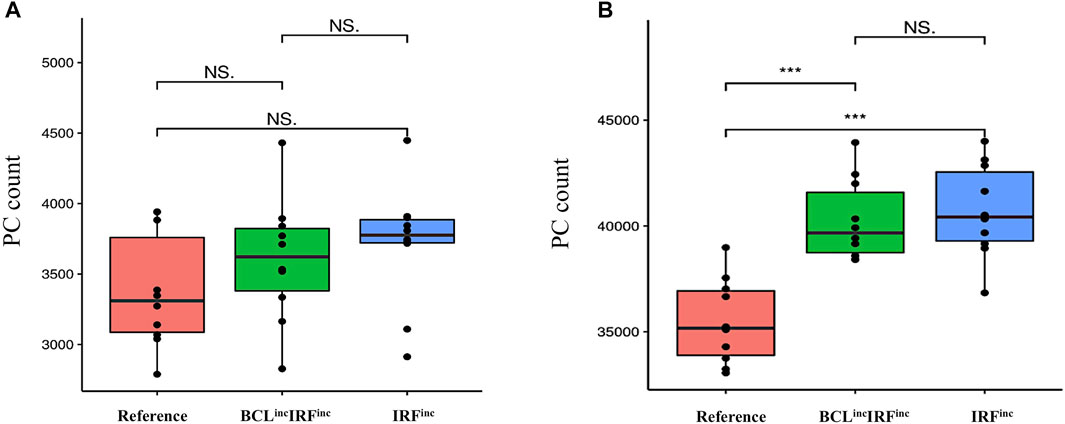
FIGURE 10. Statistical analysis of PC counts (A) on day 7 of the GC reaction and (B) on day 21 of the GC reaction for the reference (red), BCLincIRFinc (green), IRFinc (blue), and BLIMPlossIRFinc (purple) diffuse large B-cell lymphoma models. No statistically significant difference in the number of PCs produced on day 7 is observed between the reference and the two diffuse large B-cell lymphoma models. On day 10, there is a statistically significant difference in the number of PCs produced between the reference and the two diffuse large B-cell lymphoma models. An unpaired two-tailed Student’s t-test was used. Three asterisks (***) represent p-values ≤ 0.001, “NS.” represents not statistically significant.
To summarize, IRFinc and BCLincIRFinc models resulted in a decreased DZ-to-LZ ratio and increased production of PCs on day 21 of the GC reaction. No MBCs were produced due to the fast increase of BLIMP1 independent of CD40 signaling and B-cell affinity. On day 7 of the GC reaction, similar PC counts were observed compared to the reference model. Our IRFinc model was in agreement with observations showing an unaltered number of PCs on day 10 post-immunization and spleen hyperplasia (Calado et al., 2010). Nevertheless, the model also showed unaltered and reduced GC B-cell numbers on days 7 and 18 of the GC reaction, while the previous study showed the opposite trend. (Table 2) (Calado et al., 2010). Despite reproducing the transcription factor and GC B-cell dynamics, our PC results were in disagreement with observations showing an increased number of PCs on day 10 post-immunization (Table 2) (Zhang et al., 2015). This discrepancy suggested that our model was able to recapitulate the effect of constitutive activation of the canonical but not the alternative NF-kB pathway on PC production. Finally, the BCLincIRFinc model was in agreement with observations shown by Zhang et al. (2015) (Table 2). Thus, our results suggested that IRFinc and BCLincIRFinc alterations lead to unaltered PC production on day 7 of the GC reaction but could result in increased PC differentiation at later stages of the GC reaction.
Loss of IRF4- and BLIMP1-Mediated Silencing of BCL6 Does Not Affect PC Differentiation (IRFsil and BLIMPsil)
Finally, we assessed the effect of loss of IRF4- and BLIMP1-mediated silencing of BCL6 (IRFsil and BLIMPsil) on the overall GC dynamics (Figure 11). For IRFsil and BLIMPsil alterations, we did not find observations on the GC phenotype in terms of B-cell numbers and PCs produced. Nevertheless, the transcription factor dynamics simulated in single cells showed in both models the system evolved to a BCL6 low, BLIMP1 and IRF4 high steady-state as a result of the CD40 signal transduction. Similar results were observed by Martínez et al. (2012), indicating that redundancy in the GRN makes the system robust against loss of the BCL6 repression by either BLIMP1 or IRF4 but not by both. Steady-state levels of all transcription factors in the IRFsil model reached similar concentration levels as in the reference.
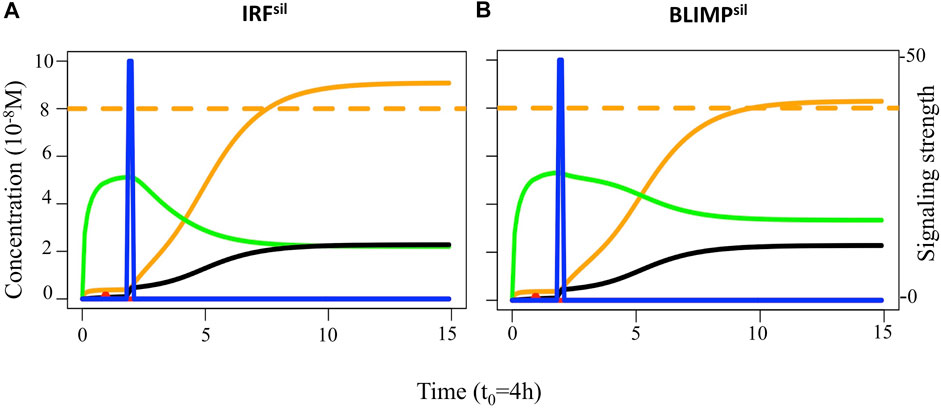
FIGURE 11. Transcription factor dynamics of (A) IRFsil and (B) BLIMPsil diffuse large B-cell lymphoma models upon binding of Ag and CD40L. Each time unit represents 4 h. The protein concentration levels (unit = 10−8 M) of BCL6 (green), IRF4 (black), and BLIMP1 (orange) are shown on the left axes. Transcription factor levels are followed for 52 h after the CD40 signal. In IRFsil and BLIMPsil models, CD40 signal (blue) affects transcription factor levels resulting in a switch of the B-cell to a PC (BLIMP1+) phenotype (in approximately 20 and 24 h, respectively, in this example).
We observed the IRFsil model had a similar DZ-to-LZ ratio, GC B-cell numbers (data not shown), and output cells produced at day 21 of the GC reaction (Supplementary Table 4) compared to the reference model (Figure 12A). In the BLIMPsil model, there was a slight increase in the DZ-to-LZ ratio and GC B-cell numbers (data not shown) as well as a slight decrease in output cells produced at day 21 of the GC reaction (Supplementary Table 4) compared to the reference model (Figures 12B,C). Statistical analysis of the MBC count at day 21 of the GC reaction (Figure 13A) showed no significant difference between the reference and IRFsil. There was a significant 1.7-fold increase in the BLIMPsil model compared to IRFsil and the reference. This could be due to the faster increase of BLIMP1 in BLIMPsil, indicating a greater repression effect of BLIMP1 over BCL6 than the effect of IRF4 over BCL6. Statistical analysis of the PC count at day 21 of the GC reaction (Figure 13B) showed no significant difference between the reference, IRFsil, and BLIMPsil models.
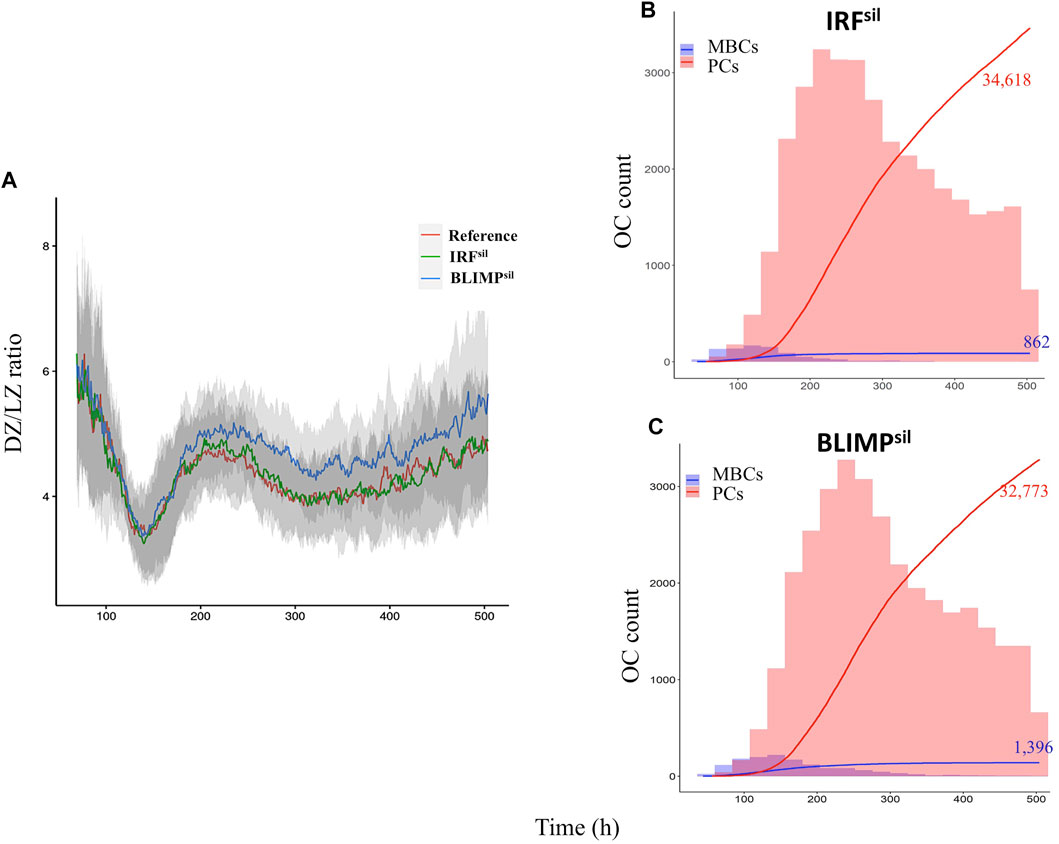
FIGURE 12. Overall GC dynamics with the affinity-dependent CD40 signal. (A) Mean DZ-to-LZ ratio calculated from CB and CC counts during the GC reaction for the reference (red), IRFsil (green), and BLIMPsil (blue) diffuse large B-cell lymphoma models. Standard deviation of 10 different random seeds is represented in light gray. There is a similar DZ-to-LZ ratio in the reference and the diffuse large B-cell lymphoma models. (B) Cumulative number of PCs and MBCs, represented with red and blue lines, respectively, produced during the GC reaction for IRFsil and (C) BLIMPsil models. The histogram represents the number of PCs (red) and MBCs (blue) produced per day. The histogram scale is represented in the left axes. The line scale (not shown) ranges between 0 and 100. The number shows the cumulated number of PCs (red) and MBCs (blue) on day 21 of the GC reaction. Representative of 10 simulations.
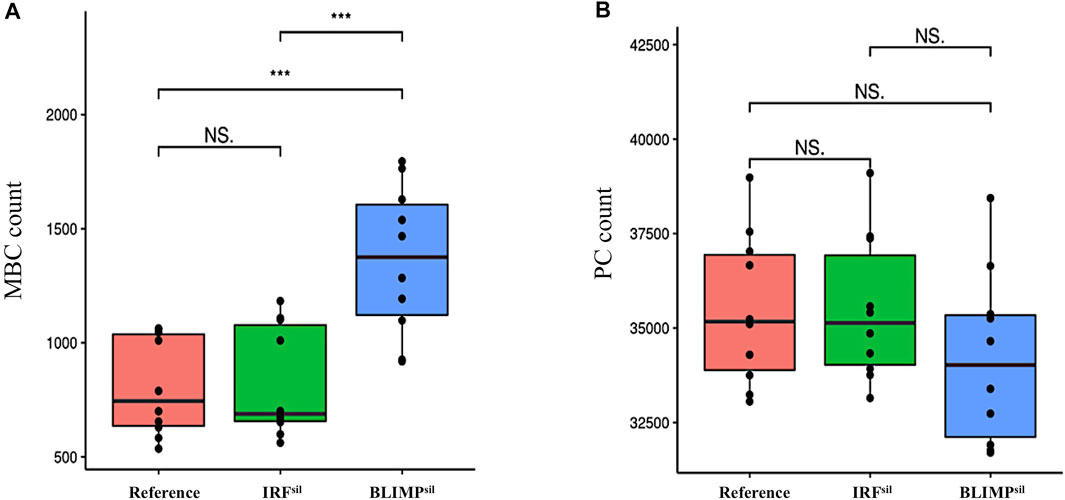
FIGURE 13. Statistical analysis of (A) MBC count and (B) PC count, on day 21 of the GC reaction for the reference (red), IRFsil (green), and BLIMPsil (blue) diffuse large B-cell lymphoma models. No statistically significant difference in the number of PCs produced is observed between the reference and the two diffuse large B-cell lymphoma models. There is a statistically significant difference in the number of MBCs produced between the BLIMPsil model and the reference. There is no statistically significant difference in the number of MBCs produced between the IRFsil model and the reference. An unpaired two-tailed Student’s t-test was used. Three asterisks (***) represent p-values ≤ 0.001, “NS.” represents not statistically significant.
Discussion
The MSM can be an effective tool to complement experimental investigation and has been used to predict the most effective therapies for in vitro diffuse large B-cell lymphoma cell lines (Du et al., 2017). Targeted therapies against chronically active BcR signaling pathways have shown to effectively decrease cell viability, thus inhibiting the tumor growth. It is increasingly acknowledged that the aberrant expression of key transcription factors, namely, BCL6, IRF4, and BLIMP1, and signaling pathways, namely, BcR and CD40, during the GC reaction plays a central role in the development of many diffuse large B-cell lymphomas (Martínez et al., 2012). To study the effect of eight different genetic alterations on the B-cell dynamics in the GC, we used an existing MSM of PC differentiation (Merino Tejero et al., 2020). We also compared six of the eight diffuse large B-cell lymphoma models with in vivo experiments that analyzed transcription factor expression and GC B-cell numbers at different stages of the GC reaction.
Four of the diffuse large B-cell lymphoma models correctly recapitulated the observed PC and transcription factor dynamics. BLIMPloss and BLIMPlossIRFinc models are consistent with observations showing BLIMP1 deletion led to a GC B-cell expansion and a block in the PC production on day 7 of the GC reaction (Calado et al., 2010). Thus, constitutive activation of the NF-kB pathway could not override the effect of BLIMP1 deletion. Furthermore, the BLIMPloss model was consistent with observations showing GC B-cell expansion also on day 21 post-immunization. Nevertheless, the BLIMPlossIRFinc model also showed a GC B-cell expansion on day 21 of the GC reaction, which was not observed experimentally. This could be due to the fact that our MSM does not account for the anti-proliferative and anti-apoptotic effect of BLIMP1. IRFinc, and BCLincIRFinc models are also consistent with observations showing that constitutive activation of the NF-kB pathway alone (Calado et al., 2010) and in codominance with enforced BCL6 expression (Zhang et al., 2015) lead to unaltered PC production on day 7 of the GC reaction. Nevertheless, there is a discrepancy in the number of PCs produced on day 10 post-immunization when comparing constitutive activation of the NF-kB pathway in both experimental studies. While studies conducted by Zhang et al. (2015) showed an increase in PC production, studies conducted by Calado et al. (2010) showed unaltered PC numbers on day 10 post-immunization. This is likely due to the difference in NF-kB pathways that were activated, namely, alternative or canonical pathways studied. Despite the fact that our IRFinc model resembles BLIMP1 levels shown by both studies, the number of PCs produced in our model indicates that it represents the effect of constitutive activation of the canonical NF-kB pathway on PC production. It also shows that the increase of PC production on day 7 of the GC reaction during the constitutive alternative NF-kB pathway is not due to the observed increased pro-differentiation effect of BLIMP1 levels. To this end, in vitro experiments showed that such an increase in PCs could be linked to an increased proliferative state and/or a decreased apoptotic state. To better represent this in our MSM, a distinction between alternative and canonical pathways should be introduced by including the different NF-kB subunits regulation of IRF4 and BLIMP1 and have an antagonistic function promoting and inhibiting PC differentiation (Roy et al., 2019). Furthermore, c-MYC could be included as part of our GRN, which is a critical mediator of B-cell proliferation (Dominguez-Sola et al., 2012; Shlomchik et al., 2019). Finally, our IRFinc and BCLincIRFinc models suggested that an increase in PC production could happen at later stages of the GC reaction. Measurement of PC numbers produced on day 21 of the GC reaction could be used to validate this finding. This finding could explain the pathogenesis of constitutive activation of the NF-kB pathway through the induction of the pro-differentiation effect of BLIMP1 and suggests this pathway is a possible candidate for targeted therapy.
Two of the diffuse large B-cell lymphoma models did not correctly recapitulate the observed GC and transcription factor dynamics. BCLauto and BCLinc models result in an expansion of GC B cells and a block in the PC production that was not observed experimentally (Zhang et al., 2015). This could be due to the fact that in our MSM, the anti-proliferative and anti-apoptotic effect of BLIMP1 was not included. The connection of other processes such as cell division, or apoptosis with the underlying GRN could potentially result in a better representation of the in vivo experiments. To this end, previous studies have shown that BCL6 may have a role as a promoter or inhibitor of apoptosis depending on the cellular context and the experimental approach (Bai et al., 2003). In the same study, it was hypothesized that the increased BCL6 expression could induce apoptosis in diffuse large B-cell lymphoma cell lines due to downregulation of B-cell lymphoma 2. To include this mechanism in our model, further studies are required to elucidate the relation between BCL6, B-cell lymphoma 2, and apoptosis in diffuse large B-cell lymphoma.
No data has been found to validate IRFsil and BLIMPsil models. Our findings suggested that loss of IRF4- or BLIMP1-mediated silencing of BCL6 does not affect PC differentiation. This robustness in the GRN could be necessary to compensate for the high incidence of mutations targeting the regulatory elements in the BCL6 promoter (Saito et al., 2007; Martínez et al., 2012).
MBC dynamics is affected in six of the eight diffuse large B-cell lymphoma models. Models with insufficient BLIMP1 expression (BCLauto, BCLinc, BLIMPloss, and BLIMPlossIRFinc) induce MBC production. Models with constitutive activation of the NF-kB pathway alone and those in codominance with the BCL6 overexpression (IRFinc, BCLincIRFinc) block MBC production. This observation remains to be experimentally validated. Furthermore, while our MBC definition correctly recapitulated the observation of a temporal switch from low affinity and BLIMP1 MBCs to higher affinity and BLIMP1 PC production, it also implied that the Ag status (Ag+) is one of the determinants in MBC differentiation, and MBCs leave the GC through the DZ. This definition remains to be validated. Nevertheless, a recent study showed that post-GC extranodal mutations targeting a regulator of the molecular switch BCL6 to the broad complex-tramtrack-bric-a-brac and cap“n”collar homology 2 (BACH2) transcription factor lead to an expansion of MBC population and diminished GC B-cell and PC production by hindering BCL6 function and inducing BACH2 (Venturutti et al., 2020). This observation may indicate that certain active B-cell subtype-like mutations can skew GC output toward MBC production as well as the role of BACH2 in promoting MBC differentiation by opposing BCL6. Hence, the inclusion of BACH2 in the GRN could provide a better understanding of MBC dynamics in the GC and its deregulation in diffuse large B-cell lymphomas.
Overall, our model provides a tool to study the effect of genetic alterations on the cellular level by targeting a GRN with five critical players in the development of diffuse large B-cell lymphomas and can open the way for new therapeutic strategies. In particular, it suggested BLIMP1 regulatory elements could be better candidates for targeted therapy than those regulating BCL6. Furthermore, the extension of our core GRN with other elements, such as PAX5 (Balasenthil et al., 2007), BACH2 (Ichikawa et al., 2014), T follicular helper secreted cytokines such as IL2, IL4, and IL21 (Bhatt et al., 2017), and metabolic pathways (Calvo-Vidal et al., 2021) could allow for a better approximation of the mechanisms underlying diffuse large B-cell lymphomas and other cancers, which may result in new diagnostic markers or therapeutic targets. However, this requires that we have sufficient mechanistic information or hypotheses about these mechanisms to include them in the model for further testing. Although the current literature provides many pointers to make such an extension, this will also introduce (many) new parameters in the model for which values need to be estimated from experimental (time series) data. Unfortunately, such data are not generally available. We attempted to extend the GRN model with FOXO1 and c-Myc, following new insights about the synergistic induction of c-Myc by BcR and CD40 signaling (Luo et al., 2018), but due to lack of experimental data, we terminated this effort at this time.
Data Availability Statement
The original contributions presented in the study are included in the article/Supplementary Material, further inquiries can be directed to the corresponding author. The MSM is publicly available on GitHub (https://github.com/EDS- Bioinformatics-Laboratory/MSM_PCdifferentiation_DLBCL).
Author Contributions
ET, HH and AK designed the study. ET, DL, MM-H and PR implemented the software. QM and ET carried out the simulations and analyses. All the authors were involved in the interpretation of the results. JG, HH and AK supervised the study. All the authors contributed to the article and approved the submitted version.
Funding
This work is supported by a CASyM Exchange Research Grant, COSMIC (www.cosmic-h2020.eu), which has received funding from the European Union’s Horizon 2020 research and innovation programme under the Marie Skłodowska-Curie grant agreement No 765158, and by the Human Frontier Science Program 570 (RGP0033/2015).
Conflict of Interest
MR was employed by the company IBM.
The remaining authors declare that the research was conducted in the absence of any commercial or financial relationships that could be construed as a potential conflict of interest.
Publisher’s Note
All claims expressed in this article are solely those of the authors and do not necessarily represent those of their affiliated organizations, or those of the publisher, the editors, and the reviewers. Any product that may be evaluated in this article, or claim that may be made by its manufacturer, is not guaranteed or endorsed by the publisher.
Acknowledgments
We acknowledge Barbera van Schaik for setting up a virtual machine provided by the Dutch national e-infrastructure with the support of SURF Cooperative to process large output files.
Supplementary Material
The Supplementary Material for this article can be found online at: https://www.frontiersin.org/articles/10.3389/fsysb.2022.864690/full#supplementary-material
References
Alizadeh, A. A., Eisen, M. B., Davis, R. E., Ma, C., Lossos, I. S., Rosenwald, A., et al. (2000). Distinct Types of Diffuse Large B-Cell Lymphoma Identified by Gene Expression Profiling. Nature 403 (6769), 503–511. doi:10.1038/35000501
Allen, C. D. C., Okada, T., and Cyster, J. G. (2007). Germinal-Center Organization and Cellular Dynamics. Immunity 27 (2), 190–202. doi:10.1016/j.immuni.2007.07.009
Bai, M., Agnantis, N. J., Skyrlas, A., Tsanou, E., Kamina, S., Galani, V., et al. (2003). Increased Expression of the BCL6 and CD10 Proteins Is Associated with Increased Apoptosis and Proliferation in Diffuse Large B-Cell Lymphomas. Mod. Pathol. 16 (5), 471–480. doi:10.1097/01.mp.0000067684.78221.6e
Balasenthil, S., Gururaj, A. E., Talukder, A. H., Bagheri-Yarmand, R., Arrington, T., Haas, B. J., et al. (2007). Identification of Pax5 as a Target of MTA1 in B-Cell Lymphomas. Cancer Res. 67 (15), 7132–7138. doi:10.1158/0008-5472.can-07-0750
Barnett, B. E., Ciocca, M. L., Goenka, R., Barnett, L. G., Wu, J., Laufer, T. M., et al. (2012). Asymmetric B Cell Division in the Germinal center Reaction. Science 335 (6066), 342–344. doi:10.1126/science.1213495
Bhatt, S., Sarosiek, K. A., and Lossos, I. S. (2017). Interleukin 21 - its Potential Role in the Therapy of B-Cell Lymphomas. Leuk. Lymphoma 58 (1), 17–29. doi:10.1080/10428194.2016.1201568
Calado, D. P., Zhang, B., Srinivasan, L., Sasaki, Y., Seagal, J., Unitt, C., et al. (2010). Constitutive Canonical NF-Κb Activation Cooperates with Disruption of BLIMP1 in the Pathogenesis of Activated B Cell-like Diffuse Large Cell Lymphoma. Cancer cell 18 (6), 580–589. doi:10.1016/j.ccr.2010.11.024
Calvo-Vidal, M. N., Zamponi, N., Krumsiek, J., Stockslager, M. A., Revuelta, M. V., Phillip, J. M., et al. (2021). Oncogenic HSP90 Facilitates Metabolic Alterations in Aggressive B-Cell Lymphomas. Cancer Res. 81 (20), 5202–5216. doi:10.1158/0008-5472.can-21-2734
De Silva, N. S., and Klein, U. (2015). Dynamics of B Cells in Germinal Centres. Nat. Rev. Immunol. 15 (3), 137–148. doi:10.1038/nri3804
Dominguez-Sola, D., Victora, G. D., Ying, C. Y., Phan, R. T., Saito, M., Nussenzweig, M. C., et al. (2012). The Proto-Oncogene MYC Is Required for Selection in the Germinal center and Cyclic Reentry. Nat. Immunol. 13 (11), 1083–1091. doi:10.1038/ni.2428
Du, W., Goldstein, R., Jiang, Y., Aly, O., Cerchietti, L., Melnick, A., et al. (2017). Effective Combination Therapies for B-Cell Lymphoma Predicted by a Virtual Disease Model. Cancer Res. 77 (8), 1818–1830. doi:10.1158/0008-5472.can-16-0476
Hu, S., Xu-Monette, Z. Y., Balasubramanyam, A., Manyam, G. C., Visco, C., Tzankov, A., et al. (2013). CD30 Expression Defines a Novel Subgroup of Diffuse Large B-Cell Lymphoma with Favorable Prognosis and Distinct Gene Expression Signature: A Report from the International DLBCL Rituximab-CHOP Consortium Program Study. Blood 121 (14), 2715–2724. doi:10.1182/blood-2012-10-461848
Ichikawa, S., Fukuhara, N., Katsushima, H., Takahashi, T., Yamamoto, J., Yokoyama, H., et al. (2014). Association between BACH 2 Expression and Clinical Prognosis in Diffuse Large B‐cell Lymphoma. Cancer Sci. 105 (4), 437–444. doi:10.1111/cas.12361
Kishi, Y., Aiba, Y., Higuchi, T., Furukawa, K., Tokuhisa, T., Takemori, T., et al. (2010). Augmented Antibody Response with Premature Germinal center Regression in CD40L Transgenic Mice. J.I. 185 (1), 211–219. doi:10.4049/jimmunol.0901694
Luo, W., Weisel, F., and Shlomchik, M. J. (2018). B Cell Receptor and CD40 Signaling Are Rewired for Synergistic Induction of the C-MYC Transcription Factor in Germinal center B Cells. Immunity 48 (2), 313–326. doi:10.1016/j.immuni.2018.01.008
Martínez, M. R., Corradin, A., Klein, U., Álvarez, M. J., Toffolo, G. M., Di Camillo, B., et al. (2012). Quantitative Modeling of the Terminal Differentiation of B Cells and Mechanisms of Lymphomagenesis. Proc. Natl. Acad. Sci. U.S.A. 109 (7), 2672–2677. doi:10.1073/pnas.1113019109
Merino Tejero, E., Lashgari, D., García-Valiente, R., Gao, X., Crauste, F., Robert, P. A., et al. (2020). Multiscale Modeling of Germinal center Recapitulates the Temporal Transition from Memory B Cells to Plasma Cells Differentiation as Regulated by Antigen Affinity-Based Tfh Cell Help. Front. Immunol. 11 (620716), 620716–620815. doi:10.3389/fimmu.2020.620716
Meyer-Hermann, M., Mohr, E., Pelletier, N., Zhang, Y., Victora, G. D., and Toellner, K.-M. (2012). A Theory of Germinal center B Cell Selection, Division, and Exit. Cel Rep. 2 (1), 162–174. doi:10.1016/j.celrep.2012.05.010
Miyazaki, K. (2016). Treatment of Diffuse Large B-Cell Lymphoma. J. Clin. Exp. Hematopathol 56 (2), 79–88. doi:10.3960/jslrt.56.79
Mlynarczyk, C., Fontán, L., and Melnick, A. (2019). Germinal center‐derived Lymphomas: The Darkest Side of Humoral Immunity. Immunol. Rev. 288 (1), 214–239. doi:10.1111/imr.12755
Pasqualucci, L., Compagno, M., Houldsworth, J., Monti, S., Grunn, A., Nandula, S. V., et al. (2006). Inactivation of the PRDM1/BLIMP1 Gene in Diffuse Large B Cell Lymphoma. J. Exp. Med. 203 (2), 311–317. doi:10.1084/jem.20052204
Pasqualucci, L., Trifonov, V., Fabbri, G., Ma, J., Rossi, D., Chiarenza, A., et al. (2011). Analysis of the Coding Genome of Diffuse Large B-Cell Lymphoma. Nat. Genet. 43 (9), 830–837. doi:10.1038/ng.892
Polo, J. M., Juszczynski, P., Monti, S., Cerchietti, L., Ye, K., Greally, J. M., et al. (2007). Transcriptional Signature with Differential Expression of BCL6 Target Genes Accurately Identifies BCL6-dependent Diffuse Large B Cell Lymphomas. Proc. Natl. Acad. Sci. U.S.A. 104 (9), 3207–3212. doi:10.1073/pnas.0611399104
Robert, P. A., Jönsson, H., and Meyer-Hermann, M. (2018). MoonFit, a Minimal Interface for Fitting ODE Dynamical Models, Bridging Simulation by Experimentalists and Customization by C++ Programmers. bioRxiv, 1–24.
Roschewski, M., Dunleavy, K., and Wilson, W. H. (2012). Diffuse Large B Cell Lymphoma: Molecular Targeted Therapy. Int. J. Hematol. 96, 552–561. Springer. doi:10.1007/s12185-012-1198-3
Roy, K., Mitchell, S., Liu, Y., Ohta, S., Linsheng, Y.-s., Metzig, M. O., et al. (2019). A Regulatory Circuit Controlling the Dynamics of NFκB cRel Transitions B Cells from Proliferation to Plasma Cell Differentiation. Immunity 50 (3), 616–628. e1-6. doi:10.1016/j.immuni.2019.02.004
Saito, M., Gao, J., Basso, K., Kitagawa, Y., Smith, P. M., Bhagat, G., et al. (2007). A Signaling Pathway Mediating Downregulation of BCL6 in Germinal center B Cells Is Blocked by BCL6 Gene Alterations in B Cell Lymphoma. Cancer cell 12 (3), 280–292. doi:10.1016/j.ccr.2007.08.011
Shlomchik, M. J., Luo, W., and Weisel, F. (2019). Linking Signaling and Selection in the Germinal center. Immunol. Rev. 288, 49–63. doi:10.1111/imr.12744
Sugimoto-Ishige, A., Harada, M., Tanaka, M., Terooatea, T., Adachi, Y., Takahashi, Y., et al. (2020). BIM Establishes the B-Cell Repertoire from Early to Late in the Immune Response. Int. Immunol. 33 (2), 79–90. doi:10.1093/intimm/dxaa060
Thaunat, O., Granja, A. G., Barral, P., Filby, A., Montaner, B., Collinson, L., et al. (2012). Asymmetric Segregation of Polarized Antigen on B Cell Division Shapes Presentation Capacity. Science 335 (6067), 475–479. doi:10.1126/science.1214100
Venturutti, L., Teater, M., Zhai, A., Chadburn, A., Babiker, L., Kim, D., et al. (2020). TBL1XR1 Mutations Drive Extranodal Lymphoma by Inducing a Pro-tumorigenic Memory Fate. Cell 182 (2), 297e1–31627. doi:10.1016/j.cell.2020.05.049
Versypt, A. N. F. (2021). Multiscale Modeling in Disease. Curr. Opin. Syst. Biol. 27 (100340), 1–8. doi:10.1016/j.coisb.2021.05.001
Victora, G. D., Schwickert, T. A., Fooksman, D. R., Kamphorst, A. O., Meyer-Hermann, M., Dustin, M. L., et al. (2010). Germinal center Dynamics Revealed by Multiphoton Microscopy with a Photoactivatable Fluorescent Reporter. Cell 143 (4), 592–605. doi:10.1016/j.cell.2010.10.032
Weisel, F. J., Zuccarino-Catania, G. V., Chikina, M., and Shlomchik, M. J. (2016). A Temporal Switch in the Germinal center Determines Differential Output of Memory B and Plasma Cells. Immunity 44 (1), 116–130. doi:10.1016/j.immuni.2015.12.004
Wittenbrink, N., Klein, A., Weiser, A. A., Schuchhardt, J., and Or-Guil, M. (2011). Is There a Typical Germinal Center? A Large-Scale Immunohistological Study on the Cellular Composition of Germinal Centers during the Hapten-Carrier-Driven Primary Immune Response in Mice. J.I. 187 (12), 6185–6196. doi:10.4049/jimmunol.1101440
Yeh, Y.-C., Corbin, E. A., Caliari, S. R., Ouyang, L., Vega, S. L., Truitt, R., et al. (2017). Mechanically Dynamic PDMS Substrates to Investigate Changing Cell Environments. Biomaterials 145, 23–32. doi:10.1016/j.biomaterials.2017.08.033
Keywords: diffuse large B-cell lymphoma, germinal center, plasma cell differentiation, multi-scale modeling, tumorigenic alterations
Citation: Merino Tejero E, Mao Q, Lashgari D, García-Valiente R, Robert PA, Meyer-Hermann M, Rodríguez Martínez M, Guikema JEJ, Hoefsloot HHC and van Kampen AHC (2022) Multi-Scale Modeling Recapitulates the Effect of Genetic Alterations Associated With Diffuse Large B-Cell Lymphoma in the Germinal Center Dynamics. Front. Syst. Biol. 2:864690. doi: 10.3389/fsysb.2022.864690
Received: 28 January 2022; Accepted: 10 March 2022;
Published: 27 April 2022.
Edited by:
Claudio Angione, Teesside University, United KingdomReviewed by:
Carlos Villarreal, National Autonomous University of Mexico, MexicoMarissa Renardy, Applied BioMath, United States
Copyright © 2022 Merino Tejero, Mao, Lashgari, García-Valiente, Robert, Meyer-Hermann, Rodríguez Martínez, Guikema, Hoefsloot and van Kampen. This is an open-access article distributed under the terms of the Creative Commons Attribution License (CC BY). The use, distribution or reproduction in other forums is permitted, provided the original author(s) and the copyright owner(s) are credited and that the original publication in this journal is cited, in accordance with accepted academic practice. No use, distribution or reproduction is permitted which does not comply with these terms.
*Correspondence: Antoine H. C. van Kampen, YS5oLnZhbmthbXBlbkBhbXN0ZXJkYW11bWMubmw=
†Present address: Philippe A. Robert, Department of Immunology, University of Oslo, Oslo, Norway