 Eliezer Flores-Garza
 Mario A Zetter
 Rogelio Hernández-Pando2*
 Elisa Domínguez-Hüttinger
- 1Departamento de Biología Molecular y Biotecnología, Instituto de Investigaciones Biomédicas, Universidad Nacional Autónoma de México, Mexico City, Mexico
- 2Sección de Patología Experimental, Departamento de Patología, Instituto Nacional de Ciencias Médicas y Nutrición Salvador Zubirán, Mexico City, Mexico
Tuberculosis is a worldwide persistent infectious disease. It is caused by bacteria from the Mycobacterium tuberculosis complex that mainly affects the lungs and can be fatal. Using an integrative systems biology approach, we study the immunopathological progression of this disease, analyzing the key interactions between the cells involved in the different phases of the infectious process. We integrated multiple in vivo and in vitro data from immunohistochemical, serological, molecular biology, and cell count assays into a mechanistic mathematical model. The ordinary differential equation (ODE) model captures the regulatory interplay between the phenotypic variation of the main cells involved in the disease progression and the inflammatory microenvironment. The model reproduces in vivo time course data of an experimental model of progressive pulmonary TB in mouse, accurately reflecting the functional adaptations of the host–pathogen interactions as the disease progresses through three phenotypically different phases. We used the model to assess the effect of genotypic variations (encoded as changes in parameters) on disease outcomes. For all genotypes, we found an all-or-nothing response, where the virtual mouse either completely clears the infection or suffers uncontrolled Tb growth. Results show that it is 84% probable that a mouse submitted to a progressive pulmonary TB assay will end up with an uncontrolled infection. The simulations also showed how the genotypic variations shape the transitions across phases, showing that 100% of the genotypes evaluated eventually progress to phase two of the disease, suggesting that adaptive immune response activation was unavoidable. All the genotypes of the network that avoided progressing to phase 3 cleared the infection. Later, by analyzing the three different phases separately, we saw that the anti-inflammatory genotype of phase 3 was the one with the highest probability of leading to uncontrolled bacterial growth, and the proinflammatory genotype associated with phase 2 had the highest probability of bacterial clearance. Forty-two percent of the genotypes evaluated showed a bistable response, with one stable steady state corresponding to infection clearance and the other one to bacteria reaching its carrying capacity. Our mechanistic model can be used to predict the outcomes of different experimental conditions through in silico assays.
1 Introduction
Tuberculosis (TB) is a worldwide persistent infectious disease caused by bacteria from the Mycobacterium tuberculosis complex that mainly affects the lungs and can be fatal (Pai et al., 2016). It is one of the top 10 causes of death worldwide and approximately a quarter of the world’s population is latently infected (WHO, 2019). Its high prevalence is, among other factors, a result of the ineffectiveness of treatments for the prevention and reversal of the infectious process. Such ineffectiveness is attributed to the heterogeneous constitution of the bacterial genotypes, antibiotic-resistant strains, and expensive treatments (Smith, 2003). Efficient treatments are difficult to establish as some stages of TB progression are clinically subtle and there is a lack of understanding of the molecular mechanisms behind them (Salvatore and Zhang, 2017). Using an integrative systems biology approach, we can study the immunopathological progression of this disease, describing the dynamics of the host–pathogen interactions in a qualitative and quantitative way that goes beyond the current capacity of experimental studies (Reynolds, 2014).
The holistic approach of systems biology in medicine offers a unique way to develop personalized treatment strategies, taking full advantage of clinical and experimental data sets (Loscalzo and Barabasi, 2011). From mathematical models that predict and explain the molecular mechanisms behind skin diseases such as atopic dermatitis (Dominguez-Hüttinger et al., 2017) and upper airway infection by Streptococcus pneumoniae (Domínguez-Hüttinger et al., 2017a) to modeling the dynamics of signaling networks behind the development and progression of cancer (Du and Elemento, 2015), there is a wide range of pathologies that have already been addressed by the discipline (Barber et al., 2021; Reynolds et al., 2006). Mathematical TB models have been proposed to represent the transmission of the disease at the epidemiological level (Trauer et al., 2014) and to assess the impact of risk factors and treatments on the population (Dowdy et al., 2008). Agent-based models that describe the progression of TB infection at a tissue level have been formulated (Wigginton and Kirschner, 2001; Segovia-Juarez et al., 2004). At the cellular level, ODE models that describe the host–pathogen interactions have been formulated (Wigginton & Kirschner, 2001; Magombedze et al., 2006). However, a minimal ODE model that describes how the host–pathogen interactions are dynamically regulated through the different phases of TB progression has not been formulated until now.
In the present work, we propose an ODE model that describes the interactions that occur at cellular level throughout the immunopathological progression of active pulmonary TB in an in vivo mouse model. Specifically, we model the interactions between bacteria and macrophages, which are the main effectors of the TB progression, and how these interactions are shaped by adaptive immune responses that dynamically change as TB progresses. The model is built, calibrated, and validated by integrating a vast number of in vivo and in vitro published experimental assays (Supplementary Table S1). The model mechanisms replicate the qualitative behaviors of the macrophage and bacterial population dynamics observed in in vivo studies, with an initial slow bacterial growth accompanied by gradual macrophage recruitment (phase 1), followed by a sharp rise in both macrophages and bacterial population (phase 2) and finally macrophage population decreasing their protection efficiency and bacteria reaching its maximum values (phase 3). Furthermore, our model captures how these phases are shaped by the key adaptive immune response players, namely Th1, Th2, and dendritic cells and protective cytokines such as TNFα.
The model can predict possible disease outcomes for different genotypes of mice by simulating the interaction between a range of host genotypes with greater or lesser immune response capacity and a range of pathogen genotypes with different degrees of virulence through parameter modulation. Two disease outcomes emerged, bacterial clearance and uncontrolled bacterial growth, and this all-or-nothing behavior persisted through all the phenotype space. The probability of ending up with an uncontrolled TB infection showed up to be very high (84%). This is in accordance with the progressive pulmonary TB experimental model that our model aims to replicate, which is designed so that a successful progressive TB infection is established on the mouse, resembling the active pulmonary TB of humans. The transitions across phases of disease progression show that in all cases, adaptive immune response (phase 2) needs to be recruited and that an intense anti-inflammatory response (phase 3) might be detrimental to the organisms in terms of bacterial clearance. Additionally, we sampled host and pathogen genotypes from the three different phases and studied their long-term behavior in absence of disease progression. Almost half of these genotypes showed a bistable behavior, one being the stable behavior, bacterial clearance, and the other one is the uncontrolled bacterial growth. Genotypes sampled from phase 3 (anti-inflammatory) showed only a 7% chance of bacterial clearance; meanwhile, phase 1 (preparation) and phase 2 (proinflammatory) showed a 32% and 53% chance, respectively. Thus, genotypes sampled from phase 2 have the highest probability of mapping to an infection clearance phenotype across the three phases.
This model provides a powerful tool to test the effect of specific alterations of the host–pathogen interactions over the outcome of the infection. These in silico experiments can lead to future experimentation and help reduce the number of in vivo experiments.
2 Results
2.1 Mathematical Model of the Immunopathological Progression of Tuberculosis
Our mathematical model of the progression of a TB infection (Figures 1A, B) is a systems-level representation of the key interactions between the effector cells of the immune response—namely, macrophages—and the pathogen observed in vivo on mouse models.
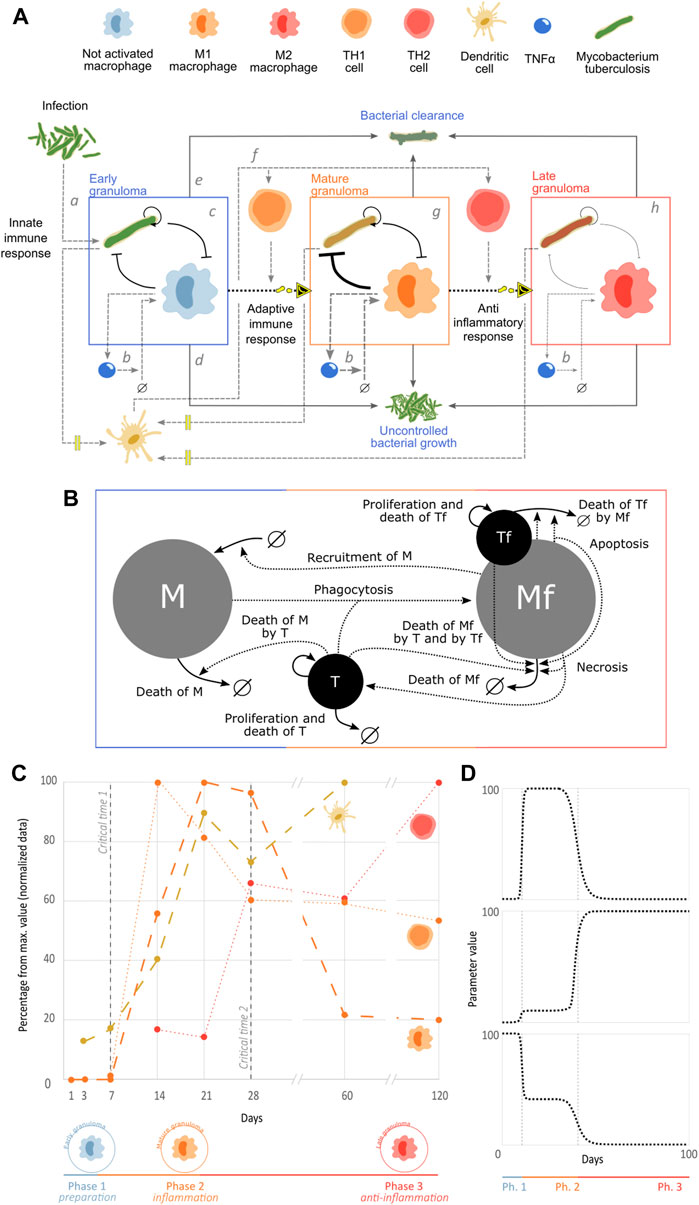
FIGURE 1. Mathematical model of the immunopathological progression of tuberculosis. (A) Stages of the immunopathological progression of tuberculosis infection in mice. (B) Graphical representation of the network of interactions of the population dynamics in granulomas. (C) Three phases of disease progression. We integrated counts of TH1 (orange) and TH2 (red) cells in granuloma (Hernández-Pando et al., 1996), dendritic cells in lung (yellow) (Pedroza-González et al., 2004), and concentration of iNOS mRNA expression that represents M1 macrophages (orange) (Hernández-Pando et al., 2001). In all cases, the BALB/c mouse was inoculated with 106 M. tuberculosis H37Rv bacteria. The data were normalized to their maximum percentage to allow comparison. (D) Example of how an adaptable parameter can change through the different phases of the infectious process.
The first stage of the infectious process is the primary infection (Figure 1Aa). After natural bacterial infection in humans or inoculation of the mouse, generally through the aerial route (intratracheal instillation or aerosol infection) (Hernandez-Pando et al., 1995; Hernández-Pando et al., 1996), the pathogen reaches the pulmonary alveoli where it is recognized by non-activated macrophages (Wolf et al., 2007). Macrophages then phagocyte bacteria, and because of their non-activated state, bacilli are not efficiently eliminated. Thus, the macrophages generally serve as a reservoir for the bacteria, which proliferate there, eventually causing apoptosis of these host cells (Cohen et al., 2018). During this early stage, bacteria stimulate the phagocytic cells, triggering secretion of cytokines such as tumor necrosis factor alpha (TNFα) which permeabilizes the vascular endothelium and attracts circulating monocytes to the site of infection, which then differentiate into non-activated macrophages upon entering the infected tissue (Figure 1Ab) (Shi & Pamer, 2011). Together with small populations of dendritic cells and polymorphonuclear leukocytes, this regulatory network formed between Tb and non-activated macrophages forms the early granuloma that characterizes phase 1 of TB (Figure 1Ac) (García-Romo et al., 2004). In cases of very severe and virulent infections, this can lead to uncontrolled bacterial growth, macrophage necrosis, and, in humans, signs and symptoms due to tissue damage such as coughing up blood, chest pain, difficulty in breathing, fever, fatigue, and cachexia, which is called primary active TB (Figure 1Ad) (Mayo Clinic, no date). On the other hand, infection can be mild and/or the immune system can be fit, ending up in the clearance of the bacterial population (Figure 1Ae). These two outcomes are possible through all the disease progression.
After there is a sufficient quantity of bacteria available in the area of infection, some will be phagocytosed by dendritic cells, which will migrate to the closest lymph nodes, where they present M. tuberculosis antigens through major histocompatibility complex type II (MHC-II) molecules to immature CD4+ T lymphocytes; this interaction is co-stimulated by the link between the dendritic cell membrane receptor B7 and the T cell-stimulating molecule CD28 that in the presence of interleukin (IL)-12 in the microenvironment, triggers the maturation of CD4+ T cells into “proinflammatory” TH1 cells (Figure 1Af) (Alberts et al., 2002). The TH1 cells then migrate from the lymph nodes to the lung infection sites and secrete IFNγ, which, together with co-stimulation by interactions between CD40 molecules on the surface of macrophages and CD40L on the surface of TH1 cells, activates the macrophages, differentiating them into M1 macrophages (Hernández-Pando et al., 1996), which are characterized by high production of reactive oxygen species (ROS, oxidative burst), maturation of their phagolysosomes, and production of antimicrobial molecules (RNI, NO, NOS2, defensins, etc.) (Ley, 2017). As a result of the effects of the recruited adaptive immune response, the early granuloma will become a mature granuloma, which is more efficient in eliminating bacteria thanks to its activated M1 macrophages (Figure 1Ag) (Hernández-Pando et al., 2001). Due to the high burden of bacteria that is necessary to induce experimental models of progressive pulmonary TB (
Although there are multiple host cells that participate in the onset and progression of TB (Davis & Ramakrishnan, 2009), macrophages are the direct effectors of the immune response (Hernández-Pando et al., 2001). Therefore, the interplay between these cells and M. tuberculosis is the key host–pathogen interactions that occur in TB at the cellular level.
Our mathematical model is a formal representation of the dynamical interplay between alveolar macrophages and M. tuberculosis that occurs in granulomas (Figure 1B). The ODE model consists of four state variables: free macrophages (
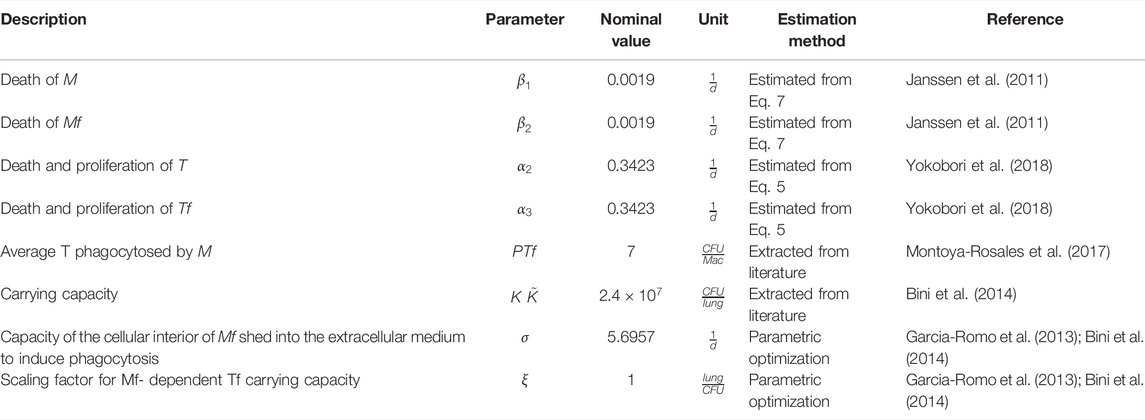
TABLE 1. Fixed nominal model parameters.

TABLE 2. Modulable model parameters.
Tuberculosis is a progressive disease, with immune responses changing their phenotype over time. Our in vivo data set reflects these changes, with the three clearly distinguishable phases shown in Figure 1C. As the main role of the dendritic cells is to sense bacteria, the pathogen levels are represented through these cells. Initially, in phase 1, no adaptive immune cells are present in the system. Phase 2 shows a clear peak in TH1 cells, which play a proinflammatory and antimicrobial role. TH1 cells then decrease while the anti-inflammatory Th2 cells increase in phase 3. These three phases correspond, thus, to a preparation phase on days 0–6, an inflammatory phase on days 7–27, and an anti-inflammatory phase on days 28–120. Phase 1 corresponds to the early granuloma, where the non-active macrophages interact with the pathogen and prepare the recruitment of the adaptive immune response. Phase 2 corresponds to the mature granuloma and a large number of M1 macrophages that have been recruited and activated by the TH1 cells. Phase 3 corresponds to a late granuloma, with a higher number of TH2 cells at the site of infection, leading to a sharp decrease in the number of M1 macrophages accompanied by a dramatic increase in M2 types of macrophages.
The model represents these three phases by dynamically changing kinetic rates that are affected by macrophage differentiation in response to the accumulating bacterial population. These rates, denoted by dotted arrows in Figure 1B, are the levels of recruitment, phagocytosis, and antimicrobial capacity which change dramatically between M1, M2, and not activated macrophages. Additionally, their apoptosis and necrosis rates are modulated since both cell deaths appear in different proportions at different stages of infection. Since bacteria adapt to the challenge imposed by the immune system (Montoya-Rosales et al., 2017), their killing capacity is modulated throughout the phases. Parameters change dramatically between each phase of disease progression (Figure 1D) to emulate the abrupt changes in phenotypes that occur in in vivo studies (Figure 1C).
The optimal values of the 16 parameters of the model were obtained using experimental data, either from direct measurements, estimated from quantitative in vitro studies by implementing simplified versions of our in vivo model or by parameter optimization of the full model from in vivo studies, as detailed in Methods section. Most of the data come from our own wet lab, minimizing the batch effects and therefore the margin of error in the estimation since, despite being different studies, the experimental conditions such as mouse strain, bacterial strain, number of bacteria used for inoculation, and frequency of sampling, among others, remain constant. Tables 1 and 2 describe the parameters for each reaction.
In Figure 2A we see the result of simulating our model with optimal parameters. We plot the trajectories of the compound variables of the model
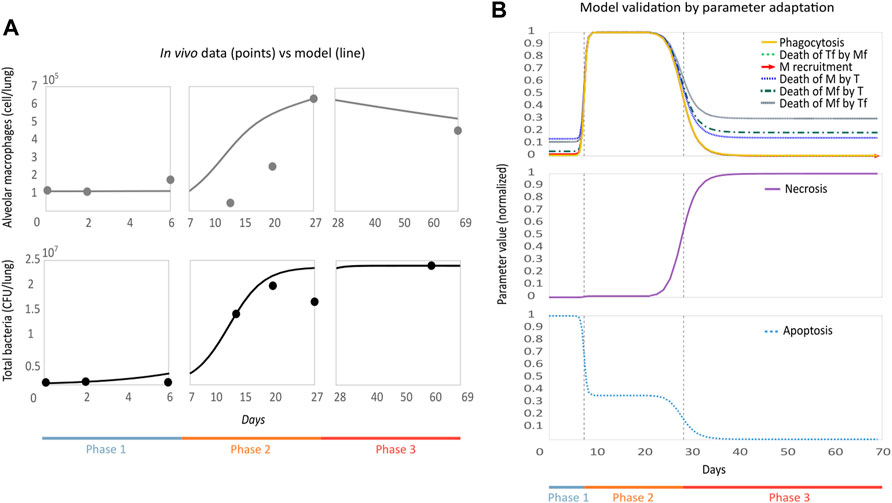
FIGURE 2. Parametric optimization and validation of the model. (A) Model replicates in vivo behavior. The model (solid line) was plotted together with the in vivo experimental data set (points) used for optimization. On the vertical axis, we see macrophages and total bacteria, and on the horizontal axis, we have time. (B) Behavior of the modulable parameters throughout the phases is biologically accurate. Normalized parameter values are on the vertical axis and time on the horizontal. The dotted lines indicate the phase change threshold, depending on the case, the parameter will increase or decrease its value when passing this threshold.
We plot the changes in the modulable parameters’ values over time (Figure 2B). Depending on their function, the parameters will decrease or increase between each phase. In phase 1, macrophage recruitment (
2.2 Construction of a Disease-Transition Map for Predicting the Most Likely Outcomes of the Immunopathological Progression of Tuberculosis
To explore possible disease outcomes resulting from variations in the host and pathogen genotypes, we performed simulations of the in vivo model under parameter variations. We produced a cohort of 500 virtual mice by varying the 16 parameters around the nominal values corresponding to the optimal set of phase 1 and performed numerical integrations for each randomly generated set. As before, we allowed the modulable parameters to adapt in response to the accumulating bacterial population, which resulted in virtual disease trajectories going through a variable number of phase transitions. Figure 3A shows simulations whose last phase was phase 2 or 3. All sampled genotypes progressed from phase 1 without clearing the infection, which indicates that there is no sampled genotype capable of eliminating the bacterial population without recruiting the adaptive immune response. Since phase progression dynamically depends on bacterial numbers, simulations stationed in phase 2 represent those genotypes with an adaptive immune system capable of eradicating the infection. Additionally, we see that
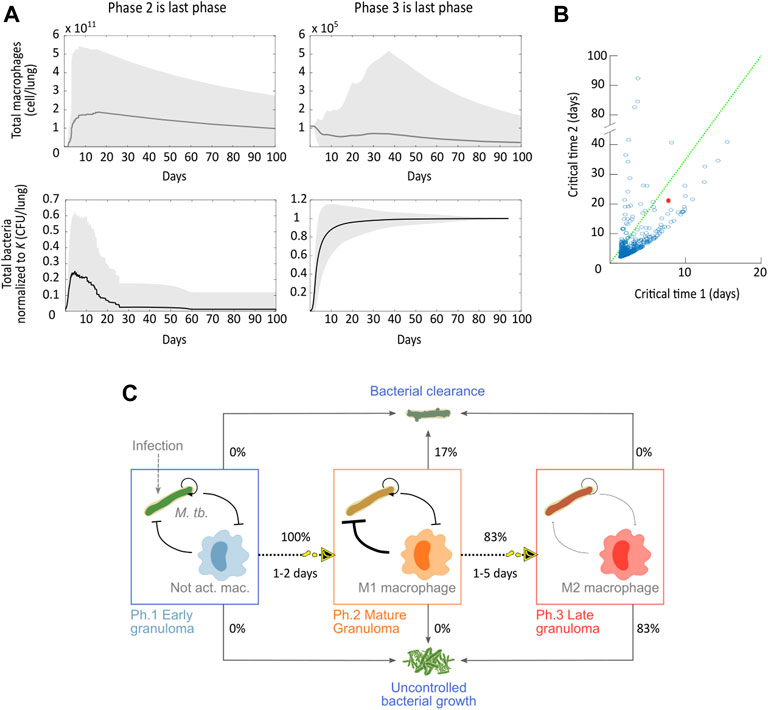
FIGURE 3. Disease-transition of the immunopathological progression of tuberculosis. (A) Compound variables
In Figure 3B, we analyzed how the critical times in which a phase transition occurs are distributed for the sampled genotypes. Recall that these critical times correspond to the times at which bacteria reach a population threshold and thereby activate a response from the host. While in the original dataset, the model enters phase 2 on day 7, in general, this critical time 1 is more densely distributed between days 1 and 2. As for the critical time 2, our simulations show that late granulomas can already form within a week post-bacterial challenge. These accelerated immunopathological transitions are consistent with the rapidly progressing disease dynamics observed for more aggressive bacterial strains, such as the Beijing strain (Aguilar L et al., 2010). Critical times that are higher than the nominal ones correspond to organisms that opposed greater resistance to the progression of the disease.
When analyzing the disease outcomes on all the genotype network (Figure 3A), only two phenotypes persisted: bacterial clearance and uncontrolled bacterial growth. This all-or-nothing behavior is consistent with the experimental model of progressive pulmonary TB in mice, where there is no coexistence between mice and bacteria (Garcia-Romo et al., 2013; Bini et al., 2014). Information about disease outcomes across all the genotype networks grouped with the critical times allowed us to build a predictive disease progression map (Figure 3C). We see that all the simulations transitioned from phase 1 to phase 2. All the simulations that avoided phase 3 cleared the infection, and those that transitioned to the final phase developed an uncontrolled bacterial growth. These results show that when starting from the initial conditions used in an experimental model of progressive pulmonary TB in mouse, it is 83% likely that the mice will suffer an aggressive symptomatic disease under variations of the mice and the bacteria genotypes (strains). Also, the fact that all the simulations that transitioned to phase 3 have an uncontrolled bacterial growth suggests that the anti-inflammatory response is a key determinant in the host–pathogen interaction. Only those simulated disease trajectories that effectively cleared the infection could avoid transitioning to phase 3.
2.3 Long-Term Behavior of the Different Phases Reveals All-or-Nothing Outcomes
To explore the influence of the immune response phenotype on the disease outcome, we sampled genotypes from the three different phases and studied their long-term behavior in a hypothetical scenario where the organism can start from any phase and there’s no change of phases. We varied all parameters from each optimal set and produced 500 random sets from each (1,500 total), and then equilibrium points for each set were obtained exactly (for details see Methods section).
In accordance with the dynamical simulations (Figure 3), the only long-term disease outcomes found was the all-or-nothing behavior where the system either clears the infection or allows bacteria to grow out of control; Figures 4A, B show the frequency in which simulations sampled from each phase end up in either of these two possible outcomes. Phase 2 showed the highest probability of bacterial clearance among phases (53%), suggesting that a recently stimulated immune system that still has active adaptive immune response cells has a chance of clearing even an aggressive infection, such as the experimental model of progressive pulmonary TB. The BCG vaccine, the most common prevention method for TB infection used worldwide, is believed to generate protective immunity through this mechanism (Ritz et al., 2008). Genotypes locked in phase 1 showed a 32% chance of clearing the infection; however, these genotypes needed between 108 and 1011 macrophages to achieve the task while phase 2 genotypes needed 105–109 and performed better. This demonstrates that macrophage activation is crucial for bacterial clearance and for preventing excessive inflammation, which can also result in disease (Furman et al., 2019). Finally, phase 3 phenotypes had a 7% chance of clearing the infection, and, as expected, this anti-inflammatory phase had the lowest macrophage load needed to clear the infection (105–107). The low chance of infection clearance may be a price too high to pay for the tissue-preserving anti-inflammatory response recruitment.
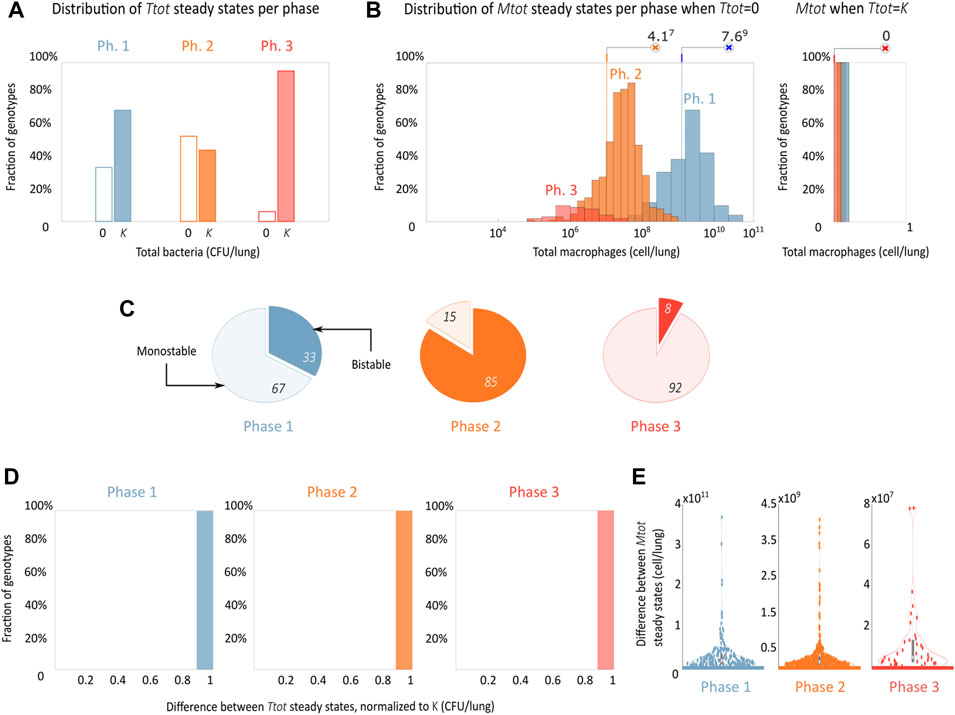
FIGURE 4. The disease outcome shows an all-or-nothing phase-dependent behavior. (A,B) Steady-state distribution of disease outcomes shows the probability of bacterial clearance and of uncontrolled growth and its associated final macrophage concentrations in a basal (phase 1), inflammatory (phase 2), and anti-inflammatory (phase 3) environment. A set of 500 genotypes was sampled for each phase. (C) Proportion of mono and bistability found in each phase, the clear part of the pie graph indicates monostability and the filled bistability. (D,E) Distributions of the differences of bacteria and macrophages between the two stable steady states for the bistable genotypes.
We also saw the appearance of bistability in the system, which is present in all phases and is more frequent in phase 2 (Figure 4C). Also herein, we observe a dramatic phenotypic segregation, with all the bistable cases displaying an all-or-nothing behavior with one stable steady state corresponding to uncontrolled bacterial growth (
3 Discussion
The mechanisms behind the immunopathological progression of TB have not been fully understood, and this makes the creation of more efficient treatments difficult. Based on experimental data from the literature, we propose a minimal mathematical model that represents the key regulatory mechanisms that can account for the pathological progression of TB through the three phases observed in in vivo mouse models. The model describes not only the interactions between the main effector of the immune response and the pathogen but also how these interactions are modulated by the inflammatory microenvironment. For its construction, we integrated data from a total of 75 experimental assays from different published manuscripts. The model coherently replicates the changes that the main molecular mechanisms undergo through the progression of the infection by the dynamic modulation of its parameters. With simulation analysis, we observed how the model is segregated depending on its initial parameter conditions by qualitatively different phenotypes. This model is a tool to study the interactions between the effector cells of the immune response and M. tuberculosis and allows the proposal of hypotheses related to current therapeutic problems, offering potential future use in clinical and experimental strategies for the design and search of new TB treatments.
Our model also reproduces the abrupt phenotypic changes shown by the immune system and the bacteria throughout the progression of an experimental model of progressive pulmonary TB in mouse (Figure 1C), specifically, from an early phase where there is relatively low activity in all cells involved, going by an intermediate phase characterized by the growth of the bacterial population and the increase in the recruitment of macrophages due to the initiation of the adaptive immune response, to an advanced phase where bacteria grow to their carrying capacity and alveolar macrophages lose their efficiency due to the effect of anti-inflammatory mechanisms of tissue preservation (i.e., TH2 cytokines). Even though our mathematical model has three different phases because of the experimental model it replicates, there are other types of mice models like the latent TB model (Arriaga et al., 2002) that use a significantly lower dose of bacteria (4,000 bact.) and a different strain of mice (C57B1). This produces a slow progression infection that results in an extended phase 2 and a lack of phase 3.
The phase changes are emulated by the model through the continuous modulation of eight of its parameters (Table 2). This type of dynamic adaptation of values of parameters that underlie the different immunopathological stages of a disease was proposed for the first time by Tiemann et al. (2011) and van Riel et al. (2013). Therefore, the ADAPT algorithm is proposed for adjusting a model to different data sets corresponding to different phases of a progressive phenomenon and identifying those parameters that change during the progression. This is, therefore, a strategy similar to ours. However, by dynamically modeling the changes with Hill equations that depend on the variables of our model, we are going one step further by mathematically representing these mechanisms that underlie parametric adaptation. The model was validated by analyzing the qualitative changes of the modulated parameters through the phases; indeed, we found that all changes were biologically accurate. Although we modeled the macrophage and bacteria phenotype transition in a phenomenological way, in the future, it could be carried out by coupling a Boolean network that models this phenotypical plasticity like the macrophage differentiation model proposed by Palma et al. (2018).
We explored the effects of genotypic variations on disease outcomes and progression by simulating disease trajectories from 1,500 randomly sampled parameter sets. We observed that mice are not capable of eliminating the infection without recruiting the adaptive immune response and that its recruitment does not guarantee bacteria elimination by the immune system since only for certain combinations of the enhanced immune system and not-so-virulent bacteria, the organism cleared the infection. Accordingly, experimental assays have been carried out testing a broad spectrum of M. tuberculosis genotypes that demonstrate variability in virulence and in induced immune response (Marquina-Castillo et al., 2009; Hernández-Pando et al., 2012). In particular, the Beijing genotype is of special interest because of its association with numerous outbreaks worldwide (Glynn et al., 2002) and the hyper-aggressive infection and non-conventional immunopathological events that have been shown to evoke (Aguilar L et al., 2010; López et al., 2003). Our model sets a work frame for future studies of this and other genotypes of bacteria.
Using the random parameter sets of the three phases, we obtained the equilibrium points of the system. The hypothetical long-term analysis allows us to visualize the space of possible outcomes of the model. The results indicate that the model can exist in two mutually exclusive stable states: macrophages between 104–1011 and bacteria at zero (clearance) and bacteria in their carrying capacity and macrophages at zero (uncontrolled growth), which clinically correspond to a severe symptomatic TB disease and to eradication of the infection, respectively. These behaviors are consistent with the experimental model of progressive pulmonary TB in mouse, where coexistence between bacteria and macrophages is not observed. Our steady-state analysis also shows that, for a significant proportion of parametric variations, the model exhibits bistability, with the stable coexistence of the two mutually exclusive outcomes of the infection. These results suggest that not only genetic variations but also the inflammatory microenvironment (phase 1, 2 vs. 3) and the initial macrophage and bacterial loads (bistable genotypes) could have a dramatic effect on the outcome of the infection. The parametric variations around the nominal values of phase 2 are the ones that have a higher probability to end up in bacterial clearance. This suggests that, from a therapeutic intervention design point of view, it may be important to promote the conditions that lead to and maintain phase 2, and this could be achieved by therapeutic interventions that strengthen macrophage recruitment and activation. On the other hand, transition to phase 3 could be blocked by preventing the activation of the anti-inflammatory response promoted by TH2 cells.
Although our model shows that, in the long term, only two disease outcomes (clearance and uncontrolled bacterial growth) are possible, it is important to acknowledge that coexistence between the host and the pathogen has been widely observed. Global clinical data shows that for humans, latent TB infection is the most common form of the disease (WHO, 2019), and this disease state is characterized by low bacteria levels residing inside fibrotic old granulomas. As our model reproduces a progressive pulmonary TB mouse infection, coexistence is never observed. However, an in silico reproduction of a TB infection could be achieved by appropriately changing the parameters and initial conditions of our model to mimic the mouse model of latent TB (Arriaga et al., 2002) that uses a significantly lower dose of bacteria (4,000 bact.) and a different strain of mice (C57B1).
Mathematical TB models that study the disease dynamics at the epidemiological level have been proposed previously, focusing on how the disease is transmitted and how treatments affect this transmission (Dowdy et al., 2008; Trauer et al., 2014), but without providing information on the underlying cellular mechanisms. At the cellular/tissue level, several agent-based models that describe granuloma formation have been proposed (Young et al., 2008; Marino & Kirschner, 2016; Pienaar et al., 2016; Evans et al., 2020). These models represent the interplay between a large number of variables compared with our four variable minimal model, making it more difficult to estimate the resulting large number of parameters from experimental data and to assess which mechanisms are the most influential on disease outcome. Additionally, mathematical analysis for in silico design and optimization of therapeutic interventions, such as bifurcation analysis as carried out in Domínguez-Hüttinger et al. (2017a), cannot easily be performed on agent-based models. At the cellular/molecular level, ODEs models that describe the host–pathogen interactions have been formulated before (Wigginton & Kirschner, 2001; Magombedze et al., 2006), but these models do not explicitly encompass how the disease progression through different phases of a TB infection emerges, how it shapes the phenotypes of both the host and the pathogen, and it dynamically affects disease outcome.
Here we propose, for the first time, a minimal, mechanistic ODE model of the immunopathological progression of TB. The model represents the dynamic modulation of the intra-host mechanisms that underly the development of TB across different disease phases. It was constructed, calibrated, and validated by integrating a wealth of in vivo and in vitro datasets. The model analysis allowed us to predict the most probable disease trajectories under host and pathogen genotypic variations and to pinpoint the key role that the initial conditions in bacterial and macrophage loads and in the inflammatory microenvironment play in determining the outcome of the disease. It is a step forward in understanding the mechanisms that shape TB progression.
4 Methods
4.1 Data Integration
Relevant experimental data to explain the immunopathological progression of TB were collected from different bibliographic sources, the biggest source being the published work from the Laboratory of Experimental Pathology at the National Institute of Medical Sciences and Nutrition Salvador Zubirán, Mexico City, Mexico. We were interested in collecting the largest amount of data from in vivo studies that used the same bacteria strain, H37Rv, and the same mouse strain, BALBc, to ensure the greatest possible coherence and minimal batch effects when integrating the data from different assays. When necessary, the raw data were extracted directly from figures using WebPlotDigitizer 4.4 (Rohatgi, 2020). The resulting database is given in Supplementary Table S1.
4.2 Model Construction
There are multiple cells of the immune response that participate in the containment of the infection; however, macrophages are the direct effectors of these responses. Therefore, we decided to put the macrophage as the centerpiece of the model. Together with bacteria, they represent the population dynamics in granulomas throughout the progression of the disease. The following mathematical model formally represents these dynamics:
Most terms of the system of the equation were built following the Guldberg and Waage Law of Mass Action, except for the bacterial growth rates for which we assumed a logistic rate. Terms with a negative sign decrease and positive terms increase the rate of change of the affected variable. The system parameters quantitatively represent the weight of each reaction in the network of interactions (Figure 1B).
Equation 1 represents the dynamics of macrophages. The arrival of
The immune system and the bacteria show different phenotypes throughout the disease progression. Our model captures these changes along the phases of progression through the modulation of the parameters marked with an
where

TABLE 3. In vivo data used for indirect parameter estimation.
4.3 Model Simulation
The solution of the model (Eq. 1) was approximated by numerical integration using ode15s. As the initial condition for
4.4 Parameter Optimization
We estimated the 16 model parameters following these three approaches:
1. Direct extraction of three parameters from the literature.
2. Direct estimation of five parameters using three different sets of in vitro data while fixing the parameters estimated in the previous step.
3. Indirect estimation of the remaining eight parameters by fitting the model results to two in vivo data sets simultaneously, fixing the previously estimated parameters.
4.4.1 Direct Extraction From Literature
4.4.1.1 Carrying Capacity K
The carrying capacity
4.4.1.2 Average Bacteria Phagocytosed by Macrophage PTf
The average number of bacteria phagocytosed by macrophages
4.4.2 Direct Estimation Using in Vitro Data
Leaving the previously estimated parameters fixed, we estimate the nominal values of five other parameters by integrating in vitro data into three sub-models of our main model. These sub-models represent in vitro experimental conditions in which not all the variables of our complete in vivo model are present.
4.4.2.1 Bacterial Growth
To estimate the growth of
4.4.2.2 Macrophage Death
To estimate the natural death of
4.4.2.3 Phagocytosis Rate
To estimate
To find the value of
• It is assumed that no parameter adaptations occur, since the in vitro assay contains no components of the adaptive immune system.
• It is assumed that there is no natural death of macrophages (
• It is assumed that there is no proliferation of bacteria (
• In Eq. 8.4, we also assume that there is no proliferation of bacteria (
With these assumptions, Eq. 2 can be reduced to
where Eq. 9 is uncoupled from Mf and Tf. If we additionally assume that the variable
where
4.4.3 Parameter Optimization From In Vivo Data
Leaving the previously estimated parameters fixed, we estimated the remaining eight parameters using global optimization algorithms, fitting the model simultaneously to two in vivo data sets detailed below by minimizing the cost function:
which quantifies the distance between the model (
Minimization was performed using MATLAB (version R2020a, SCR: 001622) using the GlobalSearch, a heuristic designed to find the global optimum for nonlinear problems.
For the system parameters that are modulated, their optimization was carried out three times, one for each phase of the disease. The parameter
The in vivo data sets used were a CD11c+ alveolar cell (macrophages) count from Garcia-Romo et al. (2013) and a total bacteria count from Bini et al. (2014) (Table 3); in both studies, the BALB/c mouse was put through the same bacterial challenge of 106 M. tuberculosis H37Rv. We assume the same uncertainties for all the data used.
According to our previous classification (Figure 1C), days 1, 3, and 7 are considered part of phase 1, days 14, 21, and 28 of phase 2, and days 60 and 70 of phase 3.
For phase 3, there were no readings for CD11c+ alveolar cell day 60 count, so we made an interpolation with days 28 and 70 to obtain an approximate count. For bacteria, there was no reading for day 70, but we used day 60 count since this is its carrying capacity (the maximum value that we assume it can reach).
4.5 Simulation and Analysis of Genotypic Variants
4.5.1 Parameter Sampling
Using the statistical method Latin hypercube sampling in MATLAB (version R2020a, SCR: 001622), we varied the 16 nominal parameters of the model in a multidimensional uniform distribution from 0.1 to 10. We produced 500 sets of random parameters from the nominal sets of each phase (1,500 sets in total).
4.5.2 Numerical Simulations
We performed numerical integrations with the 500 sets of random parameters sampled from phase 1 parameters using the ode15s function in MATLAB (version R2020a, SCR:001622), using a
4.5.3 Computation of Stable Equilibrium Points
For each parameter set, we obtained all the steady-state solutions using the vpasolvefunction in MATLAB (version R2020a, SCR:001622) and collected only those solutions that had only real and strictly negative eigenvalues in their Jacobian matrix.
Data Availability Statement
The code for the model construction and analysis presented in the study is publicly available in the GitHub (SCR:002630) repository https://github.com/eliezerflores/Tuberculosis-model. The database generated in the study are included in the article/Supplementary Material; further inquiries can be directed to the corresponding authors.
Author Contributions
EF-G, MZ, RH-P, and ED-H conceived the project, EF-G and ED-H designed the project, EF-G and ED-H did the theoretical and the numerical analysis, RH-P and MZ supervised the biological accuracy of the model formulation and data integration, and EF-G and ED-H wrote the manuscript. All authors approved the final manuscript.
Funding
EF-G was a master’s student from Posgrado en Ciencias Biológicas, Universidad Autónoma de México (UNAM) and recieved fellowship no. 736434 from the Consejo Nacional de Ciencia y Tecnología (CONACyT). ED-H acknowledges the Programa de Apoyo a Proyectos de Investigación e Innovación Tecnológica (PAPIIT) UNAM IA100119 and IA207822, CONACyT Ciencia de Frontera, project number 319600 and the College of Life Sciences of the Wissenschaftskolleg zu Berlin.
Conflict of Interest
The authors declare that the research was conducted in the absence of any commercial or financial relationships that could be construed as a potential conflict of interest.
Publisher’s Note
All claims expressed in this article are solely those of the authors and do not necessarily represent those of their affiliated organizations, or those of the publisher, the editors, and the reviewers. Any product that may be evaluated in this article, or claim that may be made by its manufacturer, is not guaranteed or endorsed by the publisher.
Supplementary Material
The Supplementary Material for this article can be found online at: https://www.frontiersin.org/articles/10.3389/fsysb.2022.912974/full#supplementary-material
References
Aguilar L, D. D., Hanekom, M., Mata, D., Gey Van Pittius, N. C., Van Helden, P. D., Warren, R. M., et al. (2010). Mycobacterium tuberculosis Strains with the Beijing Genotype Demonstrate Variability in Virulence Associated with Transmission. Tuberculosis 90 (5), 319–325. doi:10.1016/j.tube.2010.08.004
Alberts, B., Johnson, A., Lewis, J., Raff, M., Roberts, K., and Walter, P. (2002). Helper T Cells and Lymphocyte Activation.
Arriaga, A. K., Orozco, E. H., Aguilar, L. D., Rook, G. A. W., and Pando, R. H. (2002). Immunological and Pathological Comparative Analysis between Experimental Latent Tuberculous Infection and Progressive Pulmonary Tuberculosis. Clin. Exp. Immunol. 128 (2), 229–237. doi:10.1046/j.1365-2249.2002.01832.x
Barber, J., Carpenter, A., Torsey, A., Borgard, T., Namas, R. A., Vodovotz, Y., et al. (2021). Predicting Experimental Sepsis Survival with a Mathematical Model of Acute Inflammation. Front. Syst. Biol. 1, 5. doi:10.3389/FSYSB.2021.755913
Bini, E. I., Mata Espinosa, D., Marquina Castillo, B., Barrios Payán, J., Colucci, D., Cruz, A. F., et al. (2014). The Influence of Sex Steroid Hormones in the Immunopathology of Experimental Pulmonary Tuberculosis. PLoS ONE 9 (4), e93831–10. doi:10.1371/journal.pone.0093831
Bocchino, M., Galati, D., Sanduzzi, A., Colizzi, V., Brunetti, E., and Mancino, G. (2005). Role of Mycobacteria-Induced Monocyte/macrophage Apoptosis in the Pathogenesis of Human Tuberculosis. Int. J. Tuberc. Lung Dis. 9 (4), 375–383.
Bongiovanni, B., Mata-Espinosa, D., D'Attilio, L., Leon-Contreras, J. C., Marquez-Velasco, R., Bottasso, O., et al. (2015). Effect of Cortisol And/or DHEA on THP1-Derived Macrophages Infected with Mycobacterium tuberculosis. Tuberculosis 95 (5), 562–569. doi:10.1016/j.tube.2015.05.011
Cohen, S. B., Gern, B. H., Delahaye, J. L., Adams, K. N., Plumlee, C. R., Winkler, J. K., et al. (2018). Alveolar Macrophages Provide an Early Mycobacterium tuberculosis Niche and Initiate Dissemination. Cell Host Microbe 24 (3), 439–446. e4. doi:10.1016/j.chom.2018.08.001
Davis, J. M., and Ramakrishnan, L. (2009). The Role of the Granuloma in Expansion and Dissemination of Early Tuberculous Infection. Cell 136 (1), 37–49. doi:10.1016/j.cell.2008.11.014
Domínguez-Hüttinger, E., Boon, N. J., Clarke, T. B., and Tanaka, R. J. (2017a). Mathematical Modeling of Streptococcus Pneumoniae Colonization, Invasive Infection and Treatment. Front. Physiol. 8 (115), 1–14. doi:10.3389/fphys.2017.00115
Domínguez-Hüttinger, E., Christodoulides, P., Miyauchi, K., Irvine, A. D., Okada-Hatakeyama, M., Kubo, M., et al. (2017). Mathematical Modeling of Atopic Dermatitis Reveals "Double-Switch" Mechanisms Underlying 4 Common Disease Phenotypes. J. Allergy Clin. Immunol. 139, 1861–1872. doi:10.1016/j.jaci.2016.10.026
Dowdy, D. W., Chaisson, R. E., Maartens, G., Corbett, E. L., and Dorman, S. E. (2008). Impact of Enhanced Tuberculosis Diagnosis in South Africa: A Mathematical Model of Expanded Culture and Drug Susceptibility Testing. Proc. Natl. Acad. Sci. U.S.A. 105 (32), 11293–11298. doi:10.1073/pnas.0800965105
Du, W., and Elemento, O. (2015). Cancer Systems Biology: Embracing Complexity to Develop Better Anticancer Therapeutic Strategies. Oncogene 34 (25), 3215–3225. doi:10.1038/onc.2014.291
Evans, S., Butler, J. R., Mattila, J. T., and Kirschner, D. E. (2020). Systems Biology Predicts that Fibrosis in Tuberculous Granulomas May Arise through Macrophage-To-Myofibroblast Transformation. PLoS Comput. Biol. 16 (12), e1008520. doi:10.1371/JOURNAL.PCBI.1008520
Furman, D., Campisi, J., Verdin, E., Carrera-Bastos, P., Targ, S., Franceschi, C., et al. (20192019). Chronic Inflammation in the Etiology of Disease across the Life Span. Nat. Med. 2525 (1212), 1822–1832. doi:10.1038/s41591-019-0675-0
Garcia-Romo, G. S., Pedroza-Gonzalez, A., Aguilar-Leon, D., Orozco-Estevez, H., Lambrecht, B. N., Estrada-Garcia, I., et al. (2004). Airways Infection with Virulent Mycobacterium tuberculosis Delays the Influx of Dendritic Cells and the Expression of Costimulatory Molecules in Mediastinal Lymph Nodes. Immunology 112 (4), 661–668. doi:10.1046/j.1365-2567.2004.01904.x
Garcia-Romo, G. S., Pedroza-Gonzalez, A., Lambrecht, B. N., Aguilar-Leon, D., Estrada-Garcia, I., Hernandez-Pando, R., et al. (2013). Mycobacterium tuberculosis Manipulates Pulmonary APCs Subverting Early Immune Responses. Immunobiology 218 (3), 393–401. doi:10.1016/j.imbio.2012.05.022
Glynn, J. R., Whiteley, J., Bifani, P. J., Kremer, K., and Van Soolingen, D. (2002). Worldwide Occurrence of Beijing/W Strains of Mycobacterium tuberculosis: A Systematic Review. Emerg. Infect. Dis. 8 (8), 843–849. doi:10.3201/eid0805.020002
Golstein, P., and Kroemer, G. (2007). Cell Death by Necrosis: towards a Molecular Definition. Trends Biochem. Sci. 32, 37–43. doi:10.1016/j.tibs.2006.11.001
Hernández-Pando, R., Marquina-Castillo, B., Barrios-Payán, J., and Mata-Espinosa, D. (2012). Use of Mouse Models to Study the Variability in Virulence Associated with Specific Genotypic Lineages of Mycobacterium tuberculosis. Infect. Genet. Evol. 12 (4), 725–731. doi:10.1016/j.meegid.2012.02.013
Hernandez-Pando, R., Orozco, H., Honour, J., Silva, P., Leyva, R., and Rook, G. A. W. (1995). Adrenal Changes in Murine Pulmonary Tuberculosis; a Clue to Pathogenesis? FEMS Immunol. Med. Microbiol. 12 (1), 63–72. doi:10.1111/J.1574-695X.1995.TB00176.X
Hernández-Pando, R., Orozcoe, H., Sampieri, A., Pavón, L., Velasquillo, C., Larriva-Sahd, J., et al. (1996). Correlation between the Kinetics of Th1, Th2 Cells and Pathology in a Murine Model of Experimental Pulmonary Tuberculosis. Immunology 89 (1), 26–33.
Hernández-Pando, R., Schön, T., Orozco, E. H., Serafin, J., and Estrada-García, I. (2001). Expression of Inducible Nitric Oxide Synthase and Nitrotyrosineduring the Evolution of Experimental Pulmonary Tuberculosis. Exp. Toxicol. Pathology 53 (4), 257–265. doi:10.1078/0940-2993-00182
Janssen, W. J., Barthel, L., Muldrow, A., Oberley-Deegan, R. E., Kearns, M. T., Jakubzick, C., et al. (2011). Fas Determines Differential Fates of Resident and Recruited Macrophages during Resolution of Acute Lung Injury. Am. J. Respir. Crit. Care Med. 184 (5), 547–560. doi:10.1164/rccm.201011-1891OC
Ley, K. (2017). M1 Means Kill; M2 Means Heal. J. I. 199 (7), 2191–2193. doi:10.4049/jimmunol.1701135
López, B., Aguilar, D., Orozco, H., Burger, M., Espitia, C., Ritacco, V., et al. (2003). A Marked Difference in Pathogenesis and Immune Response Induced by Different Mycobacterium tuberculosis Genotypes. Clin. Exp. Immunol. 133 (1), 30–37. doi:10.1046/j.1365-2249.2003.02171.x
Loscalzo, J., and Barabasi, A. L. (2011). Systems Biology and the Future of Medicine. WIREs Mech. Dis. 3 (6), 619–627. doi:10.1002/wsbm.144
Magombedze, G., Garira, W., and Mwenje, E. (2006). Modelling the Human Immune Response Mechanisms to mycobacterium Tuberculosis Infection in the Lungs. Math. Biosci. Eng. MBE 3 (4), 661–682. doi:10.3934/MBE.2006.3.661
Marino, S., and Kirschner, D. (2016). A Multi-Compartment Hybrid Computational Model Predicts Key Roles for Dendritic Cells in Tuberculosis Infection. Computation 4 (4), 39. doi:10.3390/COMPUTATION4040039
Marquina-Castillo, B., García-García, L., Ponce-de-León, A., Jimenez-Corona, M.-E., Bobadilla-Del Valle, M., Cano-Arellano, B., et al. (2009). Virulence, Immunopathology and Transmissibility of Selected Strains ofMycobacterium Tuberculosisin a Murine Model. Immunology 128 (1), 123–133. doi:10.1111/j.1365-2567.2008.03004.x
Montoya-Rosales, A., Provvedi, R., Torres-Juarez, F., Enciso-Moreno, J. A., Hernandez-Pando, R., Manganelli, R., et al. (2017). lysX Gene Is Differentially Expressed Among Mycobacterium tuberculosis Strains with Different Levels of Virulence. Tuberculosis 106, 106–117. doi:10.1016/j.tube.2017.07.005
Pai, M., Behr, M. A., Dowdy, D., Dheda, K., Divangahi, M., Boehme, C. C., et al. (2016). Tuberculosis. Nat. Rev. Dis. Prim 2, 16076. doi:10.1038/nrdp.2016.76
Palma, A., Jarrah, A. S., Tieri, P., Cesareni, G., and Castiglione, F. (2018). Gene Regulatory Network Modeling of Macrophage Differentiation Corroborates the Continuum Hypothesis of Polarization States. Front. Physiol. 9 (November), 1–19. doi:10.3389/fphys.2018.01659
Pedroza-González, A., García-Romo, G. S., Aguilar-León, D., Calderon-Amador, J., Hurtado-Ortiz, R., Orozco-Estevez, H., et al. (2004). In Situ analysis of Lung Antigen-Presenting Cells during Murine Pulmonary Infection with Virulent Mycobacterium tuberculosis. Int. J. Exp. Pathology 85 (3), 135–145. doi:10.1111/j.0959-9673.2004.00381.x
Pienaar, E., Matern, W. M., Linderman, J. J., Bader, J. S., and Kirschner, D. E. (2016). Multiscale Model of Mycobacterium tuberculosis Infection Maps Metabolite and Gene Perturbations to Granuloma Sterilization Predictions, Infect. Immun., 84. 1650–1669. doi:10.1128/IAI.01438-15
Poon, I. K. H., Hulett, M. D., and Parish, C. R. (2010). Molecular Mechanisms of Late Apoptotic/necrotic Cell Clearance. Cell Death Differ 17, 381–397. doi:10.1038/cdd.2009.195
Reynolds, A., Rubin, J., Clermont, G., Day, J., Vodovotz, Y., and Bard Ermentrout, G. (2006). A Reduced Mathematical Model of the Acute Inflammatory Response: I. Derivation of Model and Analysis of Anti-inflammation. J. Theor. Biol. 242 (1), 220–236. doi:10.1016/j.jtbi.2006.02.016
Reynolds, N. J. (2014). One Hundred and Twenty-Five Years and Counting: into an Era of Systems Dermatology. Br. J. Dermatol 171 (6), 1279–1281. doi:10.1111/bjd.13447
Ríos-Barrera, V. A., Campos-Peña, V., Aguilar-León, D., Lascurain, L. R., Meraz-Ríos, M. A., Moreno, J., et al. (2006). Macrophage and T Lymphocyte Apoptosis during Experimental Pulmonary Tuberculosis: Their Relationship to Mycobacterial Virulence. Eur. J. Immunol. 36 (2), 345–353. doi:10.1002/eji.200535202
Ritz, N., Hanekom, W. A., Robins-Browne, R., Britton, W. J., and Curtis, N. (2008). Influence of BCG Vaccine Strain on the Immune Response and Protection against Tuberculosis. FEMS Microbiol. Rev. 32 (5), 821–841. doi:10.1111/J.1574-6976.2008.00118.X
Roh, J. S., and Sohn, D. H. (2018). Damage-associated Molecular Patterns in Inflammatory Diseases. Immune Network 18. doi:10.4110/in.2018.18.e27
Rook, G. A. W., Hernández-Pando, R., and Zumla, A. (2009). Tuberculosis Due to High-Dose Challenge in Partially Immune Individuals: A Problem for Vaccination? J. Infect. Dis. 199 (5), 613–618. doi:10.1086/596654
Salvatore, P. P., and Zhang, Y. (2017). “Tuberculosis: Molecular Basis of Pathogenesis,” in Reference Module in Biomedical Sciences (Elsevier). doi:10.1016/b978-0-12-801238-3.95697-6
Segovia-Juarez, J. L., Ganguli, S., and Kirschner, D. (2004). Identifying Control Mechanisms of Granuloma Formation during M. tuberculosis Infection Using an Agent-Based Model. J. Theor. Biol. 231 (3), 357–376. doi:10.1016/J.JTBI.2004.06.031
Sharma, B., and Singh, V. (2011). Textbook of Pulmonary and Critical Care Medicine. 1st ed. New Delhi, India: Jaypee Brothers Medical Publishers (P) Ltd.
Shi, C., and Pamer, E. G. (2011). Monocyte Recruitment during Infection and Inflammation. Nat Rev Immunol. 11, 762–774. doi:10.1038/nri3070
Smith, I. (2003). Mycobacterium tuberculosis Pathogenesis and Molecular Determinants of Virulence. Clin Microbiol Rev. 16, 463–496. doi:10.1128/CMR.16.3.463-496.2003
Tiemann, C. A., Vanlier, J., Hilbers, P. A., and van Riel, N. A. (2011). Parameter Adaptations during Phenotype Transitions in Progressive Diseases. BMC Syst. Biol. 5 (1), 174. doi:10.1186/1752-0509-5-174
Trauer, J. M., Denholm, J. T., and McBryde, E. S. (2014). Construction of a Mathematical Model for Tuberculosis Transmission in Highly Endemic Regions of the Asia-Pacific. J. Theor. Biol. 358, 74–84. doi:10.1016/j.jtbi.2014.05.023
van Riel, N. A. W., Tiemann, C. A., Vanlier, J., and Hilbers, P. A. J. (2013). Applications of Analysis of Dynamic Adaptations in Parameter Trajectories. Interface Focus. 3, 20120084. doi:10.1098/rsfs.2012.0084
Who, (2019). Global Tuberculosis Report. Availableat: https://www.who.int/tb/publications/global_report/tb19_Exec_Sum_12Nov2019.pdf?ua=1.
Wigginton, J. E., and Kirschner, D. (2001). A Model to Predict Cell-Mediated Immune Regulatory Mechanisms during Human Infection withMycobacterium Tuberculosis. J. Immunol. 166(3), 1951–1967. doi:10.4049/JIMMUNOL.166.3.1951
Wolf, A. J., Linas, B., Trevejo-Nuñez, G. J., Kincaid, E., Tamura, T., Takatsu, K., et al. (2007). Mycobacterium tuberculosis Infects Dendritic Cells with High Frequency and Impairs Their Function In Vivo. J. Immunol. 179 (4), 2509–2519. doi:10.4049/jimmunol.179.4.2509
Yokobori, N., López, B., Monteserin, J., Paul, R., Von Groll, A., Martin, A., et al. (2018). Performance of a Highly Successful Outbreak Strain of Mycobacterium tuberculosis in a Multifaceted Approach to Bacterial Fitness Assessment. Int. J. Med. Microbiol. 308 (3), 349–357. doi:10.1016/J.IJMM.2018.01.006
Keywords: tuberculosis (TB), systems biology, multi-level data integration, systems medicine, immune system modeling, modeling disease dynamics, disease outcome prediction, disease-transition map
Citation: Flores-Garza E, Zetter MA, Hernández-Pando R and Domínguez-Hüttinger E (2022) Mathematical Model of the Immunopathological Progression of Tuberculosis. Front. Syst. Biol. 2:912974. doi: 10.3389/fsysb.2022.912974
Received: 05 April 2022; Accepted: 23 May 2022;
Published: 08 August 2022.
Edited by:
Maria Rodriguez Martinez, IBM Research—Zurich, SwitzerlandReviewed by:
Awanti Sambarey, University of Michigan, United StatesMarissa Renardy, Applied BioMath, United States
Copyright © 2022 Flores-Garza, Zetter, Hernández-Pando and Domínguez-Hüttinger. This is an open-access article distributed under the terms of the Creative Commons Attribution License (CC BY). The use, distribution or reproduction in other forums is permitted, provided the original author(s) and the copyright owner(s) are credited and that the original publication in this journal is cited, in accordance with accepted academic practice. No use, distribution or reproduction is permitted which does not comply with these terms.
*Correspondence: Rogelio Hernández-Pando, cm9nZWxpby5oZXJuYW5kZXpwQGluY21uc3oubXg=; Elisa Domínguez-Hüttinger, ZWxpc2EuZG9taW5ndWV6QGlpYmlvbWVkaWNhcy51bmFtLm14