 Renske J. Verkuijlen
 Robert W. Smith*
- Laboratory of Systems and Synthetic Biology, Wageningen University and Research, Wageningen, Netherlands
miRNAs are promising diagnostic biomarkers. These small RNA molecules are always present in the human body but become dysregulated when a person develops certain diseases. Although the detection of these biomarkers in cell-free tests is ongoing work, current systems often focus solely on detecting the presence or absence of a specific miRNA, rather than the miRNAs concentration. Thus, these tests may miss relative changes in miRNA concentration when disease-induced dysregulation occurs. This work, part of the WUR iGEM 2024 project (miRADAR), aimed to address this gap by incorporating an miRNA concentration-dependent threshold mechanism in a cell-free diagnostic test. In this system, continuous miRNA input concentrations need to be converted into a binary output signal, classifying the miRNA concentration as healthy (no output signal) or indicative of disease (strong output signal). To aid the experimental engineering of the test, here we use mathematical models to evaluate and assess different candidate networks. We apply a previously published multi-objective optimisation strategy to obtain designs that satisfy relevant constraints, such as low basal expression, high readout levels, and steep switching behaviour between low and high input miRNA concentrations. Models for three different biological mechanisms were compared based on their ability to generate the desired binary output signal. One approach used three-node protein networks (such as feed-forward loops), while the other two utilised RNA-based toehold systems. Overall, the toehold-mediated strand displacement systems demonstrated the most potential for experimental implementation. These systems are believed to be less burdensome in a cell-free environment, can be more readily engineered for new miRNA sequences, and showed high detection accuracy. Based on our results, we discuss how the inclusion of sequence-specific parameters could expand the design space of our mathematical models and how careful engineering of optimisation criteria is required to evaluate designs. Ultimately, our model-based study highlights that toehold-mediated strand displacement networks have the potential to be efficient miRNA detection systems for biosensing tools in the future.
1 Introduction
MicroRNAs (miRNAs) are a promising diagnostic marker and therapeutic agent. Research has identified numerous miRNAs with potential clinical applications in the detection and monitoring of neurodegenerative diseases such as Alzheimer’s and Parkinson’s disease (Gentile et al., 2022; Doroszkiewicz et al., 2022). The inhibition or activation of miRNAs involved in such diseases has been extensively studied as potential therapies (Walgrave et al., 2021; Nguyen et al., 2022). These small, single-stranded molecules are present in the body to regulate transcriptional gene expression (Lu and Clark, 2012). When carrying a disease, a person’s gene expression is differentially regulated and these changes, when compared to healthy controls, correlate with differential miRNA concentrations. This information can be utilised in a diagnostic tool, as measuring the change in concentration of disease-specific miRNAs can indicate the presence of that disease (Song et al., 2012; Wang and Zhang, 2020).
This principle formed the basis of the WUR 2024 iGEM project, miRADAR, where miRNAs were used in a cell-free diagnostic tool to help detect the neurodegenerative disease multiple sclerosis (MS) (iGEM, 2024). In this disease, immune cells attack the myelin sheaths of the nerves, leading to a range of symptoms including muscle weakness and loss of vision (Ghasemi et al., 2017). The current diagnostic procedure, involving MRI scans and lumbar punctures, is invasive and believed to provide inconclusive results for 10%–30% of the patients [Christa Benit MD, personal communication; (iGEM, 2024; Tullman, 2013)]. At present, MS has no cure, but treatments delaying the degradation of the myelin sheaths and reducing symptom progression exist (Hauser and Cree, 2020). The earlier treatment is started, the better the quality of life of the patient can be conserved, demanding a timely diagnosis of MS (Giovannoni et al., 2016; Ziemssen et al., 2016). Previous studies have found multiple miRNAs dysregulated by MS, of which hsa-miR-484 and hsa-miR-145 are examples (Figure 1, step I) (Regev et al., 2018; Søndergaard et al., 2013). This emphasises that novel miRNA-based tests could be a valuable addition to the diagnostic procedure of MS.
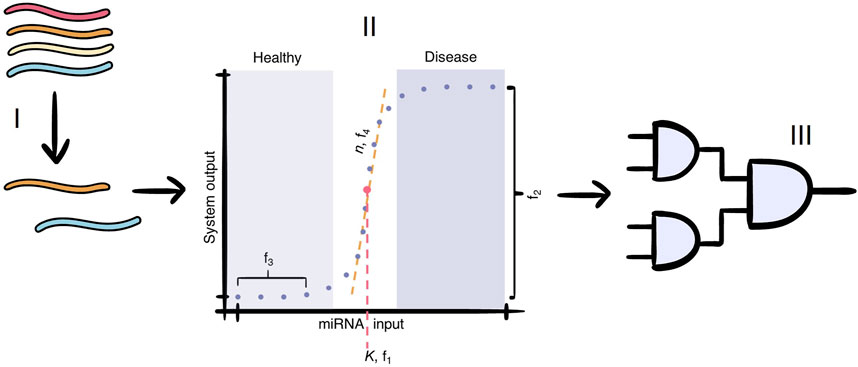
Figure 1. The cell-free paper-based miRNA test for multiple sclerosis consists of three main parts: I) the selection of miRNAs that are markers of MS; II) the conversion of the miRNA input concentration to a binary output signal, which differentiate healthy patients from those with MS. The dots represent the input concentrations at which our model evaluates the output dose-response curve. The values
In the miRADAR project, the WUR 2024 iGEM team envisioned creating a cell-free blood test to aid in diagnosing complex cases of MS (iGEM, 2024). To achieve this, a simple genetic detection circuit would need to be freeze-dried on paper discs. Upon the application of an MS-positive blood sample, the presence of several MS-specific miRNAs would trigger the genetic circuit and produce a colour marker that the patient and medical professionals can then observe. If the blood sample leads to a change in colour of the system’s output, then this suggests the presence of MS-specific miRNAs.
The key of the test lies in the concentration level of the MS-specific miRNAs; the miRNAs will always be present, but their concentration can be up- or downregulated in patients (Regev et al., 2018; Søndergaard et al., 2013; Ho et al., 2022). Current developments in other miRNA-based cell-free tests either do not take this into account and focus solely on detecting the presence of a specific miRNA, or depend on a difference in visual output, which is not sensitive enough when multiple miRNAs are detected in a single test (Li et al., 2019; Wang et al., 2023). Therefore, the addition of a concentration-dependent module is an important next step. Ideally, this module would give a binary output, where either the miRNA concentration is classified as healthy or indicative of the disease (Figure 1, step II). This signal conversion could be achieved by implementing a threshold mechanism, which distinguishes whether a miRNA is below or above a threshold concentration associated with healthy patients. No system output is generated when the input miRNA concentration is considered healthy (below threshold), while a large increase in system output is generated when the input miRNA concentration is considered indicative of MS (above threshold). The sharper this switch is, the more accurate the miRNA-based diagnostic test will be. Afterwards, individual binary signals can be integrated into a modular detection module that produces a single output signal allowing for the detection of multiple different miRNAs in a single test (Figure 1, step III). Two biological mechanisms that have the potential to create the desired threshold in the dose-response curve: i) a protein-based feed-forward loop (FFL) and ii) RNA-based toehold-mediated strand displacement (TMSD) systems.
1.1 Protein-based networks: feed-forward loops
Many genetic circuits found in nature contain core network motifs consisting of a limited number of components (Milo et al., 2002). One example of such a network motif are feed-forward loops (FFLs) where three nodes can interact (in)directly with each other through activation and inhibition [Figure 2A; (Alon, 2007)]. FFL nodes can consist of an interplay between transcription factors, proteins, DNA, and RNA, and are consistently found to regulate processes like adaptation, noise filtering, biphasic behaviour, and oscillations (Ma et al., 2009; Pieters et al., 2021; Kim et al., 2008; Zhang et al., 2016). The basic structure of an FFL consists of a direct interaction between input node A and output node C, combined with an indirect reaction through node B. The FFL is called coherent if the direct effect of node A on node C and the indirect effect through node B are consistent. An example of a coherent network is that A activates C directly, but also activates B which also activates C in turn: in this case, A has a net positive effect on C via both paths. If the effect through both pathways is antagonistic, the FFL is considered incoherent. Next to these main reactions from node A to node C, additional regulation between the nodes is possible, including autoregulation and feedback which allows for more complex behaviour to emerge (Alon, 2007; Mangan and Alon, 2003).
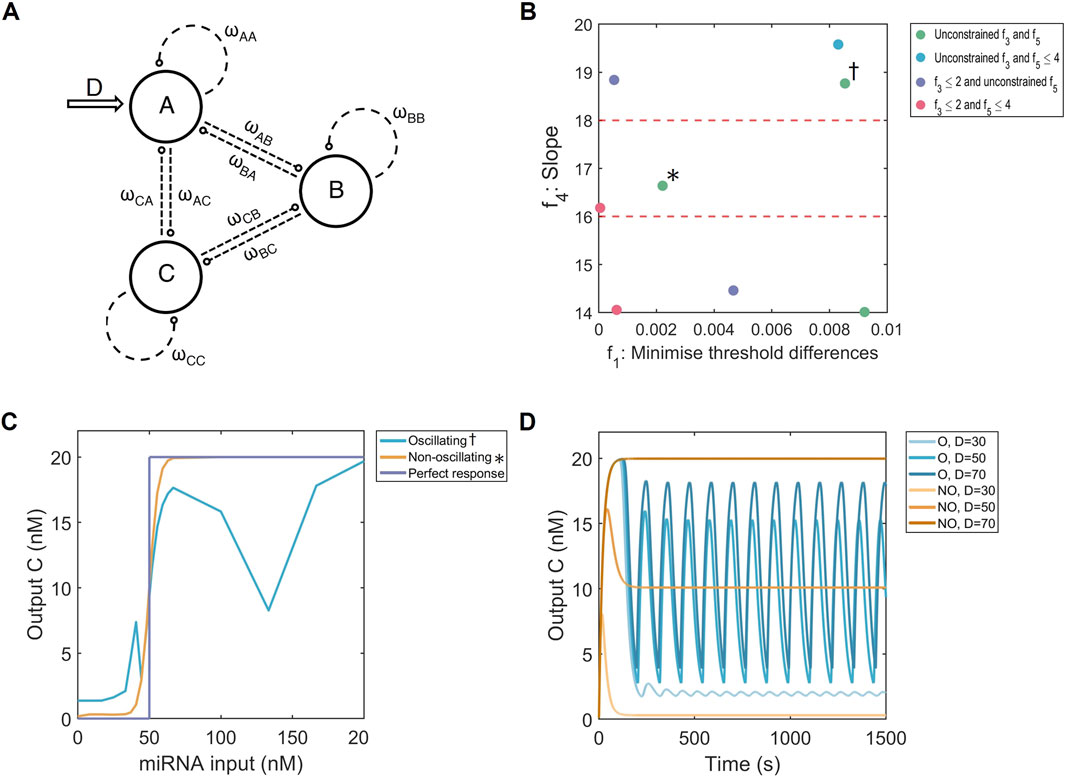
Figure 2. Multi-objective optimisation of the FFL system. (A) Hypergraph representing three-node networks with all possible connections. The input is on node
Previous research has shown that such networks may be relevant for our miRNA detection system. While looking for networks that show adaptation using three-node networks, (Ma et al., 2009), also found topologies capable of producing binary outputs (C in Figure 2A) given input concentrations (D in Figure 2A) below and above some threshold. A three-node coherent FFL has also been shown in (Rahman et al., 2018) to create a dose-response curve with threshold-like behaviour. Furthermore, through modelling T-cell receptor binding, an incoherent FFL was found to be the basis of larger networks capable of producing binary output responses (Lever et al., 2016). Consequently, based on these results, we hypothesise that transcription factor-based FFLs are a good candidate for the genetic network required within the miRADAR cell-free test.
1.2 RNA-based networks: toehold-mediated strand displacement
The goal of the miRADAR project was to develop a cell-free paper-based test, which increases accessibility for patients. To create an efficient cell-free system, we are required to limit the number of biological components needed to produce an output. As we envision that our FFL systems consist of transcription and translation of node components, our cell-free test will also require compounds to process DNA and RNA into protein which will accelerate energy usage and could limit output responses (Stögbauer et al., 2012). To combat this issue, a more energy-efficient system based solely on base-pair binding called toehold-mediated strand displacement (TMSD) could prove useful. At the core of TMSD lies a double-stranded RNA complex, with a free annealing region called the toehold (Zhang and Winfree, 2009). An input RNA with a complementary domain to the toehold and the rest of the RNA strand will anneal to the toehold and displace the first-bound RNA strand, as its hybridisation energy is higher. In a kinetic model, this TMSD reaction can be simplified into one rate because the initial toehold annealing is the rate-limiting step (Qian and Winfree, 2011; Akay et al., 2024). The sequence design determines which reaction will proceed at which rate, enabling engineering of the mechanism to desired needs (Zhang and Seelig, 2011). With the addition of other strands, behaving like inhibitors or catalysts called fuels, the TMSD reaction can be expanded to perform multiple functions (Qian and Winfree, 2011; Chen et al., 2023). Here, two variants of TMSD will be tested, namely i) with fuel reactions (TMSD-F) and ii) without fuel reactions (TMSD-NF).
The TMSD system has previously been integrated into miRNA diagnostic tests as an amplification module (Liang et al., 2020; Zhang et al., 2020). The miRNA concentrations can be measured, but this TMSD system was not sensitive enough to detect small dysregulations in miRNA concentration levels in the proposed MS test (Lee et al., 2021). Previous studies illustrated the potential of TMSD-based systems to produce binary system outputs that differentiate between low- and high concentrations of miRNA (Qian and Winfree, 2011; Seelig et al., 2006). However, both approaches do not generate a sharp enough switch and suffer from high basal expression, which impairs the quality of the binary signal.
To improve on the initial TMSD system, (Qian and Winfree, 2011), added two new reactions. We will refer to this system as TMSD-F (Figure 3A). The first reaction utilised miRNAs with antisense sequences to the input miRNA in order to compete with the TMSD reactions and prevent the system responding until sufficient input miRNA was present. The second additional reaction, referred to as the fuel reaction, created a positive feedback mechanism whereby input miRNAs could repeatedly trigger the TMSD gate. These additions allowed the system to approach binary output responses given different input miRNA concentrations. Furthermore, all the reactions within this expanded TMSD system make use of the same toehold sequence, referred to as the universal toehold. The universal toehold increases modularity and allows for multiple TMSD reactions to be linked to each other, but it also generates side reactions that have an unknown influence on the quality of the resulting output dose-response curve.
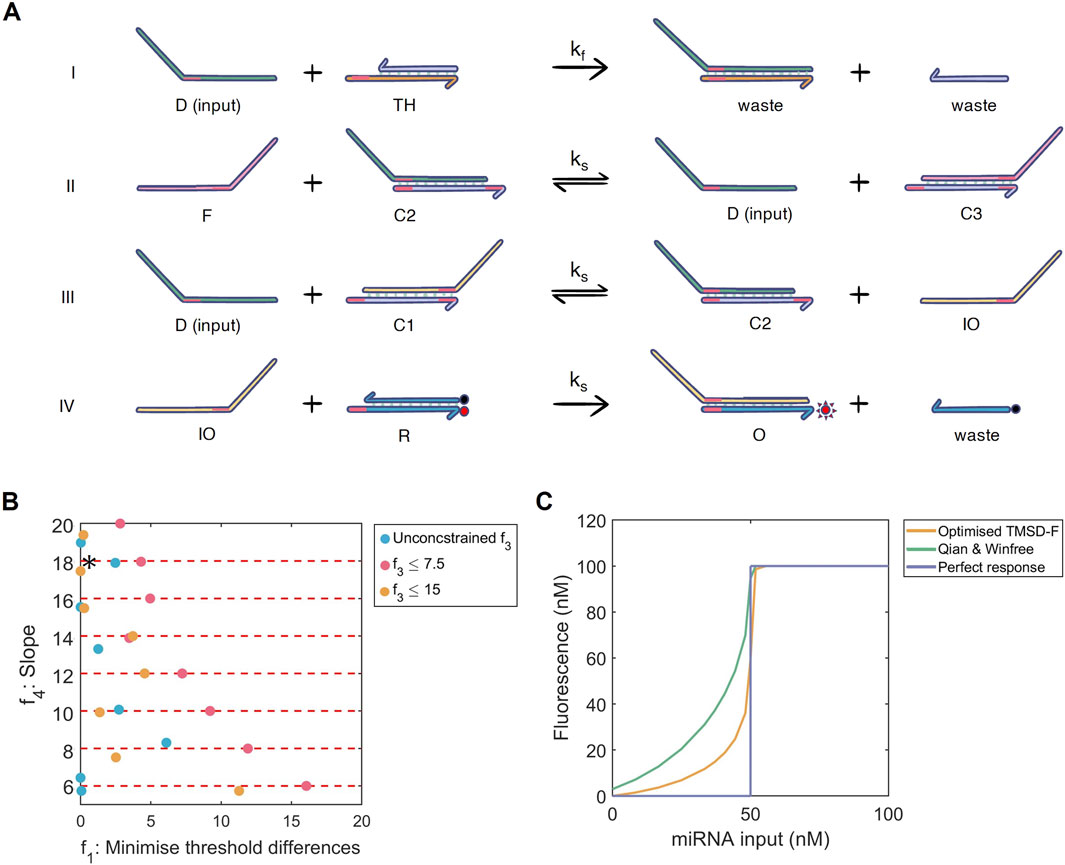
Figure 3. (A) Multi-objective optimisation of the toehold-mediated strand displacement with fuel (TMSD-F) system. I) The threshold reaction: input strand
The miRADAR project also considered a further simplification of the TMSD-F system (iGEM, 2024). This new system removed the fuel component and the universal toeholds. Consequently, we named the system TMSD-NF (Figure 4A).
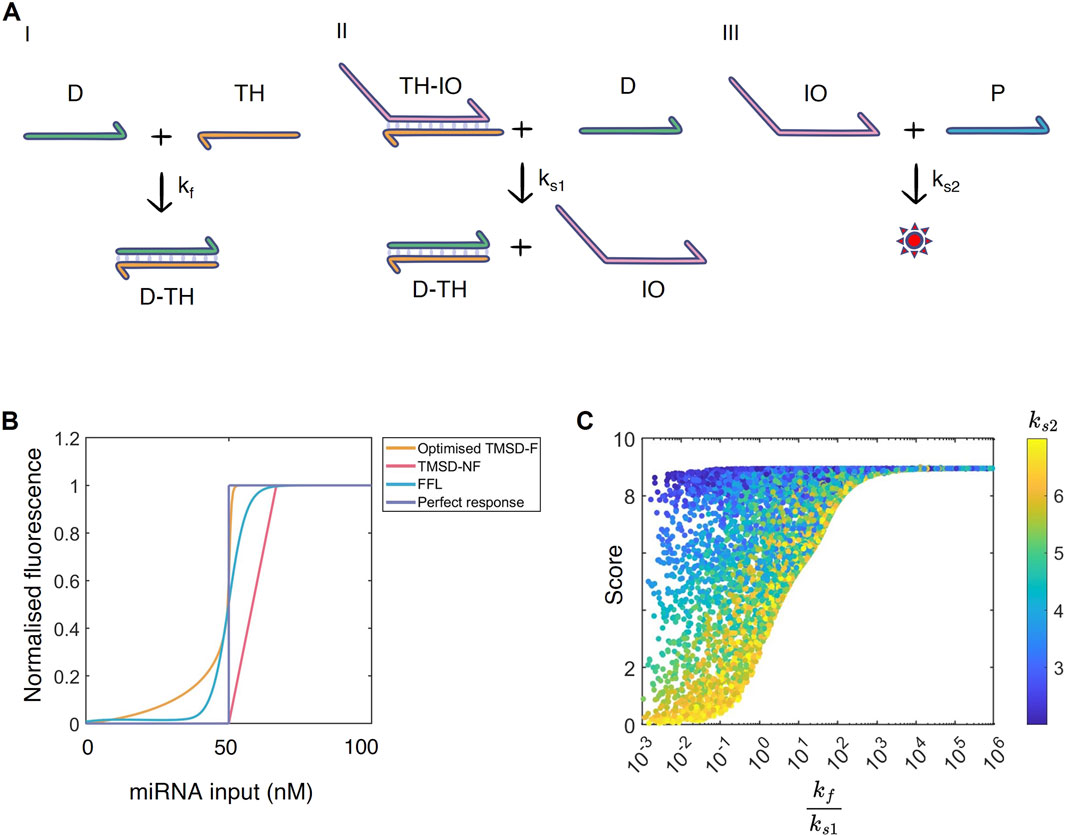
Figure 4. (A) The TMSD-NF system analysed by the WUR 2024 iGEM team. I) The threshold reaction: input
1.3 Multi-objective optimisation algorithms for model design
FFL and TMSD are biological mechanisms that could, with further optimisation, form a sharp threshold in the dose-response curve. With the described kinetic models, we wish to optimise the parameters of our systems to increase the accuracy and steepness of the threshold while additionally lowering the basal expression before that threshold point (Figure 1, step II, see a schematic of these behaviours labelled
In multi-objective optimisation problems, trade-offs between different objectives are likely. As an example, one could envision that, for the threshold mechanisms, a higher slope (i.e., the sharpness of the increase between “healthy” and “disease” in Figure 1, step II,
By applying the above-described optimisation strategy of (Otero-Muras and Banga, 2017), in this work we will optimise a protein-based FFL network and our two RNA-based TMSD systems (TMSD-F and TMSD-NF) to increase their functionality as threshold mechanisms. We will go on to show that all three network designs have the potential to produce near-binary output signals in response to different input miRNA concentrations. These results will show that TMSD-based networks outperform FFLs in their ability to respond to different miRNA inputs, and we will discuss how TMSD networks could be further engineered in the future. These findings advance the study of miRNAs as a diagnostic tool by exploring the necessary concentration-dependent module that current tests lack.
2 Methods
2.1 Mathematical models
2.1.1 Three-node networks and feed forward loops
The feed forward loop (FFL) system consists of three nodes, which can inhibit or activate each other and themselves (Figure 2A). We assume these connections to represent transcription and translation where one node’s mRNA is translated to a transcription factor that can regulate preceeding nodes. A single node connection, denoted
The ODEs were solved with a CVODES solver provided by Serban and Hindmash which was adjusted by Otero-Muras and Banga (2017) to accommodate mixed-integer parameters (Otero-Muras and Banga, 2017; Serban and Hindmarsh, 2005). The absolute and relative tolerance were defined as
2.1.2 Fuel-regulated toehold mediated strand displacement system
The ODEs for toehold mediated strand displacement system with a fuel reaction (TMSD-F) were derived by Qian and Winfree (2011) and based on the law of mass action. The system has two kinetic rates: a fast kinetic rate
The ODEs were solved with the MATLAB CVODES stiff solver under standard parameters, except absolute tolerance =
2.1.3 Toehold mediated strand displacement systems without fuel
The ODEs for the fuel-removed TMSD system (TMSD-NF) were adapted from TMSD-F and consist of an equation for the threshold reaction (with rate
The ODEs were solved with the MATLAB CVODES non-stiff solver using standard parameters, except absolute tolerance =
2.2 Mathematical representation of a dose-response curve
Mathematically, dose-response curves can be described with the Hill function
where
Simulating a large number of doses would slow down the optimisation drastically, so a minimal amount of doses, which still accurately represent the curve, had to be determined (Supplementary Methods S1.1). In total, 19 doses are necessary to create an accurate dose-response curve, with 10 of the total doses centred around the threshold dose. This is shown schematically in Figure 1 (step II).
2.3 Optimisation objectives
The objectives of the optimisation of the FFL and TMSD-F systems are based on the desired dose-response curve (Figure 1, step II). Ideally, this curve has i) a high threshold accuracy, ii) a high system output after the threshold is passed, iii) a low basal expression before the threshold, and iv) a steep slope.
The
where
The second objective, which assesses the maximum system output can be defined as constraint
where the lower boundary
where
According to (Otero-Muras and Banga, 2017), the slope objective was split into multiple interval constraints. This objective function was consequently defined as constraint
where the Hill function was used to calculate slope
In the optimisation of FFL and three-node networks, a fifth constraint objective was added to limit the number of node connections as follows
with
2.4 Multi-objective optimisation algorithm
The optimisation algorithm combined the global solver eSS (enhanced scatter search; release 2010A) and the local solver misqp (for FFLs and three-node networks; version 7.1) or fmincon (for TMSD systems; version MATLAB 2024a) into a hybrid solver (Otero-Muras and Banga, 2017; Egea et al., 2009; Exler and Schittkowski, 2007). After 10 iterations of the global solver, the local solver refined the best solution. This process was repeated until a total of 10,000 evaluations were completed. In the global solver, 320 diverse solutions were initially generated. From these, 20 solutions were put in the reference set, whose values were iteratively updated to the 20 new best solutions (Otero-Muras and Banga, 2017). All solver parameters were obtained from (Otero-Muras and Banga, 2017).
2.5 Latin hypercube sampling for parameter space exploration of TMSD-NF
The TMSD-NF system consists of three reactions rates (
The maximum output of the system is determined by the known concentration of aptamer
to score the basal expression before the threshold, the formula remained unadjusted from above, except the lower and upper boundaries were removed:
to measure the steepness of TMSD-NF systems, we replaced function
this change was required since TMSD-NF systems produced optimal dose-response curves with sharp transitions between healthy and disease regimes (Figure 1, step II) once the threshold input dose has been crossed - a qualitatively different behaviour to which we had before. This means that fitting a Hill function, approximating
The change in gradient just before and after
The final score was computed as
where
3 Results
3.1 Optimising three-node networks and feed-forward loops
The first mechanism applied to convert continuous input concentrations of miRNA into a binary fluorescent signal are three-node networks, of which the FFL system is a special example (Figure 2A). In the multi-objective optimisation process (Section 2.3, Equations 2 - 6), the threshold accuracy
According to the plotted search space, our three-node systems consistently reached minimal threshold differences, showing that high threshold accuracies are robust to changes in the slope of output dose-response Hill functions (Figure 2B; Supplementary Figure S4). These values were reached regardless of the limits set by
Based solely on the objective values, multiple well-performing systems exist but this is not reflected in the simulated dose-response curves. There, some curves show irregular behaviour, where the output at higher doses of input miRNA is not constant. As an example, from two systems performing similarly in our
3.2 Optimising fuel-regulated toehold systems
The TMSD system solely relies on nucleotide binding, providing an advantage over the energy-demanding transcription and translation necessary for the functioning of an FFL. The TMSD-F system contains a fuel strand, which catalytically speeds up and increases the production of fluorescent output (Figure 3A II). The same objectives as for the three-node networks, except for
Basal expression limits (
From the observed search space, we discovered that constraining our slope
With these results in mind, the improved threshold accuracy, higher slope and reduced basal expression of the optimised TMSD-F produces the dose-response curve shown in Figure 3C. Compared to our three-node systems, the better engineering possibilities and the absence of oscillations are great advantages for employing the TMSD-F system as the concentration-dependent module in our miRNA diagnostic test.
3.3 Optimising toehold systems in the absence of fuel reactions
As the kinetic model of the TMSD-NF system was adapted from TMSD-F, we assumed that the rates of similar reactions could be transferred between the systems (Figure 4A). Therefore, the threshold reaction proceeds again with rate
In simulations with these reaction rates, the TMSD-NF system generates more linear dose-response curves than the TMSD-F system. The TMSD-NF system showed minimal basal expression, but the slope of the dose-response curve was less steep than in the TMSD-F system (Figure 4B, pink line). To test whether the decrease in basal expression was due to removing the fuel reaction, the initial concentration of the fuel component was set to 0 in the TMSD-F system, thereby eliminating the fuel reaction (Supplementary Figure S12). The simulations showed a small increase of basal expression in the absence of the fuel reaction.
To further engineer the TMSD-NF system, the initial concentrations of intermediate output
In Qian and Winfree (2011), the system was designed on the assumption that the threshold reaction should be faster than the TMSD reaction (i.e.,
To test this observation, a Latin Hypercube sample (Section 2.5) was created of the permissible parameter space to get a better understanding of the relationship between these TMSD-NF parameters. The permissible parameter space is defined by scoring functions s1 to s4 (Equations 7 - 10). Upon plotting the ratio
3.4 Comparison of the three systems
As many miRNAs can differentiate between healthy people and patients diagnosed with MS, we want to create a system that can respond to a suite of differentially-expressed miRNAs. However, each miRNA will have a different threshold concentration that distinguishes between healthy patients and those with MS. Therefore, the concentration-dependent module requires a modular design that is easily adaptable to new
By changing the input concentrations of the system, where the threshold strand
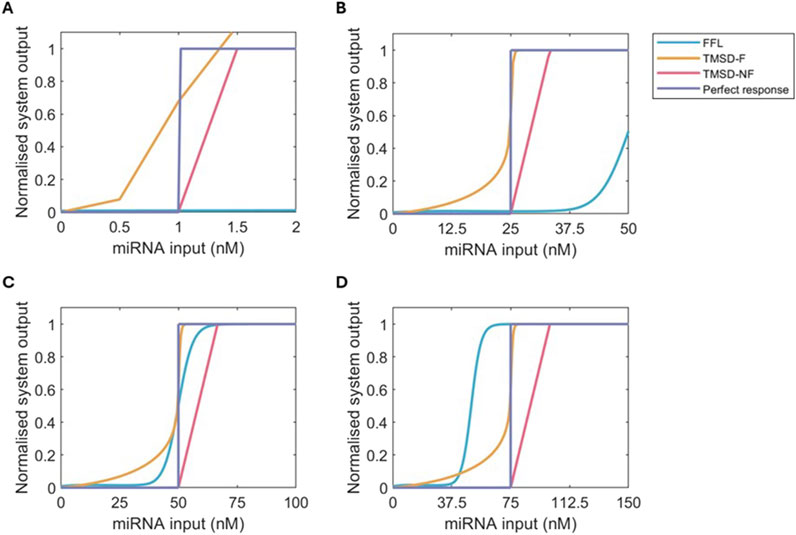
Figure 5. Normalised dose-response curves for FFL (blue), TMSD-F (orange), TMSD-NF (pink) and a perferct binary response (purple) at multiple values of
Focussing back on a
In the final diagnostic test, our results recommend the use of TMSD systems as the chance of oscillations and the limited scalability of three-node networks, like the FFL system, are undesired. The TMSD-F system has the most potential if further reduction of the basal expression can be achieved. TMSD-F has a high threshold accuracy, the highest slope and the highest maximum system output. The latter point, in particular, is a disadvantage of the TMSD-NF system, where the maximum system output is relatively low. If further optimisation of the TMSD-F system proves difficult, the system would be best employed at low
4 Discussion
In this work, we have utilised a previously published multi-objective optimisation strategy to design biological mechanisms that are capable of converting (continuous) miRNA inputs into binary output signals. As per the last section of the results, the RNA-based TMSD systems outperform the protein-based three node FFL system. These TMSD systems can easily be adapted to other input miRNAs (with different
4.1 TMSD engineering
The fuel reaction in particular is an interesting target for optimising the TMSD-F system further. Our results showed that this reaction in the TMSD-F system results in a trade-off between a high fold-change in the system output versus lower basal expression (Figure 3B). The optimisation results showed that the basal expression can be decreased by lowering the
A critical limitation of the current TMSD-F and TMSD-NF models is the systems’ reliance on domain binding (i.e., toehold to toehold) rather than sequence-specific binding. While, for example, the length of the toehold is essential for the speed of the TMSD reaction rates, the sequence itself also plays a role (Zhang and Winfree, 2009; Berleant et al., 2018). This indicates that the
Including sequence-specificity in the model becomes even more evident when considering the application of the TMSD system in diagnostic tests. Ultimately, our designed system would be used in applications to detect multiple miRNAs simultaneously, meaning that multiple TMSD systems will need to work in parallel. Here, sequence specificity becomes crucial, as the wrong miRNA should not trigger a TMSD reaction and produce false positives or negatives. In this work, we assumed that parallel detection is possible, allowing us to model one TMSD system that can be repurposed for all miRNA that we wish to detect. This assumption could potentially be violated on sequence level, which could, for example, lead to a decoy miRNA with a slight mismatch to bind to the threshold strand of the target miRNA. This could cause false positives where the concentration of the target miRNA did not pass the threshold but, together with the decoy miRNA, the threshold is surpassed. This signifies the need for well-designed toeholds that are highly specific for one miRNA only. Fortunately, when TMSD was used as an amplification module, it was specific to single nucleotide mismatches (Zhang et al., 2020). Other work underlines the importance of sequence specificity, but current models of this mismatch effect are dependent on specific toehold lengths and the position of the mismatching nucleotide (Machinek et al., 2014). The incorporation of precise sequence design into the model could clarify whether the reaction is specific enough to detect particular miRNAs.
To tackle these issues of sequence specificity and decoy miRNAs for our designed systems, we propose three extensions to our work for practitioners and future research through the use of Figure 4C. In the first instance, our modelling framework could be extended to incorporate sequence specificity by making use of the previously developed KinDa tool. This tool compares the functioning of TMSD systems at the domain and sequence level with stochastic modelling (Berleant et al., 2018). This way, the behaviour of nucleotide-specific sequence designs can be checked on the domain level. Furthermore, KinDa can predict the kinetic rates of both the toehold binding and the branch migration reactions that form the TMSD system (e.g. Figure 4A). Modifications to the secondary structure can also be tested with KinDa. Therefore, before implementing TMSD-NF in the lab, proposed sequence designs could be evaluated with KinDa, ruling out any disturbing side reactions, and the predicted kinetic rates could be cross-referenced with the
Alternatively, extra experimental data could be obtained to further evaluate the performance of TMSD systems. For example, in the first instance, practitioners could evaluate the performance of the TMSD system with varying amounts of initial aptamer concentration or testing aptamers of different binding strength. As we observe in Figure 4C, when the parameter
4.2 Improving optimisation for better design of FFL threshold mechanisms
A major issue in our three-node network designs is the formation of topologies that cause oscillations over time in the fluorescent output. For a correctly working threshold mechanism, the system should reach steady state within a reasonable time period. Otherwise, the output signal is inconsistent, and accurate measurements of the miRNA concentrations are difficult. Although the topologies of the networks causing oscillations and the networks resulting in smooth dose-response curves do not entirely overlap, they share heavy negative regulation on node
However, strong negative feedback is also associated with oscillating networks (Kholodenko, 2006; Tyson and Novák, 2010). The specific motif responsible for the oscillations found in our optimisation strategy are known as Goodwin oscillators, and the network’s dynamics have been extensively studied as the network motif has been found in circadian clocks (Goodwin, 1965; Ullner et al., 2009; Baum et al., 2016; Gonze et al., 2005). Furthermore, negative autoregulation on node
Therefore, adding a constraint to the optimisation strategy that prevents any solutions with oscillations would be necessary. This could be achieved by adding careful constraints to which reactions within a network are allowed, and is required since our current constraints are insufficient to achieve this currently. Alternatively, the method of Otero-Muras and Banga (2016) used to find three-node topologies capable of oscillations could be adapted to filter out oscillations in the FFL optimisation through alterations of their scoring functions. Their oscillation constraint was based on the autocorrelation function, which determines how well the peaks of oscillations align over time. By assessing the behaviour of these constrained designs (e.g., lower basal expression), we could potentially obtain general design principles for robust miRNA detection tools. With these design principles to hand, other system properties, such as robustness or the effects of stochastic behaviour, could further distinguish the solutions (Woods et al., 2016).
If we take a step back and evaluate the multi-objective optimisation framework as a whole, we have observed trade-offs between different objectives through the visualisation of our search spaces in Figures 2B, 3B. However, decisions cannot be based on this information alone. Careful examination of the dose-response curves and time-responses was necessary to filter out undesired behaviour, like oscillations produced by three-node networks, and determine the influence of a smaller
5 Conclusion
In summary, this study modelled and explored three biological mechanisms in their ability to convert continuous miRNA input into a binary output above a specific threshold. All the system designs studied here showed potential for future use in sensor- or diagnostic tests. However, the RNA-based TMSD systems are easier to engineer, more stable, and more adaptable to new input miRNAs than protein-based networks such as the FFL system. The TMSD-F system would outcompete the TMSD-NF system at higher threshold values if the basal expression produced by our TMSD-F design could be further reduced.
In the future, the miRADAR project of the WUR iGEM 2024 team envisions the incorporation of this concentration-dependent module into cell-free miRNA diagnostic tests (iGEM, 2024). The threshold mechanism allows clear separation of input miRNA concentrations into a binary output to distinguish miRNA concentrations of healthy people from those with MS, which is a feature lacking in current tests. The adaptability of the TMSD system to new sequences and thresholds enables the test to be modified for other diseases besides multiple sclerosis, further highlighting the importance of continued research into these concentration-dependent modules.
Data availability statement
The datasets presented in this study can be found in online repositories. The names of the repository/repositories and accession number(s) can be found below: https://git.wur.nl/ssb/publications/designing-mirna-detection-networks.
Author contributions
RV: Conceptualization, Writing – original draft, Visualization, Software, Writing – review and editing, Formal Analysis. RS: Formal analysis, Visualisation, Writing – original draft, Conceptualization, Supervision, Writing – review and editing.
Funding
The author(s) declare that financial support was received for the research and/or publication of this article. RS is supported by NWO-M project 17336 (“Systems biology analysis of infection structure development in a plant pathogenic fungus”).
Acknowledgments
We acknowledge the support of the WUR 2024 iGEM team, miRADAR, and thank all team members and supervisors. In particular, we acknowledge the support of the Laboratories of Systems and Synthetic Biology, Microbiology (Nico Claassens) and Bioprocess Engineering (Mark Bisschops) at Wageningen UR in coordinating the iGEM team. We are also grateful to discussions with Bram de Jonge and Pieter Candry to help us model the TMSD-NF system. Finally, we thank Maria Suarez Diez and Edoardo Saccenti for critical reading of this manuscript before submission.
Conflict of interest
The authors declare that the research was conducted in the absence of any commercial or financial relationships that could be construed as a potential conflict of interest.
Generative AI statement
The author(s) declare that Generative AI was used in the creation of this manuscript. ChatGPT with GPT version 4o was used sparingly for debugging code and for checking grammatical and spelling errors.
Publisher’s note
All claims expressed in this article are solely those of the authors and do not necessarily represent those of their affiliated organizations, or those of the publisher, the editors and the reviewers. Any product that may be evaluated in this article, or claim that may be made by its manufacturer, is not guaranteed or endorsed by the publisher.
Supplementary material
The Supplementary Material for this article can be found online at: https://www.frontiersin.org/articles/10.3389/fsysb.2025.1601854/full#supplementary-material
References
Akay, A., Reddy, H. N., Galloway, R., Kozyra, J., and Jackson, A. W. (2024). Predicting DNA toehold-mediated strand displacement rate constants using a DNA-BERT transformer deep learning model. Heliyon 10, e28443. doi:10.1016/j.heliyon.2024.e28443
Alon, U. (2007). Network motifs: theory and experimental approaches. Nat. Rev. Genet. 8, 450–461. doi:10.1038/nrg2102
Ang, J., Harris, E., Hussey, B. J., Kil, R., and McMillen, D. R. (2013). Tuning response curves for synthetic biology. ACS Synth. Biol. 2, 547–567. doi:10.1021/sb4000564
Baum, K., Politi, A. Z., Kofahl, B., Steuer, R., and Wolf, J. (2016). Feedback, mass conservation and reaction kinetics impact the robustness of cellular oscillations. PLOS Comput. Biol. 12, e1005298. doi:10.1371/journal.pcbi.1005298
Berleant, J., Berlind, C., Badelt, S., Dannenberg, F., Schaeffer, J., and Winfree, E. (2018). Automated sequence-level analysis of kinetics and thermodynamics for domain-level DNA strand-displacement systems. J. R. Soc. Interface 15, 20180107. doi:10.1098/rsif.2018.0107
Boada, Y., Reynoso-Meza, G., Picó, J., and Vignoni, A. (2016). Multi-objective optimization framework to obtain model-based guidelines for tuning biological synthetic devices: an adaptive network case. BMC Syst. Biol. 10, 27. doi:10.1186/s12918-016-0269-0
Chen, C., Wen, J., Wen, Z., Song, S., and Shi, X. (2023). DNA strand displacement based computational systems and their applications. Front. Genet. 14, 1120791. doi:10.3389/fgene.2023.1120791
Doroszkiewicz, J., Groblewska, M., and Mroczko, B. (2022). Molecular biomarkers and their implications for the early diagnosis of selected neurodegenerative diseases. Int. J. Mol. Sci. 23, 4610. doi:10.3390/ijms23094610
Du, Y., Xie, L., Liu, J., Wang, Y., Xu, Y., and Wang, S. (2014). Multi-objective optimization of reverse osmosis networks by lexicographic optimization and augmented epsilon constraint method. Desalination 333, 66–81. doi:10.1016/j.desal.2013.10.028
Egea, J. A., Balsa-Canto, E., García, M. S. G., and Banga, J. R. (2009). Dynamic optimization of nonlinear processes with an enhanced scatter search method. Industrial and Eng. Chem. Res. 48, 4388–4401. doi:10.1021/ie801717t
Elmi, Z., Li, B., Liang, B., Lau, Y., Borowska-Stefańska, M., Wiśniewski, S., et al. (2023). An epsilon-constraint-based exact multi-objective optimization approach for the ship schedule recovery problem in liner shipping. Comput. and Industrial Eng. 183, 109472. doi:10.1016/j.cie.2023.109472
Exler, O., and Schittkowski, K. (2007). A trust region SQP algorithm for mixed-integer nonlinear programming. Optim. Lett. 1, 269–280. doi:10.1007/s11590-006-0026-1
Gardner, D. J., Reynolds, D. R., Woodward, C. S., and Balos, C. J. (2022). Enabling new flexibility in the SUNDIALS suite of nonlinear and differential/algebraic equation solvers. ACM Trans. Math. Softw. 48 (31), 1–24. doi:10.1145/3539801
Gentile, G., Morello, G., La Cognata, V., Guarnaccia, M., Conforti, F. L., and Cavallaro, S. (2022). Dysregulated miRNAs as biomarkers and therapeutical targets in neurodegenerative diseases. J. Personalized Med. 12, 770. doi:10.3390/jpm12050770
Ghasemi, N., Razavi, S., and Nikzad, E. (2017). Multiple sclerosis: pathogenesis, symptoms, diagnoses and cell-based therapy. Cell J. (Yakhteh) 19, 1–10. doi:10.22074/cellj.2016.4867
Giovannoni, G., Butzkueven, H., Dhib-Jalbut, S., Hobart, J., Kobelt, G., Pepper, G., et al. (2016). Brain health: time matters in multiple sclerosis. Multiple Scler. Relat. Disord. 9, S5–S48. doi:10.1016/j.msard.2016.07.003
Gonze, D., Bernard, S., Waltermann, C., Kramer, A., and Herzel, H. (2005). Spontaneous synchronization of coupled circadian oscillators. Biophysical J. 89, 120–129. doi:10.1529/biophysj.104.058388
Goodwin, B. C. (1965). Oscillatory behavior in enzymatic control processes. Adv. Enzyme Regul. 3, 425–438. doi:10.1016/0065-2571(65)90067-1
Hauser, S. L., and Cree, B. A. C. (2020). Treatment of multiple sclerosis: a review. Am. J. Med. 133, 1380–1390.e2. doi:10.1016/j.amjmed.2020.05.049
Hindmarsh, A. C., Brown, P. N., Grant, K. E., Lee, S. L., Serban, R., Shumaker, D. E., et al. (2005). SUNDIALS: suite of nonlinear and differential/algebraic equation solvers. ACM Trans. Math. Softw. 31, 363–396. doi:10.1145/1089014.1089020
Ho, P. T. B., Clark, I. M., and Le, L. T. T. (2022). MicroRNA-Based diagnosis and therapy. Int. J. Mol. Sci. 23, 7167. doi:10.3390/ijms23137167
Holehouse, J., Cao, Z., and Grima, R. (2020). Stochastic modeling of autoregulatory genetic feedback loops: a review and comparative study. Biophysical J. 118, 1517–1525. doi:10.1016/j.bpj.2020.02.016
Jung, J. K., Archuleta, C. M., Alam, K. K., and Lucks, J. B. (2022). Programming cell-free biosensors with DNA strand displacement circuits. Nat. Chem. Biol. 18, 385–393. doi:10.1038/s41589-021-00962-9
Kholodenko, B. N. (2006). Cell-signalling dynamics in time and space. Nat. Rev. Mol. Cell Biol. 7, 165–176. doi:10.1038/nrm1838
Kim, D., Kwon, Y. K., and Cho, K. H. (2008). The biphasic behavior of incoherent feed-forward loops in biomolecular regulatory networks. BioEssays 30, 1204–1211. doi:10.1002/bies.20839
Lee, J., Na, H. K., Lee, S., and Kim, W. K. (2021). Advanced graphene oxide-based paper sensor for colorimetric detection of miRNA. Microchim. Acta 189, 35. doi:10.1007/s00604-021-05140-1
Lever, M., Lim, H. S., Kruger, P., Nguyen, J., Trendel, N., Abu-Shah, E., et al. (2016). Architecture of a minimal signaling pathway explains the T-cell response to a 1 million-fold variation in antigen affinity and dose. Proc. Natl. Acad. Sci. 113, E6630–E6638. doi:10.1073/pnas.1608820113
Li, Y., Zhou, L., Ni, W., Luo, Q., Zhu, C., and Wu, Y. (2019). Portable and field-ready detection of circulating MicroRNAs with paper-based bioluminescent sensing and isothermal amplification. Anal. Chem. 91, 14838–14841. doi:10.1021/acs.analchem.9b04422
Liang, K., Wang, H., Li, P., Zhu, Y., Liu, J., and Tang, B. (2020). Detection of microRNAs using toehold-initiated rolling circle amplification and fluorescence resonance energy transfer. Talanta 207, 120285. doi:10.1016/j.talanta.2019.120285
Lu, J., and Clark, A. G. (2012). Impact of microRNA regulation on variation in human gene expression. Genome Res. 22, 1243–1254. doi:10.1101/gr.132514.111
Ma, W., Trusina, A., El-Samad, H., Lim, W. A., and Tang, C. (2009). Defining network topologies that can achieve biochemical adaptation. Cell 138, 760–773. doi:10.1016/j.cell.2009.06.013
Machinek, R. R. F., Ouldridge, T. E., Haley, N. E. C., Bath, J., and Turberfield, A. J. (2014). Programmable energy landscapes for kinetic control of DNA strand displacement. Nat. Commun. 5, 5324. doi:10.1038/ncomms6324
Mangan, S., and Alon, U. (2003). Structure and function of the feed-forward loop network motif. Proc. Natl. Acad. Sci. 100, 11980–11985. doi:10.1073/pnas.2133841100
Marquez-Lago, T. T., and Stelling, J. (2010). Counter-intuitive stochastic behavior of simple gene circuits with negative feedback. Biophysical J. 98, 1742–1750. doi:10.1016/j.bpj.2010.01.018
Mavrotas, G. (2009). Effective implementation of the epsilon-constraint method in multi-objective mathematical programming problems. Appl. Math. Comput. 213, 455–465. doi:10.1016/j.amc.2009.03.037
Milo, R., Shen-Orr, S., Itzkovitz, S., Kashtan, N., Chklovskii, D., and Alon, U. (2002). Network motifs: simple building blocks of complex networks. Science 298, 824–827. doi:10.1126/science.298.5594.824
iGEM (2024). miRADAR: WUR 2024 iGEM. Available online at: 2024.igem.wiki/wageningenur/.
Nguyen, T. P. N., Kumar, M., Fedele, E., Bonanno, G., and Bonifacino, T. (2022). MicroRNA alteration, application as biomarkers, and therapeutic approaches in neurodegenerative diseases. Int. J. Mol. Sci. 23, 4718. doi:10.3390/ijms23094718
Otero-Muras, I., and Banga, J. R. (2016). Design principles of biological oscillators through optimization: forward and reverse analysis. PLOS ONE 11, e0166867. doi:10.1371/journal.pone.0166867
Otero-Muras, I., and Banga, J. R. (2017). Automated design framework for synthetic biology exploiting pareto optimality. ACS Synth. Biol. 6, 1180–1193. doi:10.1021/acssynbio.6b00306
Pieters, P. A., Nathalia, B. L., van der Linden, A. J., Yin, P., Kim, J., Huck, W. T. S., et al. (2021). Cell-free characterization of coherent feed-forward loop-based synthetic genetic circuits. ACS Synth. Biol. 10, 1406–1416. doi:10.1021/acssynbio.1c00024
Qian, L., and Winfree, E. (2011). Scaling up digital circuit computation with DNA strand displacement cascades. Science 332, 1196–1201. doi:10.1126/science.1200520
Rahman, A., Tiwari, A., Narula, J., and Hickling, T. (2018). Importance of feedback and feedforward loops to adaptive immune response modeling. CPT Pharmacometrics and Syst. Pharmacol. 7, 621–628. doi:10.1002/psp4.12352
Regev, K., Healy, B. C., Paul, A., Diaz-Cruz, C., Mazzola, M. A., Raheja, R., et al. (2018). Identification of MS-specific serum miRNAs in an international multicenter study. Neurology Neuroimmunol. and Neuroinflammation 5, e491. doi:10.1212/NXI.0000000000000491
Seelig, G., Soloveichik, D., Zhang, D. Y., and Winfree, E. (2006). Enzyme-free nucleic acid logic circuits. Science 314, 1585–1588. doi:10.1126/science.1132493
Serban, R., and Hindmarsh, A. C. (2005). “CVODES: the sensitivity-enabled ODE solver in SUNDIALS,” in Volume 6: 5Th international conference on multibody systems, nonlinear dynamics, and control, parts A, B, and C. Long Beach, California, USA: ASMEDC, 257–269. doi:10.1115/DETC2005-85597
Søndergaard, H. B., Hesse, D., Krakauer, M., Sørensen, P. S., and Sellebjerg, F. (2013). Differential microRNA expression in blood in multiple sclerosis. Multiple Scler. J. 19, 1849–1857. doi:10.1177/1352458513490542
Song, M., Pan, K., Su, H., Zhang, L., Ma, J., Li, J., et al. (2012). Identification of serum MicroRNAs as novel non-invasive biomarkers for early detection of gastric cancer. PLoS ONE 7, e33608. doi:10.1371/journal.pone.0033608
Stögbauer, T., Windhager, L., Zimmer, R., and Rädler, J. O. (2012). Experiment and mathematical modeling of gene expression dynamics in a cell-free system. Integr. Biol. 4, 494–501. doi:10.1039/c2ib00102k
Szekely, P., Sheftel, H., Mayo, A., and Alon, U. (2013). Evolutionary tradeoffs between economy and effectiveness in biological homeostasis systems. PLOS Comput. Biol. 9, e1003163. doi:10.1371/journal.pcbi.1003163
Taneda, A. (2015). Multi-objective optimization for RNA design with multiple target secondary structures. BMC Bioinforma. 16, 280. doi:10.1186/s12859-015-0706-x
Tullman, M. J. (2013). Overview of the epidemiology, diagnosis, and disease progression associated with multiple sclerosis. Am. J. Manag. Care, 19, 15–20.
Tyson, J. J., and Novák, B. (2010). Functional motifs in biochemical reaction networks. Annu. Rev. Phys. Chem. 61, 219–240. doi:10.1146/annurev.physchem.012809.103457
Ullner, E., Buceta, J., Díez-Noguera, A., and García-Ojalvo, J. (2009). Noise-induced coherence in multicellular circadian clocks. Biophysical J. 96, 3573–3581. doi:10.1016/j.bpj.2009.02.031
Walgrave, H., Zhou, L., De Strooper, B., and Salta, E. (2021). The promise of microRNA-based therapies in Alzheimer’s disease: challenges and perspectives. Mol. Neurodegener. 16, 76. doi:10.1186/s13024-021-00496-7
Wang, C., and Liu, H. (2022). Factors influencing degradation kinetics of mrnas and half-lives of micrornas, circrnas, lncrnas in blood in vitro using quantitative pcr. Sci. Rep. 12, 7259. doi:10.1038/s41598-022-11339-w
Wang, L., and Zhang, L. (2020). Circulating exosomal miRNA as diagnostic biomarkers of neurodegenerative diseases. Front. Mol. Neurosci. 13, 53. doi:10.3389/fnmol.2020.00053
Wang, Z. Y., Sun, M. H., Zhang, Q., Li, P. F., Wang, K., and Li, X. M. (2023). Advances in point-of-care testing of microRNAs based on portable instruments and visual detection. Biosensors 13, 747. doi:10.3390/bios13070747
Woods, M. L., Leon, M., Perez-Carrasco, R., and Barnes, C. P. (2016). A statistical approach reveals designs for the Most robust stochastic gene oscillators. ACS Synth. Biol. 5, 459–470. doi:10.1021/acssynbio.5b00179
Zhang, C., Tsoi, R., Wu, F., and You, L. (2016). Processing oscillatory signals by incoherent feedforward loops. PLOS Comput. Biol. 12, e1005101. doi:10.1371/journal.pcbi.1005101
Zhang, D. Y., and Seelig, G. (2011). Dynamic DNA nanotechnology using strand-displacement reactions. Nat. Chem. 3, 103–113. doi:10.1038/nchem.957
Zhang, D. Y., and Winfree, E. (2009). Control of DNA strand displacement kinetics using toehold exchange. J. Am. Chem. Soc. 131, 17303–17314. doi:10.1021/ja906987s
Zhang, Y., Xu, G., Lian, G., Luo, F., Xie, Q., Lin, Z., et al. (2020). Electrochemiluminescence biosensor for miRNA-21 based on toehold-mediated strand displacement amplification with Ru(phen)32+ loaded DNA nanoclews as signal tags. Biosens. Bioelectron. 147, 111789. doi:10.1016/j.bios.2019.111789
Keywords: feed-forward loops, toehold-mediated strand displacement, multi-objective optimisation, multiple sclerosis, miRNA, threshold detection, iGEM
Citation: Verkuijlen RJ and Smith RW (2025) A model-based design strategy to engineer miRNA-regulated detection systems. Front. Syst. Biol. 5:1601854. doi: 10.3389/fsysb.2025.1601854
Received: 28 March 2025; Accepted: 17 July 2025;
Published: 14 August 2025.
Edited by:
George P. Patrinos, University of Patras, GreeceReviewed by:
Saptarshi Sinha, University of California, San Diego, CA, United StatesSiyuan Wu, James Cook University, Australia
Copyright © 2025 Verkuijlen and Smith. This is an open-access article distributed under the terms of the Creative Commons Attribution License (CC BY). The use, distribution or reproduction in other forums is permitted, provided the original author(s) and the copyright owner(s) are credited and that the original publication in this journal is cited, in accordance with accepted academic practice. No use, distribution or reproduction is permitted which does not comply with these terms.
*Correspondence: Robert W. Smith, cm9iZXJ0MS5zbWl0aEB3dXIubmw=