 William Connacher1
 James Friend
- 1Medically Advanced Devices Laboratory, Department of Mechanical and Aerospace Engineering, Jacobs School of Engineering and Department of Surgery, School of Medicine, University of California San Diego, La Jolla, CA, United States
- 2Department of Mechanical and Aerospace Engineering, Jacobs School of Engineering, University of California San Diego, La Jolla, CA, United States
Introduction: It is now known that capillary waves driven upon a fluid interface by high frequency (
Methods: We use high-speed digital holographic microscopy to observe these capillary waves, an important step towards understanding their generation and atomization phenomena.
Results: We observe Zakharov-Kolmogorov weak wave turbulence for a limited range of input power, and find broader turbulence phenomena outside this range. We see discrete thresholds as the input power is increased, where higher and higher frequency responses are driven in the capillary waves with sudden onset between regimes.
Discussion: We employed spatial analysis to find extensions of the capillary wave response to higher frequencies, suggesting there is additional information in the spatial distribution of the capillary wave that is rarely if ever measured. We verified via frequency modulation that nonlinear resonance broadening is present, which undermines the use of Faraday wave or parametric wave theories to characterize these waves, important in the context of atomization which is now, definitively, not a Faraday wave process.
Introduction
Weakly nonlinear interactions between a large number of waves with random phase result in wave turbulence that is typically modeled with the well developed statistical theory, “weak” wave turbulence (WWT) (Newell and Rumpf, 2011). Ample experimental work has been done on wave turbulent systems including liquid surface waves (Falcón et al., 2009; Brazhnikov et al., 2002), plasmas (Robinson, 1996; Yoon, 2000), and solid plates (Boudaoud et al., 2008). Studies in this area frequently provide evidence in support of WWT theory. A fundamental result of WWT is the Zakharov-Kolmogorov (ZK) spectrum, which shows the power spectral density (PSD) of the waves has a power-law dependence upon the frequency (or wavenumber) over a conservative regime of the wave response. For liquid surface waves dominated by surface tension (i.e., capillary waves), the ZK spectrum is represented by
where
Recent studies have attempted to reconcile discrepancies between the idealized conditions of WWT and the results of experiments where these idealizations are routinely violated. Connaughton et al. (2001) put forward a simple model that explains how quasi-resonances in finite domain capillary wave systems cause deviations from the predictions of WWT. At low levels of nonlinearity, discrete resonances are not broad enough to permit energy to traverse the eigengrid spacing imposed by the bounded domain, and so the energy cascade typical of WWT is stunted. Falcon et al. (2007) observed that the frequency scalings in a gravity-capillary wave turbulence system are dependent on the input power. Falcon and Laroche (2011) observed that the depth of the liquid also has an impact on the capillary wave spectrum, causing it to deviate from a power law, but the mechanism remains unknown. Deike et al. (2014) measured the wave height spectrum with varying viscosity and showed in real systems that dissipation, indicated by a deviation in the linear spectral slope, occurs in the (theoretically energy conservative) inertial region, between energy injection and the dissipation zone. They propose a new way to measure energy flux in the system and use it to account for non-ideal dissipation. We have previously investigated the effect of increasing nonlinearity beyond what can be considered weak and also showed experimental evidence of finite domain effects (Orosco and Friend, 2023). In the current work, we investigate how energy traverses length scales in a capillary wave system with a data-driven approach, taking into account much smaller scales than have been previously studied.
We are primarily interested in milli to micro-scale capillary waves because of their connection to ultrasonic atomization phenomena. Vibration of a surface in contact with liquid in the kHz or MHz range above a threshold amplitude produces many small droplets, on the order of microns, from the liquid surface (Kurosawa et al., 1995; Collignon et al., 2018; Lang, 1962). In the kHz range, the size of the resulting droplets can be related to Faraday wave theory. Michael Faraday discovered the appearance of capillary waves upon a pool of mercury in a pie tin on a chair (Xvii, 1831). As he tapped the chair at a set frequency with his hand, the “crispations”—capillary waves—appeared to oscillate at one-half the frequency of his tapping. Many studies have explored Faraday capillary waves, producing a rich tapestry of mathematical analysis (Bosch and van de Water, 1993; Goodridge et al., 1999; Wagner et al., 1999; Zhang and Viñals, 1996) upon an ostensibly simple phenomena. Lang (1962) showed experimentally that using this Faraday wave assumption along with Kelvin’s equation relating frequency to wavelength yields a good estimate of the median droplet diameter,
Many of these classical conceptions break down in the context of MHz-order, high power ultrasonic atomization. A fundamental assumption of Faraday wave theory—that the excitation frequency is on the same order as the principal capillary wave frequency—fails at frequencies beyond the 100 kHz range. In these small sessile droplet systems, the first oscillations that appear are on the order of 100 Hz, three orders of magnitude lower than the excitation frequency. Moreover, one would expect to see a capillary wave response at one-half the excitation frequency for it to be a Faraday wave. It has been shown experimentally that no peak in the spectrum exists at or near one-half the MHz-order driving frequency (Blamey et al., 2013). In fact, a broadband spectrum wave, indicating WWT, develops on the surface at powers far below the threshold for atomization. In this context, Lang’s simple approach of deducing droplets from wavelengths becomes untenable because there is no single frequency at which capillary waves occur—they no longer appear in a uniform lattice. The actual droplet size distributions measured from MHz-order ultrasound have two and sometimes three peaks and often disagree with Lang’s equation (Collins et al., 2012; Barreras et al., 2002; Kooij et al., 2019; Winkler et al., 2015).
Recent work claims to have solved the problem of determining the droplet size distribution (Kooij et al., 2019); a Gamma function is fit to droplet size distributions demonstrating that they obey well studied corrugation and ligamentation processes found in sprays. This helps to explain the variation about the median that Lang could not explain. However, the Gamma function takes two parameters, the width of the ligament distribution and the ligament corrugation, so that the method has no predictive power but simply exchanges one unknown, the distribution of capillary waves, for another. The authors suggest that, because they measure two droplet size peaks, then there must be a bi-modal distribution of capillary wavelengths on the surface of the liquid. This makes intuitive sense based on a paradigm of Faraday waves and, without measuring waves directly, it is difficult to validate this suggestion. The difficulty associated with gaining direct knowledge of the waves in this context originates in the time and space scales of the waves, which are much smaller and faster than most modern experimental equipment can reliably observe.
Methods
Overview
In the current work, we study capillary waves experimentally at micro-length and time scales. Our system is a millimeter length, microliter volume of water that completely insulates capillary wave phenomena from the effects of gravity while also clearly expressing finite domain effects. We drive the system using high frequency (
We first apply standard, single-point time series analysis to this data to obtain standard amplitude spectra. We then analyze the broader spatial data using techniques that complement and improve upon the results of single-point time series analysis. Berhanu and Falcon (2013) were the first to use this type of data although they were limited to larger length and time scales. They showed that linear and nonlinear dispersion relations extracted from their data matched WWT theories using spatial and temporal Fourier methods. Another commonly used spatial technique is modal analysis using eigenfunction decomposition. The aim is to reveal coherent structures that may not be best represented by sinusoids or wavelets (Taira et al., 2017). Proper orthogonal decompositions (POD) produce independent spatial modes optimized by energy with no requirement set on time behavior and have been used extensively in turbulence studies (Berkooz et al., 1993; Rovira et al., 2021). We will show that standard modal analyses do not reveal coherent structures in our system. However, they successfully quantify energy shifts across length scales. It is well known that isotropic turbulent systems have POD modes that reduce to a Fourier basis (Taira et al., 2017; Schmidt and Colonius, 2020). As will be shown, the POD modes of our system are indeed closely related to 2D sinusoidal gratings. This detail allows us to attach a well-defined length scale to each mode. Using this approach, we track how energy flows across length scales as a function of power input.
Experimental setup
Our system consists of a sessile drop of water on a thickness-mode
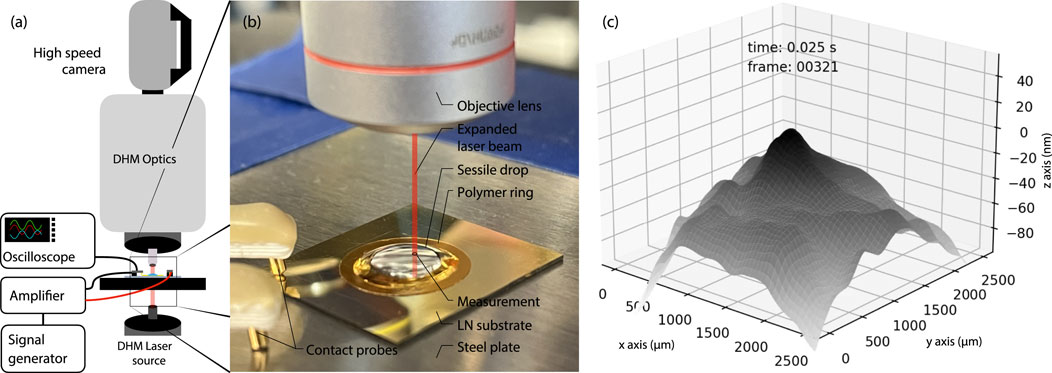
Figure 1. A schematic of our experimental setup incorporating a (A) high-speed digital holographic microscope (DHM) with a (B) sessile droplet placed upon a single-crystal lithium niobate thickness-mode ultrasound resonator. The droplet is placed directly over a transparent “window” in the lithium niobate substrate with a gold electrode on both sides everywhere else. An expanded laser propagates from below through the droplet and into the DHM to produce a holographic image captured by the high-speed camera to then produce a (C) height map over the measurement region (indicated in (b) as Measurement). For scale in (B), the lithium niobate resonator is a
A 200
The resonator was driven directly with a signal generator (WF1946, NF Corporation, Yokohama, Japan), except for the highest power data set which used a linear 10 W amplifier (210L, E&I, Rochester, NY, United States). The signal passed to the resonator was a continuous, fixed amplitude, single frequency sine wave at the fundamental resonance frequency of the thickness mode device. The resonator was placed upon a 1 mm thick,
Digital holographic microscopy
We measured the surface displacement in time using a customized digital transmission holographic microscope (DHM, LynceéTec, Lausanne, Switzerland) coupled to an ultra high speed camera (NOVA S12, Photron, San Diego, CA, United States). In this approach, laser light, with a wavelength of 660 nm, is split into a sample and a reference beam. The sample beam passes through the window in the resonator and the sessile drop and is then combined with the reference beam to form a phase image and an intensity image at the camera. The phase delay caused by passing through varying distances of water produces a two-dimensional map of the change in the height of the water surface. The measurable change is up to one wavelength of light without post-processing. However, if the height change is sufficiently smooth and gradual, the phase jumps caused by height changes greater than the wavelength of light can be unwrapped to still produce accurate measurements of the fluid interface’s deflection. The height resolution of the system is on the order of 10 nm. We refer the reader to Cuche et al. (1999) for details on the DHM technology. We used a ×10 objective lens and recorded at 115,200 frames per second with a
Time-series analysis
In order to obtain the power spectrum, we extracted the data describing the transverse displacement of the central pixel and performed Welch’s method (Welch, 1967) with blocks of
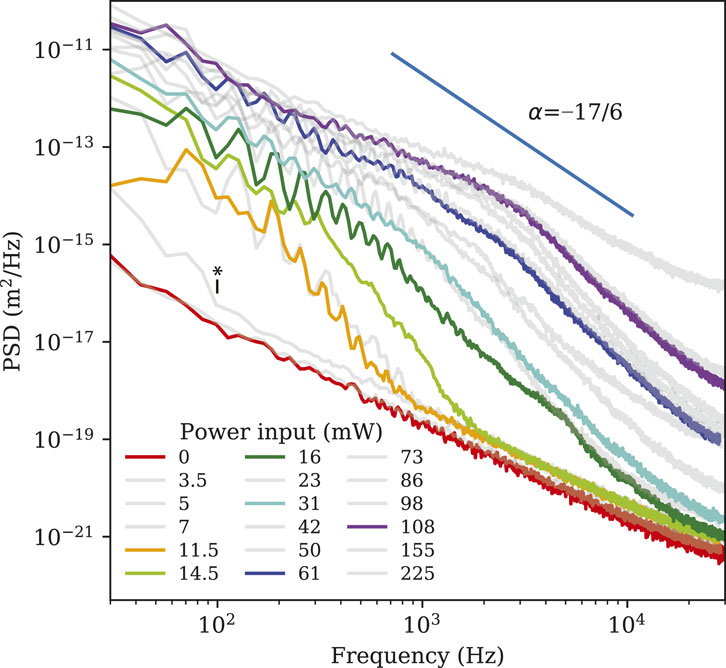
Figure 2. Power spectral density of the interfacial displacement plotted with respect to the frequency for a single point on the fluid interface at 7 MHz excitation. Note the red line indicates no input power, representing the noise floor with our measurement method. As the input power is increased, the appearance of capillary wave oscillations is apparent at about 5–7 mW, and progressive expansion of the cascade to higher frequencies is clear as the power is increased from 14.5 mW to 225 mW. The modal character of the capillary waves is lost from apparent frequency broadening at about 61 mW. The observed spectral slopes are generally lower than the theoretical value of
Spatial mode analysis
Looking beyond the information that can be gleaned from observation of a single point on the fluid interface over time, we next consider the entire field of view and seek to determine how the fluid interface evolves over time and space as the input power is changed. We use the machinery of proper orthogonal decomposition (POD) to support this effort (Berkooz et al., 1993; Rovira et al., 2021).
When computing the POD modes and singular values, we selected
As has been seen in numerical simulations by Pushkarev and Zakharov, the finite domain in our system fails to produce a cascade at low power inputs where the nonlinearity is very weak (Pushkarev and Zakharov, 1996). Based on the model from Connaughton et al. (2001), there are multiple thresholds of resonance broadening and therefore of nonlinearity, all driven by power input. The definition of these thresholds in the context of capillary wave turbulence is considered at length in our previous work (Orosco and Friend, 2023). At each of these thresholds, the cascade increases in length towards larger wavenumbers, consistent with experimental observations of the cascade growing to higher frequencies with increases in input power (Blamey et al., 2013). It seems clear from their work that the specific thresholds for a given system depends on the spacing of the quasi-resonances and the relationship between forcing and broadening.
Results
Time-series analysis
The amplitude spectra in Figure 2 clearly show a consistent peak at around 30 Hz with harmonics except for the 0 and 5 mW results. The 0 mW data indicates the noise floor of our measurement system, a combination of shot noise in the measurement system and thermal excitation of the fluid interface. At 3.5, 5, and 7 mW, our system is highly intermittent, which explains why the 5 mW line is not separated from the 0 mW line. Up to 11.5 mW the capillary wave energy remains confined to frequencies below 100 Hz as indicated with the asterisk in the plot. As the power is increased to 14.5 mW there is a broadening of the harmonics and the beginning of a broadband response that extends the cascade to 200 Hz. At 16 mW the cascade abruptly extends to about 10 kHz, and continues to extend upward in frequency beyond our DHM’s measurement range from 31 mW and up. These characteristics seem to support Connaghton’s model of finite domain, “frozen” turbulence (Connaughton et al., 2001).
The predicted value of
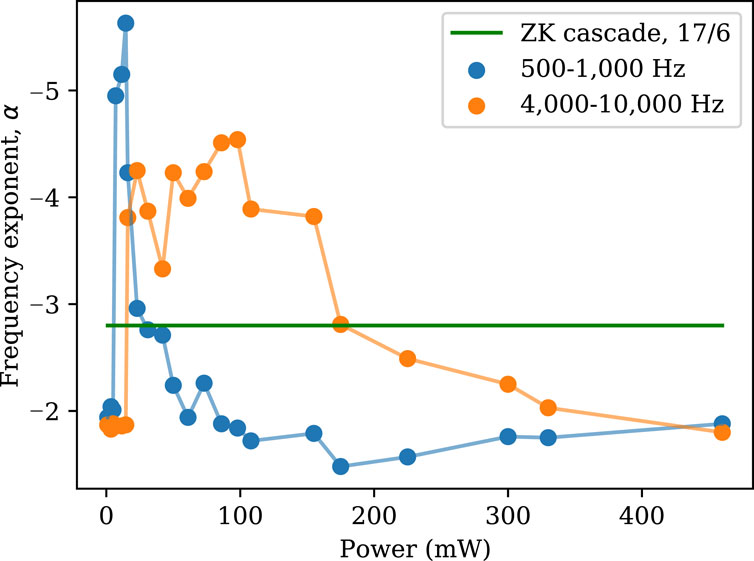
Figure 3. The frequency exponent of the wave height spectra, plotted here as average values determined from the slope of the spectra over the ranges 500–1,000 Hz and 4–10 kHz, rarely coincides with the ZK prediction of
We also observe frequency broadening of the low frequency modes as the power is increased from 16 to 108 mW, in concert with the growth of the high frequency portion of the cascade. The broadening of peaks with increased input power again supports Connaghton’s finite domain nonlinear resonance broadening model. Increased nonlinear interactions among discrete resonances allow energy to move down the cascade more easily and may explain faster growth at high frequency.Notably, we do not see any distinct resonance peaks above 100 Hz at the highest power. This power is well below the threshold of atomization onset for this system, so the presence of capillary waves at a certain frequency seems not to foreshadow the peaks of a droplet size distribution in this system as was suggested by Kooij et al. (2019).
To further explore this issue, we then sought to explicitly modulate the input signal at 5 kHz in an attempt to drive the appearance of a dominant capillary wave at this modulation frequency. At the relatively low power of 53 mW with the sinusoidal modulation of the input frequency, the modulation frequency does appear in the capillary wave with a corresponding strong response peak in Figure 4A, along with three harmonics up to about 20 kHz. As we increase the power to 100 mW, still well below the atomization threshold, the 5 kHz amplitude peak is still strong but broader while the harmonics are much less prominent. Increasing the power to 155 mW further broadens the 5 kHz peak with reduction in its maximum amplitude of about 50%; the harmonics are completely absent. Increasing the power beyond the measurement capabilities of the DHM to drive atomization at 500 mW, we found that there is no observable difference between the droplet size distribution for the atomized droplets whether or not the 5 kHz modulation is present, as determined using laser diffraction droplet sizing (Spraytec, Malvern Panalytical, Malvern, United Kingdom) and plotted in Figure 4B. This also implies that the input frequency of the excitation, whether 7 MHz or another frequency, is unlikely to affect the capillary wave distribution at the fluid interface—and consequently the droplets that may arise from it if atomization occurs.
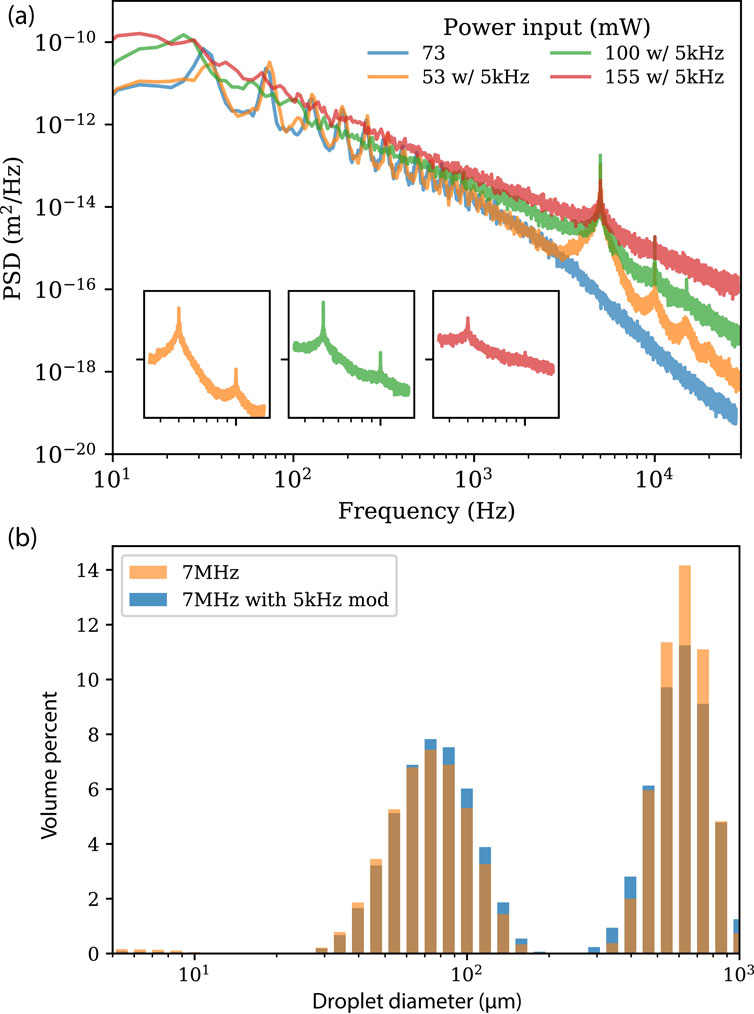
Figure 4. The effect of using 5 kHz modulation of the 7 MHz input signal upon the (A) capillary wave spectrum. At low amplitudes, the effect of the modulation is significant: compare 73 mW without modulation and 53 mW with modulation, and note how the response is significantly perturbed at 5 kHz. At greater amplitudes, the nonlinear resonance broadening appears to reduce the amplitude of the 5 kHz peak: compare 155 mW to the 100 mW data, both with the 5 kHz modulation. These input powers are well below what is required for atomization, and there is (B) no significant difference between the droplet sizes that are generated from atomization at 500 mW through the use of signal modulation at 5 kHz.
Spatial mode analysis
We now consider what information we may glean from the data by looking at the entire field of view of the fluid interface, seeking to determine how the interface spatiotemporally deforms as the input power is changed. Figure 5 provides the principal component analysis results for the surface deformation from a 16 mW data set; the interfacial data at other power levels were similar. The modes greater than 475 in each data set were discarded based on the appearance of a prominent corner in the singular value distribution at or below this mode number (see Figure 5), suggesting the modes above 475 play little to no role in defining the displacement of the fluid interface.
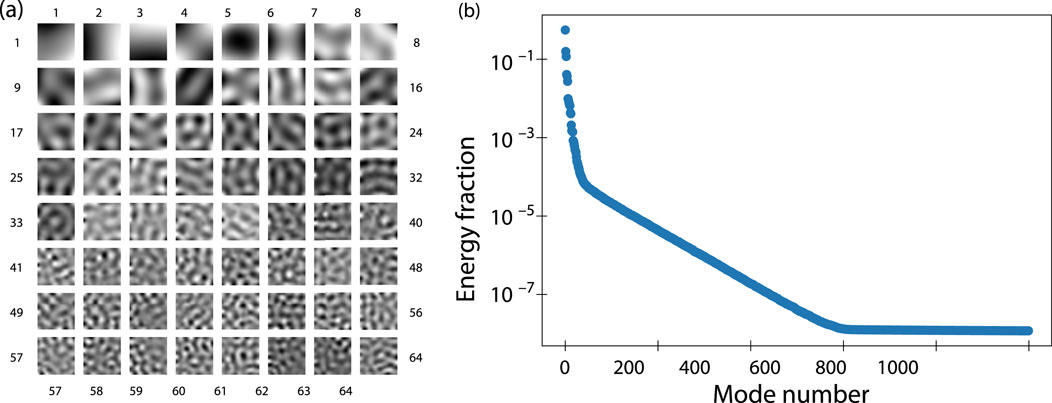
Figure 5. An example of the results from principal component analysis, showing (A) the first 64 modes for the interfacial displacement from the 16 mW data set. The distribution of the singular value amplitudes in terms of the fraction of the total energy each mode possesses is (B) plotted with respect to the mode number; in this case the vast majority of the response is in the first
The first 64 POD modes are plotted in Figure 5. The characteristic length scale clearly decreases with increasing mode number as seen from Figure 5A. For the wavelength range where the field of view offers sufficient resolution (
In this way, we were able to obtain the relationship between wavelength and mode number in Figure 6 for the capillary waves in this system at each input power. This allows us to plot the singular values for each mode, which are equal to wave amplitudes as we described earlier, against their respective length scale in Figure 7. Energy is clearly restricted to length scales greater than 500
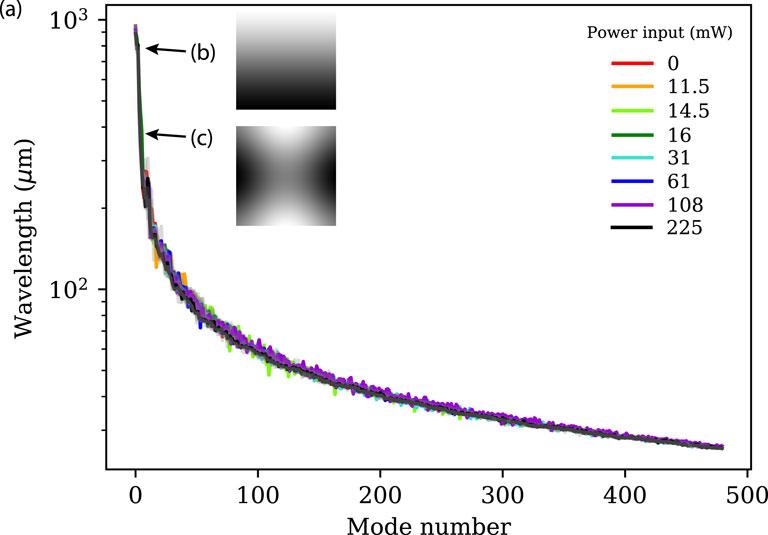
Figure 6. The computed wavelength for each mode found via 2DFFT of the principal component analysis results is plotted with respect to mode number. The largest measurable modes have a wavelength twice the field of view. (B) Mode 2, essentially a 800
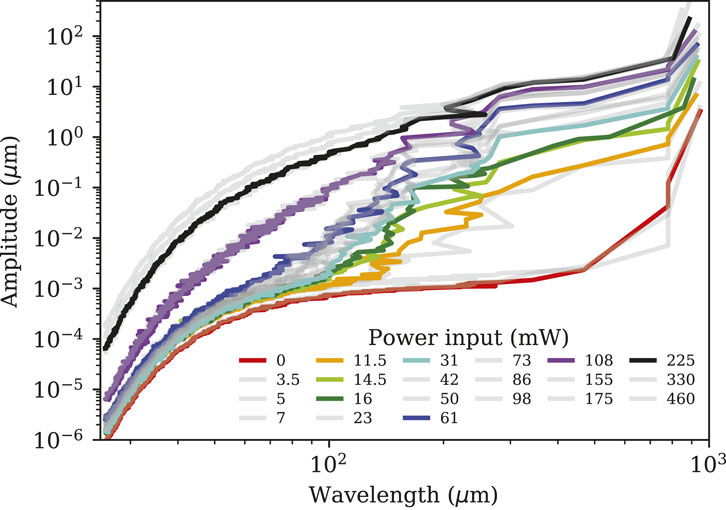
Figure 7. Singular values scaled by the number of frames from POD plotted against the wavelength obtained by performing a 2DFFT algorithm on each mode. This is the same plot as Figure 5C), but with the y-axis scaled to be amplitude and with the x-axis transformed from mode to wavelength.
In order to understand if modes of the same number between data sets are related, we took the covariance between the
where
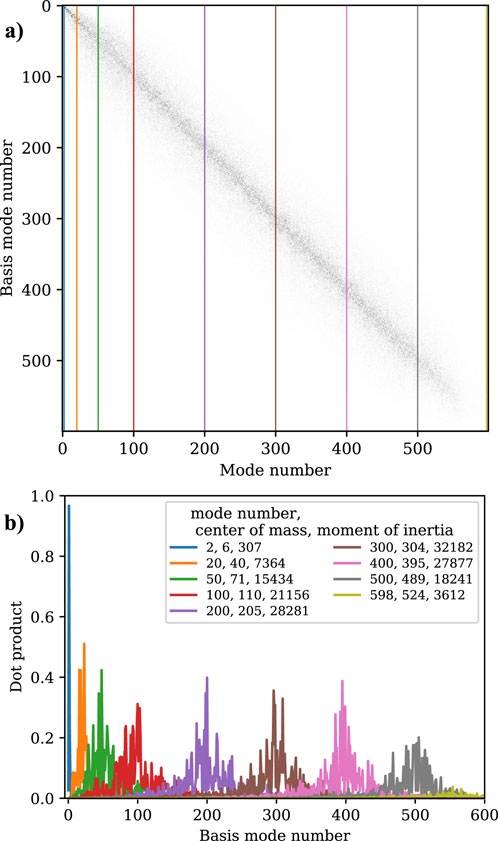
Figure 8. To determine the broadening of the capillary wave modes, we plot the (A) covariance of the 61-mW input power case with respect to the original mode numbers. If there were no broadening of the responses, this would be a diagonal line from upper left to lower right. Instead, it spreads laterally but remains locally distributed as nearly diagonal, indicating that broadening does indeed occur but there are no apparent sub- or super-harmonic parametric resonant cascades across significantly different wavelength scales. The (A) colored vertical lines in the plot are next (B) plotted showing the amplitude of the product of the chosen mode with the basis mode.
The variance is a convenient way to show that the modes identified by POD are essentially common between different data sets, not merely just their length scale. They also quantify how the modes themselves change with power input—setting aside the singular values, which rank the amplitudes of the modes within a data set at a single power. We plot the deviation of the first and second moments for each mode of every data set in Figure 9. The first three lines (in red) have a similar shape, but then suddenly the 7 mW line is different, which aligns with the sudden changes in both Figures 2, 7. The way this shape changes indicates that the modes around the 20th mode are interacting with a much larger number of adjacent modes than they were at only a slightly lower power.
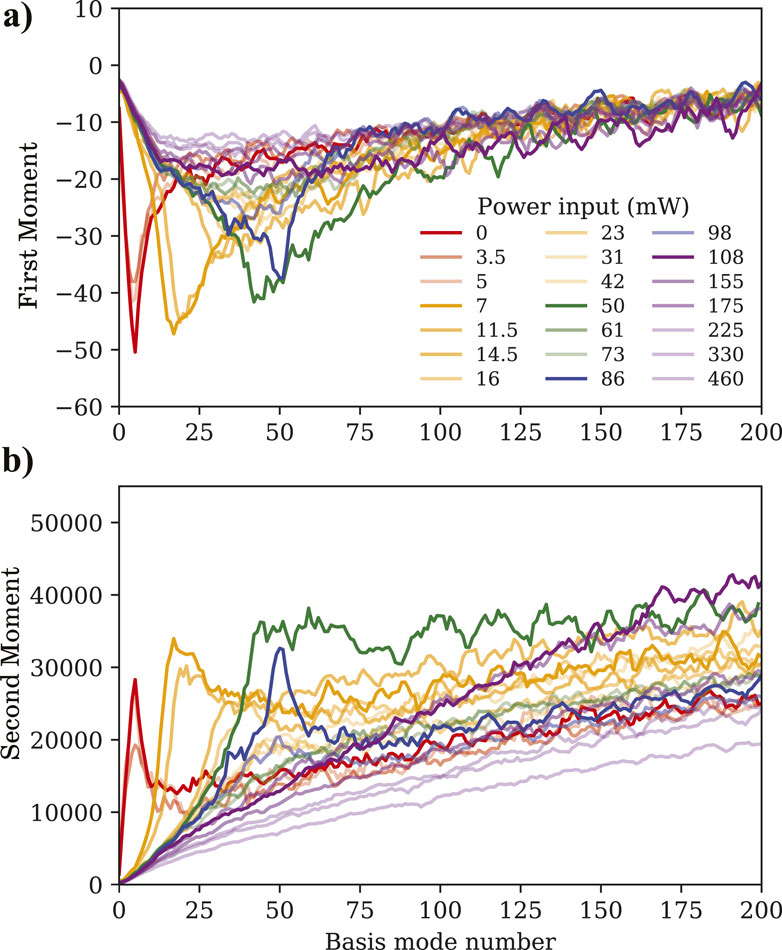
Figure 9. (A) First and (B) second moments versus basis mode number as a proxy for the wavelength. Recall that the modes are sequentially ordered from largest wavelength to smallest.
The fact that the cross-sections in Figure 8 are distributed generally around their corresponding basis mode is an expression of local wave interaction. When the power crosses some threshold near 6 mW, the modes near 20 suddenly become less localized and interact with modes possessing wavelength scales of greater difference. As power increases from 7 to 42 mW the moment lines gradually move towards the zero power line, indicating that the modes interact more locally and they are more closely described by the corresponding basis modes.
Once again, however, at 50 mW the modes beyond mode 45 become de-localized, but again move towards the zero power lines at slightly larger powers. This process repeats from 86 mW for modes near the 50th mode. The final de-localization apparent in the data is centered closer to the
Conclusion
Fourier analysis often used in wave turbulence problems identifies the relationship between wave height and frequency for micro-scale capillary waves in a small sessile droplet. The effects of the finite sized droplet produce frozen turbulence and low frequency (relative to the high-speed DHM measurement capabilities) repeated and abrupt cascade extension at specific input powers. Immediately upon cascade completion we see a small region of capillary wave dynamics that correspond to the classic ZK theory of WWT where
Spatial analysis with POD provides us with a direct link between amplitude and wavelength. Energy flowing towards smaller length scales exhibits a nonlinear dependence upon the input power, with discrete thresholds repeatedly appearing as the power is increased. These shifts are analogous to cascade extension, most of which are observable using standard Fourier analysis. However, spatial analysis allows us to identify a small scale, high frequency cascade extension that was not apparent with Fourier analysis. The covariance between each data set and the basis modes provides us with information about how coherent modes change with power input. We are able to identify de-localization events where waves interact with wavelengths of greater difference as the power is increased.
Uniform Faraday waves are a poor model for capillary wave dynamics in this system, and therefore are unlikely to be appropriate for predicting atomization which requires greater power. Resonant peaks in the capillary wave response are quickly broadened by the nonlinear coupling, even when the input signal is modulated to force the resonance into existence. This occurs at input power levels well below the atomization threshold, and it remains unclear how to predict which wavelengths will be preferentially amplified—if any—in order to form droplets at a larger power input. A theory of wave turbulence beyond the weak and infinite regimes dictated by WWT are therefore needed to predict which waves will produce droplets in high frequency ultrasound atomization systems. Such systems are potentially beneficial in a wide range of applications, from pulmonary vaccination (Rajapaksa et al., 2014) to hospital disinfection (Kumaraswamy et al., 2018), fuel (Brown et al., 2024) and paint (Dalili et al., 2020) sprays, and particle production (Alvarez et al., 2008). Crucially, the identification of droplet sizes and flow rates in the process of designing these devices hinges on an understanding of the underlying mechanism. Whatever that mechanism is, it is certainly a strongly nonlinear one, complicating the process of modeling it.
Data availability statement
The raw data supporting the conclusions of this article will be made available by the authors, without undue reservation.
Author contributions
WC: Conceptualization, Data curation, Formal Analysis, Investigation, Software, Visualization, Writing–original draft, Writing–review and editing. JO: Conceptualization, Data curation, Investigation, Methodology, Software, Supervision, Validation, Writing–original draft, Writing–review and editing. OS: Investigation, Methodology, Validation, Writing–review and editing. JF: Conceptualization, Funding acquisition, Investigation, Methodology, Project administration, Resources, Supervision, Writing–review and editing.
Funding
The author(s) declare that financial support was received for the research, authorship, and/or publication of this article. We are grateful to the Office of Naval Research, United States (grants 13423461 and 12368098) and the W. M. Keck Foundation, United States for funding provided to JF in support of this work. JO is grateful for support provided by the University of California’s Presidential Postdoctoral Fellowship program. We are also grateful to Yves Emery and team at LynceéTec for assistance with adapting the DHM to this project’s needs. Fabrication was performed in part at the San Diego Nanotechnology Infrastructure (SDNI) of UCSD, a member of the National Nanotechnology Coordinated Infrastructure, which is supported by the National Science Foundation (Grant ECCS–1542148).
Conflict of interest
The authors declare that the research was conducted in the absence of any commercial or financial relationships that could be construed as a potential conflict of interest.
The author(s) declared that they were an editorial board member of Frontiers, at the time of submission. This had no impact on the peer review process and the final decision.
Generative AI statement
The author(s) declare that no Generative AI was used in the creation of this manuscript.
Publisher’s note
All claims expressed in this article are solely those of the authors and do not necessarily represent those of their affiliated organizations, or those of the publisher, the editors and the reviewers. Any product that may be evaluated in this article, or claim that may be made by its manufacturer, is not guaranteed or endorsed by the publisher.
References
Alvarez, M., Yeo, L., and Friend, J. (2008). Rapid generation of protein aerosols and nanoparticles via surface acoustic wave atomization. Nanotechnology 19, 455103. doi:10.1088/0957-4484/19/45/455103
Aubourg, Q., and Mordant, N. (2016). Investigation of resonances in gravity-capillary wave turbulence. Phys. Rev. Fluids 1, 023701. doi:10.1103/PhysRevFluids.1.023701
Barreras, F., Amaveda, H., and Lozano, A. (2002). Transient high-frequency ultrasonic water atomization. Exp. Fluids 33, 405–413. doi:10.1007/s00348-002-0456-1
Berhanu, M., and Falcon, E. (2013). Space-time-resolved capillary wave turbulence. Phys. Rev. E 87, 033003. doi:10.1103/PhysRevE.87.033003
Berkooz, G., Holmes, P., and Lumley, J. L. (1993). The proper orthogonal decomposition in the analysis of turbulent flows. Annu. Rev. Fluid Mech. 25, 539–575. doi:10.1146/annurev.fluid.25.1.539
Blamey, J., Yeo, L. Y., and Friend, J. R. (2013). Microscale capillary wave turbulence excited by high frequency vibration. Langmuir 29, 3835–3845. doi:10.1021/la304608a
Bosch, E., and van de Water, W. (1993). Spatiotemporal intermittency in the faraday experiment. Phys. Rev. Lett. 70, 3420–3423. doi:10.1103/PhysRevLett.70.3420
Boudaoud, A., Cadot, O., Odille, B., and Touzé, C. (2008). Observation of wave turbulence in vibrating plates. Phys. Rev. Lett. 100, 234504. doi:10.1103/PhysRevLett.100.234504
Brazhnikov, M. Y., Kolmakov, G. V., Levchenko, A. A., and Mezhov-Deglin, L. P. (2002). Observation of capillary turbulence on the water surface in a wide range of frequencies. Europhys. Lett. (EPL) 58, 510–516. doi:10.1209/epl/i2002-00425-9
Brown, T., Hytovick, R., Berson, J., Burke, R., Salauddin, S., and Ahmed, K. (2024). Dynamics of mono-size aerosolized liquid fuel detonations. Proc. Combust. Inst. 40, 105416. doi:10.1016/j.proci.2024.105416
Collignon, S., Manor, O., and Friend, J. (2018). Improving and predicting fluid atomization via hysteresis-free thickness vibration of lithium niobate. Adv. Funct. Mater. 28, 1704359. doi:10.1002/adfm.201704359
Collins, D. J., Manor, O., Winkler, A., Schmidt, H., Friend, J. R., and Yeo, L. Y. (2012). Atomization off thin water films generated by high-frequency substrate wave vibrations. Phys. Rev. E 86, 056312. doi:10.1103/PhysRevE.86.056312
Connaughton, C., Nazarenko, S., and Pushkarev, A. (2001). Discreteness and quasiresonances in weak turbulence of capillary waves. Phys. Rev. E 63, 046306. doi:10.1103/physreve.63.046306
Cuche, E., Marquet, P., and Depeursinge, C. (1999). Simultaneous amplitude-contrast and quantitative phase-contrast microscopy by numerical reconstruction of Fresnel off-axis holograms. Appl. Opt. 38, 6994. doi:10.1364/AO.38.006994
Dalili, A., Sidawi, K., and Chandra, S. (2020). Surface coverage by impact of droplets from a monodisperse spray. J. Coatings Technol. Res. 17, 207–217. doi:10.1007/s11998-019-00258-7
Deike, L., Berhanu, M., and Falcon, E. (2014). Energy flux measurement from the dissipated energy in capillary wave turbulence. Phys. Rev. E 89, 023003. doi:10.1103/PhysRevE.89.023003
Emery, Y., Colomb, T., and Cuche, E. (2021). Metrology applications using off-axis digital holography microscopy. J. Phys. Photonics 3, 034016. doi:10.1088/2515-7647/ac0957
Falcón, C., Falcon, E., Bortolozzo, U., and Fauve, S. (2009). Capillary wave turbulence on a spherical fluid surface in low gravity. Eur. Phys. Lett. 86, 14002. doi:10.1209/0295-5075/86/14002
Falcon, E., and Laroche, C. (2011). Observation of depth-induced properties in wave turbulence on the surface of a fluid. EPL Europhys. Lett. 95, 34003. doi:10.1209/0295-5075/95/34003
Falcon, É., Laroche, C., and Fauve, S. (2007). Observation of gravity-capillary wave turbulence. Phys. Rev. Lett. 98, 094503. doi:10.1103/physrevlett.98.094503
Goodridge, C. L., Hentschel, H. G. E., and Lathrop, D. P. (1999). Breaking faraday waves: critical slowing of droplet ejection rates. Phys. Rev. Lett. 82, 3062–3065. doi:10.1103/PhysRevLett.82.3062
Kooij, S., Astefanei, A., Corthals, G. L., and Bonn, D. (2019). Size distributions of droplets produced by ultrasonic nebulizers. Sci. Rep. 9, 6128. doi:10.1038/s41598-019-42599-8
Kumaraswamy, M., Collignon, S., Do, C., Kim, J., Nizet, V., and Friend, J. (2018). Decontaminating surfaces with atomized disinfectants generated by a novel thickness-mode lithium niobate device. Appl. Microbiol. Biotechnol. 15, 6459–6467. doi:10.1007/s00253-018-9088-0
Kurosawa, M., Futami, A., and Higuchi, T. (1997). Characteristics of liquids atomization using surface acoustic wave. Proc. Int. Solid State Sensors Actuators Conf. 2, 801–804. doi:10.1109/SENSOR.1997.635221
Kurosawa, M., Watanabe, T., Futami, A., and Higuchi, T. (1995). Surface acoustic wave atomizer. Sensors Actuators A Phys. 50, 69–74. doi:10.1016/0924-4247(96)80086-0
Lang, R. J. (1962). Ultrasonic atomization of liquids. J. Acoust. Soc. Am. 34, 6–8. doi:10.1121/1.1909020
Manor, O., Dentry, M., Friend, J. R., and Yeo, L. Y. (2011). Substrate dependent drop deformation and wetting under high frequency vibration. Soft Matter 7, 7976–7979. doi:10.1039/c1sm06054f
Mei, J., Zhang, N., and Friend, J. (2020). Fabrication of surface acoustic wave devices on lithium niobate. J. Vis. Exp. 160, e61013. doi:10.3791/61013
Newell, A. C., and Rumpf, B. (2011). Wave turbulence. Annu. Rev. Fluid Mech. 43, 59–78. doi:10.1146/annurev-fluid-122109-160807
Orosco, J., and Friend, J. (2023). Identification of weakly to strongly-turbulent three-wave processes in a micro-scale system. Chaos. Solit. Fractals 172, 1–7.
Pushkarev, A. N., and Zakharov, V. E. (1996). Turbulence of capillary waves. Phys. Rev. Lett. 76, 3320–3323. doi:10.1103/PhysRevLett.76.3320
Qi, A., Yeo, L. Y., and Friend, J. R. (2008). Interfacial destabilization and atomization driven by surface acoustic waves. Phys. Fluids 20, 074103. doi:10.1063/1.2953537
Rajan, R., and Pandit, A. (2001). Correlations to predict droplet size in ultrasonic atomisation. Ultrasonics 39, 235–255. doi:10.1016/s0041-624x(01)00054-3
Rajapaksa, A. E., Ho, J. J., Qi, A., Bischof, R., Nguyen, T. H., Tate, M., et al. (2014). Effective pulmonary delivery of an aerosolized plasmid DNA vaccine via surface acoustic wave nebulization. Respir. Res. 15, 60–12. doi:10.1186/1465-9921-15-60
Ramisetty, K. A., Pandit, A. B., and Gogate, P. R. (2013). Investigations into ultrasound induced atomization. Ultrason. Sonochemistry 20, 254–264. doi:10.1016/j.ultsonch.2012.05.001
Robinson, P. A. (1996). Scalings, spectra, and statistics of strong wave turbulence. Phys. Plasmas 3, 192–201. doi:10.1063/1.871845
Rovira, M., Engvall, K., and Duwig, C. (2021). Proper orthogonal decomposition analysis of the large-scale dynamics of a round turbulent jet in counterflow. Phys. Rev. Fluids 6, 014701. doi:10.1103/PhysRevFluids.6.014701
Schmidt, O. T., and Colonius, T. (2020). Guide to spectral proper orthogonal decomposition. AIAA J. 58, 1023–1033. doi:10.2514/1.J058809
Shannon, C. (1949). Communication in the presence of noise. Proc. IRE 37, 10–21. doi:10.1109/JRPROC.1949.232969
Taira, K., Brunton, S. L., Dawson, S. T. M., Rowley, C. W., Colonius, T., McKeon, B. J., et al. (2017). Modal analysis of fluid flows: an overview. AIAA J. 55, 4013–4041. doi:10.2514/1.J056060
Wagner, C., Müller, H. W., and Knorr, K. (1999). Faraday waves on a viscoelastic liquid. Phys. Rev. Lett. 83, 308–311. doi:10.1103/PhysRevLett.83.308
Welch, P. (1967). The use of fast Fourier transform for the estimation of power spectra: a method based on time averaging over short, modified periodograms. IEEE Trans. Audio Electroacoustics 15, 70–73. doi:10.1109/TAU.1967.1161901
Winkler, A., Harazim, S. M., Menzel, S. B., and Schmidt, H. (2015). SAW-based fluid atomization using mass-producible chip devices. Lab a Chip 15, 3793–3799. doi:10.1039/C5LC00756A
Wright, W. B., Budakian, R., and Putterman, S. J. (1996). Diffusing light photography of fully developed isotropic ripple turbulence. Phys. Rev. Lett. 76, 4528–4531. doi:10.1103/physrevlett.76.4528
Xvii, F. M. (1831). On a peculiar class of acoustical figures; and on certain forms assumed by groups of particles upon vibrating elastic surfaces. Philosophical Trans. R. Soc. Lond., 299–340.
Yoon, P. H. (2000). Generalized weak turbulence theory. Phys. Plasmas 7, 4858–4871. doi:10.1063/1.1318358
Zakharov, V. E., and Filonenko, N. N. (1971). Weak turbulence of capillary waves. J. Appl. Mech. Tech. Phys. 8, 37–40. doi:10.1007/BF00915178
Zakharov, V. E., L’vov, V. S., and Falkovich, G. (1992). Kolmogorov spectra of turbulence I in Springer series in nonlinear dynamics. Berlin, Heidelberg: Springer Berlin Heidelberg. doi:10.1007/978-3-642-50052-7
Zhang, S., Orosco, J., and Friend, J. (2021). Onset of low-frequency capillary waves driven by high-frequency ultrasound. ArXiv:2108.09579.
Keywords: acoustofluidics, capillary waves, capillary wave turbulence, zakharov-kolmogorov turbulence, nonlinear resonance broadening, faraday waves, atomization
Citation: Connacher W, Orosco J, Schmidt OT and Friend J (2024) Direct observation of small scale capillary wave turbulence using high speed digital holographic microscopy. Front. Acoust. 2:1512579. doi: 10.3389/facou.2024.1512579
Received: 16 October 2024; Accepted: 09 December 2024;
Published: 20 December 2024.
Edited by:
Kenjiro Takemura, Keio University, JapanReviewed by:
Hyungsuk Lee, Yonsei University, Republic of KoreaXianchen Xu, Duke University, United States
Copyright © 2024 Connacher, Orosco, Schmidt and Friend. This is an open-access article distributed under the terms of the Creative Commons Attribution License (CC BY). The use, distribution or reproduction in other forums is permitted, provided the original author(s) and the copyright owner(s) are credited and that the original publication in this journal is cited, in accordance with accepted academic practice. No use, distribution or reproduction is permitted which does not comply with these terms.
*Correspondence: James Friend, amZyaWVuZEB1Y3NkLmVkdQ==